Abstract
Many countries, including Indonesia, have abundant renewable energy sources (RES), but the share of RES in the current national energy supply is still insignificant. The study aimed to investigate and provide the most feasible combinations of RES that meet domestic electricity demand. For Java and Bali, Indonesia, initially, 35 scenarios, given 4 primary RES (solar, wind, hydropower, geothermal) and municipal solid waste, were assessed based on economic and environmental indicators. This explorative data-driven study found that the existing capacity could only meet 51% of the electricity demand. However, the proposed energy mixes could cover 100% of the electricity demand in 2020 with a required capacity of 8.32–19.10 GW, varying on each scenario. The feasible energy mixes can reduce CO2 emissions by 90–94% compared to a fossil energy mix with gas-fired power plants. The installation, and operation and maintenance costs per life cycle can range from 29–50 and 4–16 billion dollars. The wind-based energy mix, with installed capacities of geothermal (1.16 GW), hydropower (2.87 GW), solar (0.003 GW) and municipal solid waste (0.18 GW) in 2020, showed the highest return on investment (139% ROI) and smallest CO2 emission with highest CO2 reduction (94%). This study provides a scientific method of selecting, projecting, and evaluating viable RES combinations for generating electricity without using fossil fuels.
1. Introduction
The Paris Agreement has motivated many countries, including Indonesia, to alter their energy policies for decarbonization. Renewable energy sources can significantly reduce global greenhouse gas emissions [1]. It will be the critical strategy for sustainable energy generation [2], which supports the 7th sustainable development goal (SDG) of The United Nations: affordable and clean energy. Therefore, the Ministry of Energy and Mineral Resource (ESDM) of the Indonesian government wants to increase the share of energy generated from renewable energy sources (RES) to 23% and 31% sustainable energy supply in 2025 and 2030, respectively [3].
However, these targets are currently still far from being reached. The primary energy supply in 2020 was 2538 TWh, but only 14.45% thereof was produced from renewables (see Table 1) [4]. Coal was dominant among the other sources, with 37.09%. Also, the second and third contributors to the national supply were still fossil, namely, oil (31.65%) and gas (16.82%). Thus, this table indicates that the contribution of renewables to the annual national supply needs to be raised.

Table 1.
The primary energy supply of Indonesia in 2020 [4].
The National Energy Council of Indonesia (DEN) reported in 2020 that the installed capacity of RES was only 10.46 GW, while the potential was estimated to be 423.8 GW (see Table 2) [5]. This shows that the expansion of renewable energy generation seems feasible because only around 2.5% of all RES potential is currently available as installed capacity. Solar dominated the RES potential, yet only 0.15 of 207.8 GW of solar potential has so far been exploited.

Table 2.
Renewable energy generation in Indonesia in 2020.
In many countries, studies have investigated the penetration of RES in the national energy supply [2,6,7,8,9,10,11]. Some of these still included fossil fuels in the energy mix [2,12]. Meanwhile, others [7,8,9] investigated the integration between a renewable energy mix and energy storage in a single scenario with a few specific RES, for instance, using only hydropower, solar and wind. The existing literature mostly focused on assessing the current state of renewable energy generation in their countries to match the energy demand. None of the studies presented a scientific method for the exploration, selection, projection, and evaluation of the available RES in energy mixes. This study provides the scientific approach that was unavailable in the prior literature, taking Indonesia as a case study to provide a generic approach for any areas with different scales worldwide.
In several studies from Indonesian authorities, such as ESDM, DEN and a state-owned enterprise for electricity (PLN), the current and projected renewable energy generation in Indonesia until 2030 were discussed. However, fossil energy sources dominated the energy share, and RES remained complementary. Next, other studies [12,13,14,15] showed that solar energy could play a pivotal role in Indonesia by maintaining the security of the energy supply. However, several drawbacks were also found, such as the need for large areas for placing the photovoltaic (PV) modules, which may result in inefficiencies due to severe overproduction. Thus, using RES and empowering the independence of specific RES is vital.
Thus, even though related research, both scientific and governmental studies, are already available, the aforementioned studies still included fossil fuels in their energy mixes. They were limited to only existing scenarios and focused on a specific RES. To overcome the limitations of the preceding studies, this study provides an explorative data-driven approach to find feasible renewable-based energy mixes and explores extremes in the solution space. For this purpose, this study involved three categories of key performance indicators (KPIs), namely economic and environmental, to provide a clear overview to the stakeholders about their policy’s outcomes and development strategies.
This research aimed to investigate and propose feasible mixes that only use RES. The desired outcome of this research is a goal-driven set of sustainable energy mixes to be used in Java and Bali, Indonesia, and possibly other areas, cities or regions worldwide. The hourly domestic electricity demand for 2020 is used as the electricity demand, accounting for 72.76 TWh (see Supplementary Materials S1). The electricity demand projection complements this base electricity demand to incorporate future developments such as the electrification of Indonesian society and population growth up to 2050.
Our explorative data-driven study focuses on electricity demand and generation on both islands as the target population. Electricity generation is a critical source of air pollution [16]. Shifting to renewable energy is valuable as it will reduce greenhouse gas emissions and ensure reliable, timely, and cost-efficient energy delivery [17]. These islands have seven provinces: Banten, DKI Jakarta, West Java, Central Java, East Java, DI Yogyakarta, and Bali. The target population was chosen since the Java and Bali grids are in one distribution area, supplying 76% of the national electricity consumption, the highest of the seven distribution lines [12]. In addition, around 56.1% of the Indonesian population inhabits Java Island, with electricity and cooking as the significant household energy demands [18].
2. Methodology
2.1. Design Process and Evaluation
The system configuration is shown in Figure 1, consisting of an energy grid with storage (pumped hydro storage and battery), residential loads and electricity generation from municipal solid waste (MSW) and four RES: solar, wind, geothermal and hydro power.
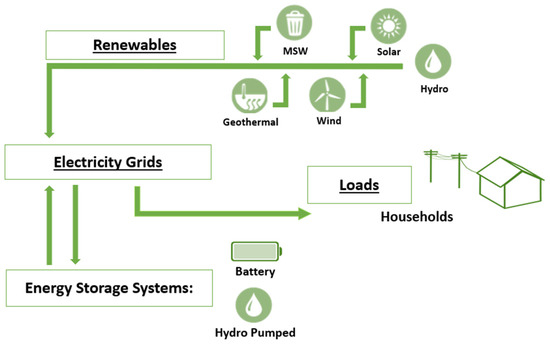
Figure 1.
System configuration of the energy mix in this study.
Initially, the design space was explored using a fixed number of scenarios, using hourly demand and weather data from 2020 to investigate the maximum coverage of different combinations from the current potential of all RES. The first 32 (25) scenarios followed from a full factorial design of five energy sources each with two levels, being the currently installed capacity and the maximum potential capacity.
Then, the residential electricity demand for each year from 2020 to 2050 was estimated based on a growth prognosis made by the grid operator. This yearly growth in demand needed to be compensated by extending the capacity of installed RES. The baseline scenario was formed using the existing RES capacity in 2020. A capacity extension was required when the electricity generation by RES could not reach 100% of the yearly demand in the period 2020–2050. The capacity extension could primarily be realized by extending the capacity of an individual RES up to its maximum potential. If that turned out to be insufficient, the capacity of the next RES was extended.
Finally, each KPI was calculated after meeting 100% of the demand so that each scenario would have different values for the KPIs. The set of feasible renewable energy mixes was ultimately defined by assessing and comparing all KPIs. After that, based on the KPIs, the most feasible mix was further evaluated through a sensitivity analysis with rather extreme weather conditions corresponding to global warming: the solar irradiation was set to 10% higher, and wind speed was reduced by 10%. Furthermore, the effect of modifying the significant RES proportion in the most feasible mix by −10% wind energy capacity was evaluated, while another RES, basically solar and geothermal energy, within the energy mix compensated for this reduction. Extension of municipal solid waste, e.g., through unsustainable import of MSW from other islands, was excluded in this analysis and thus the amount of MSW was fixed. Also, extension of the hydropower energy capacity to compensate for a reduction in wind energy capacity was excluded, as hydropower would preferably be used to introduce flexibility through, e.g., pumped hydro energy storage (PHES) systems. The evaluation process using scenarios, future projections and KPIs is outlined in Figure 2.
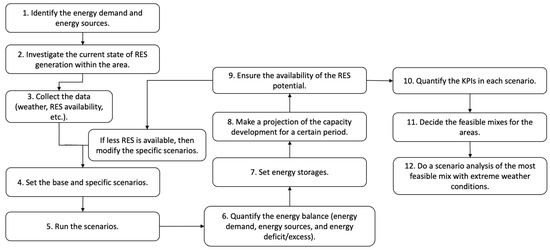
Figure 2.
The flowchart of the systematic approach in this study.
The following sections characterize the case of Java and Bali concerning residential energy demand, projected future use and RES availability and potential.
2.2. Residential Energy Demand
In this research, the hourly electrical demand for 2020 (72.76 TWh) was derived from the annual report of PLN [19], as shown in Figure 3. The total household electricity demand on Java and Bali is higher during the night than during the day, mainly due to air conditioning.
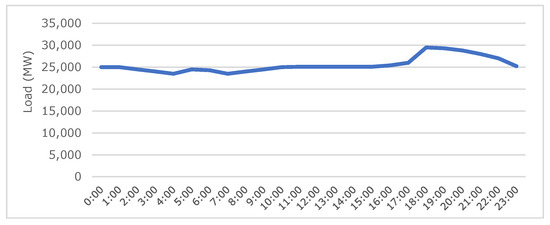
Figure 3.
Typical electricity demand in households in Indonesia in 2020 [12].
In their annual plan, PLN forecasted that the electricity demand in Indonesia will almost double within a decade, from 241 TWh in 2021 to around 400 TWh in 2030. This projection was based on several key factors: current population and population growth, number of households, residential electricity customers, electricity sales, economic development, and electrification ratio, where the details about the projection are in [20]. One of the critical factors, population growth, is also one of the main reasons behind European electricity consumption growth [21]. The trend for Java and Bali specifically can be seen in Figure 4. In this study, PLN’s projection was extended by two decades to 2050, using the PLN average growth in demand of 5.6%, taking into account all aspects contributing to the growth of Indonesia’s electricity demand.
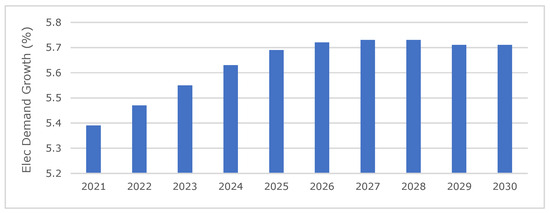
Figure 4.
Electricity demand growth (%) in Java and Bali islands from 2021 to 2030 [14].
2.3. Renewable Energy Source Availability
The energy potential in Indonesia, including Java and Bali islands, consists of various renewable sources. These islands are situated in a maritime tropical area with only rainy and dry seasons [22]. Sunlight is abundant virtually every day of the year [15], yet the current contribution of solar energy to the grid is almost zero (see Table 1). In general, irradiation is approximately 4.5 kWh/m2/day for western areas of Indonesia and around 5.1 kWh/m2/day for eastern regions [23]. This research uses hourly solar electricity from the European Commission’s open-source Photovoltaic Geographical Information System (PVGIS) [24]. During the dry season, the country has more extended daylight with adequate sunlight [25].
The coastal areas of both Java and Bali islands have higher wind speeds compared to inland areas. The wind on Java and Bali islands is appropriate for wind turbines, as the average wind speed in the coastal area is 6 m/s and can be harnessed by small wind turbines with a cut-in speed of 4 m/s [26]. From December to March, the wind blows from the Asian continent to the Australian continent (rainy season), while during the June–September period, it is the other way around (dry season) [27]. Extended daylight in summer and cloudiness in the rainy season lead to time-varying energy production from renewables, particularly solar, throughout the year. Therefore, flexibility in power systems in Indonesia is essential to cover the demand year-round. Figure 5 shows the solar irradiation and wind speed in Java and Bali.
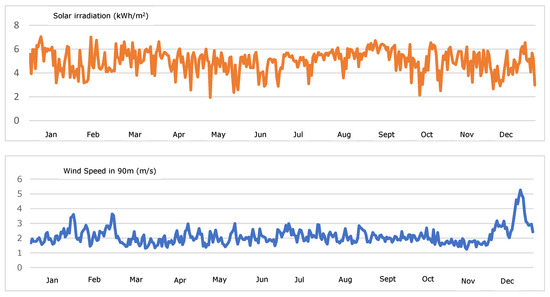
Figure 5.
The (spatial average) hourly solar irradiation and wind speed on Java and Bali islands in 2020.
The hydropower potential is also considerable, with the total of 4.99 GW in Java and Bali. It is available across both islands with different regional capacities, with West Java being the most abundant. The potential of hydropower in West Java is 2.86 GW, while Central and East Java have 0.81 MW and 0.60 MW, respectively [28].
As a country with the fourth largest population in the world, the potential for electricity production from urban waste in Indonesia is significant. This study considers total municipal solid waste (MSW), thus not only the biomass fraction, as a fuel to generate electricity using waste thermal power plants (WTPP). The potential of MSW in Java and Bali can be found in Table 3. Central Bureau of Statistics Indonesia (BPS) estimated that each person produced around 0.68 kg of waste per day in 2020 [29]. Table 3 highlights the number of inhabitants [30], and the assumed MSW produced daily.

Table 3.
MSW produced by individuals each day in Java and Bali.
Lastly, the potential of geothermal energy in Indonesia is also high since the country is in the Ring of Fire, yet the utilization is still low [31]. Java island has the most significant geothermal energy potential. Thus, energy generation from this source looks highly feasible. Table 4 shows the overview of geothermal energy in Indonesia.

Table 4.
Overview of Geothermal energy in Indonesia [31].
According to all the potential mentioned before, Java and Bali islands have sufficient RES to generate electricity. This study indicated the potential and the current capacity per province in Java and Bali, as seen in Table 5.

Table 5.
The potential (top) and the current (bottom) capacity of RES per province in Java and Bali islands [4,5,20].
2.4. Setting of Storage Systems
Flexibility in supply is essential for the design of energy mixes. Solar and wind are prominent sources of renewable energy generation, but those sources are intermittent. Both solar and wind energy have variable and uncertain outputs due to seasonal and local weather conditions [32]; therefore, there is a need for storage to match demand and supply, thus enhancing flexibility. Energy storage is vital in dealing with the intermittency of RES [6].
Gravitational potential energy, such as in pumped hydro energy storage (PHES) systems, can be a promising option to bulk energy storage up to GWh levels [33]. PHES stores energy as gravitational potential energy by pumping water between two reservoirs located at different heights [34]. Bath County Pumped Storage Station is listed as the largest PHES in the world today and stores around 3 GWh of energy. This storage is used for powering around 750,000 homes in the USA [35] with 80% energy efficiency [36]. Bhayo et al. [37] reported that rainfall-based hydropower storage is promising in tropical climate conditions, like the islands of Java and Bali.
A lithium-ion battery is the first electrochemical storage option that can be chosen to store energy in Java and Bali in the short term. The battery has several advantages, such as various capacities, mature technology and higher efficiency than other energy storage systems [38]. Currently, the moss landing lithium-ion battery storage system is operated by Vistra Corps in Moss Landing, CA, USA, with a capacity of 400 MWh and 99% energy efficiency [39]. Another advantage is that this battery has a quick turning time. This storage can respond quickly to the energy demand at a low energy production time by balancing the energy supply.
This study assumes that sufficient storage capacity is available to cover the variations in demand and supply with minimal curtailment and no shortage. Evaluating the possible storage scenarios for Indonesia will be a study on its own.
2.5. Mathematical Modelling
The energy mixes in this research derived support from the above-mentioned four RES and MSW. This study assumed that the capacity of MSW, hydropower, and geothermal energy was fixed and could produce constant electricity as the base load (, , and , respectively). The hourly electricity generation of a solar panel () and wind speed referred to the PVGIS and climatological data issued by the European Commission [24]. The equations used to calculate electricity generated by a wind turbine () can be found in Supplementary Materials S2. The total hourly electricity generated from the energy mix () can be calculated as follows:
Based on Equation (1) and the PLN’s projection of electricity demand growth in Section 2.2, the projection of electricity supply growth was calculated to ensure the electricity supply matched with the electricity demand until 2050.
As mentioned before, the electricity demand () was obtained from PLN’s data, thus, the excess electricity or the electricity deficit from the hourly electricity balance (), as follows:
Thus, leads to an electricity deficit, to zero curtailment, and to excess of electricity. Each hourly excess of electricity was stored, and the storage released electricity when there was a deficit, with a one-way efficiency of 80%. The electricity balance of one whole year was constrained by a zero-curtailment requirement.
This study also conducted an additional sensitivity analysis on the wind-based energy mix, the most feasible one as will be shown later, based on four main cases. The first case was lowering the wind speed and elevating the solar irradiation. Next, the second case was by decreasing the electricity generated from wind turbines by 10% and replacing it by electricity generated from additional solar panels, as follows:
Similar to the second case, in the third case, the amount of electricity generated from wind was replaced by electricity from additional geothermal sources, as follows:
In the last case, decreasing the amount of electricity from wind by 10% was compensated by extra electricity from both solar (5%) and geothermal (5%), as follows:
2.6. Key Performance Indicators
This study considered several KPIs to meet the desired RES percentage in the annual energy supply. The economic aspects that are considered in this study are capital investment/installation cost (CAPEX), operation and maintenance (O&M) cost (OPEX), and return on investment (ROI). CAPEX is once in a time span, but OPEX is an annual cost. Each renewable energy conversion technology has different CAPEX and OPEX (Table 6).

Table 6.
CAPEX and OPEX of each renewable [40].
The ROI defines the percentage of revenue from the investment over specific periods. This research calculates the ROI from the difference between the benefits and the costs (CAPEX and OPEX) within one life cycle of 25 years of the installations.
The benefits are based on annual electricity sales. The benefits’ present value (PV) is then calculated to determine the net present value of the revenue (NPV).
where C0 is the annual benefits (in $), t is time (in years), and r is the discount rate of 3%. This research used LCOE for the selling price of electricity to calculate the annual benefit.
NPV = (PV − Costs)
Environmental KPIs are essential to assess neutral energy development [41]. In terms of environmental factors, carbon dioxide (CO2) emission and CO2 reduction are fundamental in this study. The emission from renewable generation does not come from its generation but from indirect processes such as product manufacturing and plant construction. CO2 emission calculation was based on the emission produced during the manufacturing process. All CO2 emission of each RES capacity installed was calculated for one time per life span (approximately 20–25 years). CO2 reduction was calculated by comparing the emission of RES with the emission from coal-based power plants to generate electricity each year to meet the electricity demand for the life span of each RES. The World Nuclear Association investigated the emission of each renewable per kWh of produced energy, as seen in Figure 6. After the emission of each renewable is known, the CO2 reduction can be determined by comparing the emission from fossil fuels used by the current energy mix (baseline) and the proposed renewable energy mix (scenario) in this study.
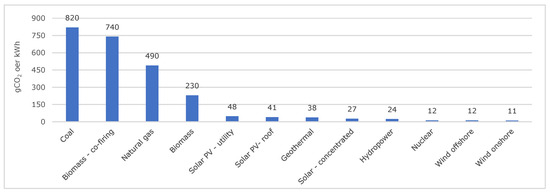
Figure 6.
The CO2 emission per energy source [42].
This research uses all the KPIs to investigate and explore feasible energy mixes. It considers energy mixes with minimal costs (CAPEX and OPEX) but high ROI, the lowest CO2 emission but the highest emission reduction and zero curtailments. An offshore wind turbine is chosen due to the space available for offshore wind turbines, specifically in the southern coastal area of the islands.
3. Results and Discussion
3.1. Forecast of Residential Electricity Demand
Using the electricity demand derived from Perusahaan Listrik Negara (PLN) and its forecasts, the projection of household electricity demand used in this study is shown in Figure 7. Domestic electricity demand in 2050 is expected to be about five times higher than in 2020.
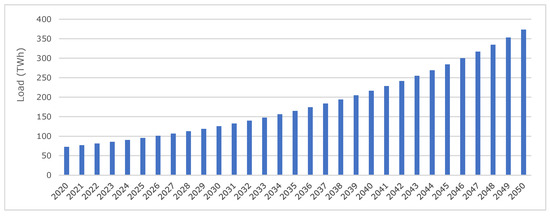
Figure 7.
The forecast of electricity demand for Java and Bali islands until 2050.
3.2. Scenario Analysis
Table S3 of the Supplementary Materials presents the results of the full factorial scenario analysis using residential demand data from 2020. Only 4 out of 32 were not able to cover the 2020: the baseline (currently installed capacity) and three scenarios using only hydro power and/or MSW. All other scenarios with either geothermal, solar or wind could cover the entire 2020 demand such that excess energy was produced when the full potential was exploited. Therefore, three additional scenarios were introduced, with a downscaled capacity of geothermal, solar or wind energy, such that the entire 2020 demand was covered without curtailment (Table 7).

Table 7.
The baseline, existing capacity and adjusted scenarios.
The current and proposed capacity of each RES in those three scenarios can be seen in Figure 8. The same colors are used in each to indicate the corresponding RES.

Figure 8.
The proposed capacity (in GW) of primary scenarios in 2020 based on data in Table 5.
The electricity demand projection depicted in Figure 7 requires an annual capacity development of the energy mixes to cover all the demand. However, the projection of required capacities shows that only the geo-based energy mix can meet the demand up to 2050 (see Figure 9), without any capacity increase in the other RES. The solar-based energy mix can meet the demand only until 2043, while the wind-based mix can cover the demand until 2046.

Figure 9.
Capacity development of three primary scenarios up to 2050.
Further investigation shows that some RES potentials of the three significant scenarios cannot follow the capacity development until 2050 (see Supplementary Materials S6). For example, the potential of geothermal, hydropower and MSW in the geo-based energy mix can only be developed to meet the demand until 2024, 2030 and 2039, respectively. Solar and wind energy should take over capacity development from those years to 2050.
Developing each RES capacity simultaneously is essential to meet rising electricity demand, as the capacity development of each RES takes some years. Thus, it becomes more difficult if capacity development is executed separately. To be precise, geo-based, solar-based, and wind-based energy mixes require 1.15 GW, 2.64 GW, and 2.25 GW (see Supplementary Materials S6) of annual capacity development to ensure a reliable electricity supply. The annual capacity development of the geo-based energy mix is the lowest, because geothermal energy production, as opposed to solar and wind, does not depend on weather conditions and day–night cycles.
3.3. Electricity Generation from Renewable Energy Mixes
In this research, for both seasons, the trend of electricity generation on an hourly basis in three significant scenarios ensures a reliable electricity supply that meets 2020′s domestic electricity demand on Java and Bali islands. Therefore, the government’s intention to implement the transition from fossil to cleaner energy production is achievable. Table 8 shows feasible proportions of each RES in the three scenarios (with corresponding capacities, Figure 8) for 2020′s household electricity supply on Java and Bali islands.

Table 8.
The electricity generated by the proposed capacity of primary scenarios in Table 8.
As shown in Table 8, hydropower plays a pivotal role in the domestic electricity supply in this research by contributing around 34.52% of all electricity supply. Additionally, geothermal contributes the second highest proportion in the solar- and wind-based scenarios with 13.94%, disregarding the highest cost of this technology.
As seen in Figure 3, the domestic electricity demand in Java and Bali during the night is higher than during the day; hence, the energy mix needs to supply more electricity during the night. The geo-based scenario produces a more stable electricity supply than the other scenarios since geothermal is unaffected by the weather and day–night cycle (Figure 10). Thus, excess supply must be stored during the day to accommodate the higher demand at night. According to the calculations, the storage capacity in this scenario is about 5 GWh. This amount is the accumulation of any deficit energy at typical periods, generally at around 17.00–22.00.


Figure 10.
Extreme electricity generation during a day in August and December, respectively, in 2020 on Java and Bali islands from three adjusted energy mixes (in GWh).
During the peak of the dry season, more extended daylight is available, and more solar energy can be harnessed. A solar-based energy mix is superior during the dry season. The peak period for solar energy generation is between July–October, from 10 to 14 o’clock. A solar-based scenario needs to store the excess electricity, which is subsequently used at night during peak hours. Therefore, the need for energy storage is evident, where the storage capacity can be up to 59.2 GWh in the rainy season. During the rainy season, supply from long-term energy storage with excess energy from the dry season is essential.
Wind electricity generation is far more than the demand in the rainy season. During this season, it is more favorable to harness wind energy than other sources. During the rainy season, solar energy generation is less than during the dry season, but the wind is stronger.
Interestingly, the weather conditions on both islands cause a similar trend of electricity generation between solar-based and wind-based, with a higher generation during the day. Strong wind occurs more often during the day, thus, there is excess energy for energy storage. However, as in the solar-based scenario, long-term energy storage is needed to store the energy from the rainy season for the dry season, which requires up to 98.3 GWh of storage capacity in the form of PHES. Due to the high precipitation in Java and Bali, more abundant rain is probable in the rainy season. The abundance of rain can create energy curtailments. To avoid energy curtailments, the excess energy can also be stored in batteries and used for other purposes besides domestic use. Therefore, this research indicated that lithium-ion batteries and PHES could be two promising options at this moment. However, selecting the appropriate options and operational conditions for that storage is beyond the focus of this study. Figure 10 depicts the extreme high (August) and low (December) electricity generation from solar and wind for 24 h.
In addition to energy storage, another challenge is stabilizing hydropower electricity production. However, the work of Winasis et al. (2013) on the Ketenger hydropower plant in Central Java showed that stabilizing hydropower electricity generation is possible by fixing the water inflow to and from the upper reservoir [43]. In the dry season, the water outflow should constantly be above the bottom limit of the required flow to generate the hourly electricity supply from hydropower. When the water inflow significantly exceeds that limit, particularly in the rainy season, the excess water can be released through a bypass system to avoid overflooding.
3.4. The Feasible Energy Supply
Each energy mix has a specific combination of technologies that results in different values of KPIs, assisting the related stakeholders in determining the most feasible energy mixes. From the scenarios in this research, the three main energy mixes, geo-based, solar-based, and wind-based, are resilient due to the variety of RES on Java and Bali.
Renewable energy technologies indirectly emit CO2, mainly from the manufacturing processes. In 2020, around 88% of the national electricity production in Indonesia was from fossil fuels (coal, gas, and oil) [19], which emitted around 30.3 billion tons of CO2 that year (see Figure 11). A wind-based energy mix fits the initial aim of the Indonesian government, reducing the national CO2 emission. The wind-based energy mix is the least polluting scenario compared to the other scenarios. It can reduce the CO2 emissions the most, around 94% lower than the coal-based energy mix (Figure 11).
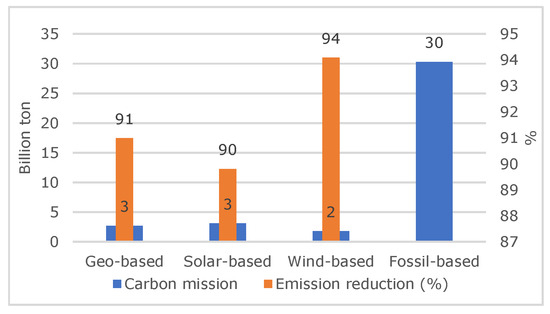
Figure 11.
Environmental KPIs of this research.
From the economic perspective, despite the high CAPEX and OPEX (Table 6), harnessing electricity from geothermal is not the most expensive among the four other RES in this research because geothermal energy in this study has a capacity factor of 1 and is independent of weather conditions. Even though solar energy has the lowest capacity factor and is dependent on weather conditions, the cost of this mix is still lower than the geo-based energy mix. The considerable difference between the CAPEX of geothermal and solar energy explains this finding. All things considered, the wind-based energy mix requires the most budget among these three mixes, particularly for CAPEX (Figure 12). However, the ROI calculation shows that only the wind-based energy mix is profitable during one life cycle of 25 years. High costs for its development can eventually be paid off due to a high electricity selling price (high LCOE) from the offshore wind turbine (Table 6). Therefore, a wind-based energy mix might be the best option from an economic perspective. The weather conditions on both islands also support the usage of wind turbines. Figure 13 displays the contribution of each RES to CAPEX and OPEX in detail.
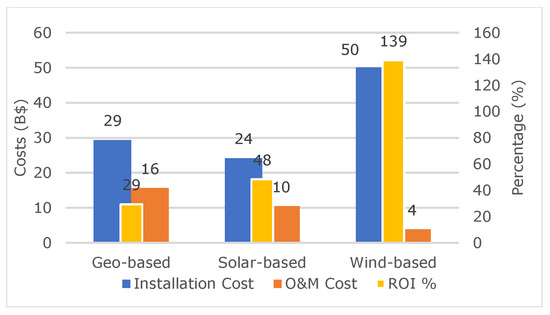
Figure 12.
Economic KPIs of this research.
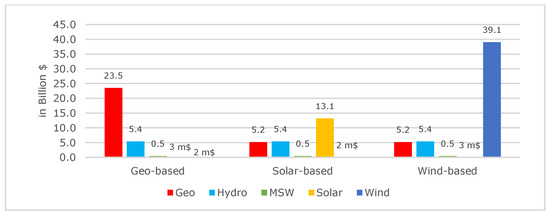
Figure 13.
Each RES’s contribution to the installation cost of each energy mix.
Both economic and environmental KPIs indicate that the proposed wind-based energy mix is more feasible than the other mixes. Wind energy generation offers a reliable and affordable pathway to reduce emissions [7]. This indication can be of considerable value to the government of Indonesia in developing its energy generation. In addition, with its economic and environmental indicators, this energy mix can broaden the options for the Indonesian government to choose which scenario fits best with the financial budget and objective of the development, increasing the likelihood of implementation.
Electricity is vital to support economic development and to meet societal needs [44]. However, generating electricity from RES, as this study proposed, needs to be refined and correspond with economic, energy, policy and any other types of support [45]. It is because an energy transition is considered as a complex, multi-stakeholder, long-term, dynamic and structural transformation [44]. Also, decarbonization in the energy sector requires the rapid and enormous deployment of all efficient and clean energy technologies [46]. It is because the transition can only be reached safely if power systems can ensure the balance between generation and demand [8].
3.5. Sensitivity Analysis of the Wind-Based Energy Mix
The results from the sensitivity analysis show that extreme climate conditions due to climate change do not seriously affect the wind-based energy mix as the most feasible mix among the significant energy mixes. In extreme climate conditions, electricity generation decreases by only 5% (3.56 TWh), and ROI becomes 120% instead of 139% (Figure 13). Thus, the energy mix is still resilient enough to meet the demand (see Supplementary Materials S7). To cover the 5% deficit, Java and Bali islands still have the option to increase the capacity by 0.4 GW from wind energy or another RES that is independent of climate conditions. As a result of additional capacities, the CAPEX and OPEX will increase according to the type of RES chosen. This research excludes the calculation of additional costs for extra capacity due to extreme climate, and it depends on the Indonesian government’s choice.
The sensitivity analysis results on wind energy capacity also depict a similar situation, where the 10% decrease in wind energy capacity in actual climate conditions has an insignificant impact on KPIs. The changes in the KPIs vary according to different modifications, but the value is relatively small. With a superior result on economic and environmental KPIs, the wind-based energy mix in this research is feasible and resilient to meet the household electricity demand in Java and Bali.
This study offers diversified decarbonization options using the available RES potential. It promotes flexibility through multiple energy sources, replicable in various global settings. This data-driven exploration aligns with the net-zero emissions goal by enabling clean and affordable energy. The systematic approach to design and model the energy mix can also be implemented in other areas, cities or regions worldwide with different scales.
4. Conclusions
This study refines, as an example, the initiative of the Indonesian government to accelerate the share of RES in their energy supply. The results of this study revealed that Java and Bali could meet their domestic electricity demand only by harnessing the energy from RES, supporting the goal of the Indonesian government. The required capacities for meeting the domestic electricity demand varied in the scenarios investigated. Depending on the scenario, the range of the required capacity was from 8.32 to 19.10 GW. By adding up to around 1.15–2.64 GW of installed capacity each year, the energy mixes could meet the electricity demand’s growth over the years due to future development up to 2050. This study also indicated a need for energy storage, but a systematic operational design of the energy storage was beyond the focus of this study. Thus, the upcoming research needs to elaborate on the energy storage part.
Hourly-based electricity generation analysis showed that a solar-based energy mix was preferable during the dry season, while a wind-based energy mix was more favorable overall based on economic and environmental KPIs. A scenario analysis with a 10% reduction in wind capacity showed that a wind-based energy mix could still meet the electricity demand. The economic and environmental consequences of choosing different RES shares in the energy mixes until 2050 revealed that the energy mixes are feasible to be installed in the islands. These findings emphasize the need for a thorough capacity development of RES in order to match the islands’ conditions.
Supplementary Materials
The following supporting information can be downloaded at: https://www.mdpi.com/article/10.3390/en16227461/s1. S1. Domestic electricity demand. S2. Electricity Generation from Wind Turbines. S3. Diagram of scenarios used in this study. S4. Electricity generation and storage requirements on Java and Bali islands in 2020. S5 Annual capacity development for each source. S6. Annual capacity development. S7. Sensitivity analysis of the wind-based energy mix. References [19,47,48,49] are cited in the supplementary materials.
Author Contributions
Writing—original draft preparation, D.D.; writing—review and editing, D.D., H.C., K.K.-R. and K.J.K.; visualization, D.D.; supervision, H.C., K.K.-R. and K.J.K.; project administration, D.D. All authors have read and agreed to the published version of the manuscript.
Funding
The research and the APC were funded by The Ministry of Education, Culture, Research and Technology of Indonesia with grant number 0120211000395042039023.
Data Availability Statement
The data on domestic electricity demand is cited from the annual report of electricity sales in 2020 of the state-owned enterprise for electricity (PLN). It is an open source and available online via: https://web.pln.co.id/statics/uploads/2021/07/Statistik-PLN-2020.pdf (accessed on 15 April 2022). Meanwhile, the hourly climatological data of Java and Bali islands is derived from an open source [18] and available online at: https://re.jrc.ec.europa.eu/pvg_tools/en/ (accessed on 15 April 2022).
Conflicts of Interest
The authors declare no conflict of interest.
Nomenclature
| Symbols | |
| A | Swept area of rotor blades (m2) |
| C0 | Annual benefits ($) |
| CO2 | Carbon dioxide |
| Power coefficient | |
| Electricity balance (TWh) | |
| Electricity demand (TWh) | |
| Electricity from geothermal energy (GWh) | |
| Electricity from hydropower (GWh) | |
| Electricity from MSW (GWh) | |
| Electricity from solar energy (GWh) | |
| Electricity supply (TWh) | |
| Electricity supply on sensitivity analysis (TWh) | |
| Electricity from wind energy (GWh) | |
| Hub height (m) | |
| NPV | Net present value of the revenue ($) |
| Generated power (Watt) | |
| PV | Benefits’ present value ($) |
| r | Discount rate (%) |
| t | Time (year) |
| Air density (kg/m3) | |
| Wind speed (m/s) at hub height | |
| Wind speed at hub height (m/s) | |
| Wind speed at 10 m (m/s) | |
| Acronyms | |
| BOE | Barrel of Oil Equivalent |
| BPS | Central Bureau of Statistics |
| CAPEX | Investment/installation cost |
| DEN | National Energy Council |
| ESDM | The Ministry of Energy and Mineral Resource |
| IESR | The Institute for Essential Services Reform |
| IRENA | International Renewable Energy Agency |
| KPI | Key Performance Indicator |
| LCOE | Levelized Cost of Electricity |
| MSW | Municipal Solid Waste |
| OPEX | Operation and Maintenance Cost |
| PLN | State-owned Electricity Company |
| PV | Photovoltaic |
| PVGIS | Photovoltaic Geographical Information |
| RES | Renewable Energy Sources |
| ROI | Return on Investment |
| SDGs | Sustainable Development Goals |
| WTTP | Waste Thermal Power Plants |
References
- Pranta, B.; Tamal, C.; Hemal, C.; Shahariar, H. A Study on Renewable Energy in Smart Grid. In Proceedings of the National Conference on Energy Technology and Industrial Automation, Chittagong, Bangladesh, 13 December 2018. [Google Scholar]
- Sánchez, A.; Zhang, Q.; Martín, M.; Vega, P. Towards a new renewable power system using energy storage: An economic and social analysis. Energy Convers. Manag. 2022, 252, 115056. [Google Scholar] [CrossRef]
- The Ministry of Energy and Mineral Resource (ESDM). Current Capacity and Target of Renewable Energy in Indonesia. 2020. Available online: https://www.esdm.go.id/id/media-center/arsip-berita/hingga-juni-2020-kapasitas-pembangkit-di-indonesia-71-gw (accessed on 8 April 2022).
- The Ministry of Energy and Mineral Resource (ESDM). Handbook of Energy and Economic Statistics of Indonesia 2020; The Ministry of Energy and Mineral Resource (ESDM): Jakarta, Indonesia, 2020.
- The National Energy Council of Indonesia (DEN). Indonesia Energy Outlook 2020; The National Energy Council of Indonesia: Jakarta, Indonesia, 2020.
- Gandhi, A.; Zantye, M.S.; Hasan, M.F. Integration of cryogenic energy storage with renewables and power plants: Optimal strategies and cost analysis. Energy Convers. Manag. 2022, 269, 116165. [Google Scholar] [CrossRef]
- Cheng, C.; Blakers, A.; Stocks, M.; Lu, B. 100% renewable energy in Japan. Energy Convers. Manag. 2022, 255, 115299. [Google Scholar] [CrossRef]
- Vargas-Ferrer, P.; Álvarez-Miranda, E.; Tenreiro, C.; Jalil-Vega, F. Assessing flexibility for integrating renewable energies into carbon neutral multi-regional systems: The case of the Chilean power system. Energy Sustain. Dev. 2022, 70, 442–455. [Google Scholar] [CrossRef]
- Li, C.; Chen, D.; Li, Y.; Li, F.; Li, R.; Wu, Q.; Liu, X.; Wei, J.; He, S.; Zhou, B.; et al. Exploring the interaction between renewables and energy storage for zero-carbon electricity systems. Energy 2022, 261, 125247. [Google Scholar] [CrossRef]
- El-Sayed, A.H.A.; Khalil, A.; Yehia, M. Modeling alternative scenarios for Egypt 2050 energy mix based on LEAP analysis. Energy 2023, 266, 126615. [Google Scholar] [CrossRef]
- Herc, L.; Pfeifer, A.; Duić, N.; Wang, F. Economic viability of flexibility options for smart energy systems with high penetration of renewable energy. Energy 2022, 252, 123739. [Google Scholar] [CrossRef]
- Guenther, M. Challenges of a 100% renewable energy supply in the Java-Bali grid. Int. J. Technol. 2018, 9, 257–266. [Google Scholar] [CrossRef]
- IRENA. Indonesia Energy Transition Outlook; International Renewable Energy Agency: Abu Dhabi, United Arab Emirates, 2021. [Google Scholar]
- Institute for Essential Services Reform (IESR). A Roadmap for Indonesia’s Power Sector: How Renewable Energy Can Power Java-Bali and Sumatra; Institute for Essential Services Reform (IESR): Jakarta, Indonesia, 2019. [Google Scholar]
- Tambunan, H.B.; Hakam, D.F.; Prahastono, I.; Pharmatrisanti, A.; Purnomoadi, A.P.; Aisyah, S.; Wicaksono, Y.; Sandy, I.G.R. The Challenges and Opportunities of Renewable Energy Source (RES) Penetration in Indonesia: Case Study of Java-Bali Power System. Energies 2020, 13, 5903. [Google Scholar] [CrossRef]
- Azarpour, A.; Mohammadzadeh, O.; Rezaei, N.; Zendehboudi, S. Current status and future prospects of renewable and sustainable energy in North America: Progress and challenges. Energy Convers. Manag. 2022, 115945. [Google Scholar] [CrossRef]
- Ellabban, O.; Abu-Rub, H.; Blaabjerg, F. Renewable energy resources: Current status, future prospects, and their enabling technology. Renew. Sustain. Energy Rev. 2014, 39, 748–764. [Google Scholar] [CrossRef]
- Central Bureau of Statistics Indonesia (BPS). Hasil Sensus Penduduk Indonesia 2020. Available online: https://www.bps.go.id/pressrelease/2021/01/21/1854/hasil-sensus-penduduk-2020.html (accessed on 20 April 2022).
- PT PLN. Electricity Statistics 2020; PLN: Jakarta, Indonesia, 2020.
- PT PLN. Rencana Usaha Penyediaan Tenaga Listrik 2021 (RUPTL); PLN: Jakarta, Indonesia, 2021.
- Marrasso, E.; Roselli, C.; Sasso, M. Electric efficiency indicators and carbon dioxide emission factors for power generation by fossil and renewable energy sources on hourly basis. Energy Convers. Manag. 2019, 196, 1369–1384. [Google Scholar] [CrossRef]
- Silalahi, D.F.; Blakers, A.; Stocks, M.; Lu, B.; Cheng, C.; Hayes, L. Indonesia’s vast solar energy potential. Energies 2021, 14, 5424. [Google Scholar] [CrossRef]
- Syahputra, R.; Soesanti, I. Planning of hybrid micro-hydro and solar photovoltaic systems for rural areas of central Java, Indonesia. J. Electr. Comput. Eng. 2020, 2020, 5972342. [Google Scholar] [CrossRef]
- Huld, T.; Müller, R.; Gambardella, A. A new solar radiation database for estimating PV performance in Europe and Africa. Sol. Energy 2012, 86, 1803–1815. [Google Scholar] [CrossRef]
- Central Bureau of Statistics Indonesia (BPS). Curah Hujan di Indonesia 2020. Available online: https://jateng.bps.go.id/indicator/151/450/1/banyak-curah-hujan-dan-hari-hujan-menurut-bulan-di-provinsi-jawa-tengah.html (accessed on 13 April 2022).
- The Ministry of Energy and Mineral Resource (ESDM). The Potential of Renewable Energy Resources in Indonesia. 2020. Available online: https://geoportal.esdm.go.id/ebtke/ (accessed on 21 June 2022).
- Setiawan, R.Y.; Habibi, A. SST cooling in the Indonesian seas. Ilmu Kelaut. 2010, 15, 42–46. [Google Scholar]
- Kurniawan, H.A.; Windarta, J. Overview Penyediaan Kapasitas Pembangkit Listrik Tenaga Air Berdasarkan Rencana Umum Energi Nasional (RUEN). J. Energi Baru Dan Terbarukan 2021, 2, 133–143. [Google Scholar] [CrossRef]
- Andryanto, S.D. Daily Waste Prduction Indonesia. 2021. Available online: https://tekno.tempo.co/read/1460843/satu-orang-indonesia-hasilkan-068-kilogram-sampah-per-hari-juga-sampah-plastik/full&view=ok (accessed on 20 April 2022).
- Central Bureau of Statistics Indonesia (BPS). Inhabitants Per Province 2020. Available online: https://www.bps.go.id/indicator/12/1886/1/jumlah-penduduk-hasil-proyeksi-menurut-provinsi-dan-jenis-kelamin.html (accessed on 13 May 2022).
- Pambudi, N.A. Geothermal power generation in Indonesia, a country within the ring of fire: Current status, future development, and policy. Renew. Sustain. Energy Rev. 2018, 81, 2893–2901. [Google Scholar] [CrossRef]
- Paul, D.; Ela, E.; Kirby, B.; Milligan, M. The Role of Energy Storage with Renewable Electricity Generation; National Renewable Energy Laboratory: Golden, CO, USA, 2010.
- Yang, Z.; Zhang, J.; Kintner-Meyer, M.C.; Lu, X.; Choi, D.; Lemmon, J.P.; Liu, J. Electrochemical energy storage for green grid. Chem. Rev. 2011, 111, 3577–3613. [Google Scholar] [CrossRef]
- IRENA. Electricity Storage and Renewables Costs and Markets Electricity Storage and Renewables: Costs and Markets to 2030; IRENA: Abu Dhabi, United Arab Emirates, 2017. [Google Scholar]
- Dominion Energy. Bath County Pumped Storage Station|Dominion Energy. 2019. Available online: https://web.archive.org/web/20190329052618/https://www.dominionenergy.com/about-us/making-energy/renewable-generation/water/bath-county-pumped-storage-station (accessed on 20 May 2022).
- Environmental and Energy Study Institute (EESI). Energy Storage 2019. Available online: https://www.eesi.org/papers/view/energy-storage-2019 (accessed on 24 May 2022).
- Bhayo, B.A.; Al-Kayiem, H.H.; Gilani, S.I.; Ismail, F.B. Power management optimization of hybrid solar photovoltaic-battery integrated with pumped-hydro-storage system for standalone electricity generation. Energy Convers. Manag. 2020, 215, 112942. [Google Scholar] [CrossRef]
- Semeraro, C.; Aljaghoub, H.; Abdelkareem, M.A.; Alami, A.H.; Olabi, A.G. Digital twin in battery energy storage systems: Trends and gaps detection through association rule mining. Energy 2023, 273, 127086. [Google Scholar] [CrossRef]
- Vistra Corp. 2021. Available online: https://investor.vistracorp.com/2021-08-19-Vistra-Completes-Expansion-of-Battery-Energy-Storage-System-at-its-Flagship-California-Facility (accessed on 14 October 2023).
- IRENA. Renewable Power Generation Costs in 2020; International Renewable Energy Agency: Abu Dhabi, United Arab Emirates, 2021. [Google Scholar]
- Giordano, V.; Vitiello, S.; Vasiljevska, J. Definition of an assessment framework for projects of common interest in the field of smart grids. JRC Sci. Policy Rep. 2014. [Google Scholar]
- World Nuclear Association. Carbon Dioxide Emissions from Electricity. 2021. Available online: https://www.world-nuclear.org/information-library/energy-and-the-environment/carbon-dioxide-emissions-from-electricity.aspx (accessed on 19 May 2022).
- Winasis, W.; Prasetijo, H.; Setia, G.A. Optimasi Operasi Pembangkit Listrik Tenaga Air (PLTA) Menggunakan Linear Programming Dengan Batasan Ketersediaan Air. Din. Rekayasa 2013, 9, 62–67. [Google Scholar]
- Castrejon-Campos, O. Evolution of clean energy technologies in Mexico: A multi-perspective analysis. Energy Sustain. Dev. 2022, 67, 29–53. [Google Scholar] [CrossRef]
- Chen, J.; Yu, T.H.K.; Chou, S.Y. Simulating the effects of offshore wind energy policy on decarbonization and industrial growth in Taiwan: A system dynamics approach. Energy Sustain. Dev. 2022, 71, 490–504. [Google Scholar] [CrossRef]
- Ayuketah, Y.; Gyamfi, S.; Diawuo, F.A.; Dagoumas, A.S. Assessment of low-carbon energy transitions policies for the energy demand sector of Cameroon. Energy Sustain. Dev. 2023, 72, 252–264. [Google Scholar] [CrossRef]
- Jamdade, P.G.; Patil, S.V.; Jamdade, S.G. Assessment of power coefficient of an offline wind turbine generator system. Electron. J. Energy Environ. 2013, 1, 41–48. [Google Scholar] [CrossRef]
- Nadjemi, O.; Nacer, T.; Hamidat, A.; Salhi, H. Optimal hybrid PV/wind energy system sizing: Application of cuckoo search algorithm for Algerian dairy farms. Renew. Sustain. Energy Rev. 2017, 70, 1352–1365. [Google Scholar] [CrossRef]
- van Leeuwen, L.B.; Cappon, H.J.; Keesman, K.J. Urban bio-waste as a flexible source of electricity in a fully renewable energy system. Biomass Bioenergy 2021, 145, 105931. [Google Scholar] [CrossRef]
Disclaimer/Publisher’s Note: The statements, opinions and data contained in all publications are solely those of the individual author(s) and contributor(s) and not of MDPI and/or the editor(s). MDPI and/or the editor(s) disclaim responsibility for any injury to people or property resulting from any ideas, methods, instructions or products referred to in the content. |
© 2023 by the authors. Licensee MDPI, Basel, Switzerland. This article is an open access article distributed under the terms and conditions of the Creative Commons Attribution (CC BY) license (https://creativecommons.org/licenses/by/4.0/).