Article

The Effect of Organic Acid Dopants on the Specific Capacitance of Electrodeposited Polypyrrole-Carbon Nanotube/Polyimide Composite Electrodes

Department of Mechanical and Materials Engineering, University of Cincinnati, Cincinnati, OH 45221, USA
*
Author to whom correspondence should be addressed.
Energies 2023, 16(22), 7462; https://doi.org/10.3390/en16227462
Submission received: 20 August 2023 / Revised: 19 October 2023 / Accepted: 3 November 2023 / Published: 7 November 2023

Abstract

:
Energy storage materials are constantly being improved and developed to cope with the ever-increasing demand of the electronic devices industry. Various synthetic approaches have been used to manufacture electrode materials. This paper is focused on the use of intrinsically conductive polymers such as polypyrrole (PPy) in the development of single-walled carbon nanotube-polyimide, SWCNT-PI, supercapacitor electrode materials. The polypyrrole used in the study is doped with different organic acid dopants of various sizes, including styrene sulfonic acid, SSA, toluene sulfonic acid, TSA, dodecylbenzene sulfonic acid, DBSA, naphthalene disulfonic acid, NDSA, and naphthalene trisulfonic acid, NTSA. The number of sulfonic acid functional group per dopant molecule varied from one to three, while the number of benzene rings in the aromatic unit varied from one to two. It is believed that, as the sulfonic acid to the dopant molecule ratio changes, the morphology and electrochemical properties of the doped PPy-coated electrode material will change accordingly. The change in the morphology of the doped PPy, due to the respective dopant, is correlated with the change in the electrochemical properties of the modified composite electrode. The naphthalene trisulfonic acid (NTSA) dopant was found to produce the highest specific capacitance of about 119 F/g at 5 mV/s. Furthermore, the NTSA-doped PPy electrode system showed the highest porosity and highest tan delta damping peak height for the a-transition. The styrene sulfonic acid-doped PPy/SWCNT-PI electrode material showed an impressive storage modulus of more than 2 GPa, but lower porosity. Styrene polymerization is believed to have occurred. The results obtained indicate that the porosity and electrochemical properties of the electrode materials are correlated.

1. Introduction

Lithium-ion batteries (LIBs) have become the most popular energy storage device on the planet, providing the means necessary to power the electric age. As our utilities and devices become smaller, portable, and more independent from the use of fossil fuels, the advancement in LIBs, continuously needs improvement to meet this demand. However, similar to every technology, there are limitations and challenges to their uses and applications. The relatively lower power output and life cycle of these LIBs have opened new avenues of research for the development of newer and more advanced energy storage electrode materials [1,2].
Approaches to meeting this goal involve the advancement of electrode materials by improving their electrical conductivity, porosity, and interaction with the electrolyte to maximize efficient ionic and electrical conduction pathways [3,4,5]. Establishing an improved diffusion pathway in the electrode material is key to improving its electrochemical performance. This requires tuning the morphology of the electrode material and reinforcement with conductive nanofillers [6,7,8]. Supercapacitors are energy storage systems, which are classified as electrochemical double layer capacitors (EDLCs) or pseudocapacitors [9,10,11,12]. EDLCs store energy within their electrical double layer formed at the interface between the electrode and electrolyte, while pseudocapacitors undergo reversible Faradaic redox reactions [9,13,14,15].
Carbon-based nanomaterials such as carbon nanotubes (CNTs), carbon black, and graphene are nanofillers widely utilized in the construction of energy storage electrode materials [16,17,18,19,20,21,22]. They form electrically conductive networks throughout the entirety of the active electrode, enhancing its electrochemical performance [23]. Studies have examined the use of CNTs in many electrodes and a specific capacitance of about 106.2 F/g was achieved [11].
Intrinsically electrically conducting polymers, ICPs such as polypyrrole (PPy) are commonly used in the development of supercapacitor electrodes [24]. They can undergo reversible redox reactions by which they store charge [24]. The ease of synthesis and doping of PPy, makes PPy an attractive active material for use in the construction of energy storage electrode materials [25,26]. Toluene sulfonic acid-doped PPy electrode was reported to have discharge capacities up to 135 mAh/g [26]. Combining PPy with a polymer nanocomposite is known to improve the electrochemical and mechanical properties of the composite.
The effect of organic acid-doped PPy on the electrochemical and damping behavior of SWCNT/polyimide composite material is the focus of this study. The impact of the size of the organic acid dopants on the properties of PPy/CNT-PI electrode materials was examined. The morphological changes resulting from the doping of PPy were also investigated in order to understand how porosity can be altered by insertion of dopants of different sizes. A correlation of the composites’ electrochemical properties and porosity, due to the size of the dopant, will be carried out. By doping PPy with the right type of dopant, the construction of high-performance supercapacitor electrode material can be achieved at low cost on a large scale for batteries and other energy storage applications.

2. Materials and Methods

2.1. Materials

For the synthesis of poly(amic acid), pyromellitic dianhydride (PMDA) 99% purity and 4,4-oxydianiline (ODA) 98% purity were used and were purchased from Sigma Aldrich. N,N-dimethylformamide (DMF) 99% purity was the solvent used to dissolve the reagents and was purchased from Right Price chemicals. TuballTM company supplied the single-walled carbon nanotubes. The organic acid dopants were purchased from Sigma Aldrich and include p-toluene sulfonic acid (TSA), 1,5-naphthalene disulfonic acid (NDSA), 1,3-naphthalene trisulfonic acid (NTSA), 4-styrene sulfonic acid (SSA), and dodecylbenzene sulfonic acid, which were 99% pure. Chemical structures of dopants are shown in Figure 1. All chemicals were used as received.

2.2. Method

2.2.1. Preparation of Poly(amic acid)/SWCNT Composite

Poly(amic acid)/SWCNT slurry was prepared by in situ polymerization. Briefly, 50 wt% of single-walled carbon nanotubes, SWCNT, was dispersed in DMF and sonicated using probe sonication followed by mechanical stirring for 3 h. Then, 0.0245 moles of ODA was added to the CNT dispersion and sonicated for a further 1 h. The synthesis of the slurry was carried out at 5 °C. Thereafter, the reaction mixture was transferred to a 3-neck flask under a constant stream of nitrogen, where it was polymerized with 0.0245 moles of PMDA to form a viscous poly(amic acid)/SWCNT slurry. The slurry was then cast into thin films on a Teflon sheet by means of the doctor blade and the films were thermally treated at 100 °C to gradually remove the solvent. Stepwise curing was then carried out in a vacuum oven at 120 °C for 4 h, 180 °C for 3 h, 200 °C for 1 h, and 250 °C for 1 h. This sequence of thermal treatment cured the poly(amic acid) matrix to form SWCNT/polyimide composites. After the films cooled down, they were cut into rectangular electrodes for PPy electrodeposition and subsequent characterization.

2.2.2. Electrodeposition of Polypyrrole

Pyrrole was dissolved in 100 mL of distilled water to produce pyrrole solutions of 0.05, 0.1, and 0.5 M, respectively. Toluene sulfonic acid, TSA, served as the benchmark dopant for identifying the optimum concentration of dopant and for comparison of the effect of dopants on the electrochemical properties. TSA and PPy concentrations of 0.1 M and 0.5 M, respectively, were found to be the optimum. All the other dopants were investigated using these optimum concentrations. After a solution of PPy and the respective dopant was prepared, the SWCNT/PI electrode was immersed in the solution in order to begin the electrochemical polymerization of pyrrole on the electrode. Electropolymerization of pyrrole was carried out in a three-electrode electrochemical cell configuration using a GAMRY 3000 potentiostat and Ag/AgCl reference electrode and a glassy carbon counter electrode. Additionally, electropolymerization was carried out using a linear potentiostatic sweep at an applied potential of 2 V for 600 s. The coated electrodes were promptly removed and washed with ethanol and then dried in a vacuum oven at 100 °C to remove any remaining solvent. Each sample was weighed before and after electropolymerization.

3. Characterization Techniques

3.1. Scanning Electron Microscopy (SEM)

High-magnification (>100,000×) images of the electrode surface morphologies and compositions were obtained using a Thermo Fisher SCIOS DualBeam Scanning Electron Microscope, SEM, purchased from Thermo Fisher Scientific Company, Waltham, MA, USA. Surface and cross-sectional images were studied to determine the amount of electrodeposited PPy and the porosity resulting from the electrodeposited PPy. The effect of the organic dopants on the morphology of PPy/SWCNT-PI composite electrode was studied. Because the samples are electrically conductive, Ag sputtering was not necessary.

3.2. Cyclic Voltammetry

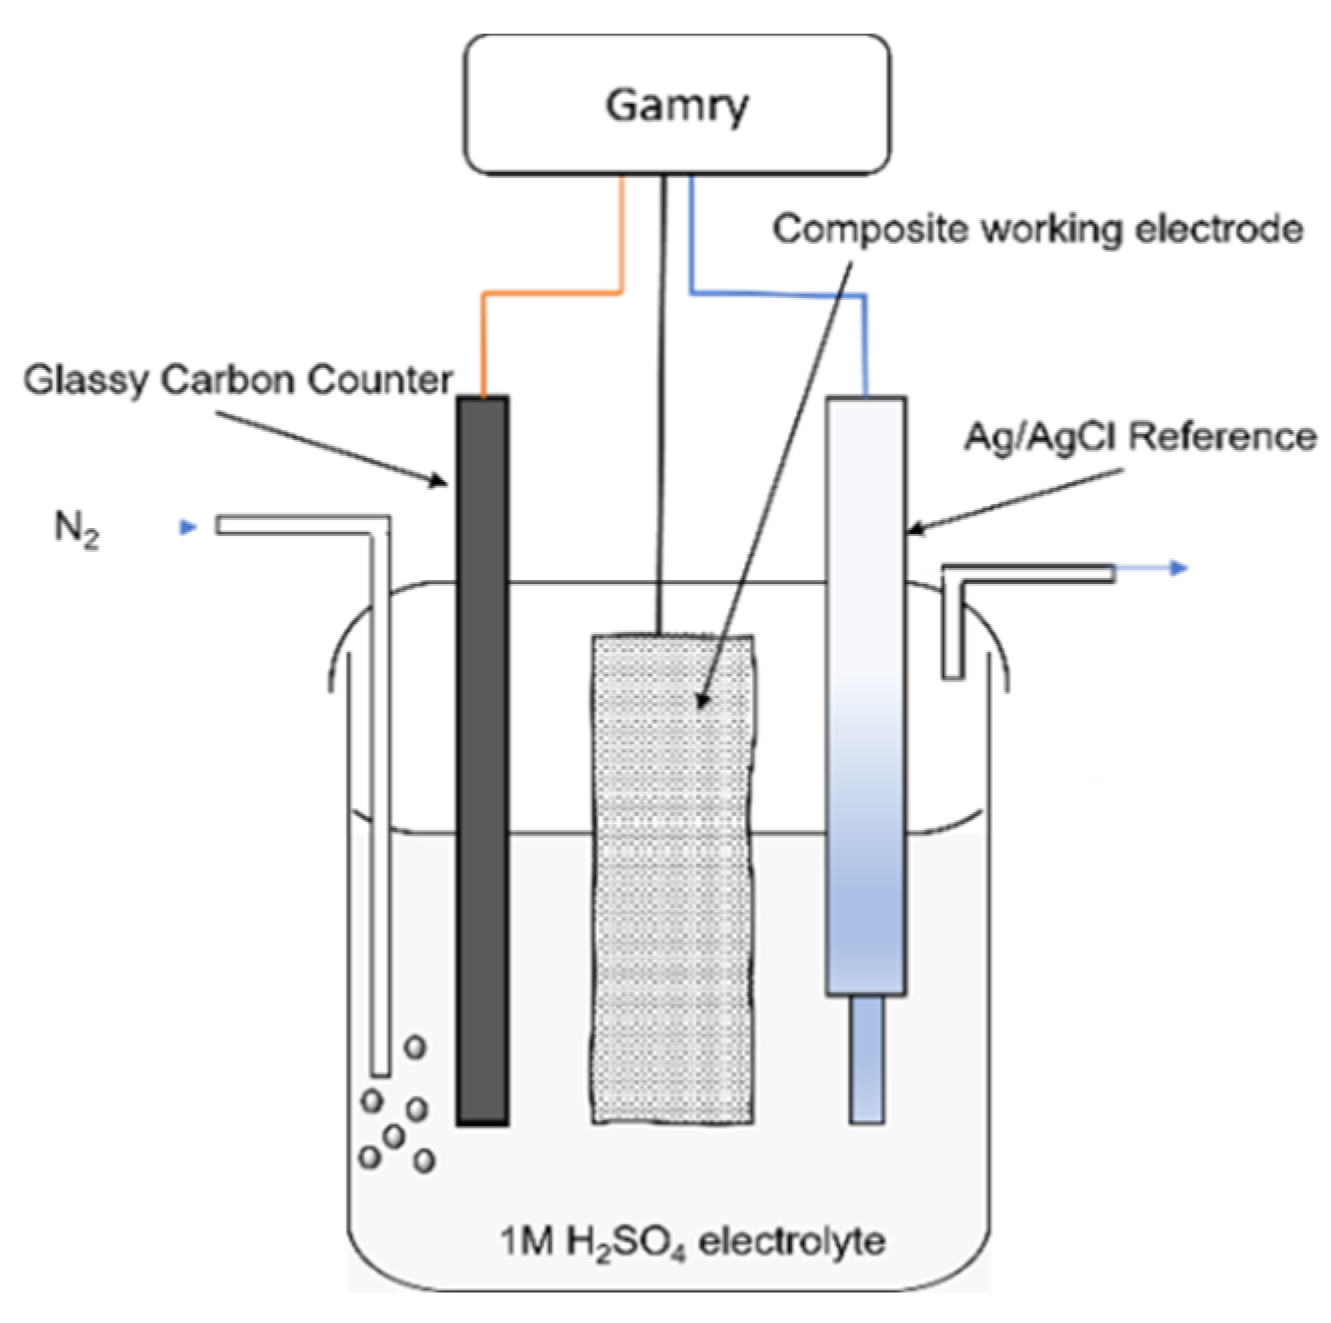
A GAMRY 3000 potentiostat with a three-electrode cell configuration was used to perform cyclic voltammetry, CV. The reference and counter electrodes used were the Ag/AgCl and carbon electrode, respectively (Figure 2). CV was carried out between a potential window from 0 to 1 V at scan rates of 5, 10, and 25 mV/s, respectively, to determine the specific gravimetric capacitance (Cp) and specific capacity (Csp) of the composite electrode materials. Equation (1) was used to calculate Cp with units in F/g, where I (A) is the response current obtained during the voltage sweep ∆V (V) at given scan rates v (mV/s) of the specific active material of mass, m, in grams. ∫IdV is the integrated area under the cyclic voltammetry curve. The electrolyte used in all electrochemical tests is 1 M H2SO4.
C p = I d V 2 m × v × V
Specific capacity of the material (Csp) in mAh/g was calculated using Equation (2), where 3600 is the number of seconds/hour (s/h) divided by 1000 for the conversion from amps (A) to milliamps (mA).
C s p = I d V 2 m × v × 3.6

3.3. Galvanic Charge–Discharge Cycles

Charge–discharge cycles were run at three different current densities: 0.5 A/g, 1 A/g, and 5 A/g between a potential range from 0 to 0.8 V. Samples were cycled under galvanostatic conditions. The charge cycle of the electrode materials provided an insight into the material’s capacitance retention over its operational lifecycle. The capacitance retention was calculated by dividing the successive discharge capacitance values by the discharge capacitance of the second cycle. Specific capacitance, Cp (F/g), was calculated using Equation (3), where Im is the discharge current density (Ag−1) and ∆V is the potential drop (V) during the discharge period ∆t (s).
C p = I m t V
Specific capacity (Csp) in mAh/g was calculated using Equation (4).
C p = I m t 3.6

3.4. Electrochemical Impedance Spectroscopy, EIS

EIS measurements were carried out between the frequencies of 1 MHz and 10 mHz with a DC voltage of 1 V open circuit potential. The theoretical porosity of the electrode material was calculated using a modified form of Archie’s law (Equations (5) and (6)) based on the bulk resistivity, Ru obtained from EIS. This method utilizes the Nyquist plot and appropriate equivalent Randle cell-circuit model with a Warburg element, as shown in Figure 3.
σ e f f = t R u A
= σ e f f σ 0 C m
where σ e f f is the effective electrical conductivity of the electrode, t and A are the thickness and contact area of the active electrode material, respectively, and R u is the bulk resistance. C is the coefficient of saturation ranging from 0.1 to 1, σ 0 is the electrolyte conductivity, m is the cementation factor (typically between 1.5 and 4), and is the sample’s porosity [27,28].

3.5. Fourier Transform Infrared Spectroscopy (FTIR)

A Nicolet 6700 Fourier transform infrared spectrometer, FTIR, equipped with a germanium crystal attenuated surface reflectance unit, ATR, was used to analyze the chemical structure and composition of the electrodes before and after PPy was electrodeposited. Each sample was subjected to 32 scans in the wavenumber range from 4000 cm−1 to 650 cm−1.

3.6. Dynamic Mechanical Analysis

Dynamic mechanical analysis, DMA, was carried out using an EXSTAR6000 dynamic mechanical spectrometer, DMS. Thermo-mechanical response of the material was studied to obtain the storage modulus (E’), loss modulus (E”), and the tangent of the loss angle, tan d. All tests were carried out in the tensile mode between −140 °C and 500 °C at 10 °C/min. All measurements were carried out at an oscillatory frequency of 1 cycle/second, 1 Hz.

4. Results and Discussion

4.1. Scanning Electron Microscopy (SEM)

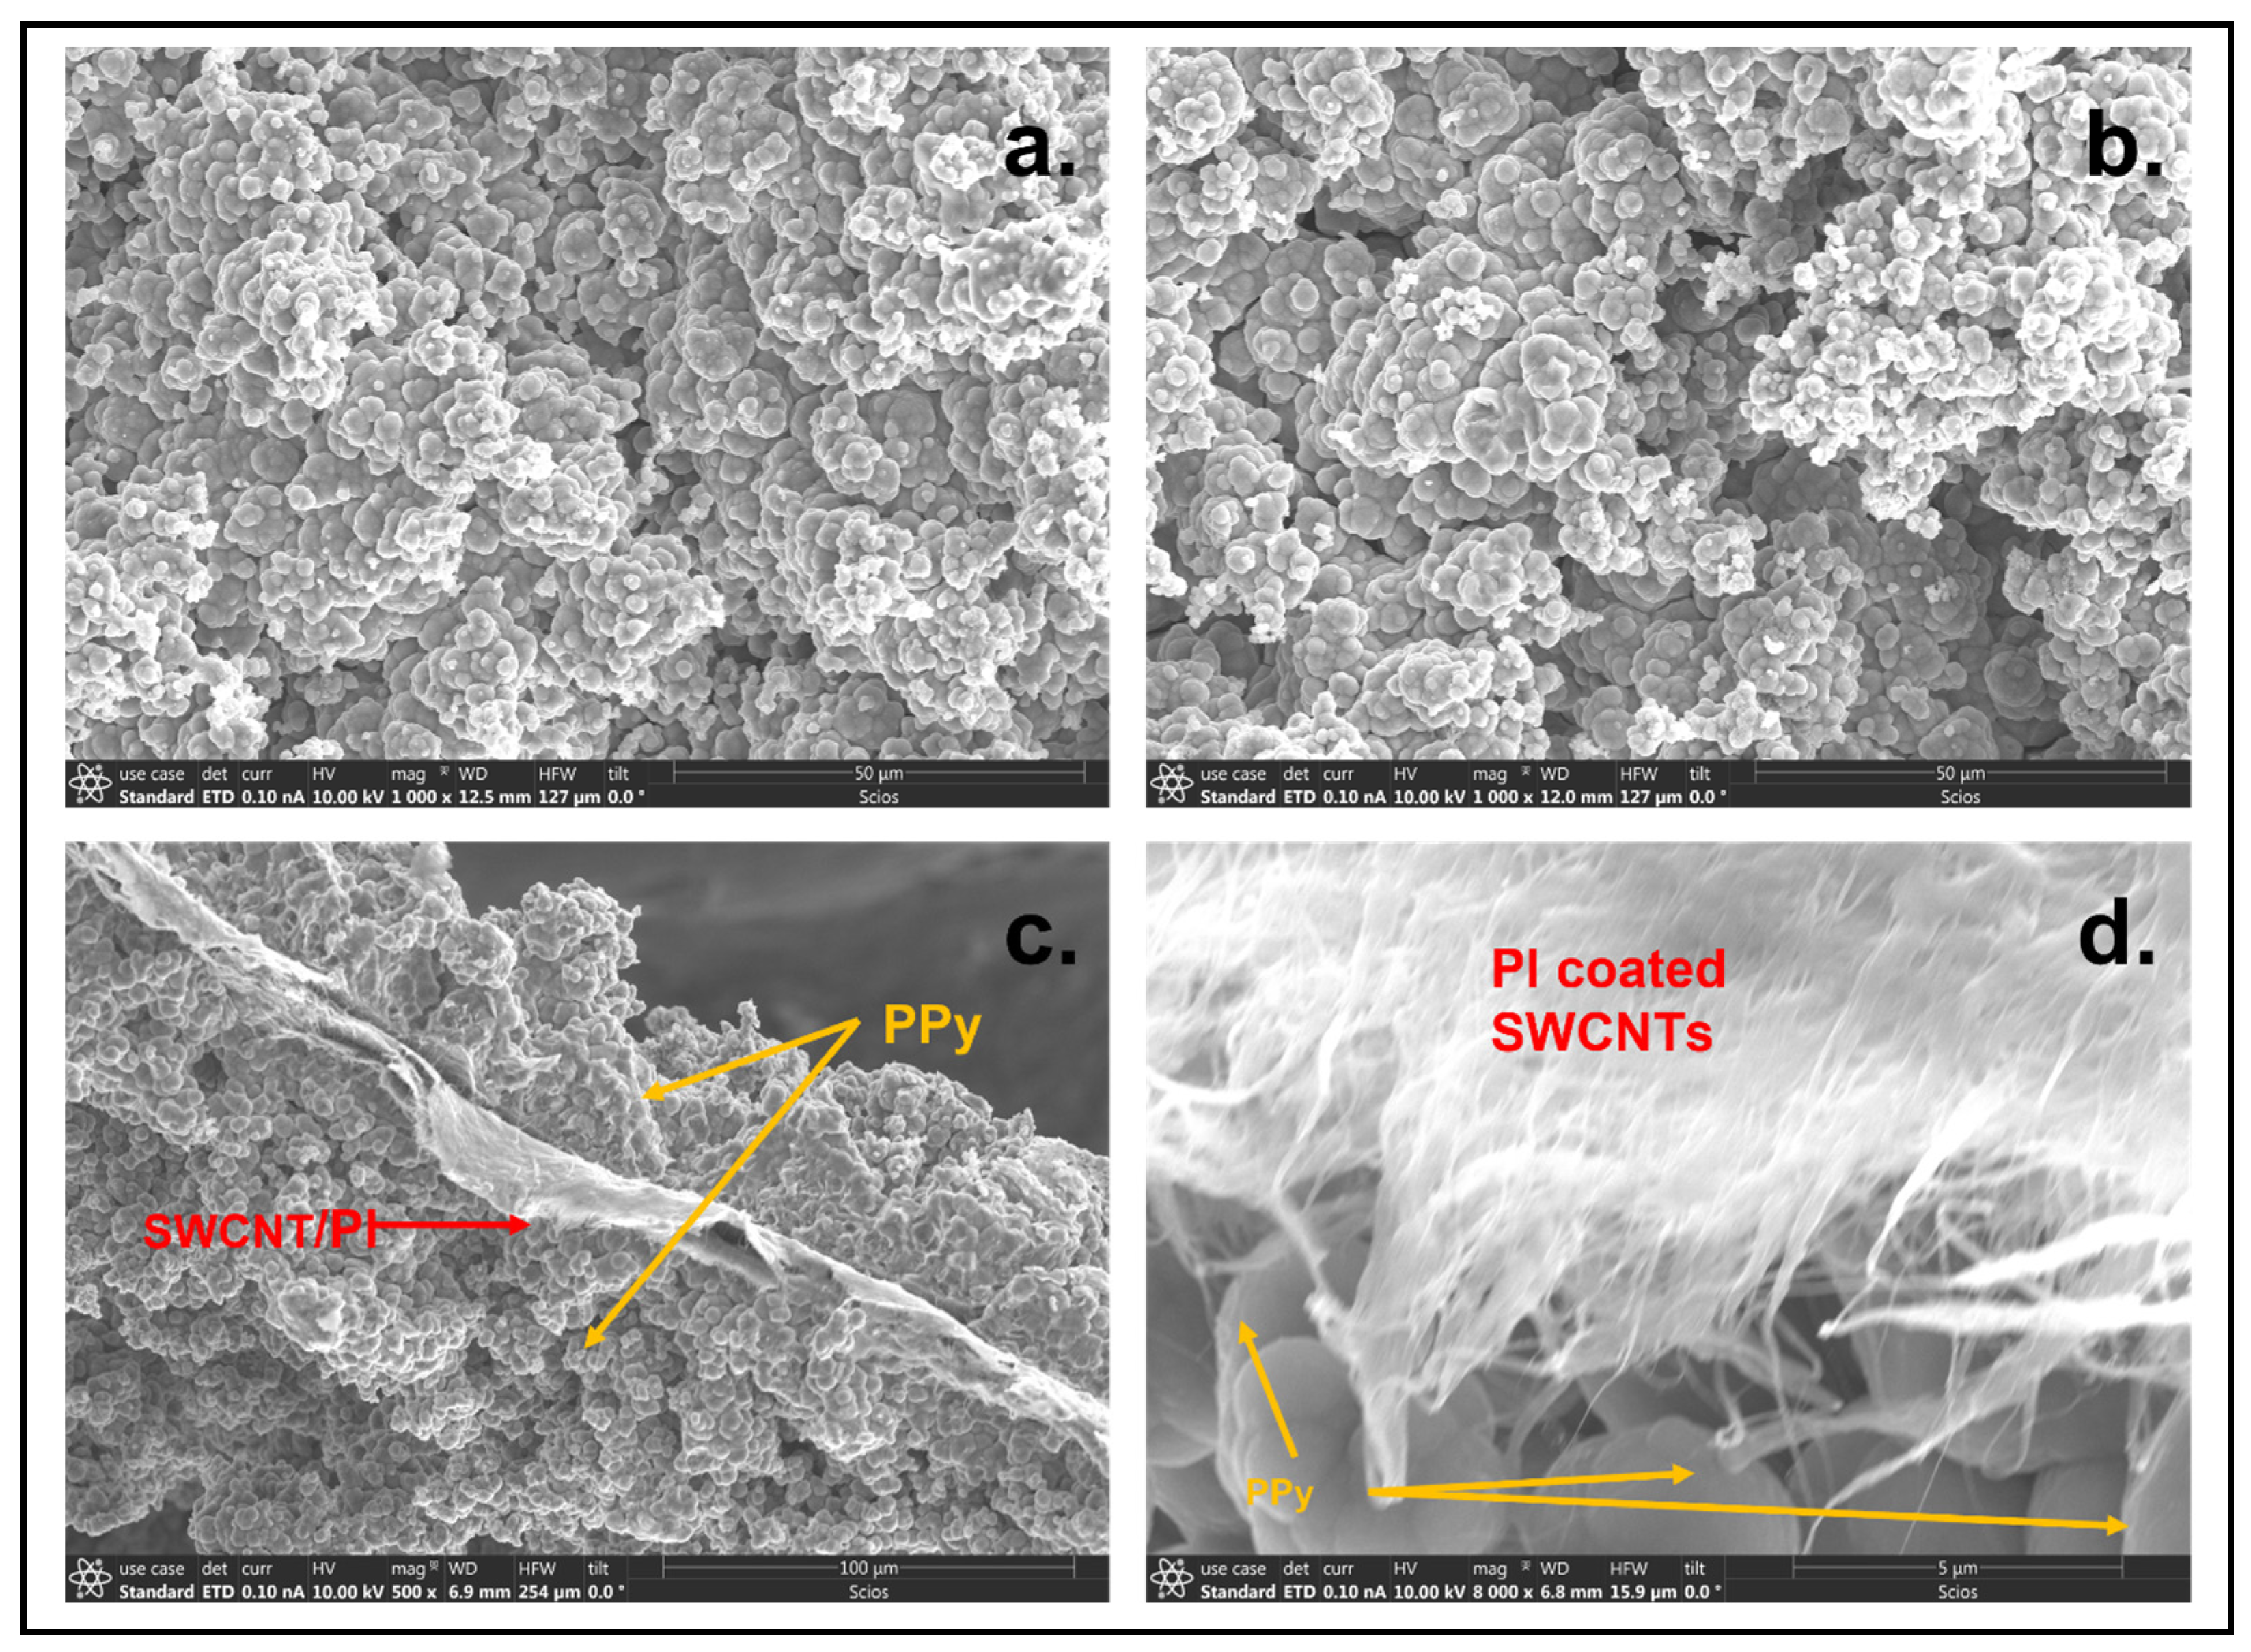
The SEM images show that a good amount of PPy was deposited on the substrate, resulting in an incredibly porous network with channels that go through it, facilitating electrolyte diffusion in the system. The naphthalene trisulfonic-doped PPy (Figure 4b) shows a much higher amount of porosity than the TSA-doped PPy (Figure 5) or the NDSA-doped PPy (Figure 4a). A higher concentration of PPy also results in improved conductivity, which could be inferred from the high-resolution images that show very little charging. The cross-sectional morphology of 0.5 PPy/0.1 NTSA-coated SWCNT/PI composite is shown in Figure 4c. It shows a uniform amount of deposited PPy on both sides of the composite electrode as compared to that of 0.5 M PPy/0.1 M TSA deposit (Figure 5a). Furthermore, Figure 4d highlights the nature of the interaction between the electrodeposited PPy/NTSA and the SWCNT/polyimide composite substrate.
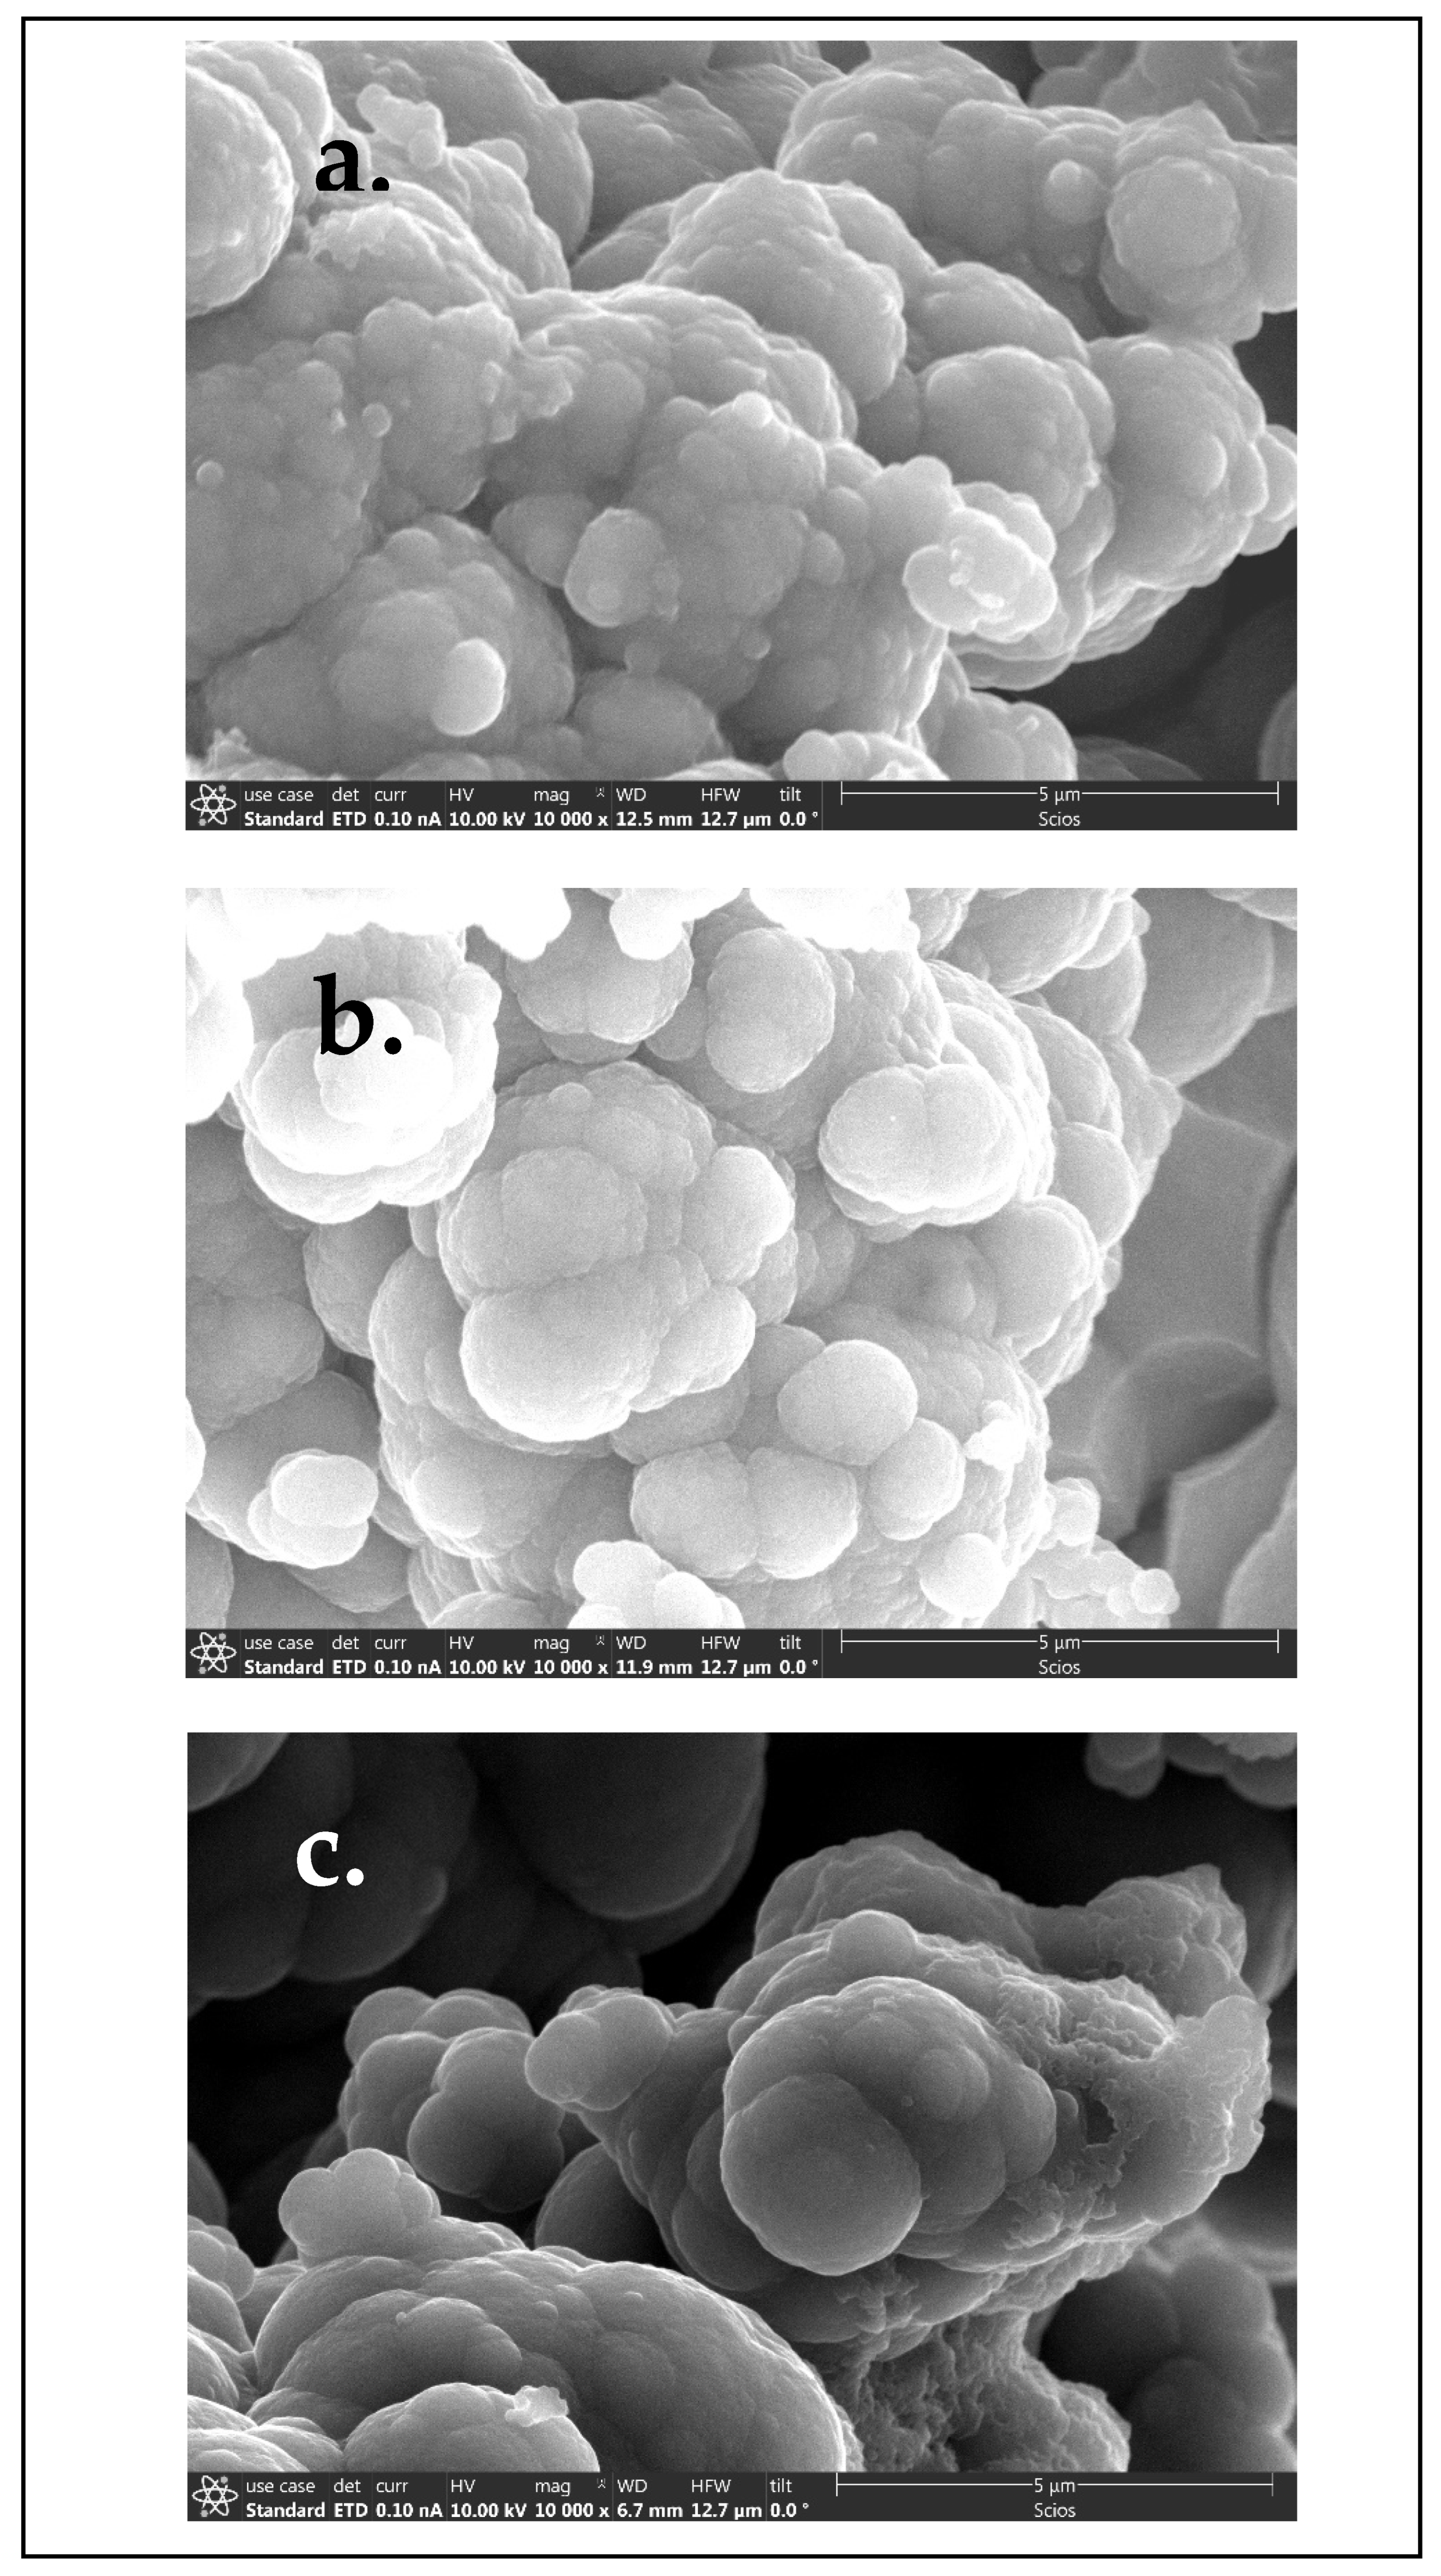
The higher magnification image at 10,000× for the electrodeposited PPy/TSA composite (Figure 6c) shows comparatively lower surface features than the electrodeposited PPy/NTSA composite (Figure 6b).

4.2. Cyclic Voltammetry, CV

The CV curves show little or no visible redox peaks for the scan rates of 5–25 mV/s. When 0.5 M PPy was electropolymerized with 0.1 M NDSA and 0.1 M NTSA, respectively, it produced the highest response current of about 40 mA (Figure 7a,b), resulting in higher charge storage (area under the curve). Furthermore, NTSA-doped PPy was determined to possess the highest specific capacitance of 119 F/g and a specific capacity of 34 mAh/g at 5 mV/s. It was also shown to have the highest porous morphology than all the other composite electrodes.
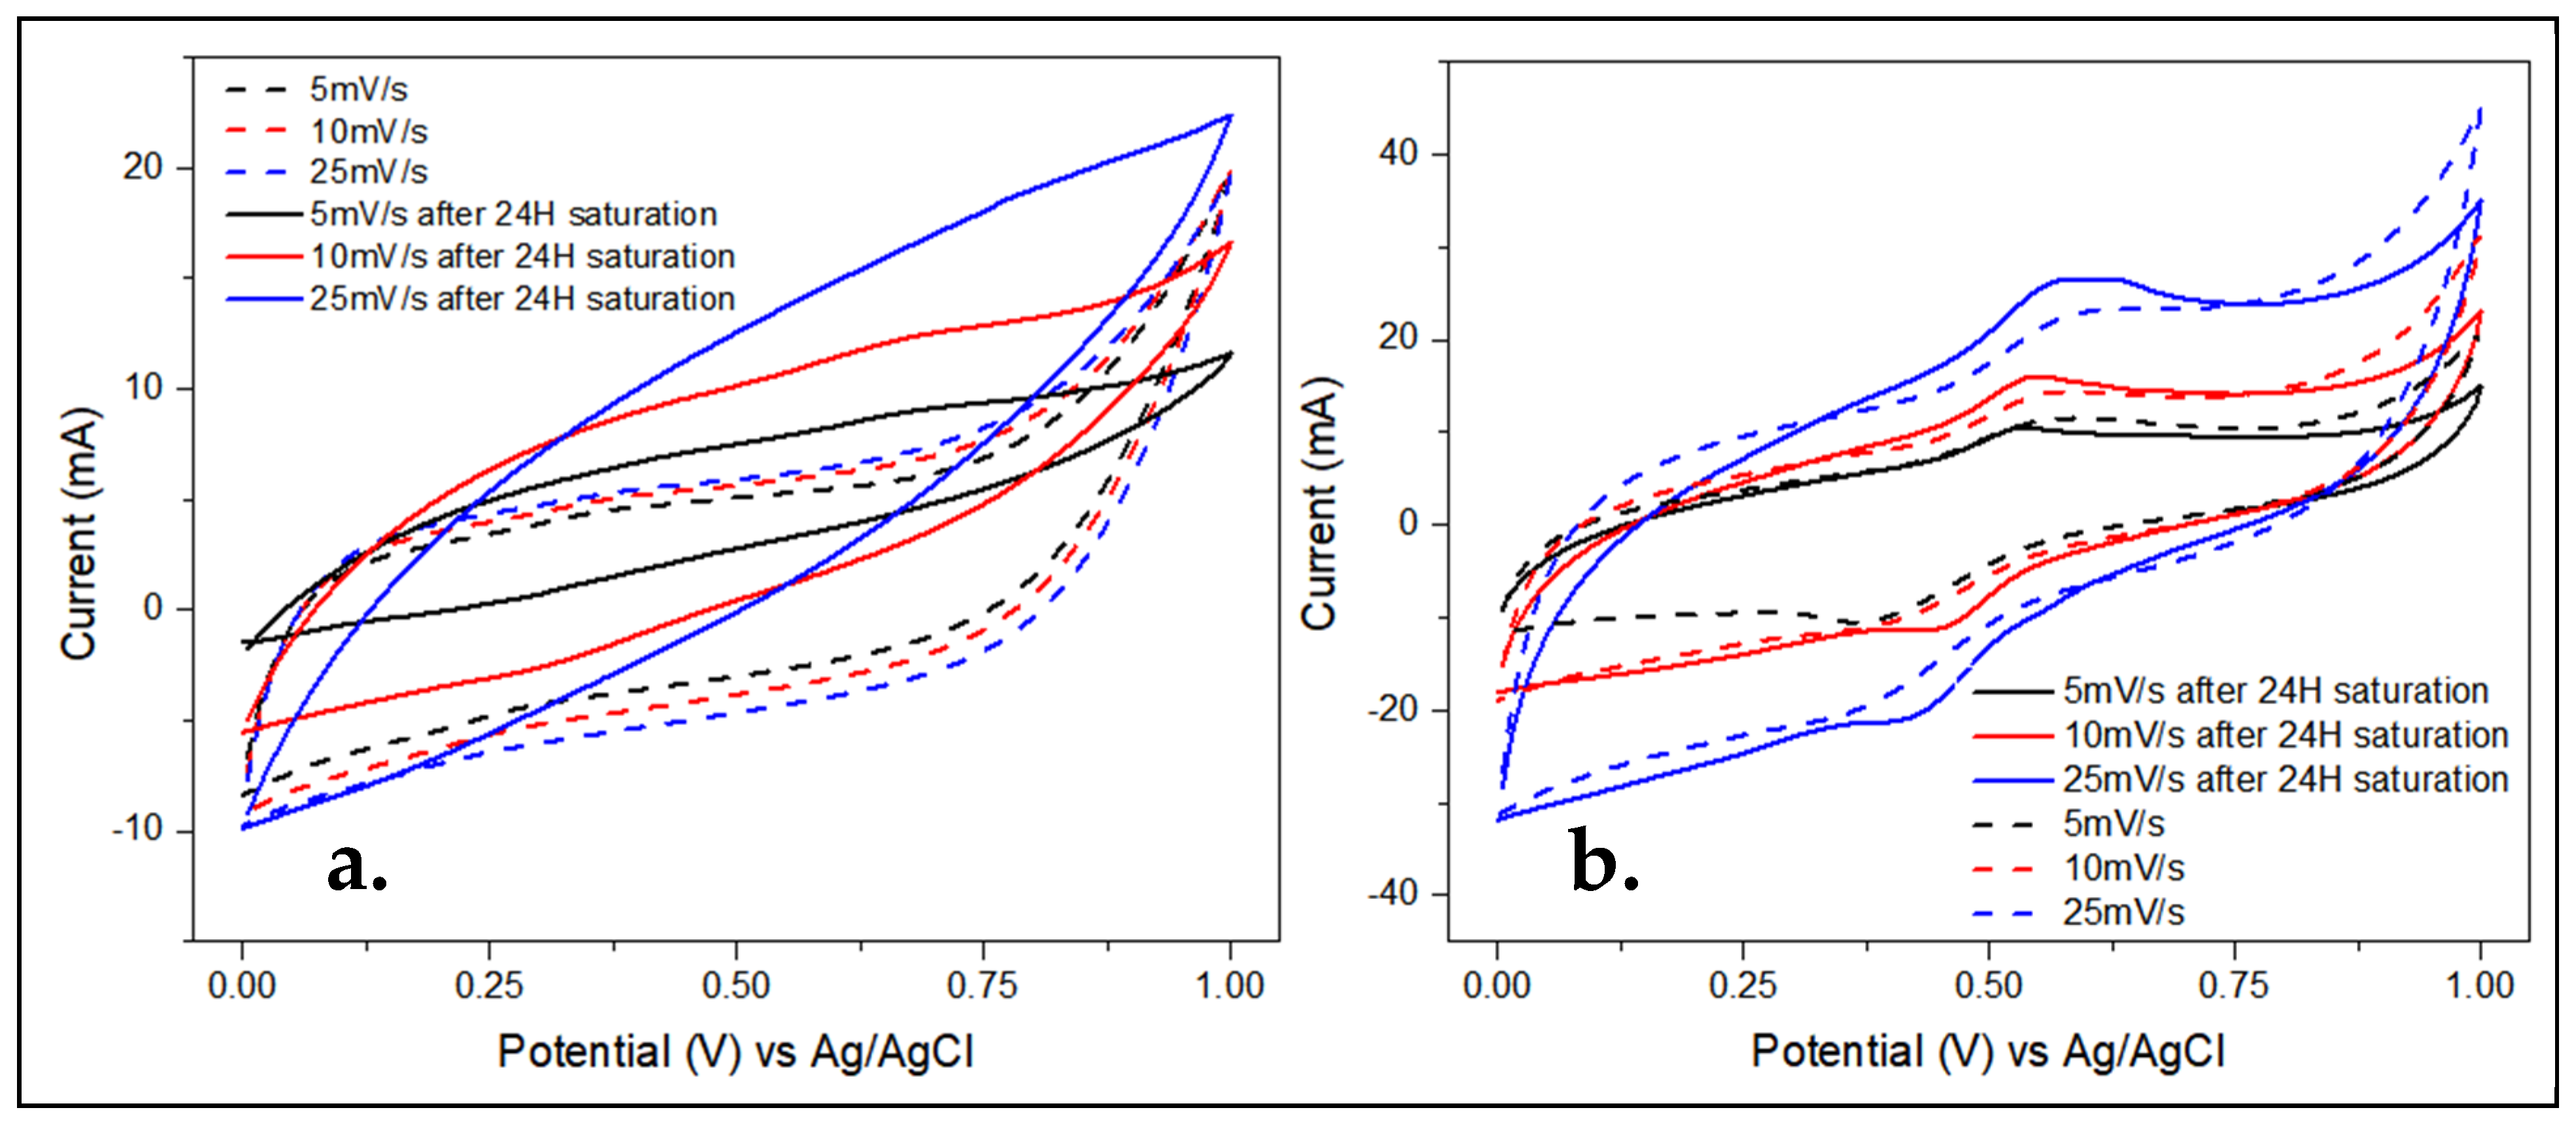
The cyclic voltammetry of PPy/TSA and PPy/NTSA composites electrodeposited on the SWCNT/PI substrate was repeated after immersion of the respective electrode material in a 1 M H2SO4 solution for 24 h, and the results were compared with those obtained using the standard procedure, where the electrode materials were tested after 30 min of immersion in the electrolytic solution (Figure 8a,b). The voltammograms show increased stored charge and a resultant increase in the specific capacitance of the electrode, as shown in Figure 7.
Table 1 A longer time of immersion in the electrolytic solution enables the electrolyte to diffuse more thoroughly into the bulk of porous composite electrode materials, there-by improving both bulk and ionic transport. The composite electrode containing electrodeposited PPy/NTSA layer showed interesting redox peaks between 0.6 and 0.4 V vs. Ag/AgCl, suggesting a pseudosupercapacitive behavior (Figure 8b).

4.3. Galvanic Charge–Discharge Curves

Figure 9 shows, (a,b) the gravimetric charge–discharge curves, (c) the specific capacitance, and (d) the capacitance retention for the electrode materials. Interestingly, the naphthalene trisulfonic acid-based dopant PPy showed the longest discharge time at 0.5 A/g (Figure 9a). The specific capacitance of the composite electrodes containing electrodeposited PPy/NDSA and PPy/NTSA, respectively, decreased with the increasing current densities (Figure 9b). The composite electrode containing electrodeposited PPy/NTSA layer has a lower capacitance retention than that containing PPy/TSA or PPy/DBSA. The SWCNT/PI electrodes coated with electrodeposited PPy/TSA or PPy/DBSA showed a slightly improved capacitance retention with the increasing charge–discharge cycles (Figure 9d).

4.4. Electrochemical Impedance Spectroscopy

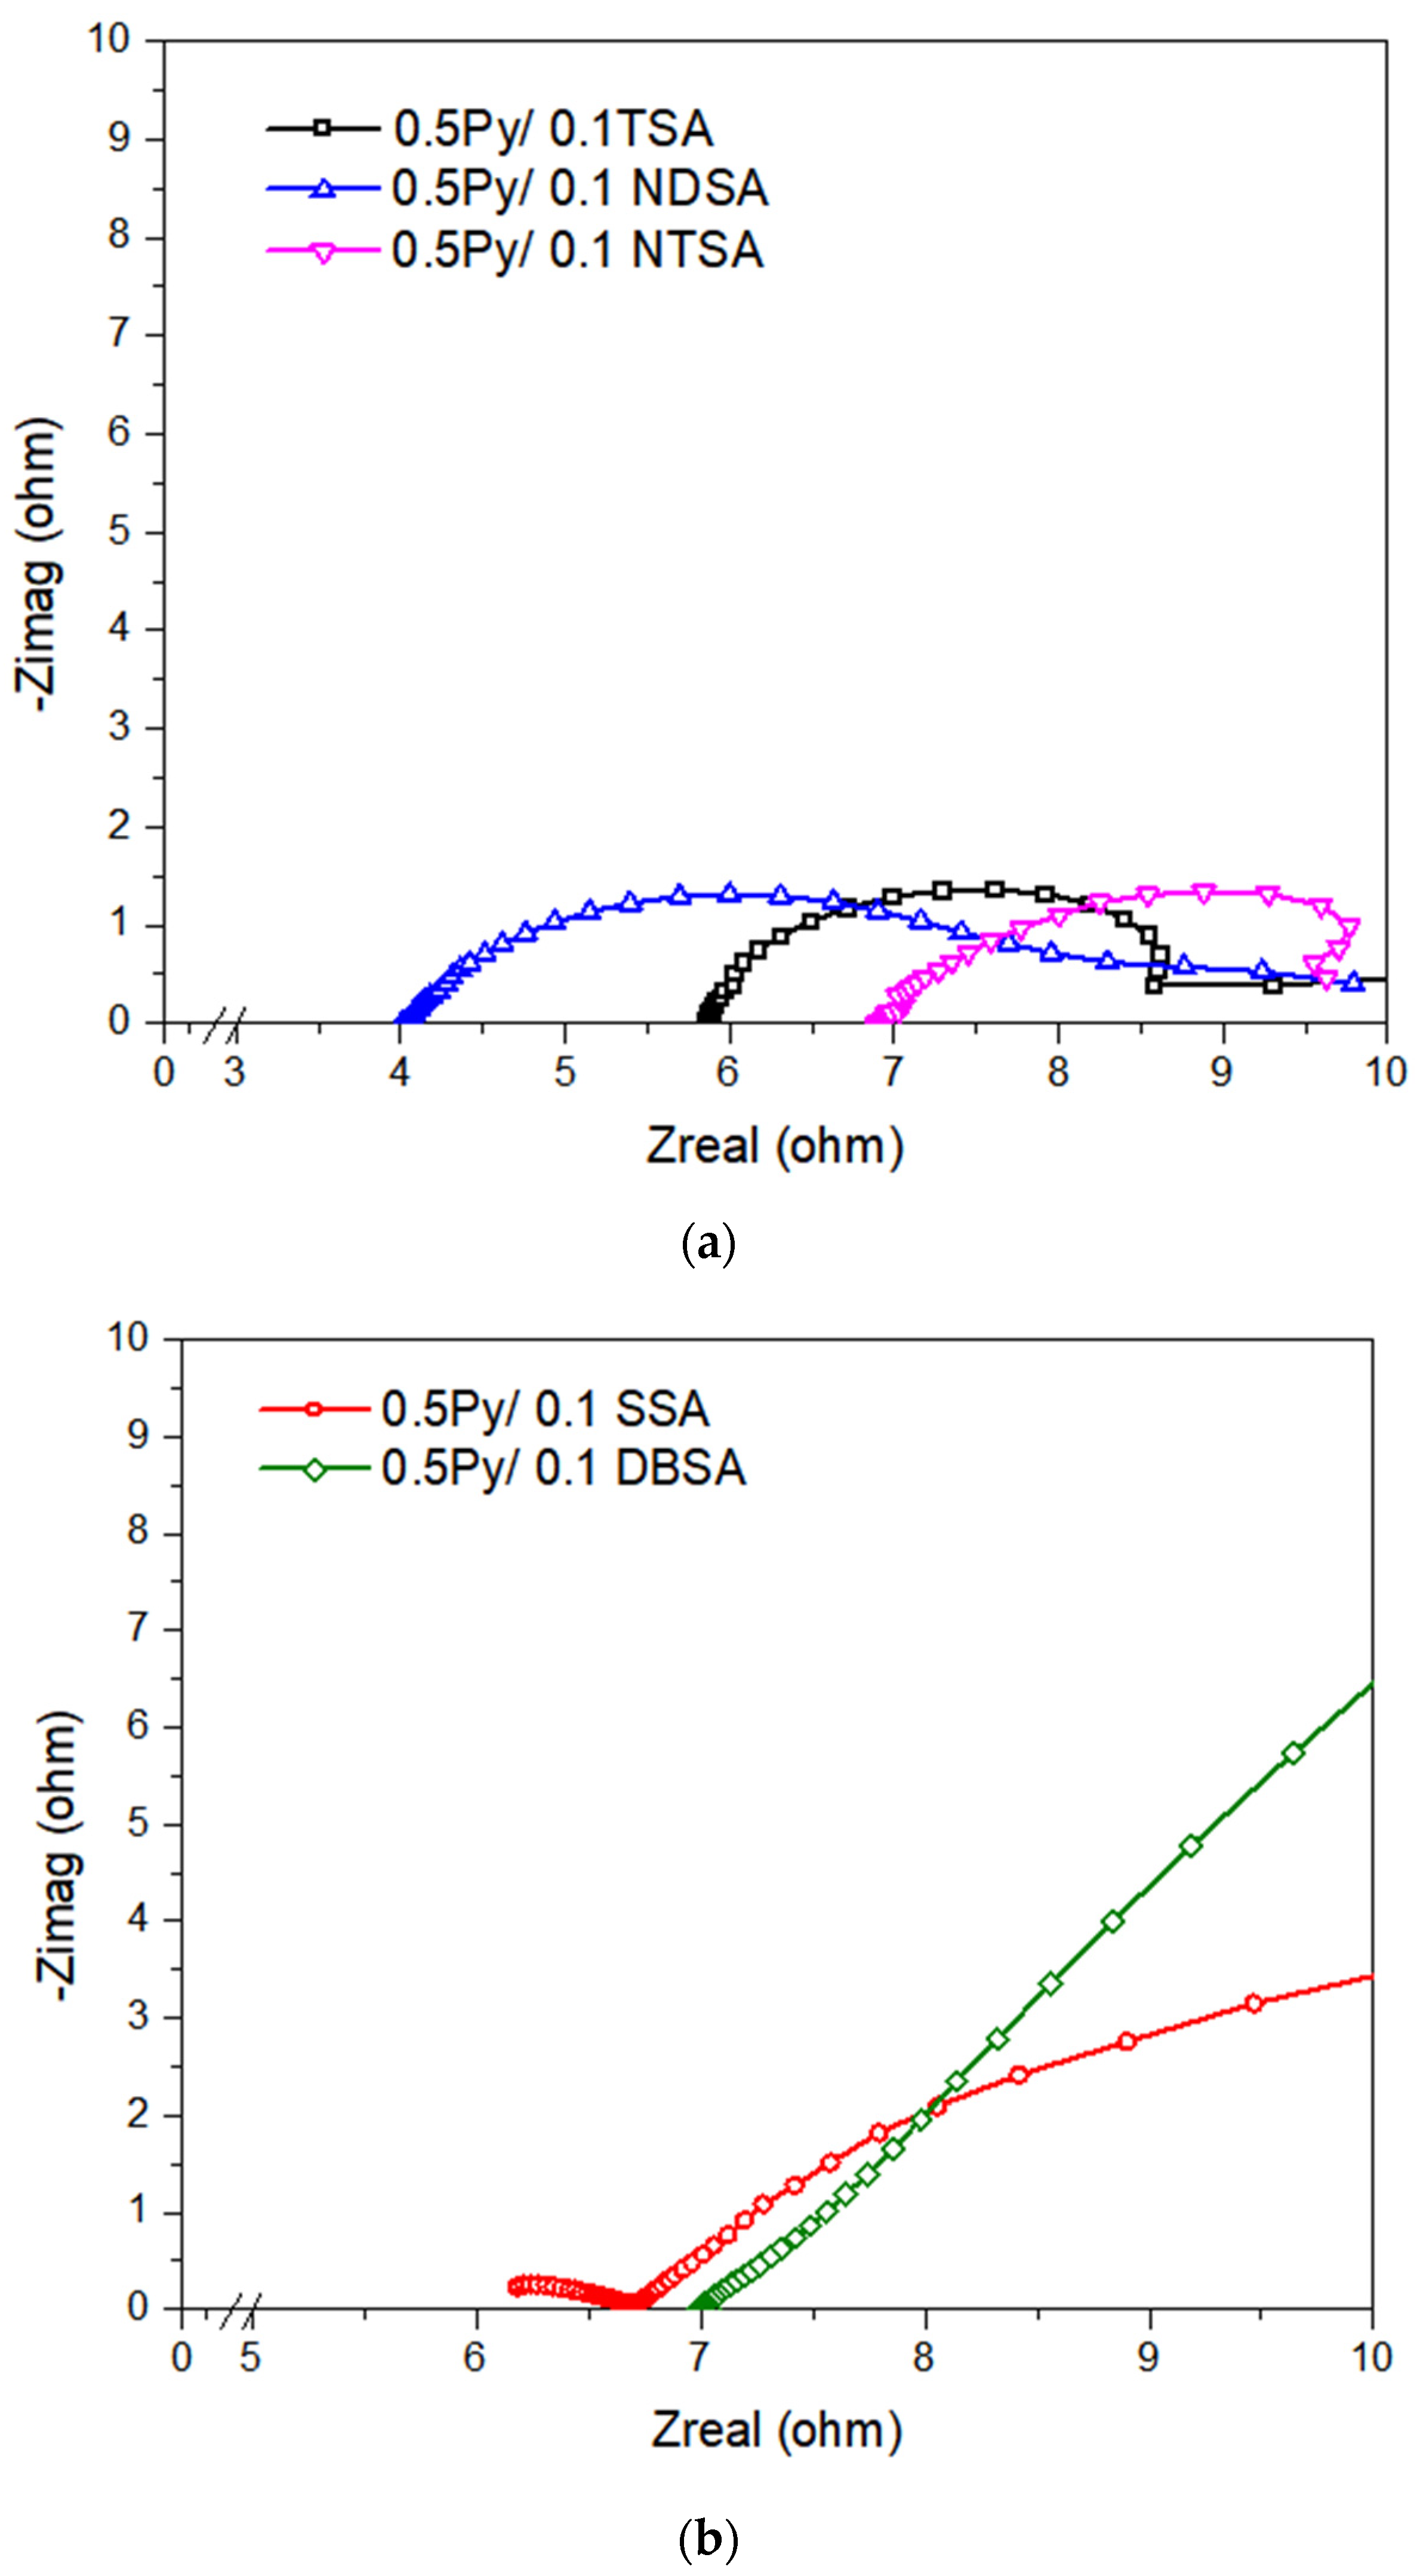
Figure 10 shows the EIS analysis of the electrodes containing, (a) PPy/TSA, PPy/NDSA, and PPy/NTSA; (b) PPy/SSA and PPy/DBSA. It is shown that the electrodes containing PPy/NTSA have low bulk resistance and high conductivity than the others (Figure 10). PPy/DBSA- and PPy/SSA-modified electrodes have high solution resistance. The PPy/TSA- and PPy/NDSA-modified electrodes were subjected to repeated EIS runs in order to determine the effect of exposure time on performance and porosity. The electrode’s theoretical porosity was calculated using Archie’s law and the results are summarized in Table 2.
After 24 h of repeated runs, the PPy/TSA-coated electrode showed a drop in its real impedance and the bulk resistance was lowered due to the creation of more conductive pathways in the bulk electrode (Figure 11a). The Nyquist curve shown in Figure 11b also shows a Warburg closer to 90°, implying a more efficient EDLC behavior compared to the system subjected to less exposure time. The theoretical porosity of the electrodes containing PPy/TSA layer increased from 34.68% to 38.93% due to the increased exposure time (Table 2), thereby allowing for increased interactions between the electrolytic solution and electrode materials.

4.5. Fourier Transform Infrared Spectroscopy

Figure 12a,b show a broad FTIR reflectance peak at about 3522 cm−1, which is attributed to N–H stretching; the peaks around 1170 cm−1 are due to N–C stretching and bending vibrations (more prominent in the NTSA-doped sample), a sharp but shallow peak around 1558 cm−1 is due to the C=C vibration (Table 3). A reflectance peak around 1300 cm−1 is due to the C–N stretching vibration. The sharp peak around 800 cm−1 is due to the aromatic C–H bending. The presence of these peaks indicates that PPy has indeed been deposited on the surface of the electrode material. The FTIR reflectance peaks around 1700 cm−1 are due to the imide carbonyl bands from the SWCNT/PI composite substrate.

4.6. Dynamic Mechanical Analysis, DMA

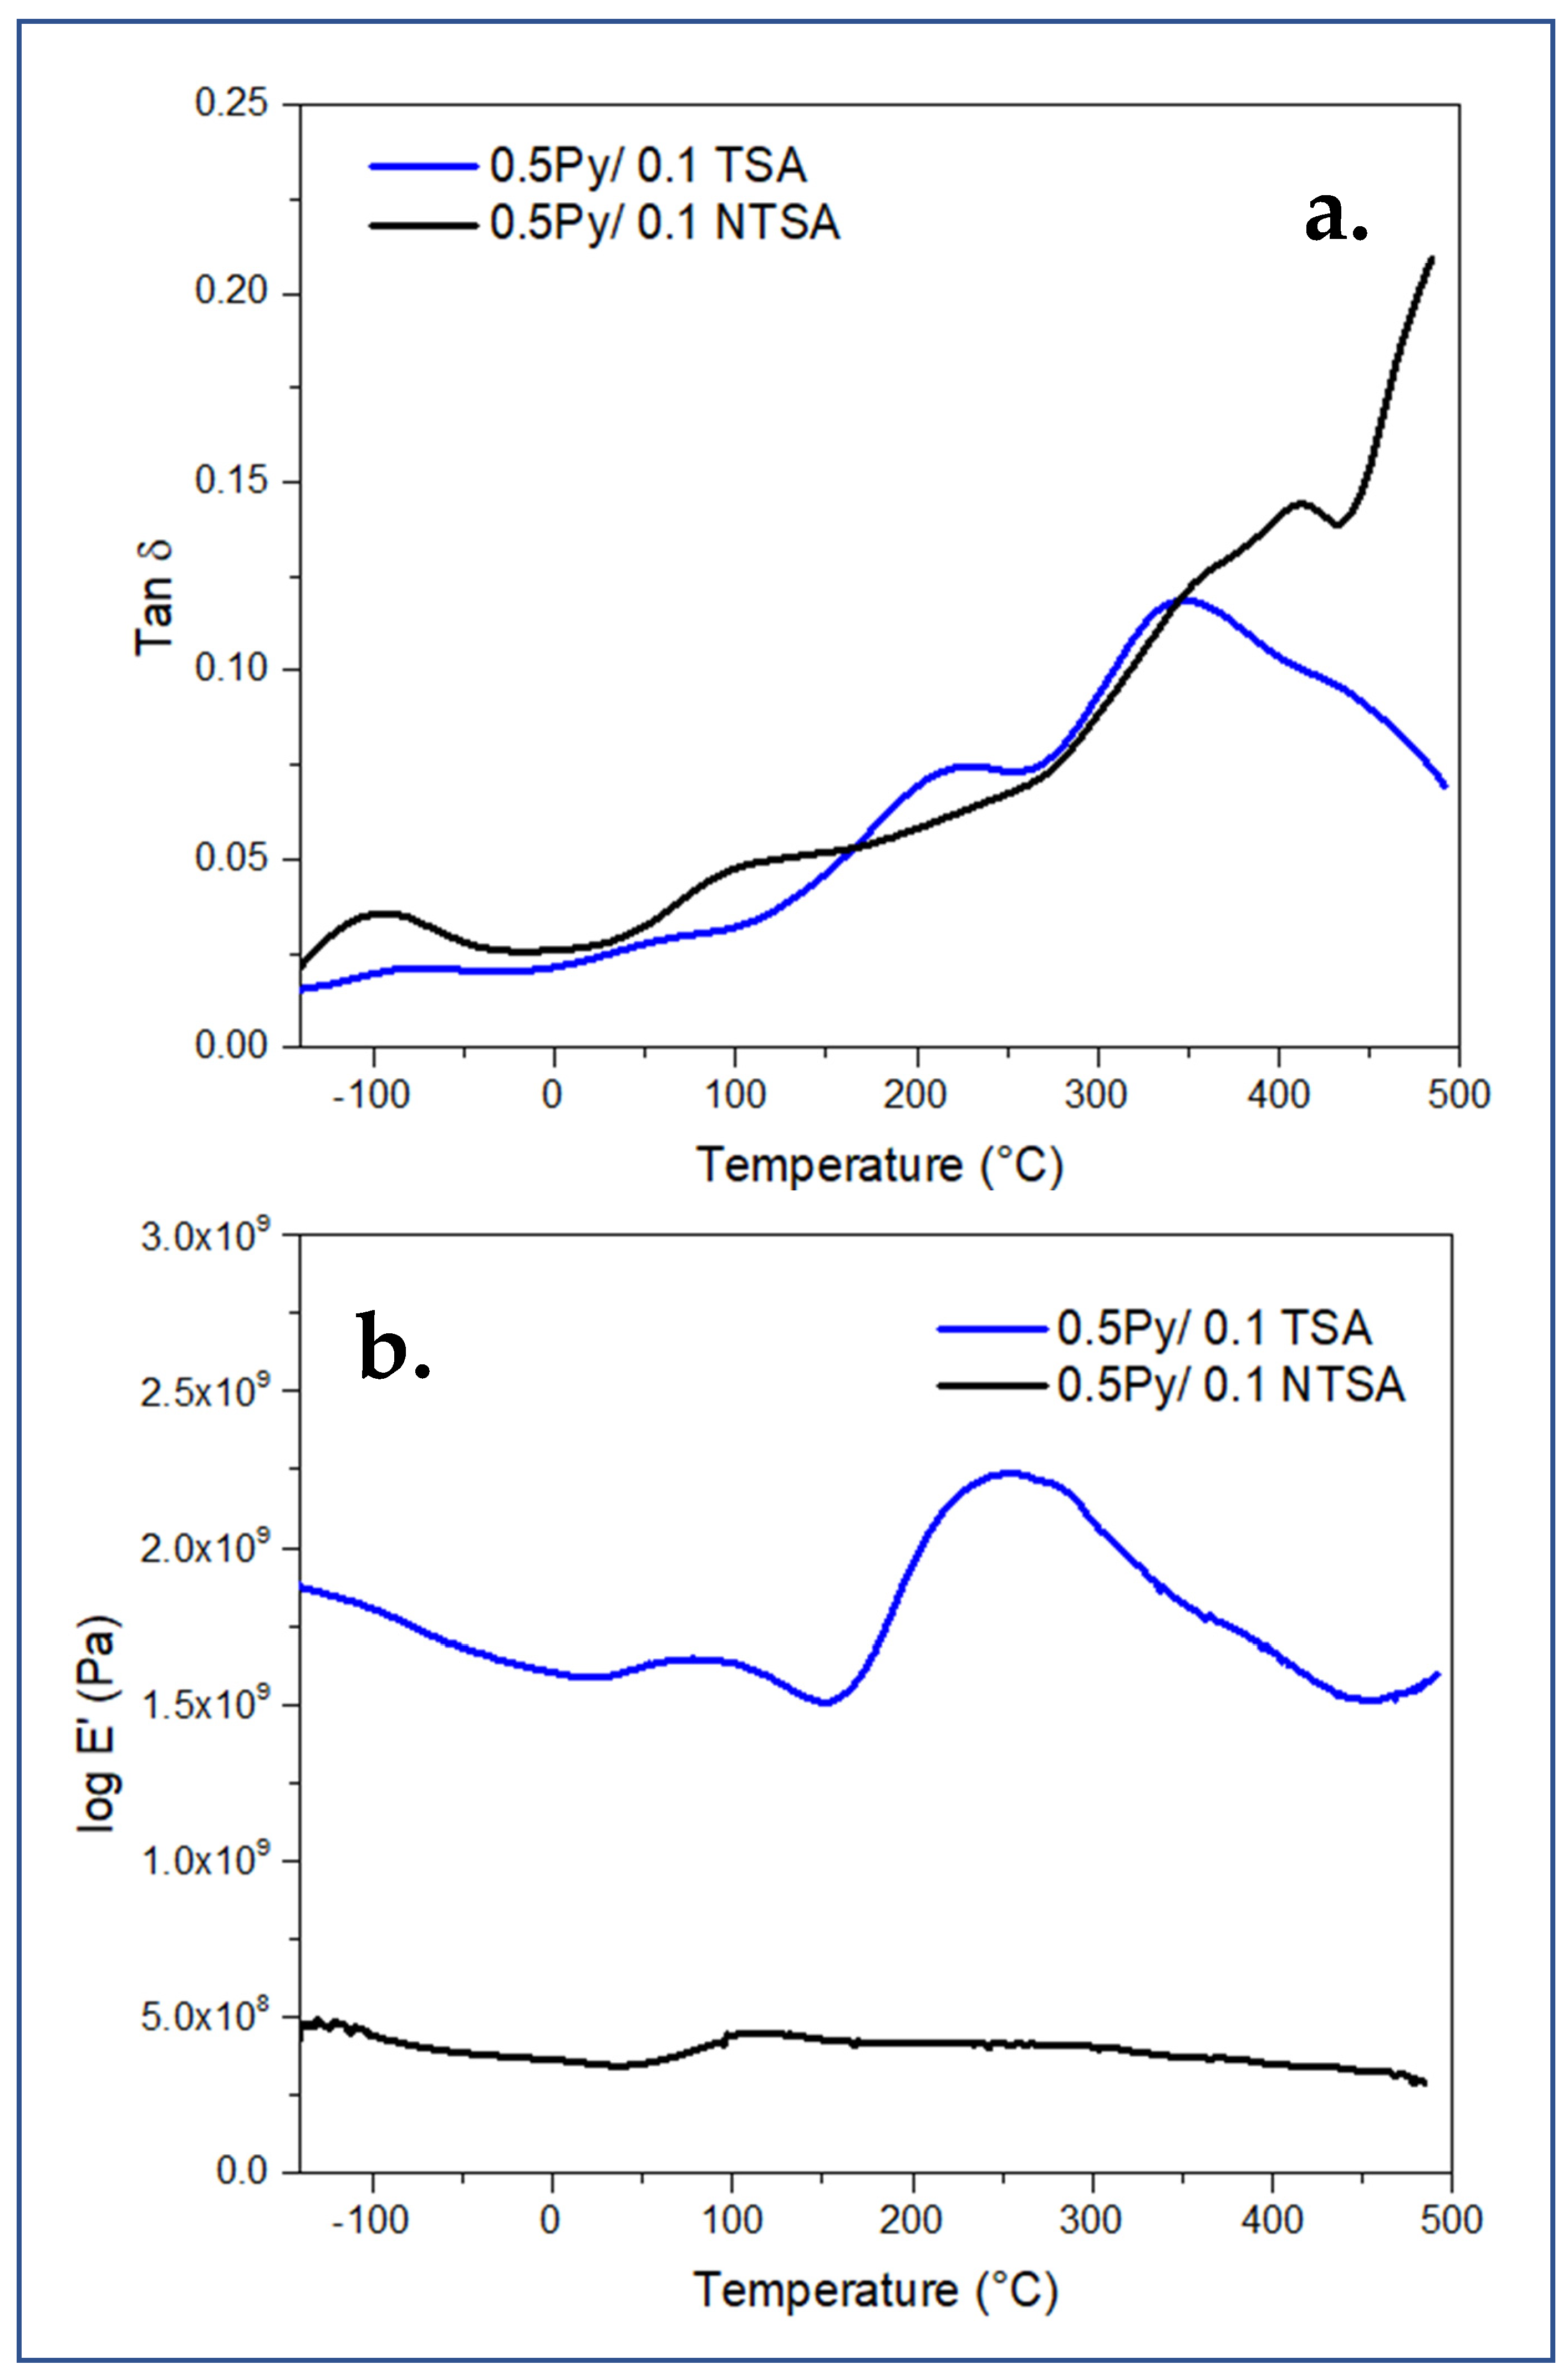
Figure 13 and Figure 14 show the DMA figures for the composite electrodes. DMA analysis shows that the composites have high storage modulus of more than 2 GPa in the temperature range from −140 to 500 °C (Figure 13b). The electrodeposition of doped PPy on the SWCNT/PI nanocomposite substrate improved its viscoelastic properties by slightly lowering the storage modulus, E’, and improving the damping behavior (higher tan delta peak height) (Figure 13a and Figure 14a). The improved damping behavior of the electrodes containing electrodeposited PPy, reflected in the larger tan delta peak area, correlates with an increase in the porosity of the sample [29]. The electrode containing electropolymerized PPy/SSA layer showed a higher storage modulus than the PPy/TSA-coated composites. The results from the DMA are in agreement with the trend in the porosity of the electrodes obtained from EIS and SEM data. The slightly lower storage modulus for the electrodes coated with electrodeposited PPy may be due to the presence of porous structures, which in turn, is reflected in the higher tan delta peak area for the a-transition.
Figure 14 shows that the composite electrode containing electrodeposited PPy/NTSA has a lower storage modulus but higher damping ability and more stable thermomechanical behavior that the composite electrodes coated with PPy/TSA (Figure 14a,b).

4.7. Discussion

Table 4 summarizes the porosity of the electrode materials obtained from the different analysis methods, including EIS, DMA, and SEM. The tan delta peak for the a-transition, obtained from the EIS test, was used to estimate the damping behavior of the electrode material. A large part of the damping behavior of the electrodes is due to the inherent porosity of the electrodes, resulting from the electrodeposited PPy layer. The SEM cross-sectional image of the electrodes was analyzed using ImageJ software and the image thresholds were compared. The ratio of the darker porous regions to the lighter regions where PPy is deposited was estimated and the results are given in Table 4. The results show that the PPy/NTSA-coated composite electrodes had higher porosity than the other electrode materials. The higher porosity of the PPy/NTSA-modified electrode may be due to the higher sulphonic acid to PPy ratio, as well as higher overall effective molecular size of the dopant to PPy repeat unit for the electrodeposited PPy/NTSA composite.

5. Conclusions

Conductive polyimide carbon nanotube composite electrodes were synthesized by solution casting and thermal curing followed by electrodeposition of polypyrrole doped with TSA, NTSA, NDSA, DBSA, and SSA, respectively. All the electrodes show very good compatibility with the electrolyte. The specific capacitance of the composite electrodes coated with electrodeposited PPy, was remarkably higher than that for the substrate, and the highest performing composite electrode was the electrode that was coated with electrodeposited PPy/NTSA, which has a maximum specific capacitance of 119 F/g. FTIR spectra indicated that PPy was electrodeposited on the SWCNT/PI surface. The SEM images also confirmed the successful deposition of PPy on the electrodes. The presence of the electrodeposited PPy increased the porosity of the electrodes.
In addition to the improvement in electrical conductivity by its introduction, the deposition of PPy was shown to affect the surface morphology by fostering increased porosity. The porosity of the electrodes was determined using a modified form of Archie’s law. The increase in porosity of the electrodes correlated with the increased surface area and roughness as well as enabled both bulk and ionic transport in the electrodes.
The size of the dopants is correlated with the morphology of the PPy-modified electrode materials. The SEM micrographs of the electrodes show that an optimum dopant concentration resulted in the creation of more porous channels in the electrodeposited PPy layer, resulting in a significant improvement in the electrochemical properties.

Author Contributions

Conceptualization, J.O.I. and R.G.; methodology, J.O.I. and R.G.; software, R.G.; validation, J.O.I. and R.G.; formal analysis, R.G.; investigation, R.G.; resources, J.O.I.; data curation, R.G.; writing—original draft preparation, R.G.; writing—review and editing, J.O.I. and R.G.; visualization, J.O.I.; supervision, J.O.I.; project administration, J.O.I.; funding acquisition, J.O.I. All authors have read and agreed to the published version of the manuscript.

Funding

This research received no external funding.

Data Availability Statement

Not applicable.

Acknowledgments

The support provided by the Mechanical and Materials Engineering department and the Sensors laboratory in the Chemistry Department is hereby acknowledged.

Conflicts of Interest

The authors declare no conflict of interest.

References

  1. Wang, Y.; Fu, X.; Zheng, M.; Zhong, W.H.; Cao, G. Strategies for Building Robust Traffic Networks in Advanced Energy Storage Devices: A Focus on Composite Electrodes. Adv. Mater. 2019, 31, 1804204. [Google Scholar] [CrossRef] [PubMed]
  2. Kuang, Y.; Chen, C.; Kirsch, D.; Hu, L. Thick Electrode Batteries: Principles, Opportunities, and Challenges. Adv. Energy Mater. 2019, 9, 1901457. [Google Scholar] [CrossRef]
  3. Zhu, Y.; Peng, L.; Chen, D.; Yu, G. Intercalation Pseudocapacitance in Ultrathin VOPO4 Nanosheets: Toward High-Rate Alkali-Ion-Based Electrochemical Energy Storage. Nano Lett. 2016, 16, 742–747. [Google Scholar] [CrossRef] [PubMed]
  4. Peng, L.; Xiong, P.; Ma, L.; Yuan, Y.; Zhu, Y.; Chen, D.; Luo, X.; Lu, J.; Amine, K.; Yu, G. Holey two-dimensional transition metal oxide nanosheets for efficient energy storage. Nat. Commun. 2017, 8, 15139. [Google Scholar] [CrossRef]
  5. Yuan, R.; Bi, W.; Zhou, T.; Zhang, N.; Zhong, C.; Chu, W.; Yan, W.; Xu, Q.; Wu, C.; Xie, Y. Two-Dimensional Hierarchical Fe-N-C Electrocatalyst for Zn-Air Batteries with Ultrahigh Specific Capacity. ACS Mater. Lett. 2020, 2, 35–41. [Google Scholar] [CrossRef]
  6. Zeng, Z.; Fu, G.; Yang, H.B.; Yan, Y.; Chen, J.; Yu, Z.; Gao, J.; Gan, L.Y.; Liu, B.; Chen, P. Bifunctional N-CoSe2/3D-MXene as Highly Efficient and Durable Cathode for Rechargeable Zn-Air Battery. ACS Mater. Lett. 2019, 1, 432–439. [Google Scholar] [CrossRef]
  7. Shi, B.; Shang, Y.; Pei, Y.; Pei, S.; Wang, L.; Heider, D.; Zhao, Y.Y.; Zheng, C.; Yang, B.; Yarlagadda, S.; et al. Low Tortuous, Highly Conductive, and High-Areal-Capacity Battery Electrodes Enabled by Through-thickness Aligned Carbon Fiber Framework. Nano Lett. 2020, 20, 5504–5512. [Google Scholar] [CrossRef]
  8. Sun, H.; Mei, L.; Liang, J.; Zhao, Z.; Lee, C.; Fei, H.; Ding, M.; Lau, J.; Li, M.; Wang, C.; et al. Three-dimensional holey-graphene/niobia composite architectures for ultrahigh-rate energy storage. Science 2017, 356, 599–604. [Google Scholar] [CrossRef]
  9. Conway, B.E. Electrochemical Supercapacitors: Scientific Fundamentals and Technological Applications; Plenum Press: New York, NY, USA, 1999; ISBN 9780306457364. [Google Scholar]
  10. Yu, D.; Dai, L. Self-assembled graphene/carbon nanotube hybrid films for supercapacitors. J. Phys. Chem. Lett. 2010, 1, 467–470. [Google Scholar] [CrossRef]
  11. Wu, G.; Tan, P.; Wang, D.; Li, Z.; Peng, L.; Hu, Y.; Wang, C.; Zhu, W.; Chen, S.; Chen, W. High-performance Supercapacitors Based on Electrochemical-induced Vertical-aligned Carbon Nanotubes and Polyaniline Nanocomposite Electrodes. Sci. Rep. 2017, 7, 43676. [Google Scholar] [CrossRef]
  12. Lewandowski, A.; Olejniczak, A.; Galinski, M.; Stepniak, I. Performance of carbon-carbon supercapacitors based on organic, aqueous and ionic liquid electrolytes. J. Power Sources 2010, 195, 5814–5819. [Google Scholar] [CrossRef]
  13. Samantara, A.K.; Ratha, S. Materials Development for Active/Passive Components of a Supercapacitor Background, Present Status and Future Perspective; Springer: Berlin/Heidelberg, Germany, 2018. [Google Scholar] [CrossRef]
  14. Simpson, C. Characteristics of Rechargeable Batteries, Texas Instruments, Literature Number: SNVA533. Snva533. 2011. Available online: https://pdf4pro.com/view/characteristics-of-rechargeable-batteries-1f813a.html (accessed on 20 August 2023).
  15. Moyseowicz, A.; Gryglewicz, G. High-performance hybrid capacitor based on a porous polypyrrole/reduced graphene oxide composite and a redox-active electrolyte. Electrochim. Acta 2020, 354, 136661. [Google Scholar] [CrossRef]
  16. Khare, R.; Bose, S. Carbon Nanotube Based Composites—A Review. J. Miner. Mater. Charact. Eng. 2005, 4, 31–46. [Google Scholar] [CrossRef]
  17. He, H.; Tu, Y.; Li, J.; Lin, Y.; Chen, J. Porous Polyimide and Carbon Nanotubes: Solvent Vapor–Induced Transformation in the Nanochannels of Anodic Aluminum Oxide Templates. Macromol. Mater. Eng. 2019, 304, 1800700. [Google Scholar] [CrossRef]
  18. Bandaru, P.R. Electrical properties and applications of carbon nanotube structures. J. Nanosci. Nanotechnol. 2007, 7, 1239–1267. [Google Scholar] [CrossRef]
  19. Thuau, D.; Koutsos, V.; Cheung, R. Electrical and mechanical properties of carbon nanotube-polyimide composites. J. Vac. Sci. Technol. B Microelectron. Nanom. Struct. 2009, 27, 3139. [Google Scholar] [CrossRef]
  20. Wang, H.; Yi, H.; Chen, X.; Wang, X. Asymmetric supercapacitors based on nano-architectured nickel oxide/graphene foam and hierarchical porous nitrogen-doped carbon nanotubes with ultrahigh-rate performance. J. Mater. Chem. A 2014, 2, 3223–3230. [Google Scholar] [CrossRef]
  21. Ansaldo, A.; Bondavalli, P.; Bellani, S.; Del Rio Castillo, A.E.; Prato, M.; Pellegrini, V.; Pognon, G.; Bonaccorso, F. High-power graphene–Carbon nanotube hybrid supercapacitors. ChemNanoMat 2017, 3, 436–446. [Google Scholar] [CrossRef]
  22. Zhang, L.; Shi, G. Preparation of highly conductive graphene hydrogels for fabricating supercapacitors with high rate capability. J. Phys. Chem. C 2011, 115, 17206–17212. [Google Scholar] [CrossRef]
  23. Kareem, A.A. Preparation and electrical properties of polyimide/carbon nanotubes composites. Mater. Sci. Pol. 2017, 35, 755–759. [Google Scholar] [CrossRef]
  24. Dong, Z.H.; Wei, Y.L.; Shi, W.; Zhang, G.A. Characterisation of doped polypyrrole/manganese oxide nanocomposite for supercapacitor electrodes. Mater. Chem. Phys. 2011, 131, 529–534. [Google Scholar] [CrossRef]
  25. Iroh, J.O.; Levine, K. Electrochemical synthesis of polypyrrole/polyimide conducting composite using a polyamic acid precursor. Eur. Polym. J. 2002, 38, 1547–1550. [Google Scholar] [CrossRef]
  26. Tian, F.; Zhang, Y.; Liu, L.; Zhang, Y.; Shi, Q.; Zhao, Q.; Cheng, Y.; Zhou, C.; Yang, S.; Song, X. Spongy p-Toluenesulfonic Acid-doped Polypyrrole with Extraordinary Rate Performance as Durable Anodes of Sodium-Ion Batteries at Different Temperatures. Langmuir 2020, 36, 15075–15081. [Google Scholar] [CrossRef] [PubMed]
  27. Neithalath, N.; Weiss, J.; Olek, J. Characterizing Enhanced Porosity Concrete using electrical impedance to predict acoustic and hydraulic performance. Cem. Concr. Res. 2006, 36, 2074–2085. [Google Scholar] [CrossRef]
  28. Tully-Dartez, S.; Cardenas, H.E.; Sit, P.F.S. Pore characteristics of chitosan scaffolds studied by electrochemical impedance spectroscopy. Tissue Eng.-Part C Methods 2010, 16, 339–345. [Google Scholar] [CrossRef]
  29. Stamatopoulos, K.M.; Chondrou, I.T.; Panteliou, S.D. Damping associated with porosity in porous rectangular plates. Civil-Comp Proc. 2008, 88, 115. [Google Scholar] [CrossRef]
Figure 1. Chemical structures of organic acid dopants used in this study.
Energies 16 07462 g001
Figure 2. Three-electrode electrochemical cell configuration used to conduct the electrochemical tests.
Energies 16 07462 g002
Figure 3. A typical Nyquist plot and an electrical circuit model with a Warburg element.
Energies 16 07462 g003
Figure 4. SEM images of electrodeposited, (a) 0.5 M Py/0.1 M NDSA, (b) 0.5 M Py/0.1 M NTSA, (c) cross-section of electrodeposited 0.5 Py/0.1 NTSA, showing uniform layers of Py/NTSA on both sides of the SWCNT/PI substrate, (d) magnified image showing an interaction between PPy/NTSA and SWCNT/PI.
Energies 16 07462 g004
Figure 5. Cross-sectional SEM view at 250ꓫ of depositions for (a) 0.5 M Py/0.1 M TSA and (b) 0.5 M Py/0.1 M NTSA.
Energies 16 07462 g005
Figure 6. SEM images at 10,000× of the top surface of (a) 0.5 M Py/0.1 M NDSA, (b) 0.5 M Py/0.1 M NTSA, and (c) 0.5 M Py/0.1 M TSA.
Energies 16 07462 g006
Figure 7. (a) Cyclic voltammograms of PPy electrodeposited on the SWCNT/PI substrate at 25 mV/s for all dopants, (b) CV of highest electrochemically performing dopant—NTSA at 5, 10, and 25 mV/s, (c) dependence of specific capacitance on the scan rates for all samples, (d) dependence of specific capacity on the scan rates for all samples.
Energies 16 07462 g007
Figure 8. Comparison of the voltammograms for (a) TSA- and (b) NTSA-doped PPy electrodeposited on the SWCNT/PI substrate after 24 h (solid lines) of immersion in the electrolytic solution (1 M H2SO4). The discontinuous lines show the voltammograms for the electrode materials immersed in the electrolytic solution for 30 min before the CV test.
Energies 16 07462 g008
Figure 9. Charge–discharge profiles of, (a) all dopants (0.1 M) in 0.5 M Py at 0.5 A/g, (b) NTSA-doped PPy at current densities of 0.5, 1, and 5 A/g, (c) summary of specific capacitance obtained at different current densities, (d) overview of capacitance retention of all dopants used to electrodeposit PPy on the SWCNT/PI substrate.
Energies 16 07462 g009
Figure 10. Nyquist plot showing the effect of dopants (a) 0.1 M TSA, NDSA, and NTSA as well as (b) 0.1 M SSA and DBSA on the electrochemical behavior of PPy composites.
Energies 16 07462 g010
Figure 11. Nyquist plot for the composite electrodes after continuous testing for 24 h in 1 M H2SO4 solution, compared with the composite electrodes tested only once, after 30 min of exposure (a), and an expanded version of the Nyquist plot for PPy/NTSA electrode after 24 h of continuous testing in the electrolytic solution (b).
Energies 16 07462 g011
Figure 12. FTIR spectra of the dopant systems tested, (a) PPy/NTSA (top), PPy/SSA (middle), PPy/TSA (bottom); (b) PPy/NDSA (top), PPy/DBSA (middle), SWCNT/PI substrate (bottom). The concentration ratio of PPy/dopant is 0.5 M/0.1 M in all cases.
Energies 16 07462 g012
Figure 13. DMA traces showing, (a) tan delta and, (b) E’ as a function of composition and temperature in the temperature range of −140–500 °C at a frequency of 1 Hz.
Energies 16 07462 g013
Figure 14. DMA traces showing (a) tan delta and (b) storage modulus for the composite electrodes as a function of composition and temperature for tests carried out in the temperature range of −140–500 °C at 1 Hz.
Energies 16 07462 g014
Table 1. Summary of specific capacitance for the TSA-doped system after electrolyte saturation.
Scan Rate (mV/s)30 min Saturation (F/g)24 h Saturation (F/g)
584.8896.10
1050.3799.53
2522.9549.90
Table 2. Theoretical porosity was calculated using EIS, incorporating Archie’s law. * refers to data obtained after 24 h of immersion.
SampleTheoretical Porosity (%)
0.5 PPy/0.1 TSA34.68
0.5 PPy/0.1 TSA 24 h38.93 *
0.5 PPy/0.1 NDSA31.60
0.5 PPy/0.1 NDSA 24 h43.10 *
0.5 PPy/0.1 NTSA39.91
0.5 PPy/0.1 DBSA3.89
0.5 PPy/0.1 SSA13.22
Table 3. Characteristic FTIR peaks.
Characteristic Wavenumber (cm−1)Functional Group
3500–3300N–H amine stretch
1700C=C aromatic bending
1561–1531C=C/C–C stretching
1300C–N stretching
1170N–C stretch bending
860C–H bending
739C=O bending
Table 4. Summary of porosity-related calculations using different methods.
SampleTheoretical Porosity—EIS (%)Tan Delta Peak AreaSEM Image Analysis (%)
0.5 PPy 0.1 TSA34.6811.0515.01
0.5 PPy 0.1 NTSA39.9112.8720.79
0.5 PPy 0.1 SSA13.227.55N/A
Disclaimer/Publisher’s Note: The statements, opinions and data contained in all publications are solely those of the individual author(s) and contributor(s) and not of MDPI and/or the editor(s). MDPI and/or the editor(s) disclaim responsibility for any injury to people or property resulting from any ideas, methods, instructions or products referred to in the content.