Abstract
Nontechnical losses of electrical energy (NTLEE) have been a persistent issue in both the Russian and global electric power industries since the end of the 20th century. Every year, these losses result in tens of billions of dollars in damages. Promptly identifying unscrupulous consumers can prevent the onset of NTLEE sources, substantially reduce the amount of NTLEE and economic damages to network grids, and generally improve the economic climate. The contemporary advancements in machine learning and artificial intelligence facilitate the identification of NTLEE sources through anomaly detection in energy consumption data. This article aims to analyze the current efficacy of computational methods in locating, detecting, and identifying nontechnical losses and their origins, highlighting the application of neural network technologies. Our research indicates that nearly half of the recent studies on identifying NTLEE sources (41%) employ neural networks. The most utilized tools are convolutional networks and autoencoders, the latter being recognized for their high-speed performance. This paper discusses the main metrics and criteria for assessing the effectiveness of NTLEE identification utilized in training and testing phases. Additionally, it explores the sources of initial data, their composition, and their impact on the outcomes of various algorithms.
1. Introduction
Nontechnical losses of electrical energy (NTLEE) are mainly associated with an underestimation of electric energy (EE) released from the networks of the electric grid organization (EGO). NTLEE lead to a decrease in financial revenues from EE transmission services and to an increase in fees for EE losses, which creates damage to EGO and undermines their economy. Such losses are caused by unaccounted and noncontractual consumption, errors and malfunctions of electric power measurement systems (EPMS), or errors in invoicing.
In this article, nontechnical losses of electrical energy (NTLEE) refers to the difference between the input and output values of electrical energy on a section of the electrical network, minus the technical losses of EE caused by the conversion of EE into thermal energy, mechanical energy (like vibrations, noise), and other forms of natural dispersion. NTLEE are primarily associated with the supply of electric energy released from the networks of an electrical grid organization. NTLEE lead to a decrease in financial revenues from services for the transfer of EE and an increase in fees for EE losses, which damages energy supply organizations and undermines their economy.
Identifying NTLEE and sourcing them is a classic task in both the Russian and global electric power industry, retaining its relevance since the end of the 20th century. The annual damage resulting from NTLEE is estimated at tens of billions of dollars globally [1] and billions of rubles in the Russian Federation [2].
In the Russian Federation, NTLEE, in terms of the volume supplied to the distribution network, varies from 0.06% [3] to over 25% [4], depending on the region and the electric grid organization. In countries undergoing difficult socioeconomic and sociopolitical circumstances, relative nontechnical losses can constitute a large percentage of the electricity distributed, reaching up to 60% in Libya and 22% in Iraq [5]. These losses stem from widespread unauthorized EE consumption, either bypassing existing accounting tools or in their complete absence. Meanwhile, even in countries with robust accounting for energy resources and socioeconomic stability like China, Japan, or Germany, the relative values of NTLEE have only decreased to a range of 4.0–5.5% [6]. These figures cannot solely be attributed to the approximated 1.0% error margin of modern EE accounting tools. Main culprits include sudden and hidden failures of EE metering devices and systems, transmission and reception failures over unreliable communication channels, and fraudulent consumption by unscrupulous entities [6,7,8].
Timely identification and mitigation of these issues halt the systematic emergence of NTLEE sources, preventing their persistence and substantially reducing NTLEE values. This positively influences the cost of electrical energy in power systems and the overarching economic climate. Historical analysis reveals that the initial installation of EE meters could exponentially reduce NTLEE by 1.9–2.6 times over 10–15 years [9], equating to a reduction from 18–24% to 8–11% in developing countries, and from 10–12% to 4–5% in developed nations [1,2]. Nonetheless, the decline in NTLEE has plateaued; stricter accuracy requirements and the broad implementation of auxiliary EE accounting tools have not materialized, leading to undesirable capital inflows into the network. This proves unprofitable for energy supply firms, imposing an extra financial burden on EE consumers. Therefore, there is a pressing need for fundamentally diverse approaches to NTLEE identification, involving computational and analytical methodologies.
The objective of this article is to analyze the present efficacy of informational methods used in the search, detection, and identification of NTLEE and in determining their sources. Modern advancements in the fields of mathematics, informatics, cybernetics, along with machine learning and artificial intelligence methodologies, facilitate the identification of NTLEE sources through the detection of anomalies in EE consumption data [6]. These developments contributed to the resurgence in the popularity of information methods for pinpointing NTLEE between 2020 and 2023, building on simple rules of thumb previously used in practice. Since 2021, the Russian Federation has employed software platforms and complexes leveraging machine learning techniques to detect NTLEE [10,11]. Similar trends are evident in other nations [12]. Nonetheless, these IT solutions, while nonspecialized and primarily devised to engage with a user audience and undertake socio–geo analytics, do not account for the attributes requisite for addressing the technical and technological aspects of EE accounting. Thus, this work aims to compare the foundational mathematical methods used in NTLEE analysis and to assess their operational settings.
In the existing classification, computational and analytical methods for identifying NTLEE are divided into two principal categories [8]: schematic [13,14] and informational methods explored in this article.
Schematic approaches hinge on controlling EE balances and calculating technical losses through electrical ratios. These require details on the electrical network topology and replacement circuit parameters. While these methods boast high sensitivity and the capacity to pinpoint systematic NTLEE, they necessitate complete and reliable source data. Proving effective in networks exceeding 35 kV, where network replacement scheme parameters are well defined and the electrical network possesses limited connectivity and branching, they allow for dual EE accounting and mitigate the likelihood of unauthorized connections. However, implementing these methods broadly in 6–10 kV networks, and especially in 0.4 kV networks, poses challenges due to extensive network lengths and branching, the prevalence of diverse accounting tools, and significant errors in the parameters of such networks’ replacement schemes.
In turn, information methods are methods based on the identification of patterns and anomalies in the power consumption of the final consumer of EE. The advantages of these methods include the fact that they do not require information about network parameters and can be used in the absence of a balance counter. The data source and the basis for the analysis are consumption data. This information is easier to obtain than network characteristics or measurements of operating parameters. The disadvantages of such methods are the need for a large sample of initial data and an unobvious choice of empirical patterns that ensure the identification of NTLEE. Nevertheless, modern EE accounting tools allow for the collection of synchronized high-precision measurements of EE consumption at half-hour intervals, storing this information, as well as measuring of electrical mode parameters. The integration of such systems benefits from the support of the government and network companies, as it is being implemented today in the Russian Federation according to the Government Decree of 19 June 2020. N 890 changes the approach to the identification of NTLEE. In these conditions, the volume of available data ceases to be an obstacle to the application of the information approach, and the methods of machine learning and artificial intelligence allow for automating the assessment of the power consumption profile. Such methods make it possible to identify complex and nontrivial patterns in the change in users’ power consumption, detecting periods of time of the probable existence of the NTLEE. Empirical information methods, in fact, are often hybrid, combining information and schematic methods. Information methods have the potential for application in 6–10 kV networks and especially 0.4 kV.
Before proceeding to the description and analysis of methods for identifying NTLEE, it is necessary to describe the methodology of bibliography search. For the review, a search was carried out for articles by leading publishers, primarily devoted to information methods for the period from 2013 to 2023. The second direction of the search was the work considering the correlation between socioeconomic factors and the amount of theft of electricity. In total, about 300 publications were analyzed. Those of them in which mathematical methods of searching for sources, damages were described in detail, and various machine learning methods were used were of the greatest interest and are included in Table 1 as the most significant in the framework of the review. As will be seen from the following sections, the use of such algorithms is the main trend in the field of NTLEE detection for today.
The remainder of the paper is structured as follows: Section 2 contains brief classification and description of the main nontechnical loss detection methods and publications related to the topic. Section 3 outlines specific features of the algorithms observed, demonstrates the impact of initial data completeness on the result, compares sensitivity and computational efforts needed for neural network learning, testing and operation, and so on. Finally, Section 4 summarizes the main findings of this research.
2. Methods of Identification and Assessment of Nontechnical Losses of Electrical Energy
The primary classification of the methods has been delineated in [8], as illustrated in Figure 1; this is consistent with several other classifications, albeit with minor variations, found in [15,16]. This schema is employed to pinpoint locations of electrical energy theft by leveraging an extensive knowledge base to analyze a substantial amount of data. Predominantly, this analysis involves approaches such as machine learning, anomaly/outlier detection, distribution network analysis, and cybersecurity.
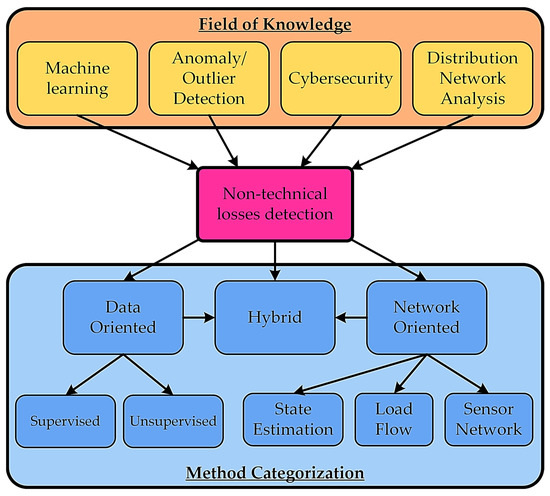
Figure 1.
Classification of methods for detecting nontechnical losses of electrical energy [8].
As it is underlined in the introduction, nontechnical losses of electrical energy detection methods can broadly be categorized into two groups: methods concentrating on consumer data (informational methods) and ones centered on network topology and technical data (schematic methods). In addition, there are hybrid methods that combine the two philosophies mentioned. A distinguishing factor among these methods is their reliance on data pertaining to the power supply system—encompassing elements like network topology and data measurements at the input and/or branching points of supply substations. It is important to emphasize that the efficacy of these methods is significantly tethered to the precision of electrical energy metering devices. Consequently, minimizing both instrumental and methodological errors is pivotal in enhancing the accuracy of results in identifying sites of electrical energy theft [17,18].
Methods focusing on consumer electrical energy data can be further divided into subcategories: observable and unobservable. Observable methods employ classifications that categorize consumers into two groups. The first group encompasses those involved in the theft of electrical energy, identified using algorithms, as dishonest. The second group consists of honest electrical energy consumers who were not flagged by the algorithm. Methods that bypass this binary classification of users are termed unobservable. Another approach utilizes a classification with only one type of consumer; however, it is seldom adopted in contemporary publications and is thus not discussed further.
Methods utilizing network information typically disregard consumer classification, concentrating instead on the analysis of the supply network’s topology and the physical principles underlying its operation [19,20,21,22]. These strategies can be categorized based on their foundational methods: state assessment-based methods, flow distribution assessment-based methods, and approaches founded on sensor networks [16,23]. Hybrid methods aim to integrate both consumer and network data [24]. The focus of this study narrows down to methods engaged with consumer data. While network information may be referred to in the publications under review, it serves only as supplementary data.
Currently, the prevalent methods for identifying sites of electrical energy theft include ensembles of fuzzy logic methods, regression and correlation analyses, multilayer neural networks, empirical methods, decision trees, support vector methods, convolutional neural networks, and hybrid models rooted in them, as well as autoencoders and their related hybrid models utilizing various types of boosters. A concise explanation of each mentioned method follows:
Fuzzy logic methods are grounded in classical mathematical logic, wherein a mathematical expression can denote sets involving conjunctions, disjunctions, and negations. Unlike the discrete “true” or “false” values, it utilizes a “degree of truth” that can assume any value between zero and one, with the extreme values representing truth and falsehood, respectively. Instances of employing this nuanced logic are illustrated in [25,26].
Regression and correlation methods involve the analysis of a large amount of information to identify existing patterns. Based on the revealed dependencies on the input data, the behavior of the model is predicted. Regressions were used in [27,28,29,30,31]; correlation analysis was used in [32,33,34,35,36,37,38,39].
Multilayer neural networks, distinct from single-layer variants, incorporate additional hidden layers, thereby enhancing their accuracy. It is not necessary for the number of hidden layers to be large—even with just one, the model’s efficiency is elevated. Thanks to these hidden layers, input signals undergo preliminary processing before reaching the adder. Studies employing this type of neural networks can be found in [25,27,40,41,42,43,44,45,46,47,48].
Empirical methods are predicated on identifying verifiable instances of embezzlement through patterns observed in real-world scenarios. Consider a situation in a network with a distributed load: if a specific electricity user’s meter readings decrease, yet no similar decline is registered on the state metering device placed on the outgoing connection or at the entrance of a 10/0.4 kV transformer substation, one can infer that the user has tampered with their metering apparatus. A substantial set of such rules has been put forward in research, with several elaborated in [34,49,50,51,52,53,54,55,56,57,58,59,60,61,62,63,64,65].
Decision trees are methods of automatic analysis of large data arrays. A decision tree is based on a hierarchical tree structure, which uses the rule “If … then …”. The data are split when one of two conditions is met: either it is no longer possible to create a new rule “If … then …”, or when the allowable number of rules is reached. Examples of using decision trees can be seen in [27,40,66].
A support vector machine is a linear algorithm that is used in classification and regression tasks. The idea of the method is to divide objects into several classes by a single line or hyperplane. The points on the graph that are closest to the separation line (hyperplane) are used as reference vectors. Support vectors were used in [27,67,68,69,70,71,72].
Convolutional neural networks (CNNs) feature a distinctive architecture among artificial neural networks, characterized by the presence of a convolution operation. This operation involves utilizing a confined matrix of weights, initially termed the “convolution core”, which progressively traverses the entire layer it processes. Weight coefficients emerge solely during the learning phase, culminating in the generation of a neuron activation signal destined for the subsequent layer of the network. Eventually, the neuron outputs’ products are aggregated according to their respective weights, delineating the conclusive output, a process documented in [70,73,74,75,76,77,78,79,80,81,82,83,84,85,86,87,88,89,90].
Developed originally to facilitate machine vision, CNNs now excel in discerning various images through the identification of local features within them. To pinpoint occurrences of electricity theft, one can employ one-dimensional (Figure 2) or two-dimensional CNNs, or a combination of both.

Figure 2.
One-dimensional convolutional neural network for searching theft of electrical energy [73].
One-dimensional convolutional neural networks are utilized when the resolution of the output data is limited. A specific instance is the daily monitoring of electricity consumption over a month, from which an input data vector with a dimensionality ranging between 28 and 31 can be derived from the power consumption graph.
Two-dimensional convolutional neural networks come into play in the scrutiny of highly detailed values, such as semi-hourly or hourly recordings of electric energy use spread over a month and differentiated by day. This approach provides the input data vector (image) a resolution embodying 28 to 31 × 24 values.
The integration of two-dimensional and one-dimensional convolutional networks affords the capacity to individually inspect anomalies and patterns before amalgamating the results for deeper analysis. To facilitate the comparison of diverse data sources, time series differing in intervals, specificity, and consumer sets, separately tailored convolutional networks are devised to operate in parallel. For the evaluation of nontemporal series, the convolutional network might be substituted with a direct distribution network. In this scenario, normalization and neuron elimination procedures are advised to mitigate overfitting. The culmination is reached via a pooling layer tasked with standardizing the errors emanating from each parallel-operating neural network, as well as orchestrating the influence of every individual network on the final classification outcome.
Autoencoders are a type of neural network that reconstructs the information fed into its input. This neural network comprises two primary components: an encoder and a decoder. The encoder receives the input information and transforms it into an internal representation. Subsequently, the decoder takes this internal representation generated by the encoder as the source information and endeavors to reconstruct the original input. Examples of autoencoder applications can be found in [91,92,93,94,95,96,97,98].
To elucidate the workings of an autoencoder, we can refer to the results depicted in Figure 3 [92]. The initial data are illustrated in Figure 3a, where anomalies are highlighted in red, representing potential unscrupulous consumers of electrical energy. The blue hue denotes conscientious consumers. As observed, these categories of consumers are significantly intermingled, making it challenging to segregate and differentiate them. Utilizing particle swarm optimization to discern characteristics facilitates a clearer differentiation as seen in Figure 3b, albeit some points from distinct categories remain overlapped. Applying two variants of autoencoders to the dataset enables almost complete separation of the data points. Specifically, Figure 3c showcases the outcome of utilizing a simple autoencoder with three hidden layers, while Figure 3d demonstrates the results achieved with a stacked autoencoder also comprising three hidden layers. Employing an autoencoder aids in pinpointing the distinctive power consumption patterns of diverse consumers and in reducing noise, essentially diminishing the “dimensionality” while retaining the variation in parameters.
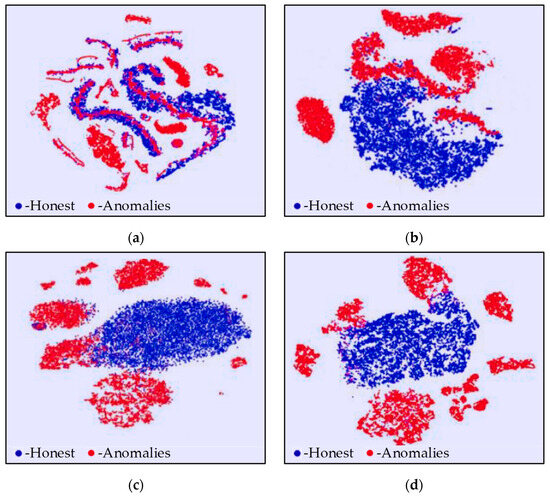
Figure 3.
Distribution of consumer data: (a) the original dataset; (b) data processed using the particle swarm optimization algorithm; (c) the result of a simple autoencoder with three hidden layers; (d) the result of a stack autoencoder with three hidden layers [92].
Thus, the use of an autoencoder makes it possible to almost completely separate points in the power consumption profile of various categories of consumers with the possibility of their further quantitative (according to the threshold principle) or qualitative (using clustering) classification.
Table 1 reviews the most significant papers analyzed in terms of the research.

Table 1.
Review of existing solutions in the field of nontechnical loss detection.
Until 2020, support vector methods and decision trees employing various nodes were prevalently featured in publications, as seen in [66,96]. However, post-2020, there has been a noticeable uptick in the active utilization of various types of neural networks in research publications.
As of now, CNNs stand as the most frequently used type of neural network, accounting for nearly a quarter of the publications analyzed. Direct feedforward neural networks and autoencoders find less representation in the current literature, a trend visually represented in Figure 4.
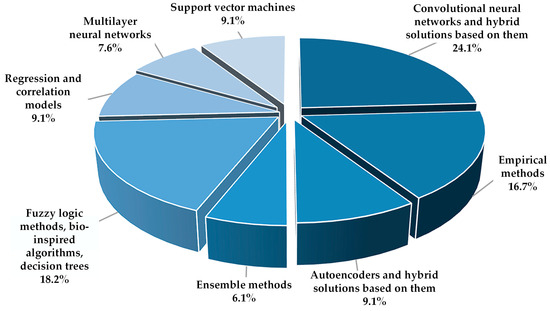
Figure 4.
Dissemination of models and methods for detecting NTLEE.
Currently, there are two fundamental approaches to detecting nontechnical losses due to electrical energy theft, which subsequently influence the configuration of neural networks: identifying NTLEE in a suspicious segment of the profile [73,74,75,81], and pinpointing NTLEE tied to a suspicious consumer [26,78,83,86].
Searching for dishonest consumers in a dubious section of the profile offers several advantages. It allows for the analysis of a specific consumer’s profile, reducing the frequency of false positives. The approach involves feeding a square matrix and standard convolution settings into the artificial neural network (ANN), demanding relatively low computational power. Moreover, it distinctly identifies the source of nontechnical losses of electrical energy. However, it falls short in detecting already established, continuous energy thefts and unmarked thefts, leaving them unnoticed. Although it specifies the theft source, it fails to pinpoint the exact time of the energy theft occurrence.
On the other hand, the approach focusing on suspicious consumers stands out for its high sensitivity to power consumption anomalies against the broader backdrop. It facilitates the detection of relatively constant energy losses and previously unnoticed thefts, always revealing the time when the NTLEE occurred. Despite these merits, it requires a comparison with neighboring power consumption data, which might not always be available, and struggles to accurately determine the precise source location of the theft.
Since the advantages of one of the approaches can be attributed to the disadvantages of another approach, the logical conclusion is that the greatest efficiency will be achieved only with the joint application of approaches in a modular algorithm.
3. Analysis of the Methods Used to Identify NTLEE
Based on the review presented in Section 2, this section delineates a comparison of the different methods in terms of their sensitivity, the initial data required for identifying sources of nontechnical losses due to electrical energy theft (NTLEE), operational time, and other attributes pertinent to information methods. Moreover, it tackles the challenges encountered in analyzing NTLEE through the utilization of balance and neighbor meters in a power supply system with a distributed load. The analysis also explores the extent to which additional data influences the outcomes of electrical energy theft detection, alongside identifying which supplementary parameters derived from electrical energy consumption profiles could enhance the training efficiency and speed of artificial neural networks (ANNs). Furthermore, the issue of data balance is highlighted, and the optimal strategies for harmonizing the output from measurements of consumed electrical energy are outlined.
3.1. Comparison of the Sensitivity of the Main Models and Methods
The sensitivity of the algorithm is one of the main indicators of its operation. The higher the sensitivity, the more likely it is that the algorithm is able to detect theft of electrical energy, and at the same time, the less likely it is that the algorithm determines a simple change in energy consumption as theft of EE.
The boxplots in Figure 5 show the expected accuracy of the methods for detecting NTLEE. It can be concluded that linear regressions have the lowest classification accuracy (about 60–75%); correspondingly, they are the least suitable for determining NTLEE. At the same time, convolutional neural networks with controlled recurrent blocks have the highest sensitivity (about 97%), hybrid models of an autoencoder with memory elements are slightly less sensitive (sensitivity is about 96%). It is worth noting that hybrid models based on an autoencoder are easier both in implementation and in training.

Figure 5.
Displaying the accuracy of determining the NTLEE of various methods.
The support vector methods, actively utilized until 2020, yield a considerable range of sensitivities depending on the various model types, averaging around 85%. Notably, decision trees paired with learning boosts stand as the most sensitive among the methods generally considered visually interpretable by humans, reaching sensitivities of up to 95%.
To better understand what the sensitivity of algorithms means, it is necessary to understand which metrics of the effectiveness of detecting NTLEE are used in various publications [15,16] (Table 2).
Table 2.
Sensitivity metrics.
To better comprehend the implications of the values derived from the formulas, we need to introduce a measurement classification matrix. This matrix is depicted in Table 3. According to the table, when the measurements from consumers engaged in electrical energy theft are correctly identified as involving theft, such an outcome is termed true positive. Conversely, if theft goes undetected despite occurring, the situation is labeled as false negative.
Table 3.
Measurement classification matrix.
In instances where no EE theft has occurred according to the energy measurements, and the employed algorithm corroborates this by not signaling any theft, this scenario is described as true negative. However, if the algorithm incorrectly signals theft in a situation devoid of any, it results in a false positive error.
In conclusion, the first term in each label (false (F)/true (T)) reflects the accuracy of the algorithm in mirroring the reality of the situation. Meanwhile, the second term (negative (N)/positive (P)) indicates the actual occurrence or nonoccurrence of nontechnical losses of electrical energy (NTLEE).
Returning to Table 2, we can conclude that the sensitivity of the algorithm is best described by the frequency of true positive values (true positive rate), since network organizations are more interested in finding the presence of theft of electrical energy than in finding its bona fide consumption. Nevertheless, such characteristics as the frequency of false positive values (false positive rate), the frequency of true negative values (true negative rate), and accuracy (precision) make it more correct to compare different methods and models with each other.
Such a parameter as accuracy can be used correctly only if balanced data are available, since this metric shows how well the model determines data both with and without energy theft. Balanced is defined as data in which conscientious and unscrupulous consumers are represented in equal proportions.
A similar characteristic is the PR curve [73,81], which is in the coordinates of the accuracy (precision) of the model along the vertical axis and the completeness (recall) of the data along the horizontal axis, as shown in Figure 6.

Figure 6.
Operating (PR) characteristic of the receiver [81]. Differently colored lines with the same style correspond to experimental neural network performance in terms of one test case but with different network settings.
Similarly, to the ROC curve, when using a PR curve, it is necessary to analyze the area under the curve: the larger the area under the graph, the more accurate the model is.
3.2. Comparison of Learning and Recognition Times
One of the primary criteria for comparing different types of neural networks involves evaluating factors such as training time and recognition time. These factors are vital in assessing a trained neural network’s capability to identify dishonest electricity consumers.
Figure 7a,b illustrate that convolutional neural networks appear to be more adept at recognizing unscrupulous electricity consumers [81]. However, it is important to note that autoencoders are only slightly less capable. Specifically, they lag by a margin of up to 3% in terms of sensitivity and up to 1% regarding specificity.
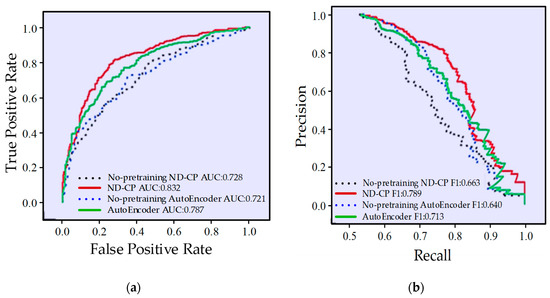
Figure 7.
(a) ROC is the curve of the autoencoder and 1D convolutional neural network; (b) PR is the curve of the autoencoder and 1D convolutional neural network [81].
As can be seen from Table 4, which shows the learning and recognition times characteristic of different types of neural networks, the autoencoder learns much slower than simple direct propagation networks or convolutional neural networks. However, its speed is much higher than hybrid models that use several types of neural networks. The recognition times for different types of networks are almost identical [81].
Table 4.
Comparison of different types of ANN by information processing speed.
Additionally, it is worth pointing out that the autoencoder is easier to understand and configure. To better understand how the autoencoder and convolutional neural networks work, the following section describes their graphical interpretation.
3.3. The Main Hyperparameters of ANN
Table 5 shows hyperparameters of convolutional neural networks and Table 6 shows hyperparameters of other neural networks that are also used to detect theft of electrical energy.
Table 5.
Hyperparameters of convolutional neural networks for detecting electrical energy theft.
Table 6.
Hyperparameters of neural networks for detecting electrical energy theft.
From the tables presented, it can be concluded that in most publications, only two learning algorithms are used: SGD and Adam. Autoencoder-controlled recurrent blocks and direct propagation networks have a smaller number of learning epochs compared to convolutional neural networks; nevertheless, the learning rate of convolutional neural networks is higher than that of most models.
3.4. Source Data, Metric, Depth of Retrospective, and Sampling Rate
Each model works with a specific set of source data. The introduction of smart meters allows users to significantly expand the set of necessary source data, as well as increase the sampling rate, that is, the number of counter surveys for a given time period.
During the analysis of publications, it was revealed that for most models, only the consumption load profile is required as initial data (76% of publications); for a small proportion of algorithms, additional data are needed regarding the receiver power characteristics in accordance with the specifications issued by the network organization, such as the installed active power, permissible reactive power, or power factor (9% of publications); even fewer models use weather data and consumption integrals for a week and a month (6% of publications for each dataset); and the smallest part of the algorithms separately use data on the geographical location of the object (3% of publications), for example, in [41,100]. The distribution can be seen in Figure 8a.
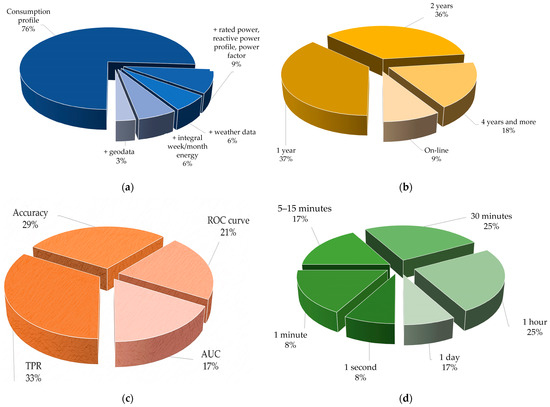

Figure 8.
Analysis of the source data used in publications: (a) the source data used in algorithms based on artificial intelligence; (b) the depth of the data retrospective; (c) the metric used to evaluate the effectiveness of the algorithm; (d) the sampling rate of the data used for energy consumption analysis; (e) the number of models using data from the head counter; (f) the presence of a “teacher” when teaching the algorithm; (g) the operating time of the algorithm before the detection of NTLEE.
It is worth noting that in the territory of Russia today, most of the electrical energy is transmitted only once a month by consumers of electric energy when paying utility bills; therefore, without the active introduction of smart meters, the search for unscrupulous consumers of electric energy is a rather difficult task. At the same time, after the installation of intelligent metering devices, losses are already reduced by several cents in the first months, as noted above.
From Figure 8b, it can be seen that most models and algorithms require a retrospective of data from 1 to 2 years [69]. From this, it can be concluded that if a newly connected consumer immediately, after their connection, starts to use electrical energy and is not detected, while maintaining certain patterns of their behavior, it is unlikely to be detected further by existing algorithms. Only 9% of publications describe how to detect theft of electrical energy online, and in such cases, it is necessary to fulfill certain requirements [24,42,101].
Regarding metrics or characteristics, thanks to which it is possible to separate “good” algorithms and models from “bad”, sensitivity or TPR is most often used (about 33% of publications), as can be seen from Figure 8c. Reliability or accuracy is used less often (about 29% of publications), which is most likely due to the fact that it requires balanced data, which, of course, are absent in real measurements [43,98]. Such a qualitative characteristic as the ROC curve or the operating characteristic of the receiver and its quantitative characteristic is used only in 21% and 17% of models, respectively. By means of this characteristic, an assessment was made in [27,40,43,97,98,99].
Regarding how accurate the energy consumption readings should be, the analysis of publications shown in Figure 8d suggests that half-hour and hourly time intervals are equally used (25% of publications in both cases). The expenditure of electric energy over a longer period of time does not make it possible to identify patterns in consumption, so that in the future it would be possible to detect the moment of theft of electrical energy. On the other hand, more frequent sampling of data, often in large network organizations, for each consumer may be impractical from an economic point of view. A similar conclusion was reached in [102].
As already described above, a consumption profile is used for the analysis of energy consumption in order to identify NTLEE, which is collected from the meters of individual users of electric energy. At the same time, it is obvious that in the presence of a distributed load, the use of data from the head counter installed on the feeder of a transformer substation, or at the input of a transformer substation, can help in reducing the search area for places where theft of electrical energy occurs. However, the analysis of publications shown in Figure 8e shows that only 3% of models use data on electrical energy consumption from the head meter.
This fact may indicate that when using real data, there is no section of the electrical network in which data on energy consumption is present simultaneously, both at the head section and at all outgoing consumers of electric energy.
Since the algorithms in question use artificial intelligence, an important aspect is the training of the algorithm with a “teacher”—a person who can correct the behavior of the algorithm if there is absolute confidence in the presence or absence of NTLEE in a specific measurement of electrical energy. The analysis of publications presented in Figure 8f shows that in most publications, a “teacher” is not used, while it is worth noting that the difference in the number of publications where a “teacher” is used necessarily and not used at all is 3%. From this, it can be concluded that the presence or absence of a “teacher” is not a strict requirement that determines the practical suitability of the algorithm. One of the important characteristics of any algorithm aimed at detecting NTLEE is the operating time of the algorithm before the detection of theft of electrical energy. That is, as a duty, the algorithm must analyze the data in order to then assert that the theft of electrical energy took place at a certain point in time.
Figure 8g shows that most algorithms (40%) take several months to identify patterns in the behavior of a particular consumer and then determine the presence of theft of electrical energy with specified accuracy. Fewer algorithms (33%) take 1 year to do this; the fastest algorithms that can detect a pattern in a few days are used only in 18% of publications. The smallest number of publications (9%) considers algorithms that can determine the presence of NTLEE within a few weeks. Thus, in most cases, if the connection to the power supply system occurred in January, then most algorithms will be able to determine the presence of the NTLEE, in the best case, in March.
3.5. Types and Features of Measurement Information Sources
All sets of electrical energy measurements that are used by any algorithm can be divided into three categories: real data, data from open sources, and synthesized data.
Table 7 shows open datasets for the search for NTLEE in various studies. The information in these sets is collected on real objects and correspond to the behavior of real users of electric energy.
Table 7.
Open datasets for NTLEE search.
Regarding the advantages of real data, it can be noted that they can be connected to the network topology, which allows for calculations to be made not only taking into account data obtained from a specific metering device but also using data from neighboring metering devices, as well as devices that are located “higher” in the topography network logs, that is, the use of balance sheet accounting, which is discussed in Section 3.6. There is also a retrospective for several years in the real data, which allows for training the model and then using it as one of the tools for organizing field raids by network companies in order to confirm the presence of NTLEE. On the other hand, real measurements are classified information, especially with network topology, since, to a certain, extent it borders on personal information of subscribers, which is not subject to disclosure. Not every organization is ready to share such information. It is even more difficult to get information about whether there was theft by a specific subscriber, as well as the volume of this theft. In practice, for example, on the territory of the Russian Federation, the Decree of the Government of the Russian Federation No. 442 of 04.05.2012 is in force, according to which, when the fact of unaccounted consumption of electric energy is revealed, it is assumed that a similar consumption took place from the date of the last check of the metering device. That is, there is no precise indication of the period of theft of electrical energy. Also, real data differ in dimension both within the same network (0.4 kV power supply system with a distributed load) and for one specific subscriber. Additionally, it is worth noting that the data obtained directly from the measurement points are subject to manual filtering, since events may occur that affect the readings of the metering device marked in another system (network topology change, incorrect operation of the metering device, etc.).
Databases from open sources are publicly available. It is worth noting that the depth of the data sample is sufficient for analysis (from a year), the dimension varies from 1 min to 1 day, and the primary data processing is carried out by publication. Nevertheless, these data contain measurements of electric energy consumed by a specific subscriber (household, industrial, small-motor), and there is no binding to the power supply system, that is, there is no possibility of the phenomenon of noncontractual consumption of electric energy. In this regard, the correctness of these data is also questioned. According to the previous section, data from open sources are recognized by the scientific community as well-known electrical energy consumption, that is, even if there is unaccounted for consumption, there is no corresponding markup (with the exception of the SGCC dataset database, in which there are marks of electrical energy theft, although there are no guarantees that they are exhaustive). One of the important advantages of open databases is the ability to compare the results of new models and algorithms with existing models and algorithms.
The synthesized data contain simulated information based on known patterns of electrical energy consumption and depend on the experience of the person responsible for creating these data. One of the obvious advantages is that these data can be easily linked to any network topology, both real and modeled, independently. Sampling depth, dimensionality, and determination of time limits of unaccounted and noncontractual electrical energy consumption can be modeled for any task.
3.6. The Effect of Additional Data on the Sensitivity of the Algorithm
According to this literature review, the availability of additional data can increase the sensitivity of the algorithm by 7–10%, while reducing the frequency of false positive values by 3–5%.
In particular, in [88], the weekly power consumption profile, zero measurements, missing measurements, and the season were used as additional data. For comparison, ROC curves are presented for two cases: with additional data and without them.
In the case of using additional data, the area of the ROC curve is 0.83 in the case of a training sample, while without additional data, the logical area is only 0.74.
The results of [73], which are partially presented in Figure 9, can serve as confirmation that the use of additional data is justified. In particular, it is shown that the larger the training sample, the more sensitive the neural network becomes. The PR characteristic of the model without additional data is indicated by a dotted line, and it is located below the other curves, which indicates that the presence of additional data increases the accuracy of the model.
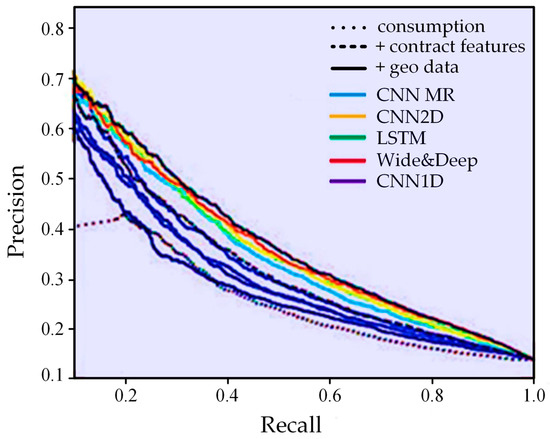
Figure 9.
PR characteristic for a different amount of source data and for a different size of the training sample [74]. Differently colored lines with the same style correspond to experimental neural network performance in terms of one test case but with different network settings.
As additional source data, one can use the percentage of zero measurements, the percentage of measurement losses, the season of the year, the geographical coordinates of the power supply facility, the district (municipality, district, locality), the maximum capacity in accordance with the issued specifications, the tariff number, the location of the electrical energy meter, the type and brand of the meter, firmware version, year of issue of the metering device, and date of the last verification of the metering device.
If we talk about additional electrical parameters, it is recommended to use no more than five such characteristics. Among them, according to this review, the following values may be present: daily peak load power, share of off-peak power consumption, share of peak power consumption, share of hourly constant power consumption, daily power consumption, number of hours of maximum loads, daily average power, ratio of peak power to average power for the period, power variance per day, power variation per day. The use of more than five parameters leads to the creation of linear combinations of parameters with each other, and therefore the accuracy of the algorithms begins to decrease markedly, as can be seen from Figure 10. Nevertheless, theoretically, the method of (deep) machine learning should “independently” identify complex regressions in the presence of a sufficient training sample and effective training methods [70].
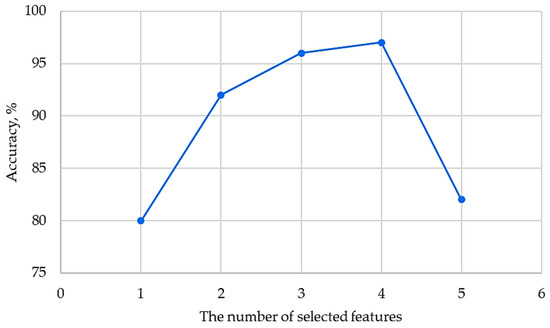
Figure 10.
The dependence of the accuracy of the model on the number of additional parameters [70].
Hybrid models for detecting theft of electrical energy, created for pattern recognition and autoregressions, have less ability to generalize dependencies. Deconvolutional neural networks (DNNs) work better in this regard.
3.7. The Problem of Balanced Source Data
Balanced source data in the context of searching for NTLEE refers to data that equally include both bona fide consumers of electrical energy and subscribers involved in commercial losses. It is worth noting that in real samples, the instances of electrical energy theft are significantly fewer compared to instances of conscientious use. Consequently, training with such samples often results in a high number of unfavorable false negative classification cases. Increasing the representation of electrical energy theft in the training sample not only raises the number of false positive outcomes generated by the model but also reduces the number of false negative outcomes, as illustrated in Figure 11 and Figure 12.
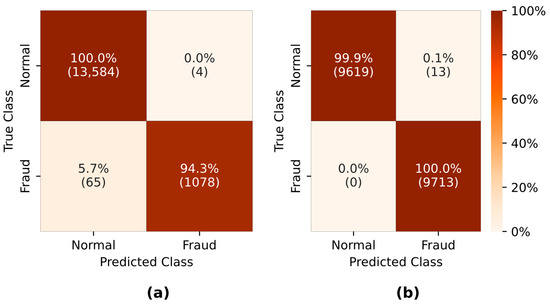
Figure 11.
The results of the model before (a) and after (b) balancing the source data.
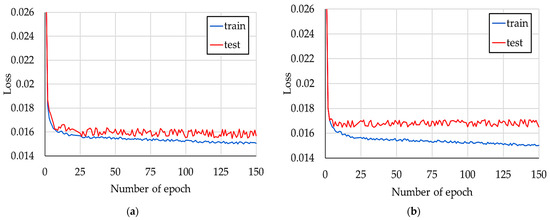
Figure 12.
(a) The neural network training error function for the balanced initial sample; (b) the neural network training error function for the unbalanced initial sample [96].
Figure 12 illustrates that when true positive values are fewer than true negative values, the neural network tends to produce a small number of false negative values. If the count of true positive values is comparable to that of true negative values, the number of false negative outcomes decreases to zero [43].
Furthermore, Figure 12a,b demonstrate that when operating on a specific sample or on real unbalanced data, the neural network is less efficient compared to when it is working on a training selection [95]. This is attributed to both the introduction of new data and the inadequate representation of electrical energy theft cases in the training sample. These figures highlight that balanced data enhances the metrics responsible for the model’s accuracy and sensitivity. It is noteworthy that the error rate in the test samples becomes roughly equivalent to that in the training samples. Without balanced data, the error rate in the test samples surpasses that in the training samples. This aspect was considered in [95].
Some of the methods of balancing the sample with measurements of electrical energy are described below [76,84]:
- Weight coefficients: The task of the weighting coefficients is to equalize the data and create a balance by multiplying by the value of the weighting coefficient, which is equal to the inverse of the percentage of data.
- RUS: This technique reduces the number of measurements without theft of electrical energy to the number of measurements with theft of electrical energy.
- ROS: This technique acts like RUS, but instead of reducing the number of measurements without theft, it, on the contrary, increases the number of measurements with theft of electrical energy.
- RUS-ROS: A compromise solution between RUS and ROS, the essence of which is to simultaneously reduce the number of measurements without theft of electrical energy and increase the number of measurements with theft of electrical energy until equal proportions are achieved.
- K-medoids, K-means: In this technique, clustering of the initial data to centroids/medoids is performed, taking them as new points. In fact, there is a decrease in the number of measurements without theft of electrical energy.
- Tomek links: If a measurement without theft of electrical energy is located next to a measurement in which there is theft of electrical energy, then the measurement without theft is deleted.
- SMOTE: Additionally, new points with thefts of electric energy are synthesized next to the original points where the theft data is present.
- ADASYN: A kind of SMOTE with the number of synthesized points proportional to the weighting factor of the number of points with electrical energy theft.
- CBOS: When using this technique, additional points with NTLEE are synthesized near the measured points with NTLEE, but the number of points is modeled in proportion to their distance to the cluster centroid.
It is important that a decrease in the sample or its increase leads to certain consequences, which is demonstrated in Table 8. A decrease in the data sample can lead to the loss of abnormal samples of electrical energy consumption that do not contain theft of electricity. In this connection, it becomes more likely that a false positive result appears. An increase in the sample size leads to longer training of the ANN.
Table 8.
The time of training and operation of the convolutional ANN with various balancing techniques.
Based on this table, we can conclude that complex algorithms such as SMOTE and CBOSS do not accelerate the neural network; however, they significantly reduce the learning rate.
Figure 13 a,b show that the networks trained on balanced data utilizing the CBOS method are the most accurate [80]. Following the CBOS method in terms of accuracy, according to the AUC criterion, is the ROS method.

Figure 13.
(a) AUC value for ANN trained and working on a dataset balanced using different techniques; (b) accuracy value for ANN trained and working on a dataset balanced using different techniques.
It is worth noting that ROS is the least demanding in terms of computing costs. Therefore, it is proposed to use this algorithm to balance the initial data [79].
4. Conclusions
Modern information methods for detecting nontechnical losses of electrical energy serve as alternatives to schematic methods. These methods do not aim to calculate the exact magnitude of nontechnical losses or offer a strict formal description of the conditions leading to their occurrence. However, they do facilitate the identification of events such as hidden failures in EE accounting facilities and complexes, transmission and reception failures of EE accounting displays via unreliable communication channels, and attempts at theft or unaccounted consumption of EE by individual unscrupulous energy entities—all without requiring detailed knowledge of the network’s topology and replacement scheme, and aiding in the reduction of EE imbalances pertinent to 0.4–6 (10) kV networks.
Simultaneously, 41% of the analyzed publications utilized neural networks to identify nontechnical losses of electrical energy (NTLEE). The most popular choices are convolutional neural networks (CNNs) and autoencoders (AEs), with the median performance of such models and methods delivering a sensitivity rate to NTLEE of around 92%. The highest-performing setups achieve levels between 95 and 97%. Moreover, the majority of publications undertake the analysis of power consumption profiles as time series, employing pattern recognition theory.
Convolutional neural networks (CNNs) have emerged as the primary method for detecting NTLEE in the field of pattern recognition, particularly in publications from 2020 to 2022. Highly discrete profiles, characterized by hourly or half-hourly measurements of electrical energy consumption, leverage two-dimensional networks. In contrast, scenarios limited to daily consumption data over a month or hourly data within a single day employ one-dimensional convolutional networks.
While autoencoders present a viable alternative for pattern recognition, they generally trail behind specialized neural networks in terms of accuracy and data processing speed. However, they operate faster than the more complex convolutional neural networks.
The selection of ANN hyperparameters hinges on one of two strategic approaches to detecting electricity theft: analyzing the profile of an individual consumer over an extended period or examining a group of consumers at a single point in time. To accommodate different approaches and initial datasets, the algorithm can exhibit modularity, potentially incorporating several neural networks working in tandem but connected sequentially.
Key metrics and criteria for evaluating the performance of NTLEE detection models, methods, and algorithms include sensitivity (the frequency of true positive outcomes), accuracy (the proportion of correctly identified true positive and true negative instances), and the area under the receiver operating characteristic curve, which considers the relative coordinates of false positive and true positive values.
A substantial retrospective depth, spanning at least one year—though preferably extending to two or more years—is critical when analyzing power consumption profiles. The typical measurement interval falls between 0.5 and 1 h. Publications frequently utilize real and synthesized measurements alongside archival databases from open sources for the training, verification, and fine-tuning of the ANN. These sources are favored for their accessibility, realistic load schedules, and the reduced necessity for extensive data preprocessing.
In 76% of publications, only power consumption profiles are used without involving additional source data, while ensuring high sensitivity to NTLEE. Auxiliary data are electrical parameters, meteorological data and, less often, cadastral data and geolocation. At the same time, the use of additional data within reasonable limits makes it possible to increase the sensitivity of neural networks. To search for consumers who use electrical energy on a noncontractual or unaccounted for basis, several characteristics can additionally be applied that relate both directly to loads (parameters of the load and power consumption graph) and characteristics unrelated to loads (coordinates, locality, etc.). The recommended number of additional characteristics, related to power consumption is four. A greater number of characteristics leads to the emergence of linear combinations, and therefore the sensitivity of the model sharply deteriorates.
Most researchers are faced with the problems of marking up the source data, incompleteness of images of theft in the source data and the amount of source data, as well as the imbalance in the dataset. Balancing of the initial data in conditions of their shortage occurs by increasing the dimension in the part of the measurement sample with the presence of theft of electrical energy. Q-learning based on the Bellman optimality criterion can be taken as an alternative option for balancing data, as well as sample synthesis using a generative adversarial ANN with an autoencoder.
Author Contributions
All authors made valuable contributions to this paper. Conceptualization, A.P. and I.Z.; methodology, A.P. and I.O.; software, A.P. and P.Y.G.; validation, V.S., N.M. and I.Z.; formal analysis, F.K., A.P. and P.Y.G.; investigation, A.P., I.O., M.S., V.S., P.Y.G., I.Z. and F.K.; writing—original draft preparation, A.P., P.Y.G., I.O. and I.Z.; writing—review and editing, M.S. and I.Z.; supervision, F.K., M.S. and I.Z. All authors have read and agreed to the published version of the manuscript.
Funding
This work was partially supported by the Ministry of Science and Higher Education of the Russian Federation (through the basic part of the government mandate, project No. FEUZ-2023-0013).
Data Availability Statement
Not applicable.
Conflicts of Interest
The authors declare no conflict of interest.
References
- Emerging Markets Smart Grid: Outlook 2021. Available online: https://www.giiresearch.com/report/ng987743-emerging-markets-smart-grid-outlook.html (accessed on 7 August 2023).
- Find the Leak: How Network Companies Reduce Energy Losses. Available online: https://www.kommersant.ru/doc/5140335 (accessed on 7 August 2023). (In Russian).
- Tyumen Power Engineers Reduced Commercial Electricity Losses by 37 Million Rubles. Available online: https://rg.ru/2022/08/09/reg-urfo/tiumenskie-energetiki-snizili-kommercheskie-poteri-elektroenergii-na-37-mln-rublej.html (accessed on 7 August 2023). (In Russian).
- In 2022, Rosseti-Siberia Reduced Commercial Electricity Losses by 42%. Available online: http://energo-news.ru/archives/171689 (accessed on 7 August 2023). (In Russian).
- Meter Tampering: The Major Cause of Non-Technical Losses. Available online: https://clouglobal.com/meter-tampering-the-major-cause-of-non-technical-losses/ (accessed on 7 August 2023).
- Yan, Z.; Wen, H. Performance analysis of electricity theft detection for the Smart Grid: An Overview. IEEE Trans. Instrum. Meas. 2022, 71, 1–28. [Google Scholar] [CrossRef]
- Savian, F.S.; Siluk, J.C.M.; Garlet, T.B.; do Nascimento, F.M.; Pinheiro, J.; Vale, Z. Non-technical losses: A systematic contemporary article review. Renew. Sustain. Energy Rev. 2021, 147, 111205. [Google Scholar] [CrossRef]
- Messinis, G.M.; Hatziargyriou, N.D. Review of non-technical loss detection methods. Electr. Power Syst. Res. 2018, 158, 250–266. [Google Scholar] [CrossRef]
- Antmann, P. Reducing Technical and Non-Technical Losses in the Power Sector. In Background Paper for the World Bank Group Energy Sector Strategy; World Bank Press: Washington, DC, USA, 2009; p. 92639. [Google Scholar]
- Mail.ru Group Helped Rosseti Center to Reduce Commercial Electricity Losses with the Help of AI. Available online: https://www.cnews.ru/news/line/2021-03-17_mailru_group_pomogla_rosseti (accessed on 7 August 2023). (In Russian).
- Search for Commercial Losses in Electrical Networks with Analytics. Available online: https://energytool.mts.ru/commercial_losses (accessed on 7 August 2023). (In Russian).
- Best Fraud Detection Software and Tools in 2023. Available online: https://seon.io/resources/comparisons/fraud-detection-and-prevention-software-tools/ (accessed on 7 August 2023). (In Russian).
- Pazderin, A.V.; Bartolomey, P.I.; Pazderin, A. A Model of energy cost distribution for participants of energy exchange in electric networks. Energetik 2022, 4, 35–40. (In Russian) [Google Scholar]
- Pazderin, A.V.; Egorov, A.O.; Kochneva, E.S.; Samoylenko, V.O. The use of methodological approaches of the theory of state estimation for the calculation and reliability of electric energy flows in networks. Electricity 2014, 10, 12–21. (In Russian) [Google Scholar]
- Fragkioudaki, A.; Cruz-Romero, P.; Gomez-Exposito, A.; Arcos-Vargas, A.; Cruz, P.; Biscarri, J. Detection of Non-technical Losses in Smart Distribution Networks: A Review. In Trends in Practical Applications of Scalable Multi-Agent Systems, the PAAMS Collection; AISC: Chicago, IL, USA, 2016; pp. 43–54. [Google Scholar]
- Ahmed, M.; Khan, A.; Ahmed, M.; Tahir, M.; Jeon, G.; Fortino, G.; Piccialli, F. Energy Theft Detection in Smart Grids: Taxonomy, Comparative Analysis, Challenges, and Future Research Directions. IEEE/CAA J. Autom. Sin. 2022, 9, 578–600. [Google Scholar] [CrossRef]
- Shilin, A.A.; Saprykina, D.A. Analysis of Sources of commercial Losses in the Power System. Energy Resour. Sav. Ind. Transp. 2019, 27, 2. (In Russian) [Google Scholar]
- Kosolapov, A.M.; Frantasov, D.N.; Kudryashova, Y.V. Improving the Accuracy of the Analysis of Commercial Electricity Losses. 2014. No. 1. pp. 86–91. Available online: http://repo.ssau.ru/bitstream/Perspektivnye-informacionnye-tehnologii/Povyshenie-tochnosti-informacionnyh-sistem-rascheta-poter-elektroenergii-59424/1/pit_2013_itt_6.pdf (accessed on 7 August 2023). (In Russian).
- Omorov, T.T. To the problem of identification of technical and commercial losses of electricity as part of the AIIS KUE. Account. Electr. 2018, 5, 56–60. (In Russian) [Google Scholar]
- Venkateswarlu, S. Controller Design for Detection of Various Power Thefts. In Proceedings of the 2021 Innovations in Power and Advanced Computing Technologies, Kuala Lumpur, Malaysia, 27–29 November 2021. [Google Scholar]
- Lydia, M.; Kumar, G.E.P.; Levron, Y. Detection of Electricity Theft based on Compressed Sensing. In Proceedings of the 2019 5th International Conference on Advanced Computing & Communication Systems (ICACCS), Coimbatore, India, 15–16 March 2019. [Google Scholar]
- Zhukov, M.V.; Zelensky, E.G.; Kononov, Y.G. Localization of Commercial Electricity Losses in 6–10 kV Networks by Methods of State Assessment; Bulletin of the North Caucasus Federal University: Stavropol, Russia, 2013. (In Russian) [Google Scholar]
- Pulz, J.; Almeida, C.F.M. An alternative approach for regulatory evaluation of non-technical losses in Brazil. In Proceedings of the CIRED 2021 the 26th International Conference and Exhibition on Electricity Distribution, Online, 20–23 September 2021; Institution of Engineering and Technology: London, UK, 2021. [Google Scholar]
- Aryanezhad, M. A novel approach to detection and prevention of electricity pilferage over power distribution network. Int. J. Electr. Power Energy Syst. 2019, 111, 191–200. [Google Scholar] [CrossRef]
- Vieira, V.G.; Bernardon, D.P.; Heinke, M.; Figueiredo, M.; Evaldt, M.; Uberti, V.; Abaide, A.; Chiara, L.; Silva, J. A Methodology to Identify Non-technical losses on rural grids using artificial neural networks and deep learning. In Proceedings of the CIRED 2021 the 26th International Conference and Exhibition on Electricity Distribution, Online, 20–23 September 2021; Institution of Engineering and Technology: London, UK, 2021. [Google Scholar]
- Firoozi, H.; Rajabi Mashhadi, H. Non-technical loss detection in limited-data low-voltage distribution feeders. Int. J. Electr. Power Energy Syst. 2022, 135, 107523. [Google Scholar] [CrossRef]
- Pereira, J.; Saraiva, F. A Comparative Analysis of Unbalanced Data Handling Techniques for Machine Learning Algorithms to Electricity Theft Detection. In Proceedings of the 2020 IEEE Congress on Evolutionary Computation (CEC), Glasgow, UK, 19–24 July 2020. [Google Scholar]
- Coma-Puig, B.; Carmona, J. Non-technical losses detection in energy consumption focusing on energy recovery and explainability. Mach. Learn. 2022, 111, 487–517. [Google Scholar] [CrossRef]
- Madrigal, M.; Rico, J.J.; Uzcategui, L. Estimation of Non-Technical Energy Losses in Electrical Distribution Systems. IEEE Lat. Am. Trans. 2017, 15, 1447–1452. [Google Scholar] [CrossRef]
- Olivares-Rojas, J.C.; Reyes-Archundiaa, E.; Rodriíguez-Mayab, N.E.; Gutiérrez-Gnecchia, J.A.; Molina-Morenoa, I.; Cerda-Jacoboc, J. Machine Learning Model for the Detection of Electric Energy Fraud using an Edge-Fog Computing Architecture. In Proceedings of the 2020 IEEE International Conference on Engineering Veracruz, Boca del Rio, Mexico, 26–29 October 2020. [Google Scholar]
- Yip, S.-C.; Wong, K.S.; Hew, W.-P.; Gan, M.-T.; Phan, R.C.-W.; Tan, S.-W. Detection of energy theft and defective smart meters in smart grids using linear regression. Int. J. Electr. Power Energy Syst. 2017, 91, 230–240. [Google Scholar] [CrossRef]
- de Oliveira Ventura, L.; Melo, J.D.; Padilha-Feltrin, A.; Fern, J.P.; Fernandez-Gutierrez, J.P.; Sanchez Zuleta, C.C.; Piedrahita Escobar, C.C. A new way for comparing solutions to non-technical electricity losses in South America. Util. Policy 2020, 67, 101113. [Google Scholar] [CrossRef]
- Jamil, F. On the electricity shortage, price and electricity theft nexus. Energy Policy 2013, 54, 267–272. [Google Scholar] [CrossRef]
- Jamil, F. Electricity theft among residential consumers in Rawalpindi and Islamabad. Energy Policy 2018, 123, 147–154. [Google Scholar] [CrossRef]
- Kang, L.; Shang, Y.; Zhang, M.X.; Liao, L.Y. Research on monitoring technology of power stealing behavior in bitcoin mining based on analyzing electric energy data. Energy Rep. 2022, 8, 1183–1189. [Google Scholar] [CrossRef]
- Liua, S.; Liangc, Y.; Wangc, J.; Jianga, T.; Suna, W.; Ruia, Y. Identification of stealing electricity based on big data analysis. Energy Rep. 2020, 6, 731–738. [Google Scholar] [CrossRef]
- Lewis, F.B. Costly ‘Throw-Ups’: Electricity Theft and Power Disruptions. Electr. J. 2015, 28, 118–135. [Google Scholar] [CrossRef]
- Yang, Y.; Song, R.; Xue, Y.; Zhang, P.; Xu, Y.; Kang, J.; Zhao, H. A Detection Method for Group Fixed Ratio Electricity Thieves Based on Correlation Analysis of Non-Technical Loss. IEEE Access 2022, 10, 5608–5619. [Google Scholar] [CrossRef]
- Reuter, S.; Winter, J.; Iséni, S.; Schmidt-Bleker, A.; Dünnbier, M.; Masur, K.; Wende, K.; Weltmann, K.-D. Electricity Theft Pinpointing Through Correlation Analysis of Master and Individual Meter Readings. IEEE Trans. Smart Grid 2020, 11, 3031–3042. [Google Scholar]
- Fan, T. Research on automatic user identification system of leaked electricity based on Data Mining Technology. Energy Rep. 2021, 7, 1092–1100. [Google Scholar] [CrossRef]
- Singhal, D.; Ahuja, L.; Seth, A. Anomaly Detection in Smart Meters: Analytical Study. In Proceedings of the 2022 2nd International Conference on Power Electronics & IoT Applications in Renewable Energy and Its Control (PARC), Mathura, India, 21–22 January 2022. [Google Scholar]
- Otuoze, A.O.; Mustafa, M.W.; Abdulrahman, A.T.; Mohammed, O.O.; Salisu, S. Penalization of electricity thefts in smart utility networks by a cost estimation-based forced corrective measure. Energy Policy 2020, 143, 111553. [Google Scholar] [CrossRef]
- Khan, I.U.; Javaid, N.; Taylor, C.J.; Ma, X. Data Driven Analysis for Electricity Theft Attack-Resilient Power Grid. IEEE Trans. Power Syst. 2022, 38, 537–548. [Google Scholar] [CrossRef]
- Bian, J.; Wang, L.; Scherer, R.; Woźniak, M.; Zhang, P.; Wei, W. Abnormal Detection of Electricity Consumption of User Based on Particle Swarm Optimization and Long Short-Term Memory with the Attention Mechanism. IEEE Access 2021, 9, 47252–47265. [Google Scholar] [CrossRef]
- Dong, L.; Li, Q.; Wu, K.; Fei, K.; Liu, C.; Wang, N.; Yang, J.; Li, Y. Nontechnical Loss Detection of Electricity based on Neural Architecture Search in Distribution Power Networks. In Proceedings of the 2020 International Conference on Smart Grid and Clean Energy Technologies (ICSGCE), Kuching, Malaysia, 18–21 May 2020. [Google Scholar]
- Shang, Y. Prediction method of electricity stealing behavior based on multi-dimensional features and BP neural network. Energy Rep. 2022, 8, 523–531. [Google Scholar] [CrossRef]
- Bakre, S.; Shiralkar, A.; Shelar, S.V.; Ingle, S. Artificial Neural Network Based Electricity Theft Detection. In Proceedings of the 2022 International Conference on Emerging Smart Computing and Informatics (ESCI), Pune, India, 9–11 March 2022. [Google Scholar]
- de Souzaa, M.A.; Pereiraa, J.L.R.; Alvesa, G.d.O.; de Oliveiraa, B.C.; Meloa, I.D.; Garciab, P.A.N. Detection and identification of energy theft in advanced metering infrastructures. Electr. Power Syst. Res. 2020, 182, 106258. [Google Scholar] [CrossRef]
- Yakubu, O.; Babu, C.N.; Adjei, O. Electricity theft: Analysis of the underlying contributory factors in Ghana. Energy Policy 2018, 123, 611–618. [Google Scholar] [CrossRef]
- Wong, J.C.Y.; Blankenship, B.; Urpelainen, J.; Ganesan, K.; Bharadwaj, K.; Balani, K. Perceptions and acceptability of electricity theft: Towards better public service provision. World Dev. 2021, 140, 105301. [Google Scholar] [CrossRef]
- Naqvi, I.; Poorthuis, A.; Govind, A. Urban governance and electricity losses: An exploration of spatial unevenness in Karachi, Pakistan. Energy Res. Soc. Sci. 2021, 79, 102166. [Google Scholar] [CrossRef]
- Winther, T. Electricity theft as a relational issue: A comparative look at Zanzibar, Tanzania, and the Sunderban Islands, India. Energy Sustain. Dev. 2012, 16, 111–119. [Google Scholar] [CrossRef]
- Arkorful, V.E. Unravelling electricity theft whistleblowing antecedents using the theory of planned behavior and norm activation model. Energy Policy 2022, 160, 112680. [Google Scholar] [CrossRef]
- Singh, D.K.; Kediya, S.; Mahajan, R.; Asthana, P.K. Study of non-technical factors responsible for power losses at MSEB. In Proceedings of the 2021 International Conference on Computational Intelligence and Computing Applications (ICCICA), Nagpur, India, 26–27 November 2021. [Google Scholar]
- Razavi, R.; Fleury, M. Socio-economic predictors of electricity theft in developing countries: An Indian case study. Energy Sustain. Dev. 2019, 49, 1–10. [Google Scholar] [CrossRef]
- Never, B. Social norms, trust and control of power theft in Uganda: Does bulk metering work for MSEs. Energy Policy 2015, 82, 197–206. [Google Scholar] [CrossRef]
- Adongo, C.A.; Taale, F.; Bukari, S.; Suleman, S.; Amadu, I. Electricity theft whistleblowing feasibility in commercial accommodation facilities. Energy Policy 2021, 155, 112347. [Google Scholar] [CrossRef]
- Sharma, T.; Pandey, K.K.; Punia, D.K.; Rao, J. Of pilferers and poachers: Combating electricity theft in India. Energy Res. Soc. Sci. 2016, 11, 40–52. [Google Scholar] [CrossRef]
- Gaur, V.; Gupta, E. The determinants of electricity theft: An empirical analysis of Indian states. Energy Policy 2016, 93, 127–136. [Google Scholar] [CrossRef]
- Yurtseven, Ç. The causes of electricity theft: An econometric analysis of the case of Turkey. Util. Policy 2015, 37, 70–78. [Google Scholar] [CrossRef]
- Mendiola, J.E.; Pedrasa, M.A.A. Detection of Pilferage in an AMI-Enabled Low-Voltage Network Using Energy Reading Anomalies. In Proceedings of the 2019 International Conference on Smart Grid Synchronized Measurements and Analytics (SGSMA), College Station, TX, USA, 21–23 May 2019. [Google Scholar]
- Omidvar Tehrani, S.; Shahrestani, A.; Yaghmaee, M.H. Online electricity theft detection framework for large-scale smart grid data. Electr. Power Syst. Res. 2022, 208, 107895. [Google Scholar] [CrossRef]
- Zhang, M. Research on comprehensive diagnosis model of anti-stealing electricity based on big data technology. Energy Rep. 2022, 8, 916–925. [Google Scholar] [CrossRef]
- Xue, L.; Cheng, L.; Li, Y.; Mao, Y. Quantum Machine Learning for Electricity Theft Detection: An Initial Investigation. In Proceedings of the 2021 IEEE International Conferences on Internet of Things (iThings) and IEEE Green Computing & Communications (GreenCom) and IEEE Cyber, Physical & Social Computing (CPSCom) and IEEE Smart Data (SmartData) and IEEE Congress on Cybermatics (Cybermatics), Melbourne, Australia, 6–8 December 2021. [Google Scholar]
- Long, H.; Chen, C.; Gu, W.; Xie, J.; Wang, Z.; Li, G. A Data-Driven Combined Algorithm for Abnormal Power Loss Detection in the Distribution Network. IEEE Access 2020, 8, 24675–24686. [Google Scholar] [CrossRef]
- Buzau, M.M.; Tejedor-Aguilera, J.; Cruz-Romero, P.; Gómez-Expósito, A. Detection of Non-Technical Losses Using Smart Meter Data and Supervised Learning. IEEE Trans. Smart Grids 2019, 10, 2661–2670. [Google Scholar] [CrossRef]
- Haq, E.U.; Huang, J.; Xu, H.; Li, K.; Ahmad, F. A hybrid approach based on deep learning and support vector machine for the detection of electricity theft in power grids. Energy Rep. 2021, 7, 349–356. [Google Scholar] [CrossRef]
- Depuru, S.S.S.R.; Wang, L.; Devabhaktuni, V.; Green, R.C. High-performance computing for detection of electricity theft. Int. J. Electr. Power Energy Syst. 2013, 47, 21–30. [Google Scholar] [CrossRef]
- Ahmad, T.; Chen, H.; Wang, J.; Guo, Y. Review of various modeling techniques for the detection of electricity theft in smart grid environment. Renew. Sustain. Energy Rev. 2018, 82, 2916–2933. [Google Scholar] [CrossRef]
- Kong, X.; Zhao, X.; Liu, C.; Li, Q.; Dong, D.L.; Li, Y. Electricity theft detection in low-voltage stations based on similarity measure and DT-KSVM. Int. J. Electr. Power Energy Syst. 2021, 125, 106544. [Google Scholar] [CrossRef]
- Messinis, G.M.; Rigas, A.E.; Hatziargyriou, N.D. A Hybrid Method for Non-Technical Loss Detection in Smart Distribution Grids. IEEE Trans. Smart Grids 2019, 10, 6080–6091. [Google Scholar] [CrossRef]
- Engelbrecht, J.; Hancke, G.P.; Osifeko, M.O. Design and Implementation of an Electrical Tamper Detection System. In Proceedings of the IECON 2019—45th Annual Conference of the IEEE Industrial Electronics Society, Lisbon, Portugal, 14–17 October 2019. [Google Scholar]
- Massaferro, P.; Martino, J.M.D.; Fernandez, A. Fraud Detection on Power Grids While Transitioning to Smart Meters by Leveraging Multi-Resolution Consumption Data. IEEE Trans. Smart Grids 2022, 13, 2381–2389. [Google Scholar] [CrossRef]
- Esmael, A.A.; da Silva, H.H.; Ji, T.; da Silva Torres, R. Non-Technical Loss Detection in Power Grid Using Information Retrieval Approaches: A Comparative Study. IEEE Access 2021, 9, 40635–40648. [Google Scholar] [CrossRef]
- Arif, A.; Alghamdi, T.A.; Khan, Z.A.; Javaid, N. Towards Efficient Energy Utilization Using Big Data Analytics in Smart Cities for Electricity Theft Detection. Big Data Res. 2022, 27, 100285. [Google Scholar] [CrossRef]
- Javaid, N.; Gul, H.; Baig, S.; Shehzad, F.; Xia, C.; Guan, L.; Sultana, T. Using GANCNN and ERNET for Detection of Non-Technical Losses to Secure Smart Grids. IEEE Access 2021, 9, 98679–98700. [Google Scholar] [CrossRef]
- Lee, J.; Sun, Y.G.; Sim, I.; Kim, S.H.; Kim, D.I.; Kim, J.Y. Non-Technical Loss Detection Using Deep Reinforcement Learning for Feature Cost Efficiency and Imbalanced Dataset. IEEE Access 2022, 10, 27084–27095. [Google Scholar] [CrossRef]
- Fei, K.; Li, Q.; Zhu, C. Non-technical losses detection using missing values’ pattern and neural architecture search. Int. J. Electr. Power Energy Syst. 2022, 134, 107410. [Google Scholar] [CrossRef]
- Pereira, J.; Saraiva, F. Convolutional neural network applied to detect electricity theft: A comparative study on unbalanced data handling techniques. Int. J. Electr. Power Energy Syst. 2021, 131, 107085. [Google Scholar] [CrossRef]
- Yang, J.; Fei, K.; Ren, F.; Li, Q.; Li, J.; Duan, Y.; Dong, L. Non-technical Loss Detection using Missing Values’ Pattern. In Proceedings of the 2020 International Conference on Smart Grid and Clean Energy Technologies (ICSGCE), Kuching, Malaysia, 4–7 October 2020. [Google Scholar]
- Fei, K.; Li, Q.; Zhu, C.; Dong, M.; Li, Y. Electricity frauds detection in Low-voltage networks with contrastive predictive coding. Int. J. Electr. Power Energy Syst. 2022, 137, 107715. [Google Scholar] [CrossRef]
- Niu, Z.; Zhang, G. A Data-Driven Method for Electricity Theft Detection Combing ConvGRU and K-means Clustering. In Proceedings of the 2021 IEEE 5th Conference on Energy Internet and Energy System Integration (EI2), Taiyuan, China, 22–24 October 2021. [Google Scholar]
- Ayub, N.; Aurangzeb, K.; Awais, M.; Ali, U. Electricity Theft Detection Using CNN-GRU and Manta Ray Foraging Optimization Algorithm. In Proceedings of the 2020 IEEE 23rd International Multitopic Conference (INMIC), Bahawalpur, Pakistan, 5–7 November 2020. [Google Scholar]
- Hasan, M.N.; Toma, R.N.; Nahid, A.; Islam, M.M.M. Electricity Theft Detection in Smart Grid Systems: A CNN-LSTM Based Approach. Energies 2019, 12, 3310. [Google Scholar] [CrossRef]
- Javaid, N.; Jan, N.; Javed, M.U. An adaptive synthesis to handle imbalanced big data with deep siamese network for electricity theft detection in smart grids. J. Parallel Distrib. Comput. 2021, 153, 44–52. [Google Scholar] [CrossRef]
- Li, S.; Han, Y.; Yao, X.; Yingchen, S.; Wang, J.; Zhao, Q. Electricity Theft Detection in Power Grids with Deep Learning and Random Forests. J. Electr. Comput. Eng. 2019, 20, 1–12. [Google Scholar] [CrossRef]
- Lepolesa, L.J.; Achari, S.; Cheng, L. Electricity Theft Detection in Smart Grids Based on Deep Neural Network. IEEE Access 2022, 10, 39638–39655. [Google Scholar] [CrossRef]
- Buzau, M.M.; Tejedor-Aguilera, J.; Cruz-Romero, P.; Gómez-Expósito, A. Hybrid Deep Neural Networks for Detection of Non-Technical Losses in Electricity Smart Meters. IEEE Trans. Power Syst. 2020, 35, 1254–1263. [Google Scholar] [CrossRef]
- Mujeeb, S.; Javaid, N.; Ahmed, A.; Gulfam, S.M.; Qasim, U.; Shafiq, M.; Choi, J.-G. Electricity Theft Detection with Automatic Labeling and Enhanced RUSBoost Classification Using Differential Evolution and Jaya Algorithm. IEEE Access 2021, 9, 128521–128539. [Google Scholar] [CrossRef]
- Li, J.; Liao, W.; Yang, R.; Chen, Z. A Data Augmentation Method for Distributed Photovoltaic Electricity Theft Using Wasserstein Generative Adversarial Network. In Proceedings of the 2021 IEEE 5th Conference on Energy Internet and Energy System Integration (EI2), Taiyuan, China, 22–24 October 2021. [Google Scholar]
- Aslam, Z.; Ahmed, F.; Almogren, A.; Shafiq, M.; Zuair, M.; Javaid, N. An Attention Guided Semi-Supervised Learning Mechanism to Detect Electricity Frauds in the Distribution Systems. IEEE Access 2020, 8, 221767–221782. [Google Scholar] [CrossRef]
- Huang, Y.; Xu, Q. Electricity theft detection based on stacked sparse denoising autoencoder. Int. J. Electr. Power Energy Syst. 2021, 125, 106448. [Google Scholar] [CrossRef]
- Takiddin, A.; Ismail, M.; Zafar, U.; Serpedin, E. Deep Autoencoder-Based Anomaly Detection of Electricity Theft Cyberattacks in Smart Grids. IEEE Syst. J. 2022, 16, 4106–4117. [Google Scholar] [CrossRef]
- Ayub, N.; Aurangzeb, K.; Awais, M.; Ali, U. Energy theft detection in an edge data center using threshold-based abnormality detector. Int. J. Electr. Power Energy Syst. 2020, 121, 106162. [Google Scholar]
- Shehzad, F.; Javaid, N.; Aslam, S.; Javed, M.U. Electricity theft detection using big data and genetic algorithm in electric power systems. Electr. Power Syst. Res. 2022, 209, 107975. [Google Scholar] [CrossRef]
- Ullah, A.; Javaid, N.; Asif, M.; Javed, M.U.; Yahaya, A.S. AlexNet, AdaBoost and Artificial Bee Colony Based Hybrid Model for Electricity Theft Detection in Smart Grids. IEEE Access 2022, 10, 18681–18694. [Google Scholar] [CrossRef]
- Gunturi, S.K.; Sarkar, D. Ensemble machine learning models for the detection of energy theft. Electr. Power Syst. Res. 2021, 192, 106904. [Google Scholar] [CrossRef]
- Sharma, R.; Joshi, A.M.; Sahu, C.; Sharma, G.; Akindeji, K.T.; Sharma, S. Semi Supervised Cyber Attack Detection System for Smart Grid. In Proceedings of the 2022 30th Southern African Universities Power Engineering Conference (SAUPEC), Durban, South Africa, 25–27 January 2022. [Google Scholar]
- Alharbi, M.; Alghumayjan, S.; Alsaleh, M.; Shah, D.; Alabdulkareem, A. Electricity Non-Technical Loss Detection: Enhanced Cost-Driven Approach Utilizing Synthetic Control. In Proceedings of the 2021 IEEE Power & Energy Society Innovative Smart Grid Technologies Conference, Washington, DC, USA, 16–18 February 2021. [Google Scholar]
- Massaferro, P.; Marichal, H.; Di Martino, M.; Santomauro, F.; Kosut, J.P.; Fernandez, A. Improving electricity non-technical losses detection including neighborhood information. In Proceedings of the 2018 IEEE Power & Energy Society General Meeting (PESGM), Portland, OR, USA, 5–9 August 2018. [Google Scholar]
- Muzumdar, A.; Modi, C.; Vyjayanthi, C. Designing a blockchain-enabled privacy-preserving energy theft detection system for smart grid neighborhood area network. Electr. Power Syst. Res. 2022, 207, 107884. [Google Scholar] [CrossRef]
- Viegas, J.L.; Esteves, P.R.; Melício, R.; Mendes, V.M.F.; Vieira, S.M. Solutions for detection of non-technical losses in the electricity grid: A review. Renew. Sustain. Energy Rev. 2017, 80, 1256–1268. [Google Scholar] [CrossRef]
- UMass Dataset. Available online: https://traces.cs.umass.edu/index.php/Smart/Smart (accessed on 10 October 2023).
- SGCC Dataset. Available online: https://github.com/henryRDlab/ElectricityTheftDetection (accessed on 10 October 2023).
- Irish Smart Energy Trial (ISET) Dataset. Available online: https://www.ucd.ie/issda/data/commissionforenergyregulationcer/ (accessed on 10 October 2023).
- Household Electric Power Consumption. Available online: https://www.kaggle.com/datasets/uciml/electric-power-consumption-data-set?resource=download (accessed on 10 October 2023).
- Electric Load Diagrams Dataset. Available online: https://archive.ics.uci.edu/ml/datasets/ElectricityLoadDiagrams20112014 (accessed on 10 October 2023).
- Load Profiles for TMY3 Location Dataset. Available online: https://data.openei.org/submissions/153 (accessed on 10 October 2023).
- Low Carbon London Smart Meter Trial Dataset. Available online: https://data.london.gov.uk/dataset/smartmeter-energy-use-data-in-london-households (accessed on 10 October 2023).
- Open Energy Information. Available online: https://openei.org/wiki/Data (accessed on 10 October 2023).
- Pecan Street Dataset. Available online: https://www.pecanstreet.org/work/energy/ (accessed on 10 October 2023).
- AEA Dataset. Available online: https://www.aeaweb.org/journals/data/data-code-policy (accessed on 10 October 2023).
- PRECON Dataset. Available online: https://web.lums.edu.pk/~eig/precon.html (accessed on 10 October 2023).
- Nadeem, A.; Arshad, N. PRECON: Pakistan Residential Electricity Consumption Dataset. In Proceedings of the 2019 the Tenth ACM International Conference on Future Energy Systems, New York, NY, USA, 25–28 June 2019. [Google Scholar]
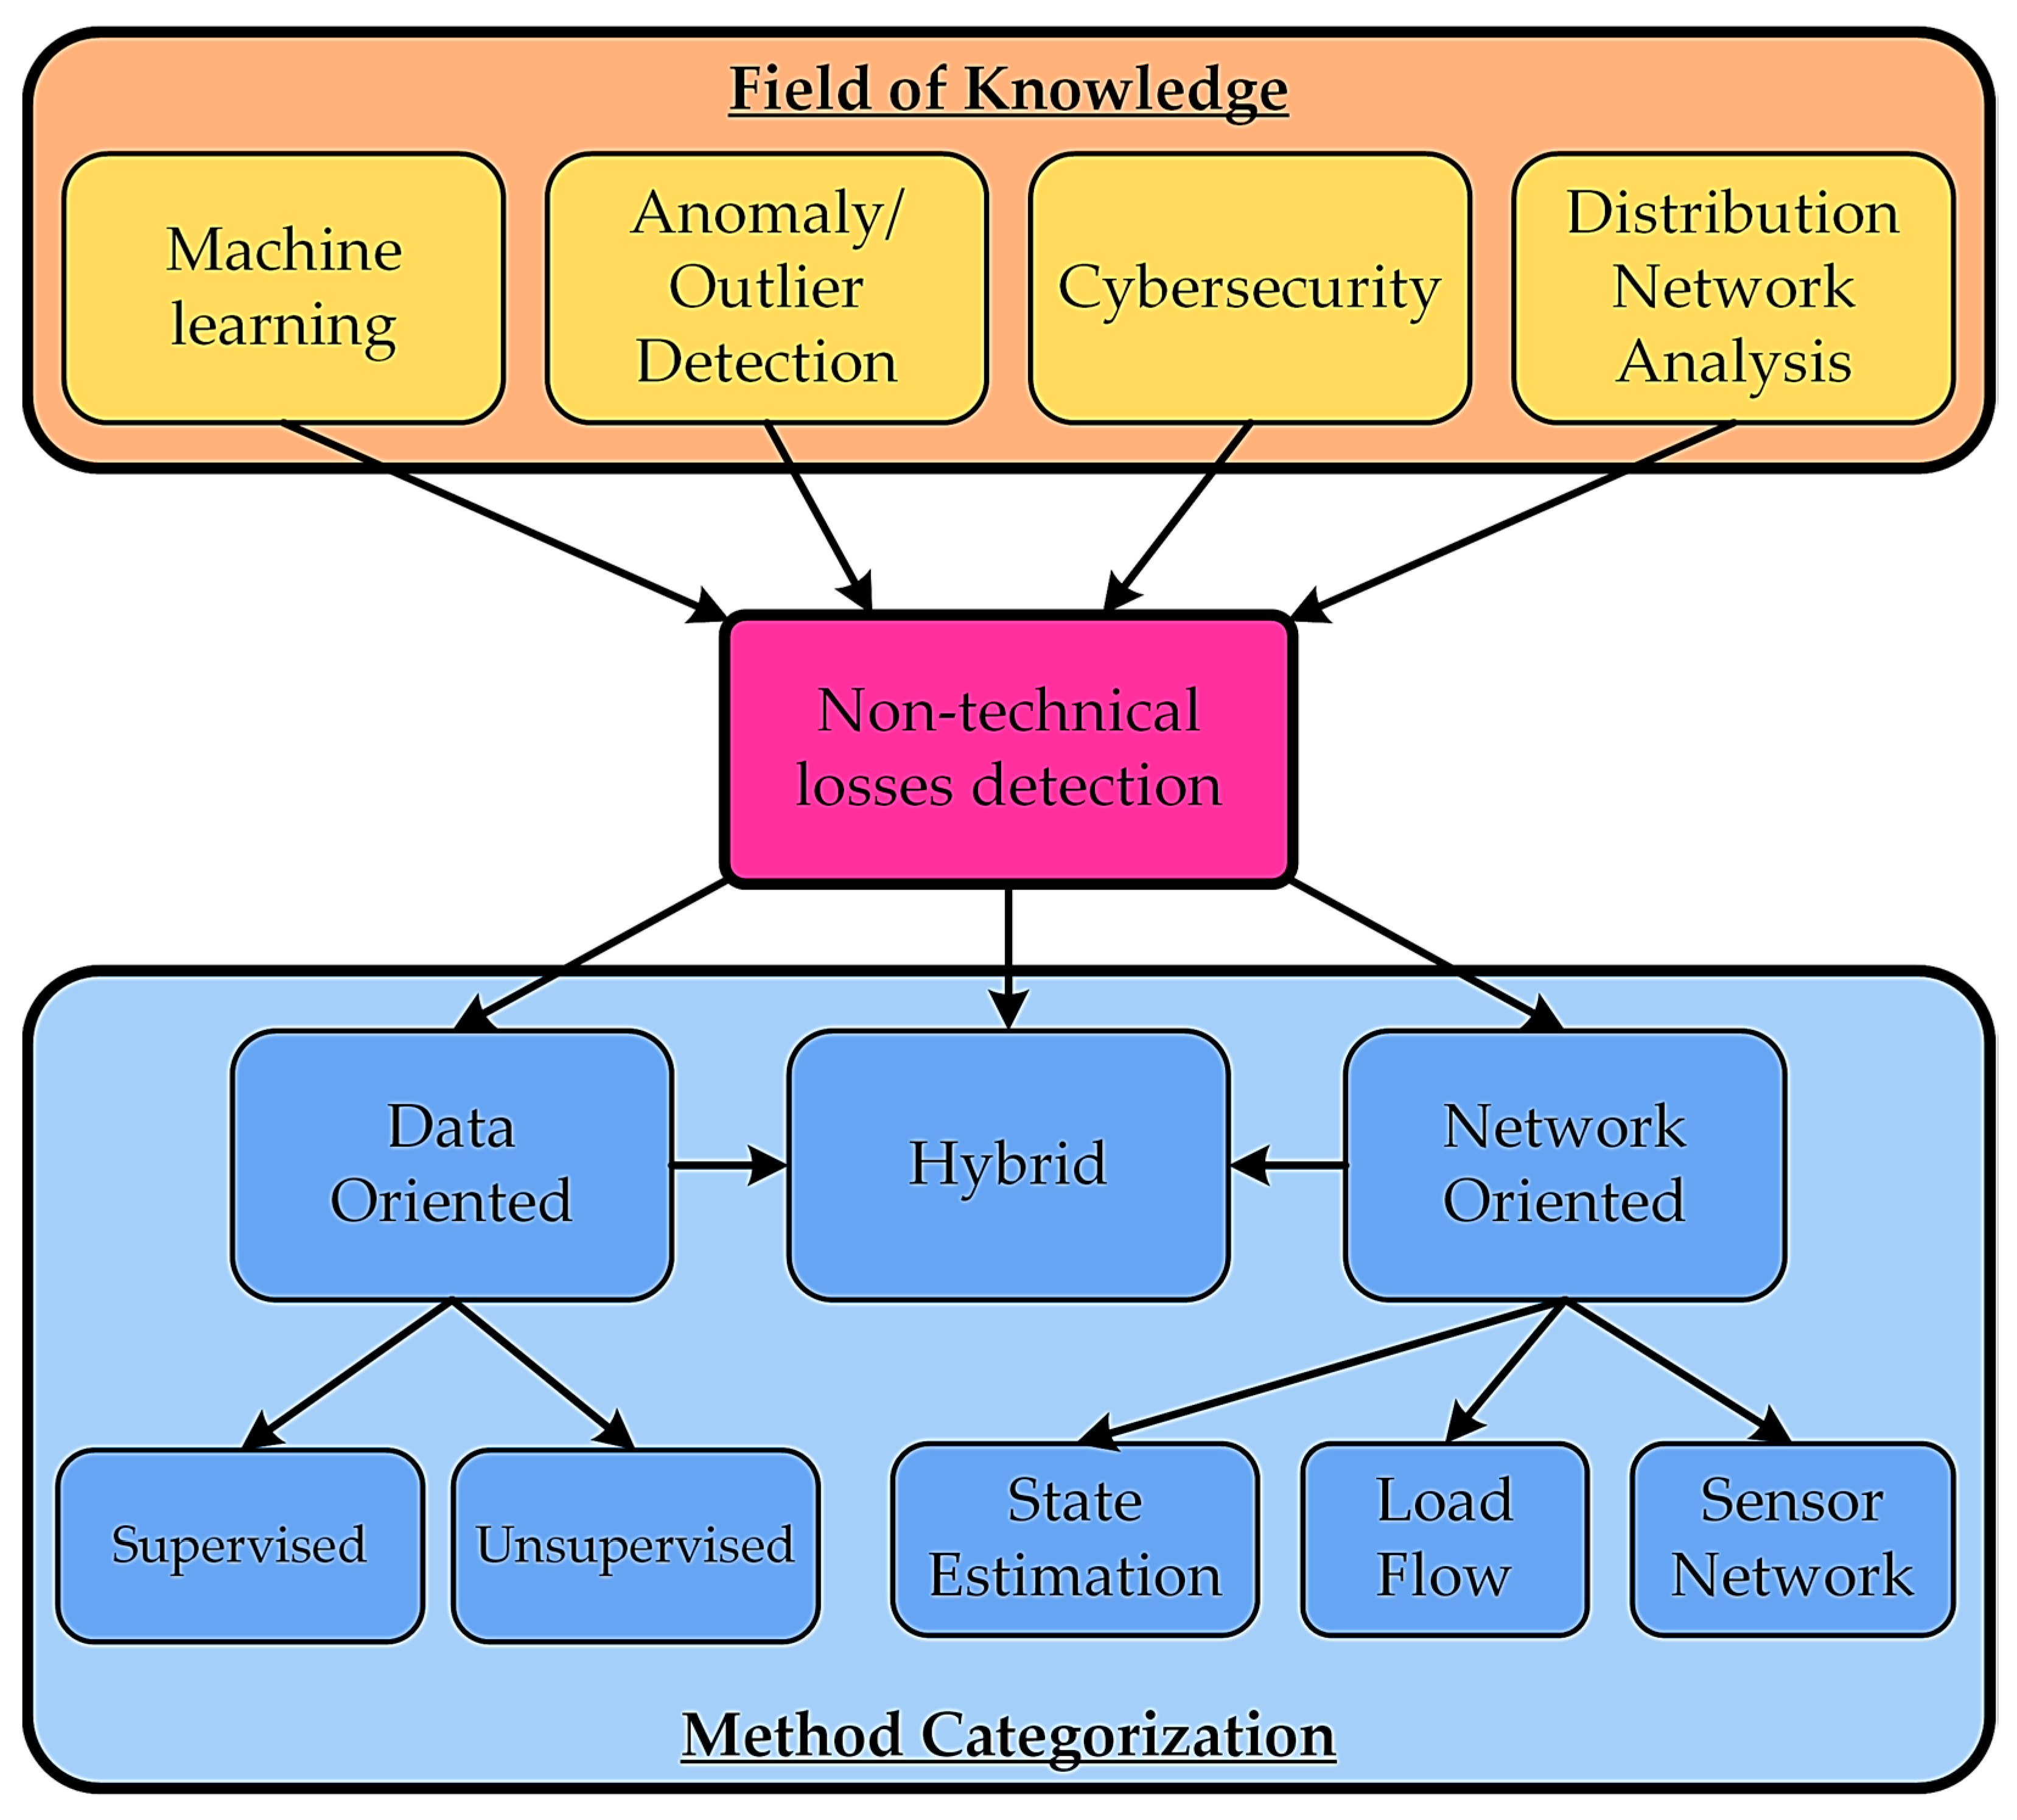
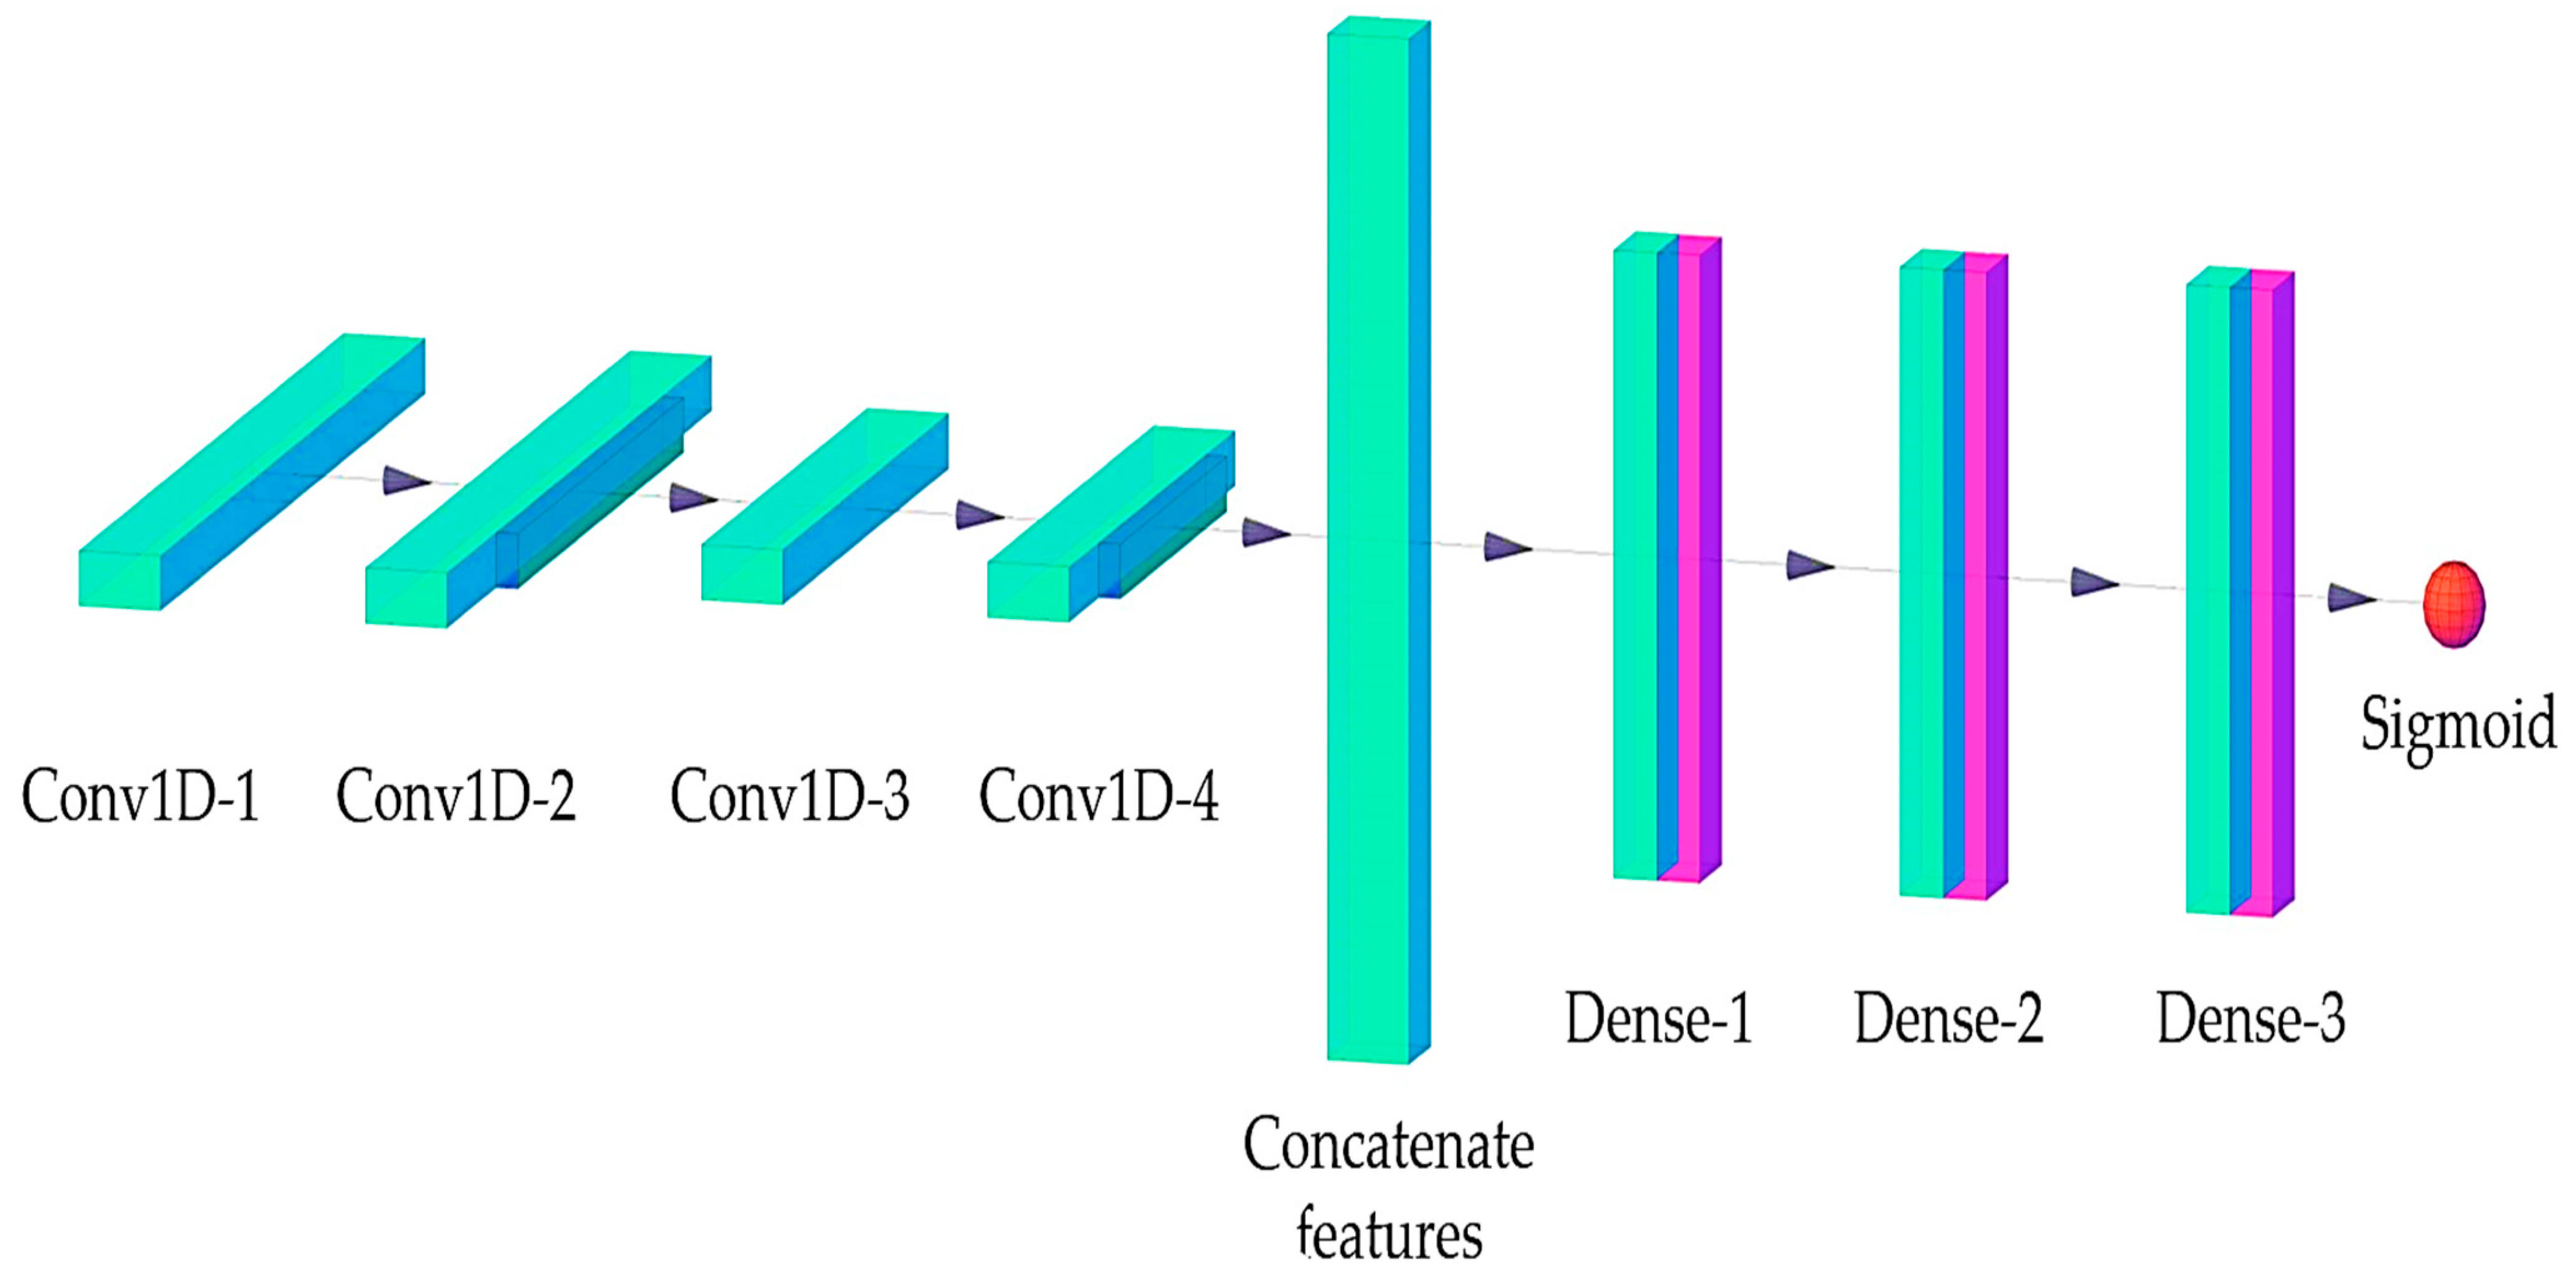
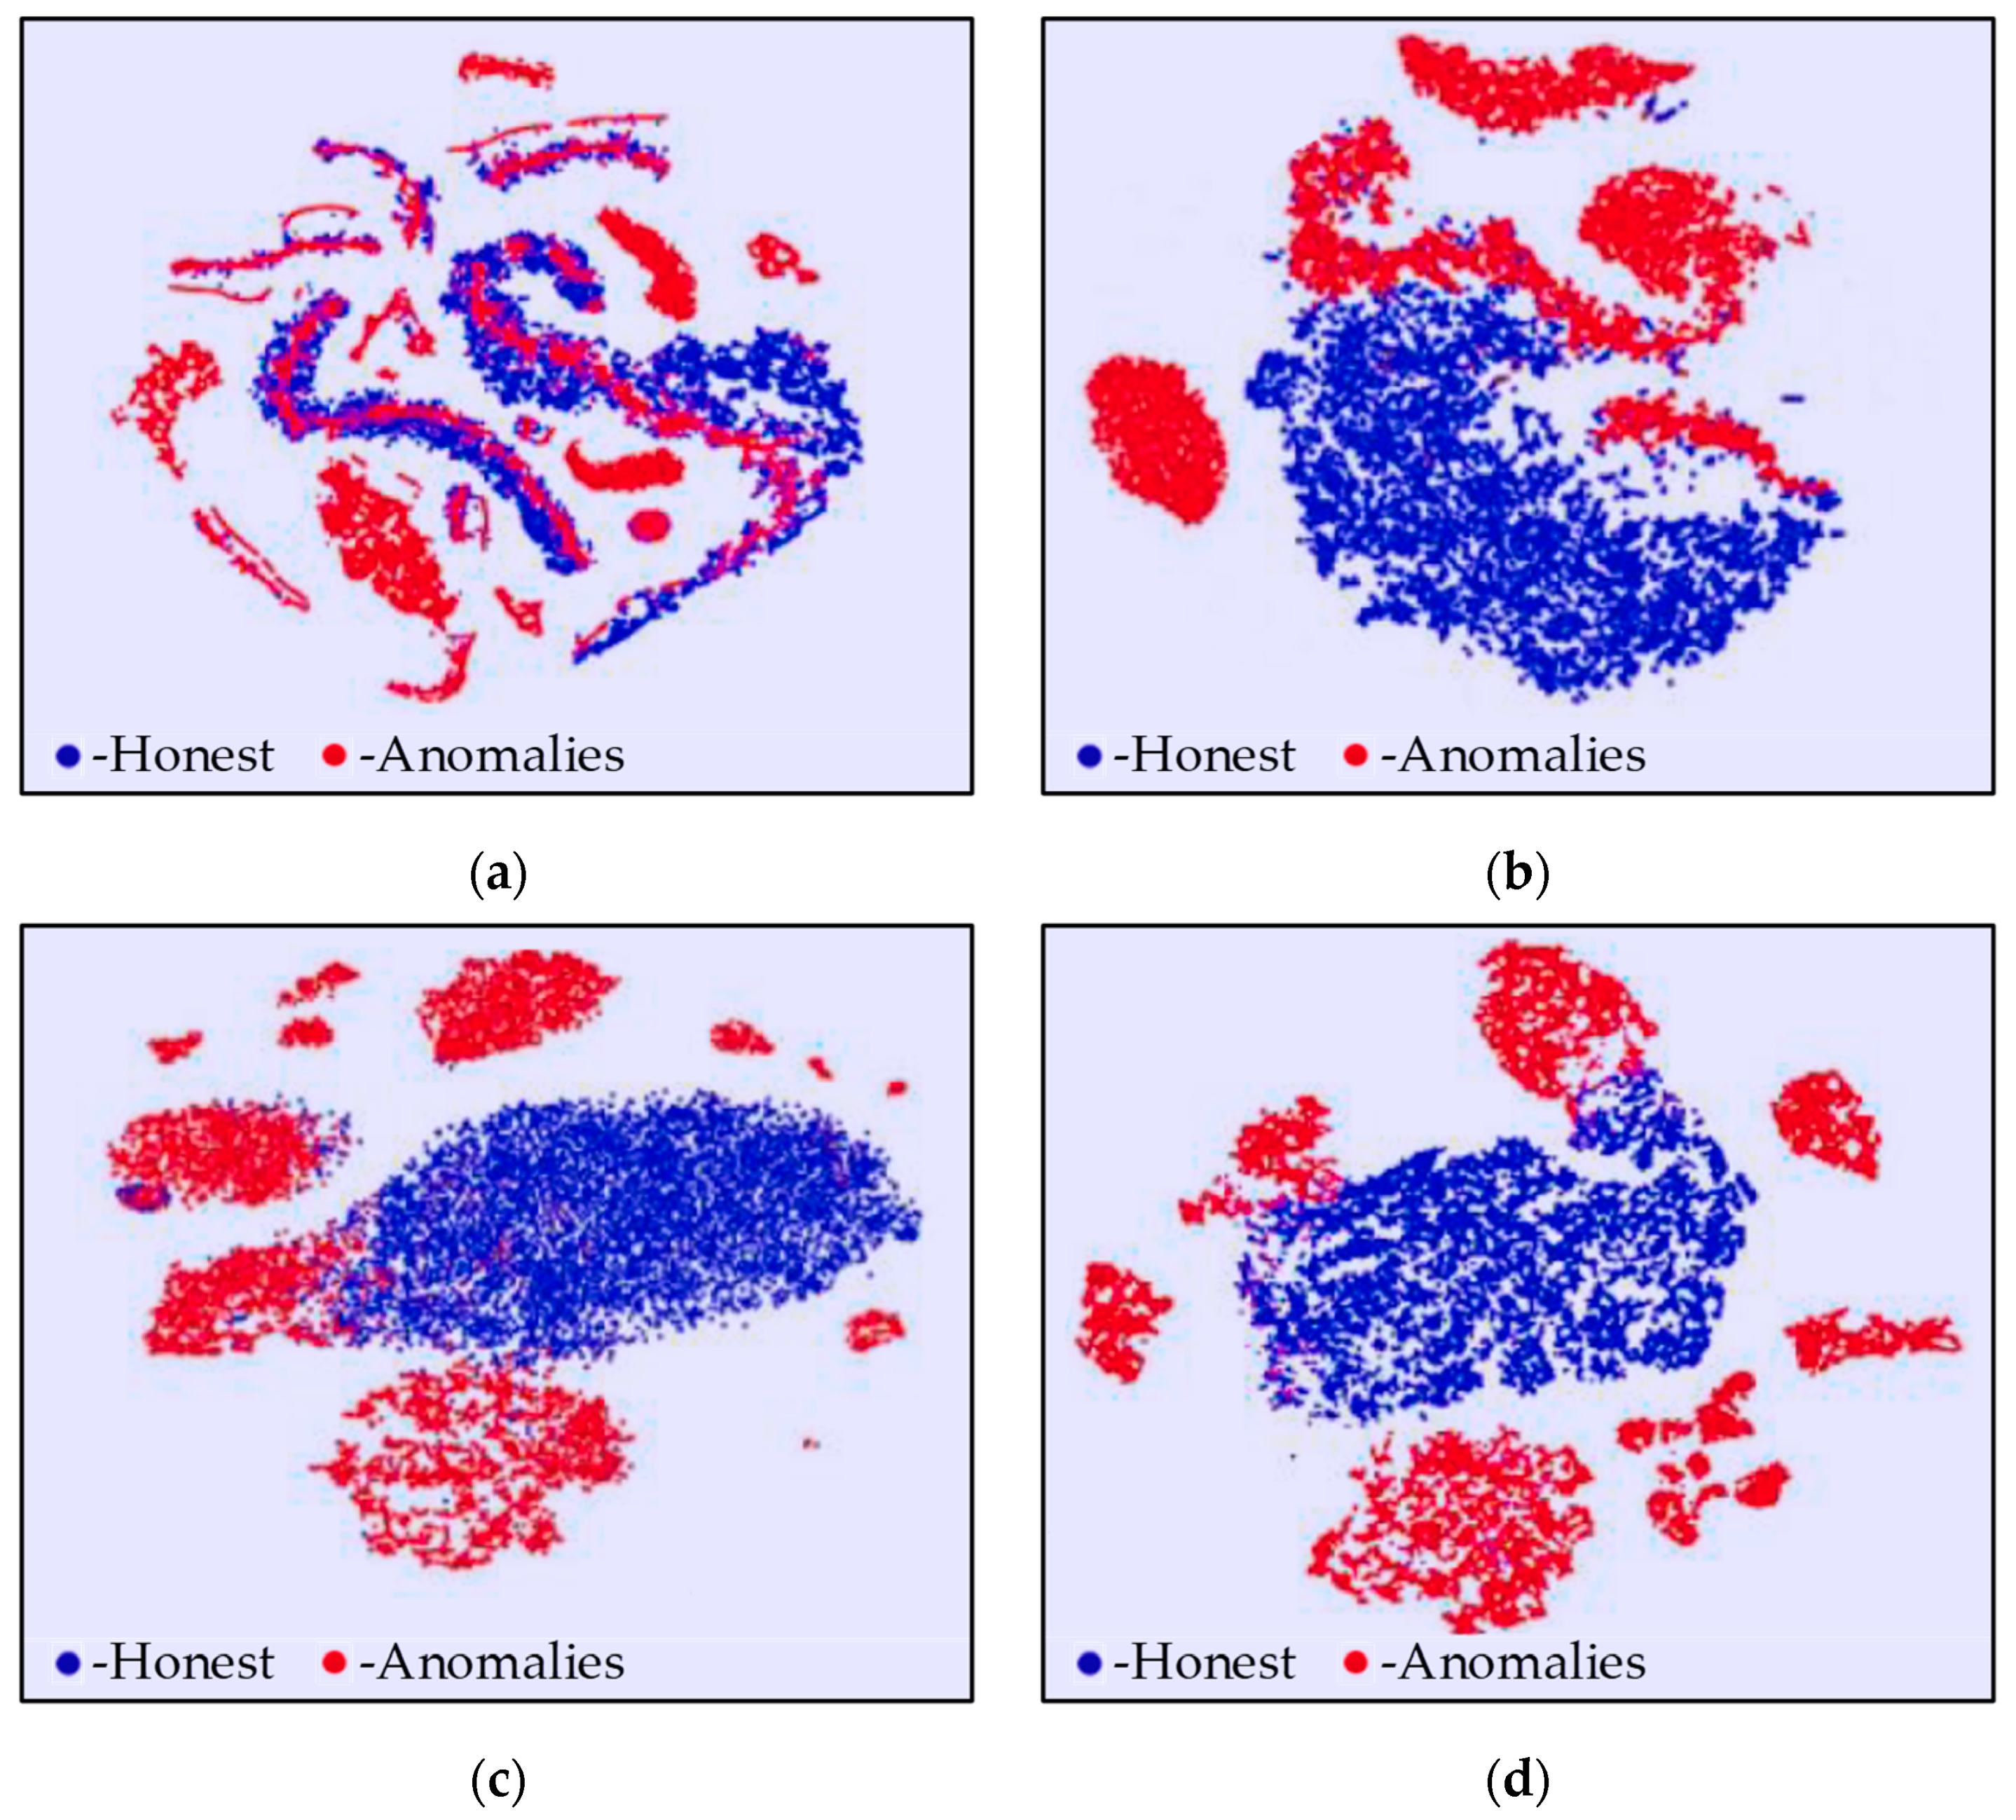
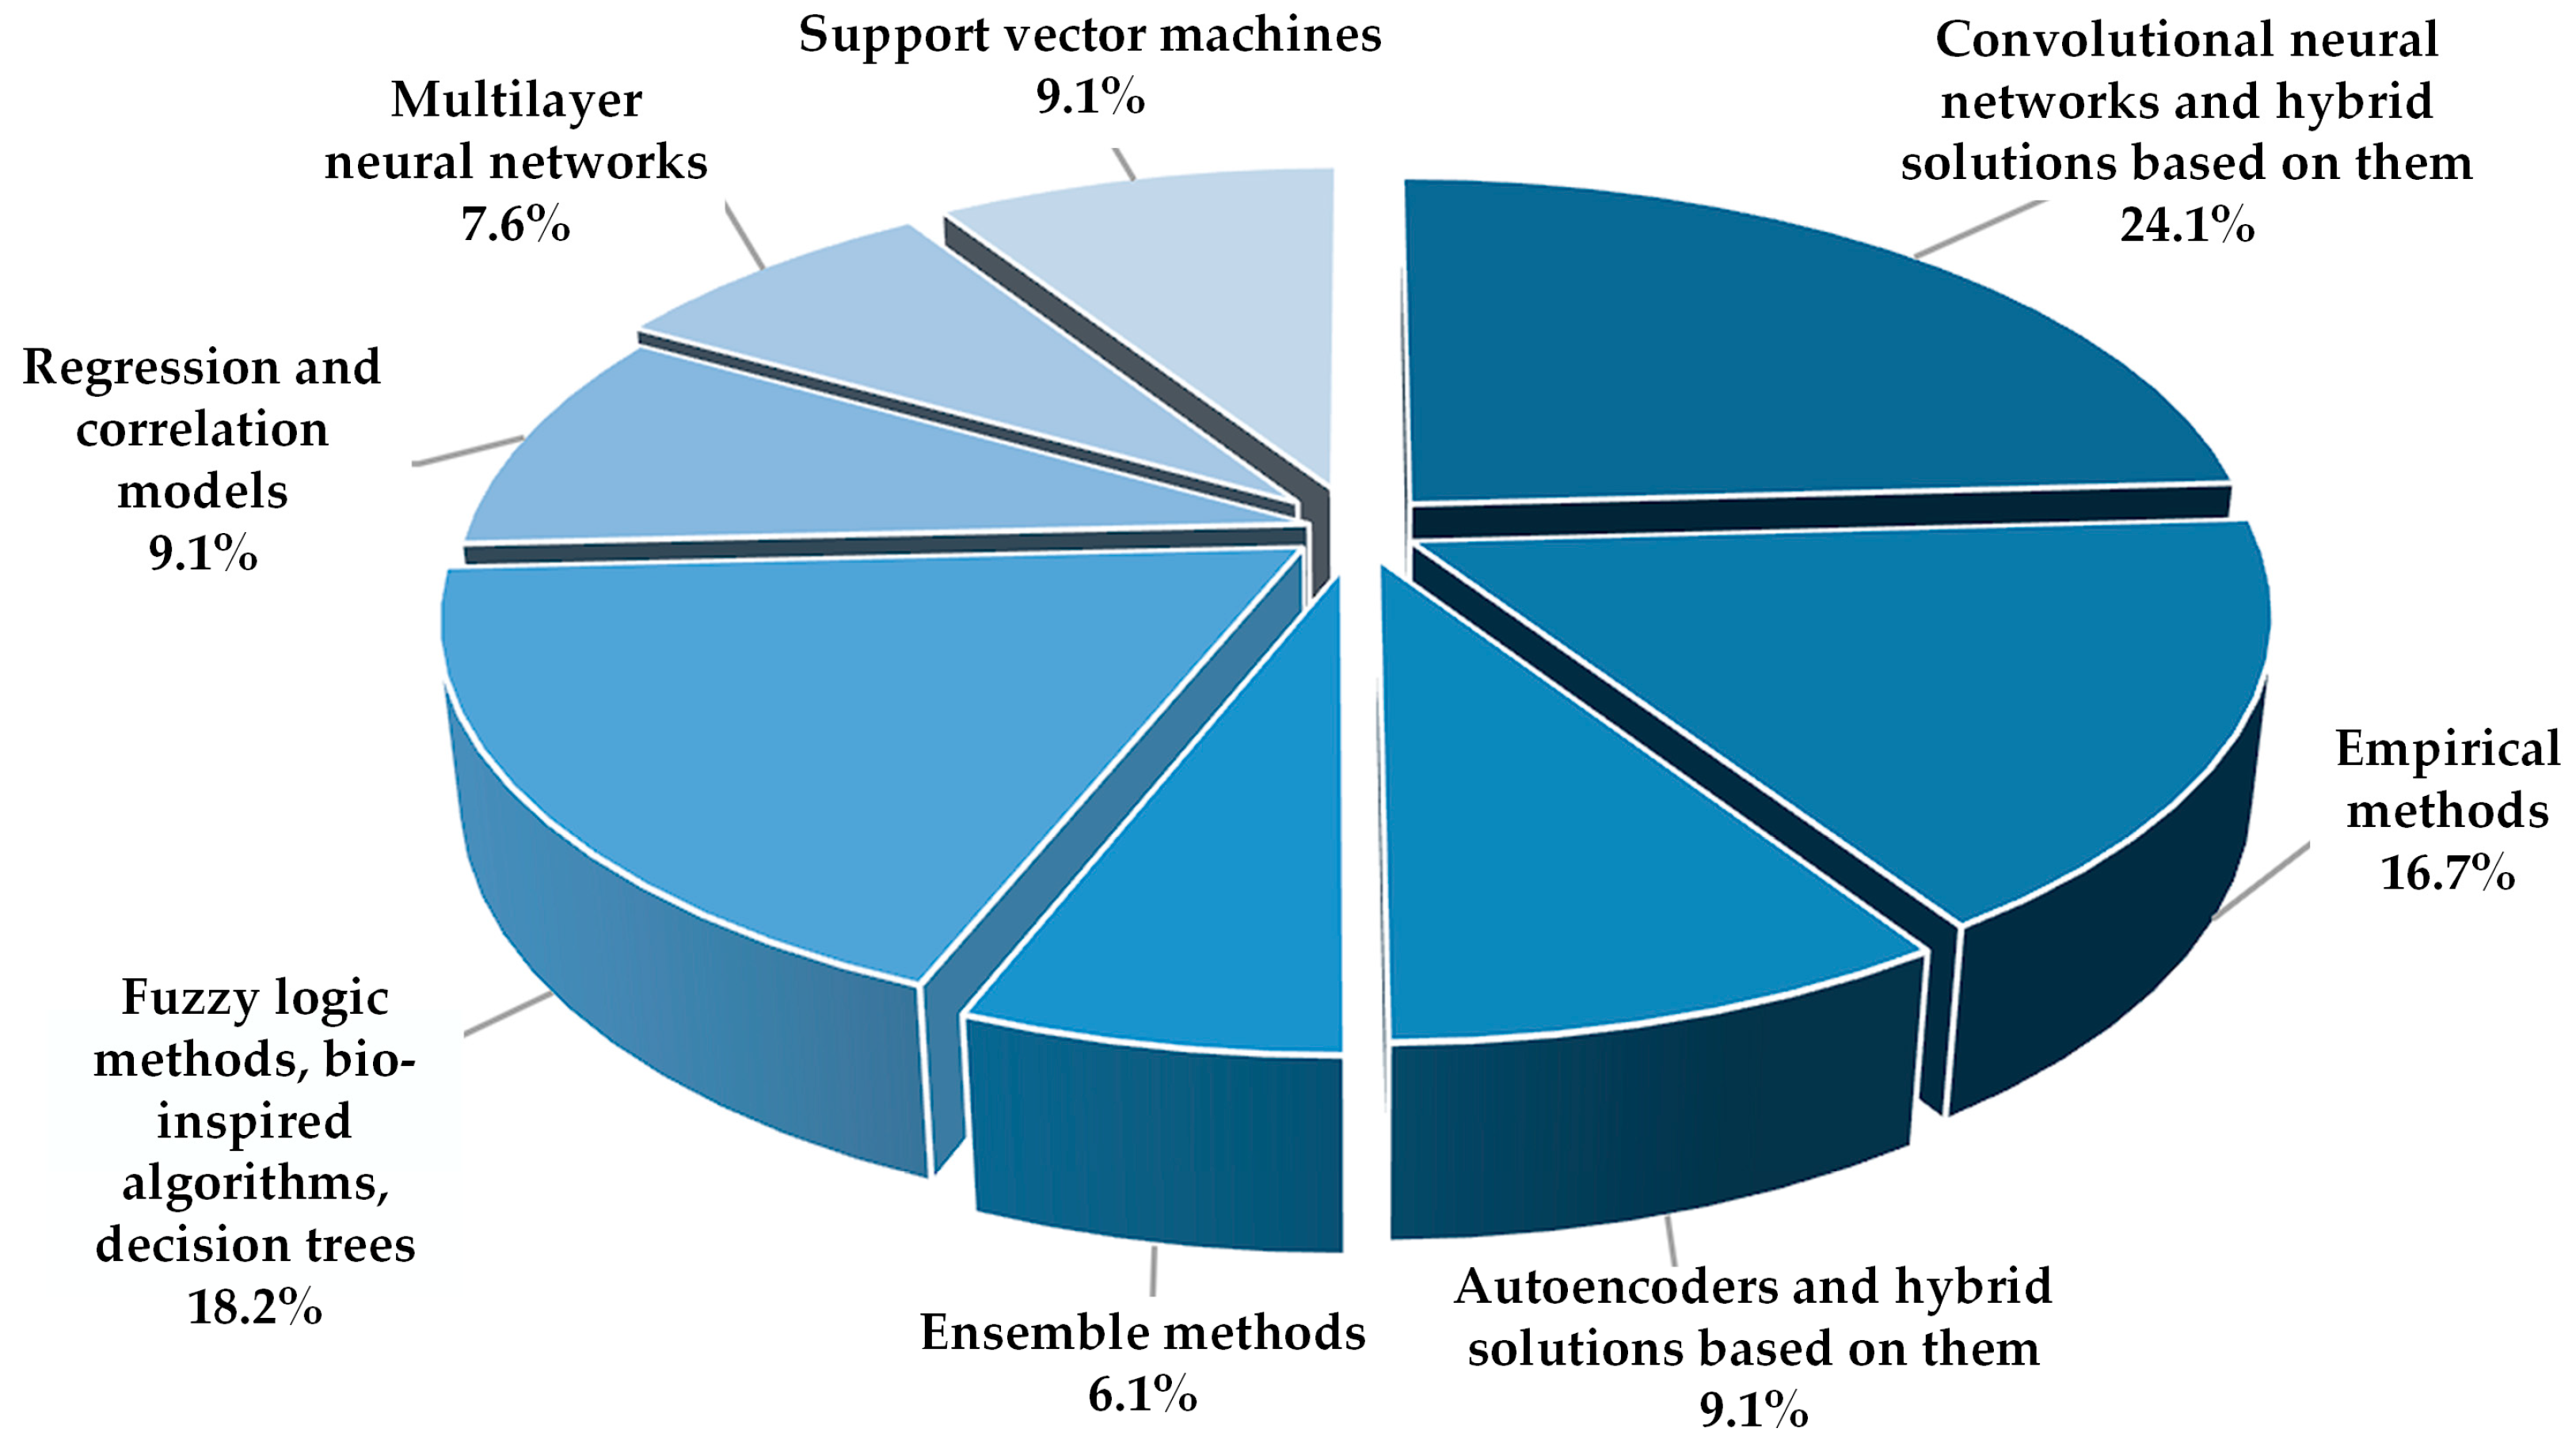
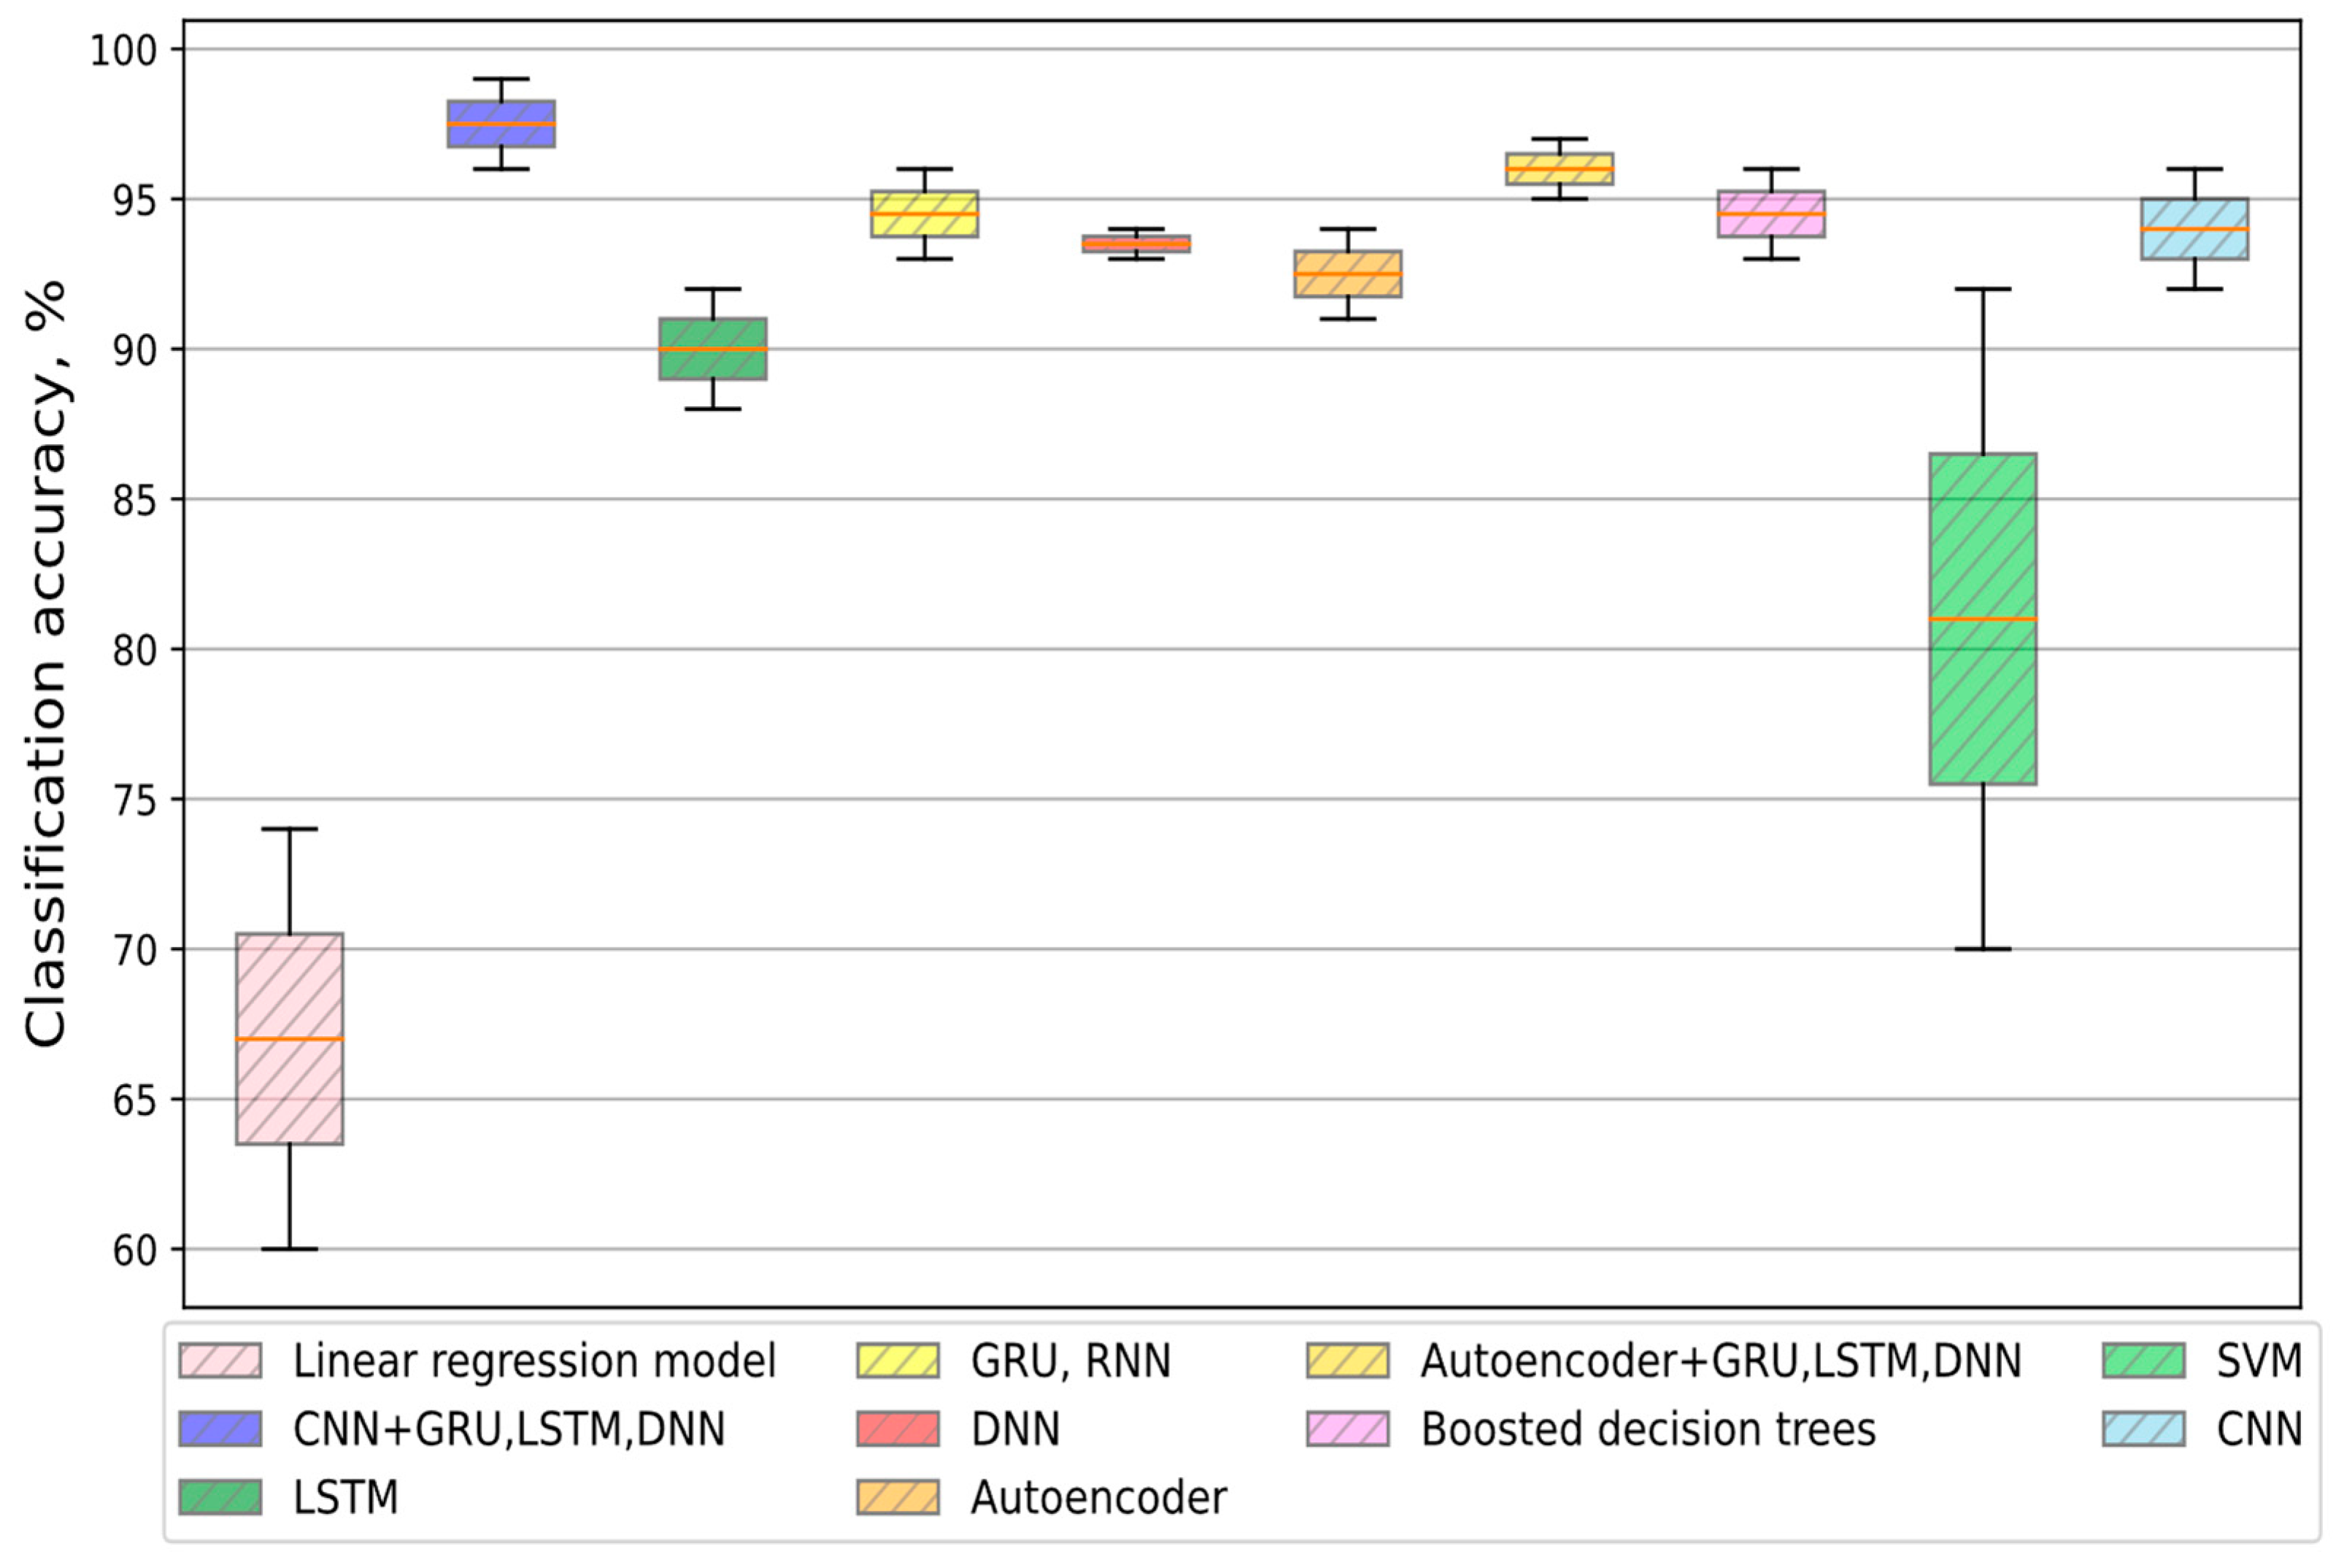
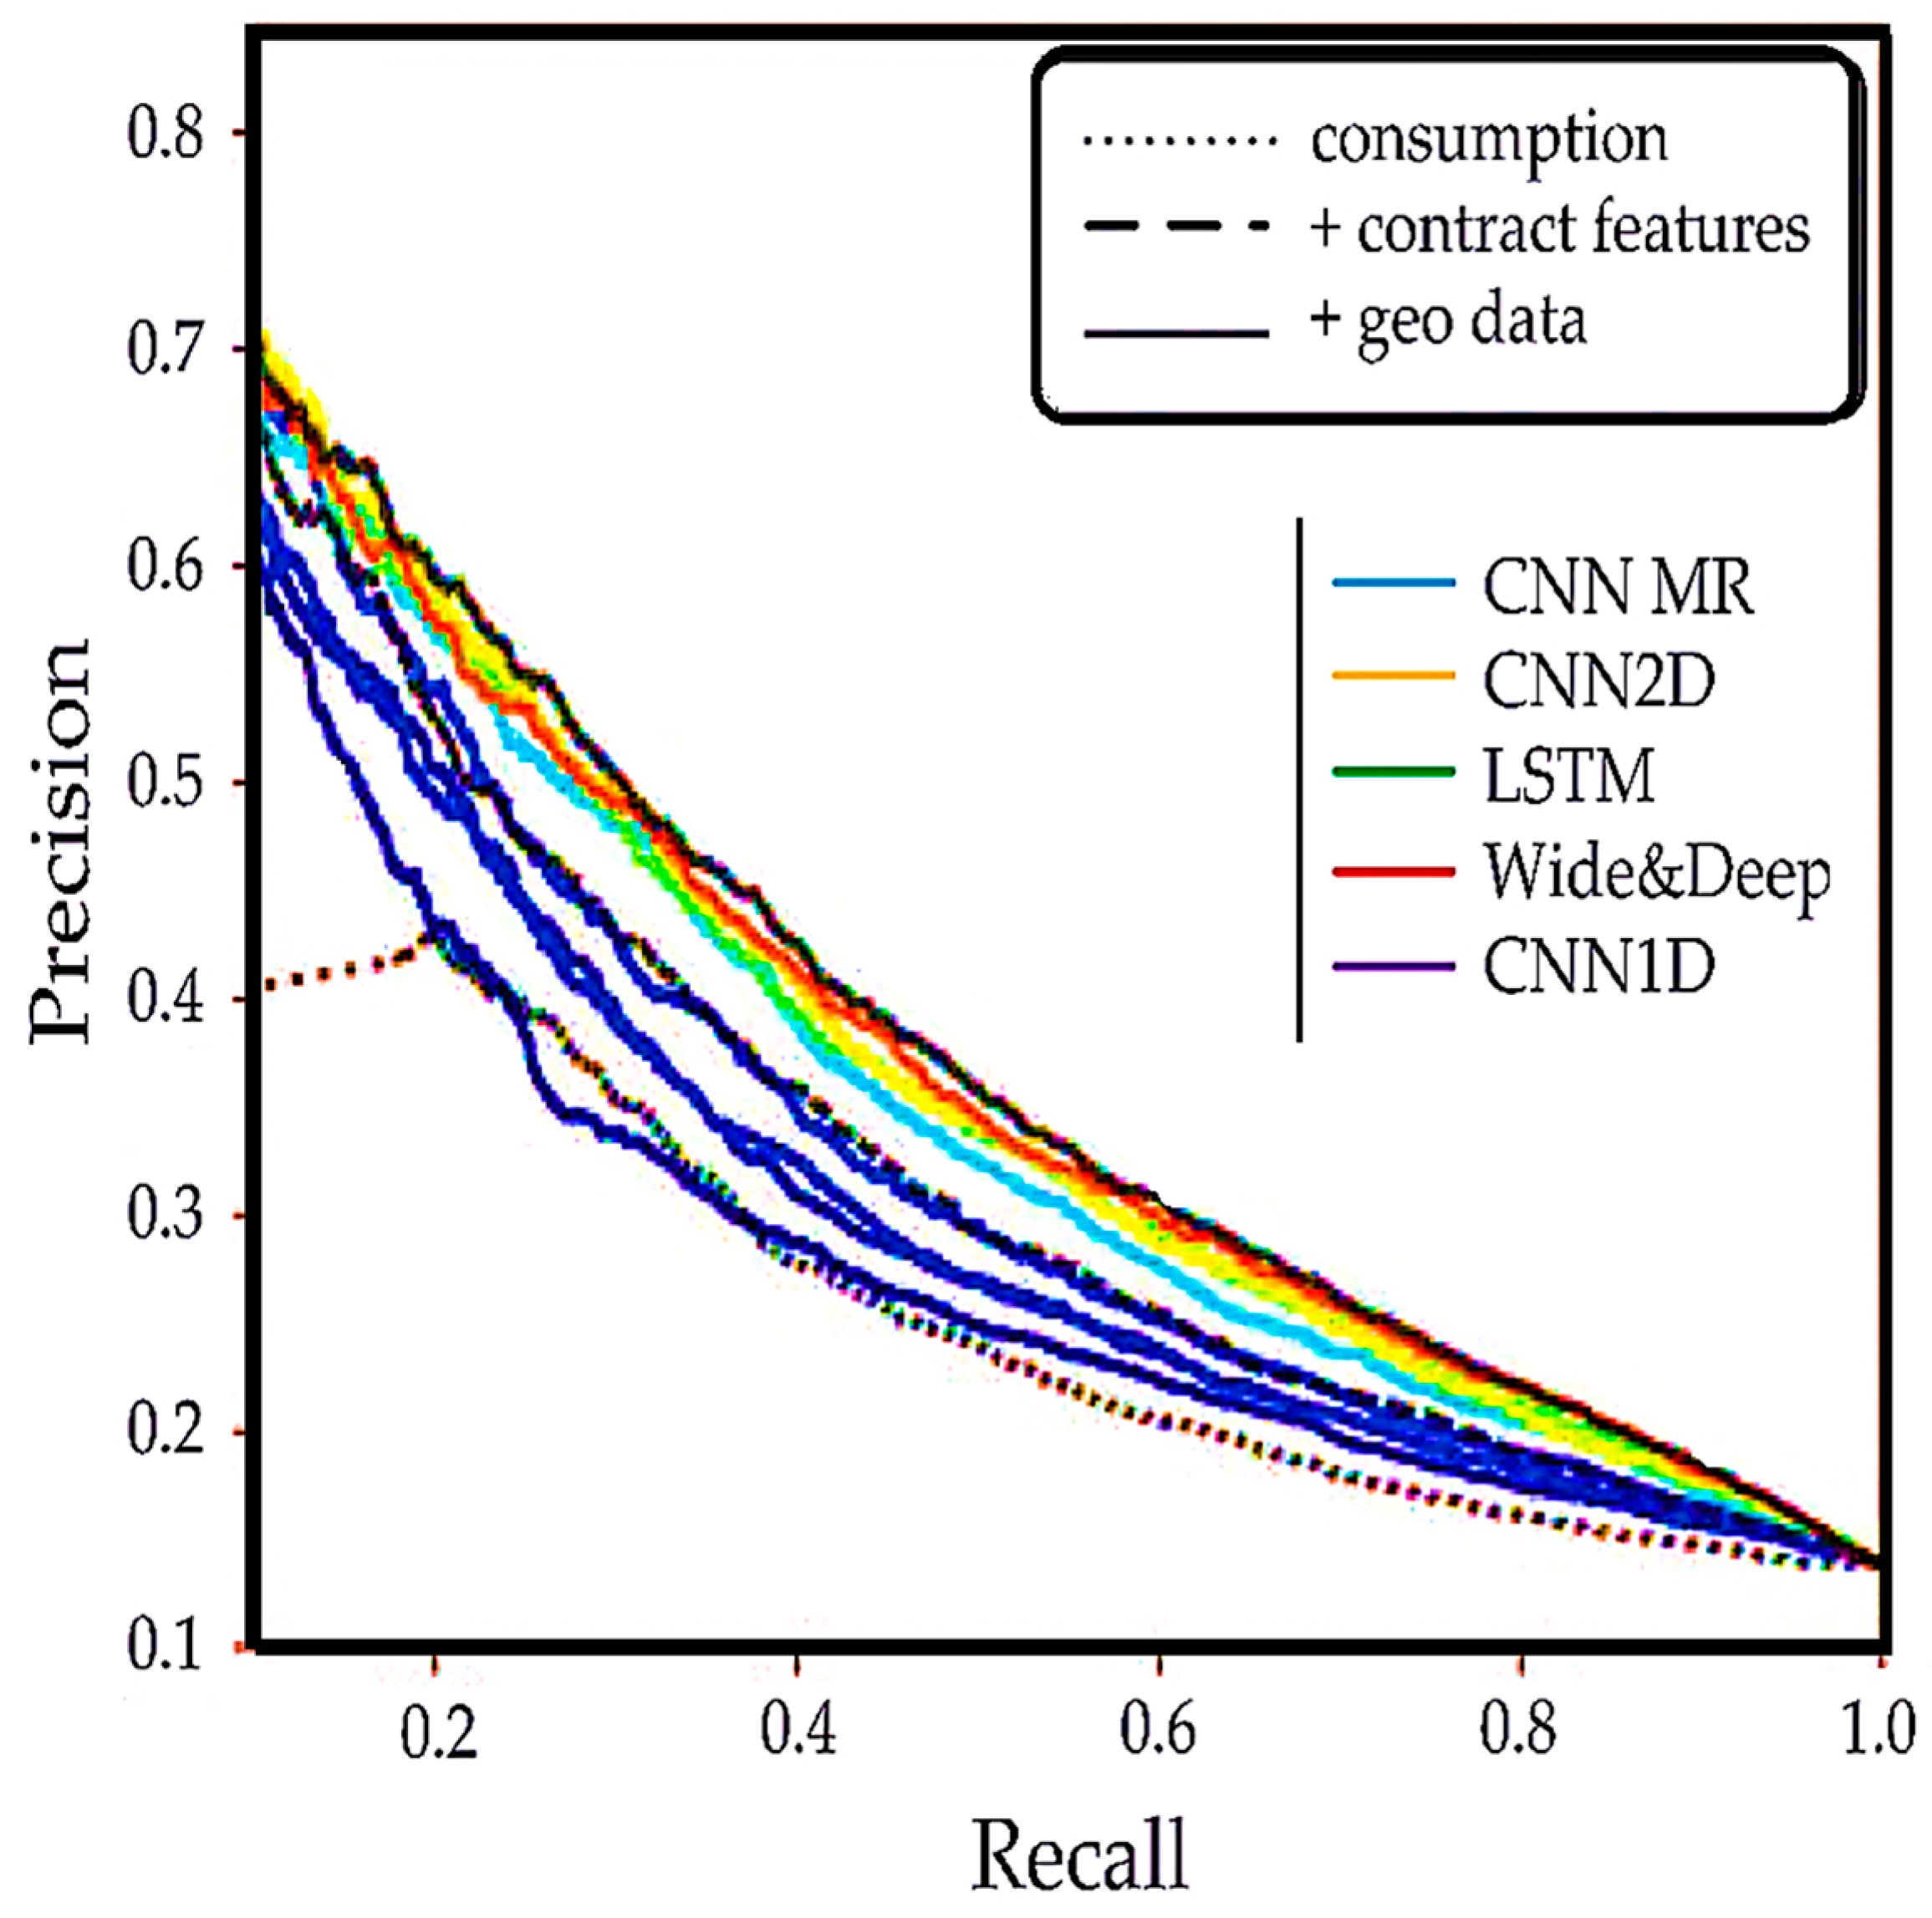
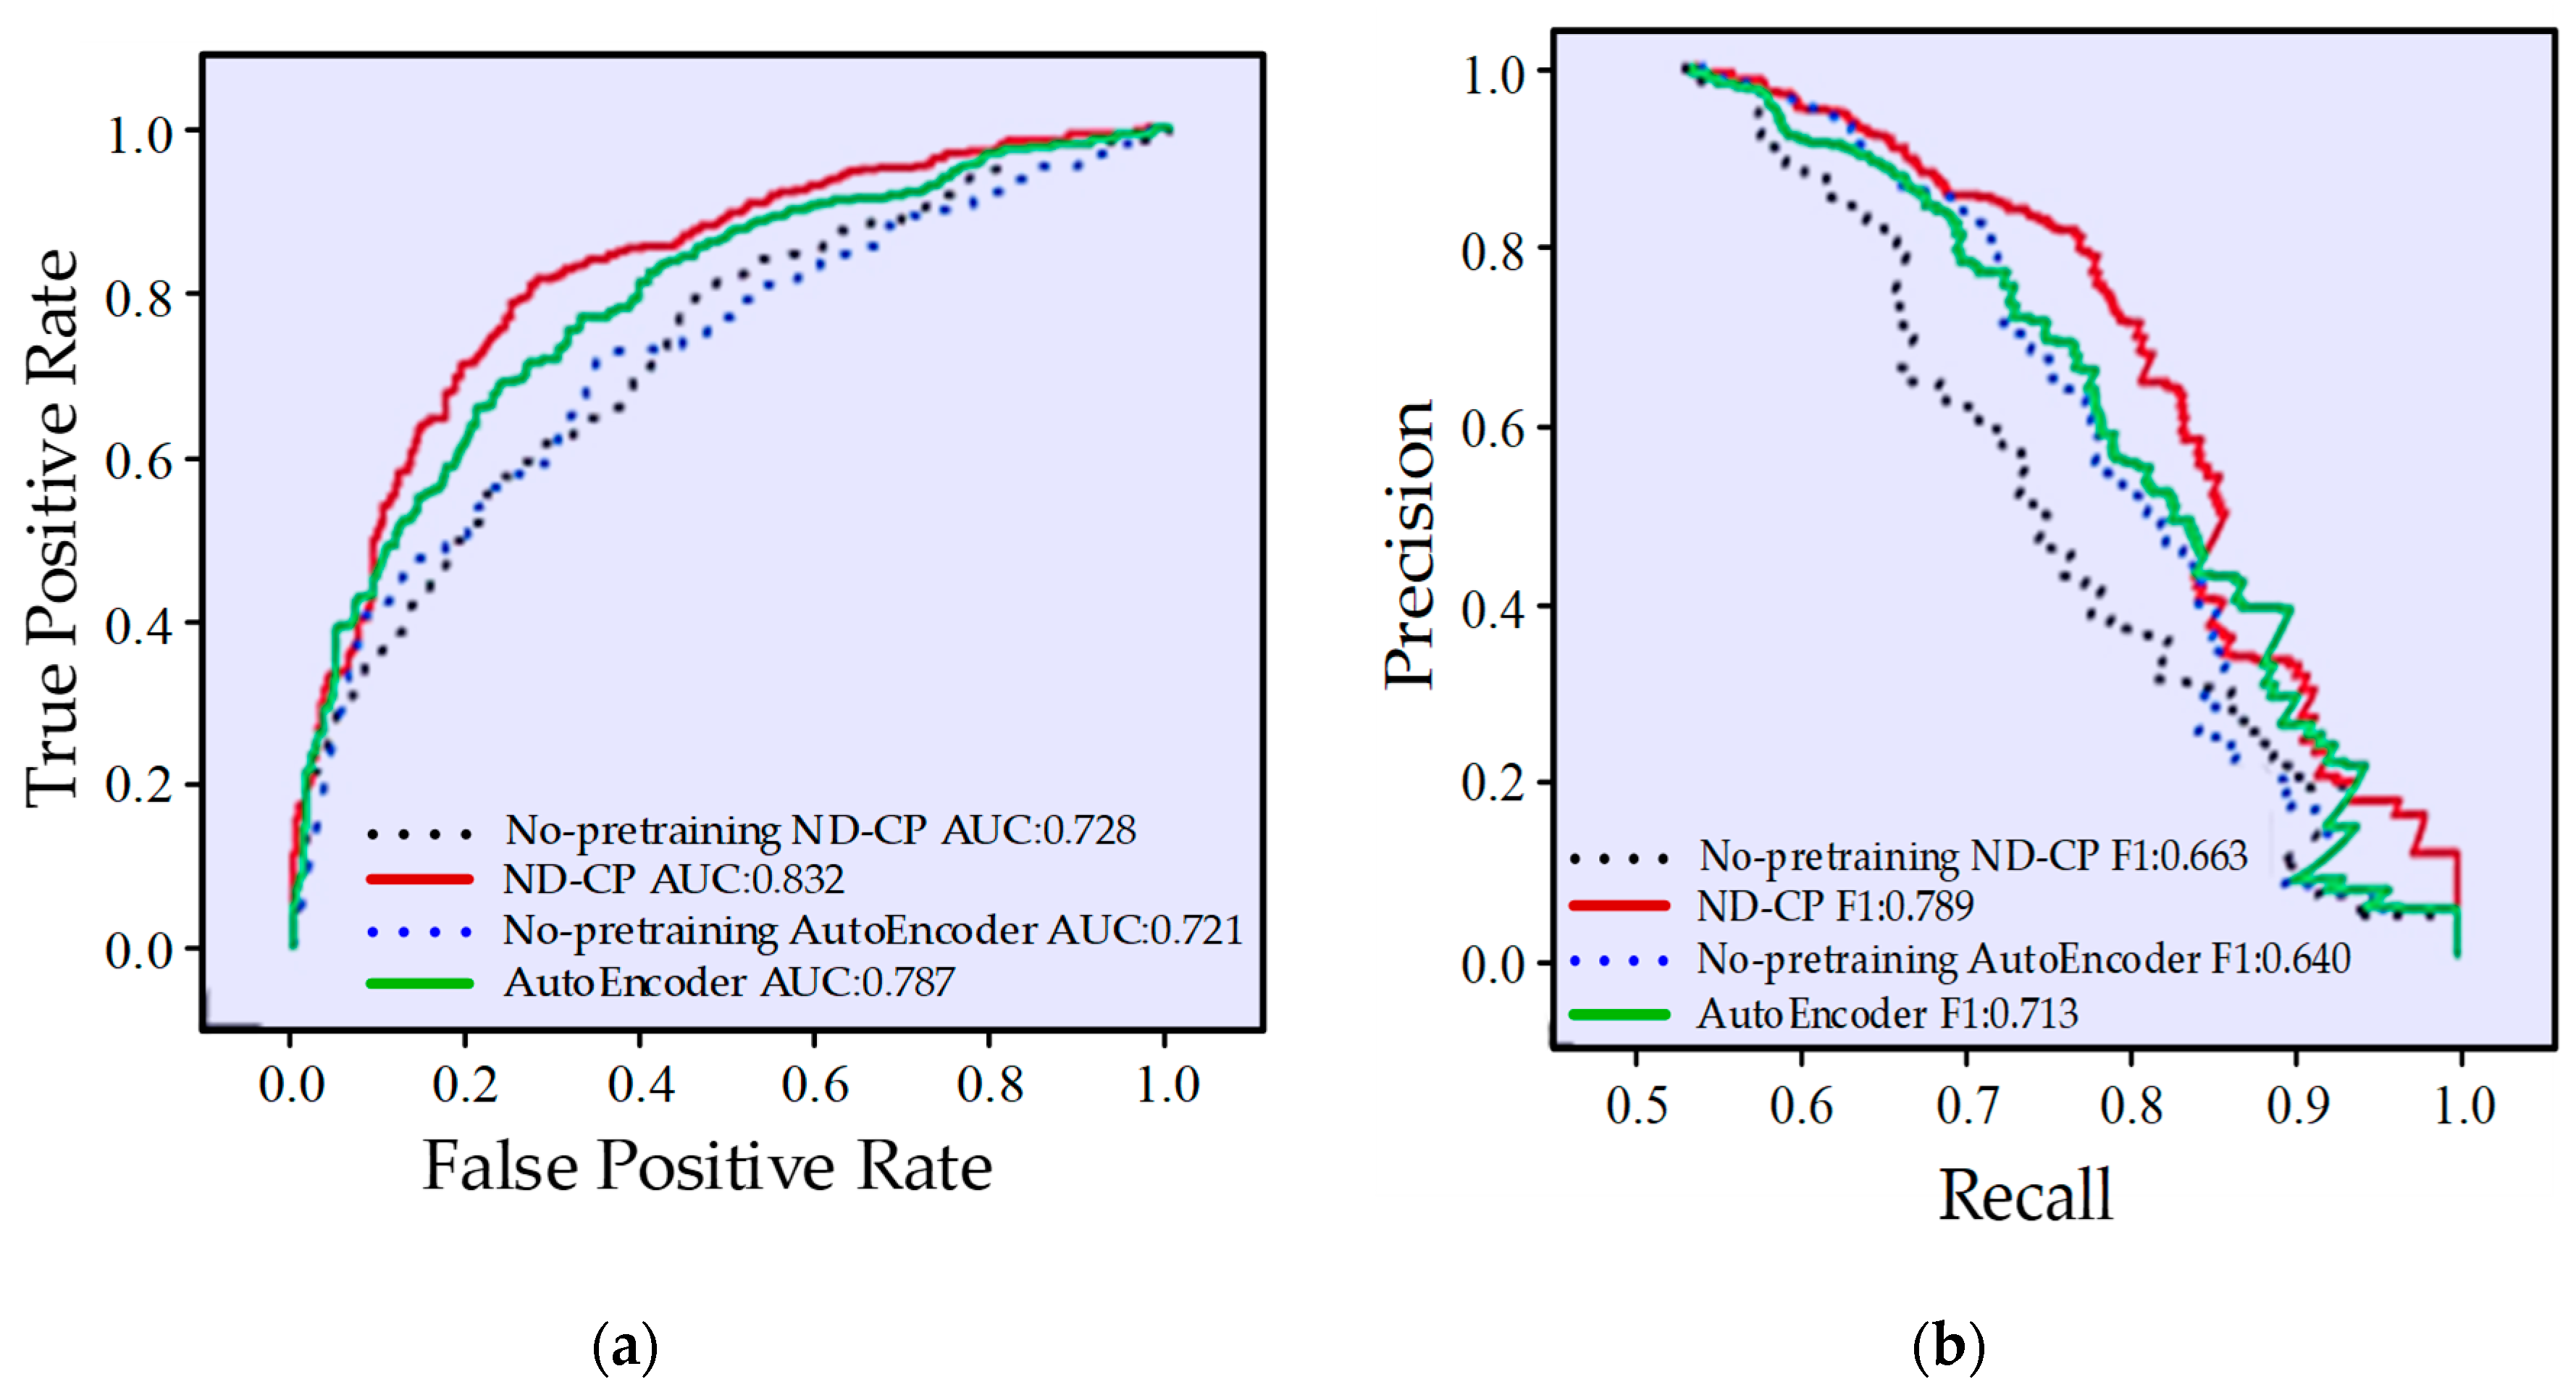
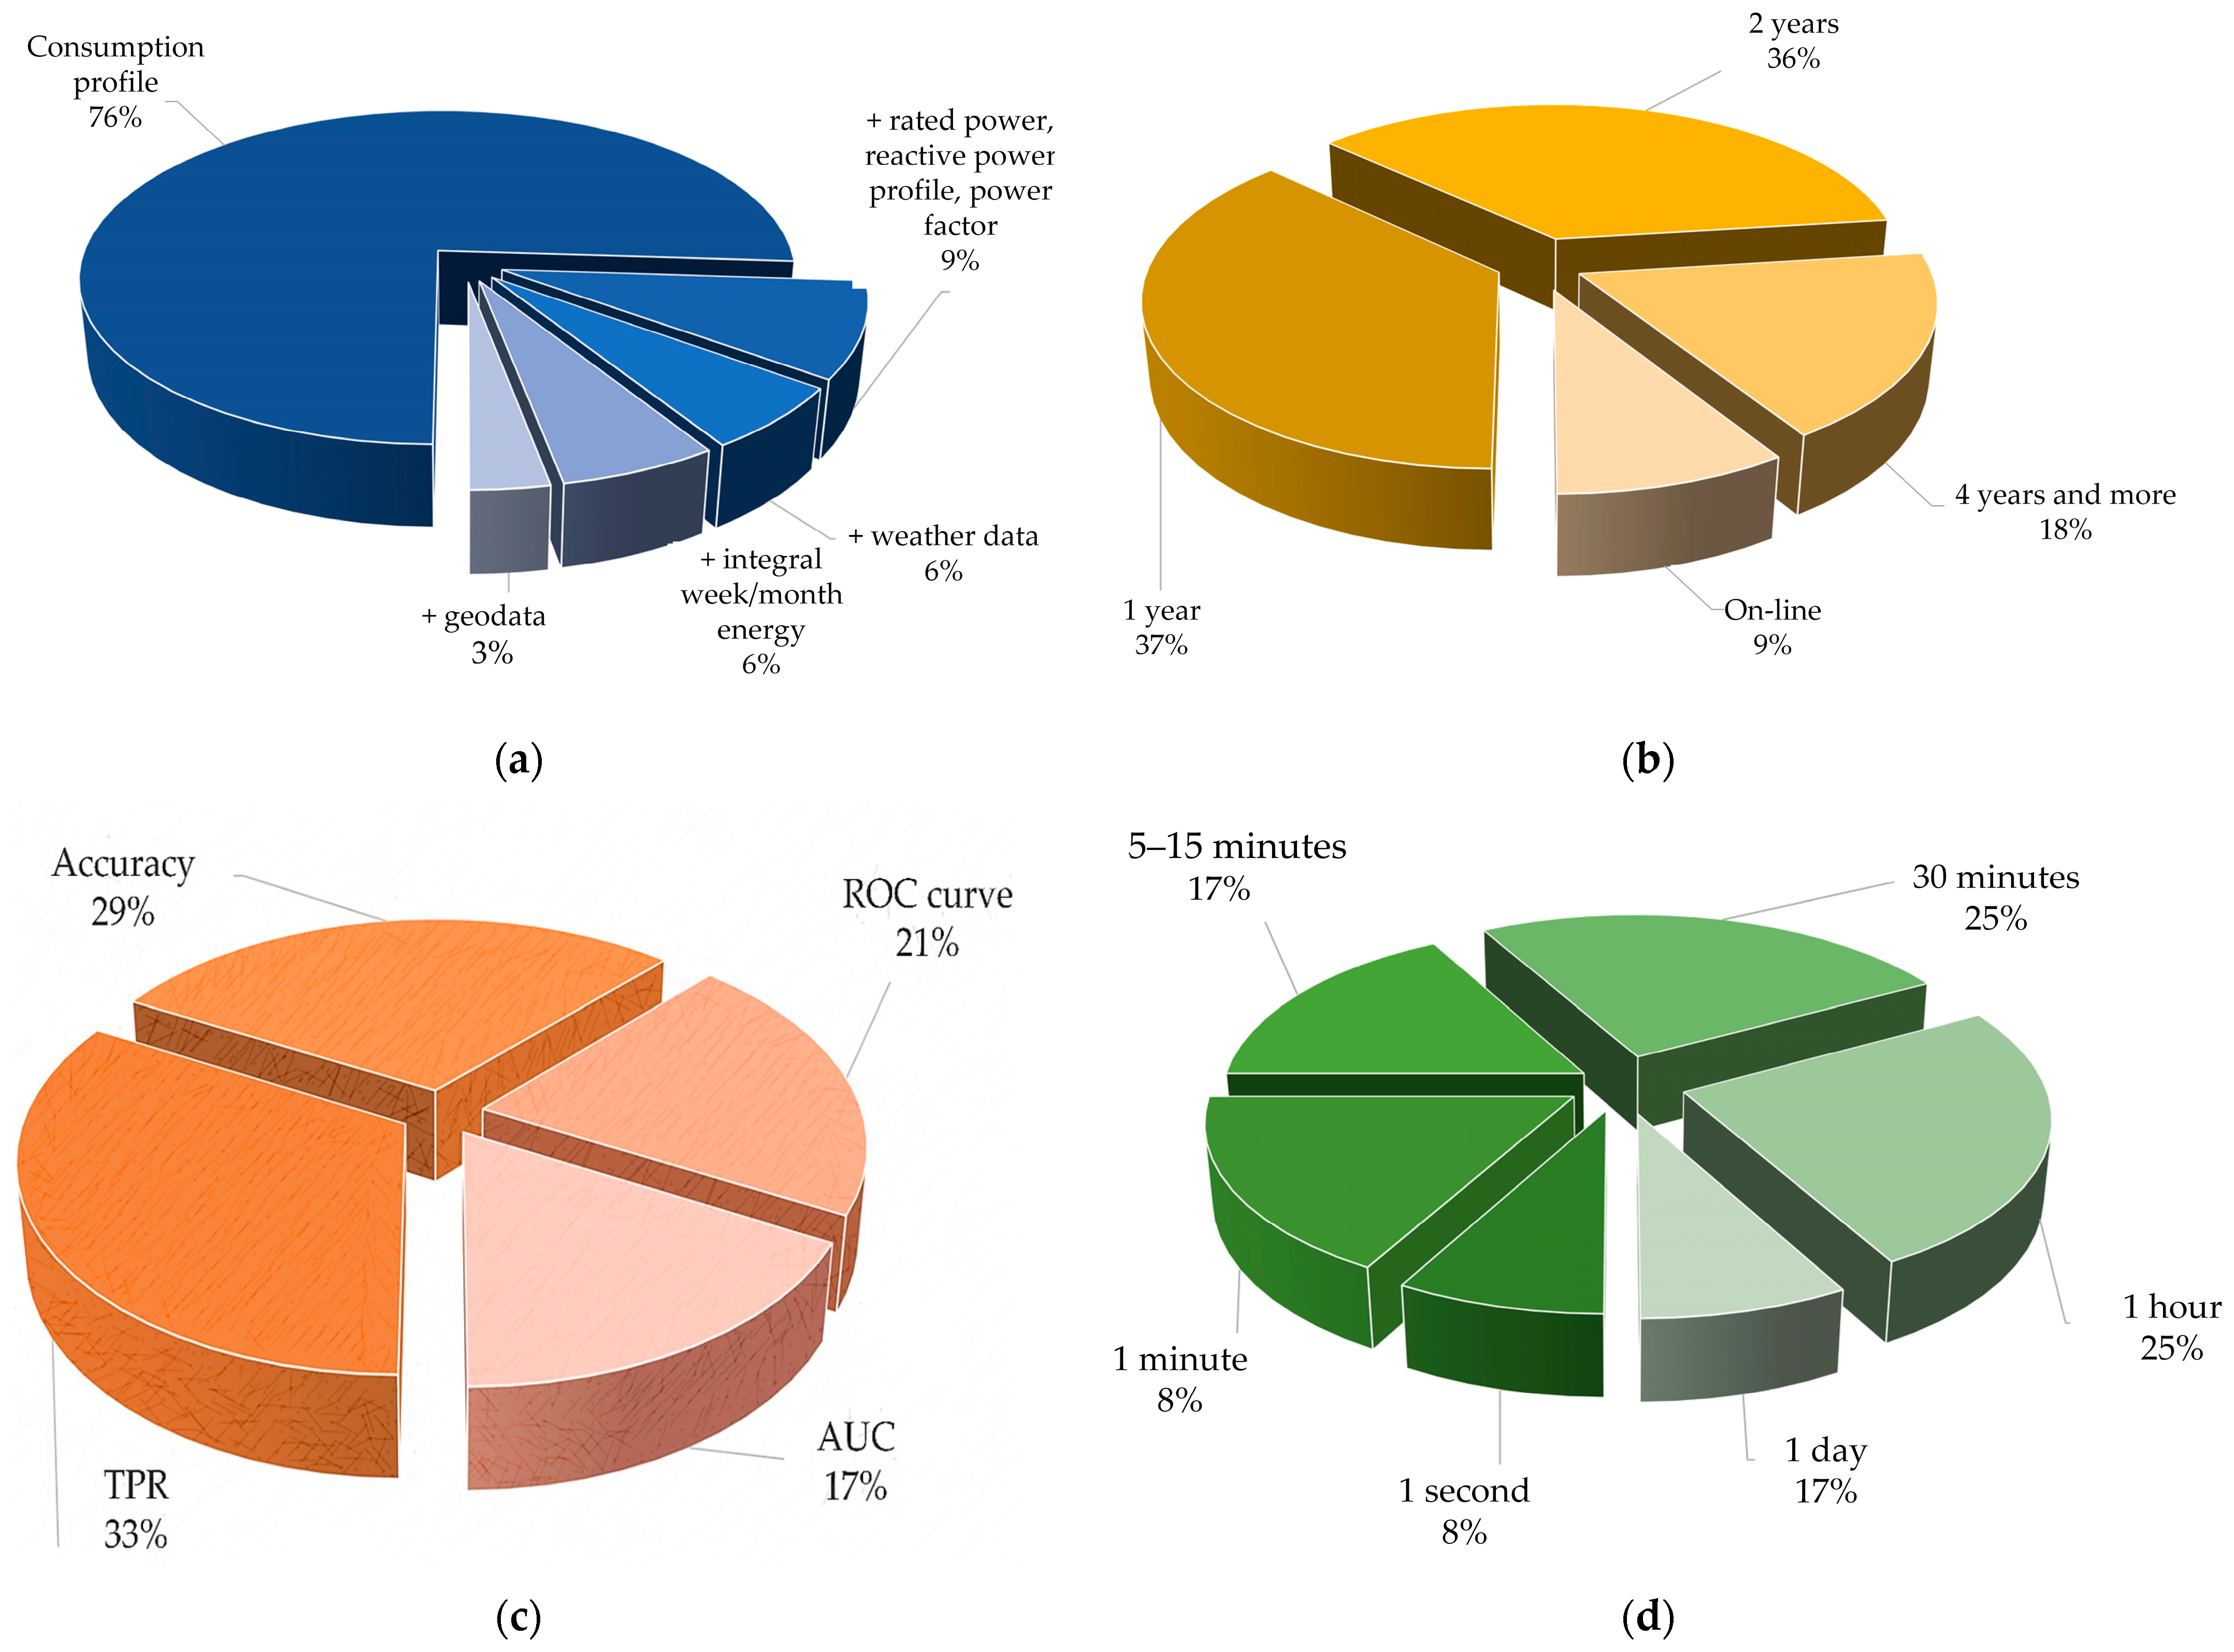
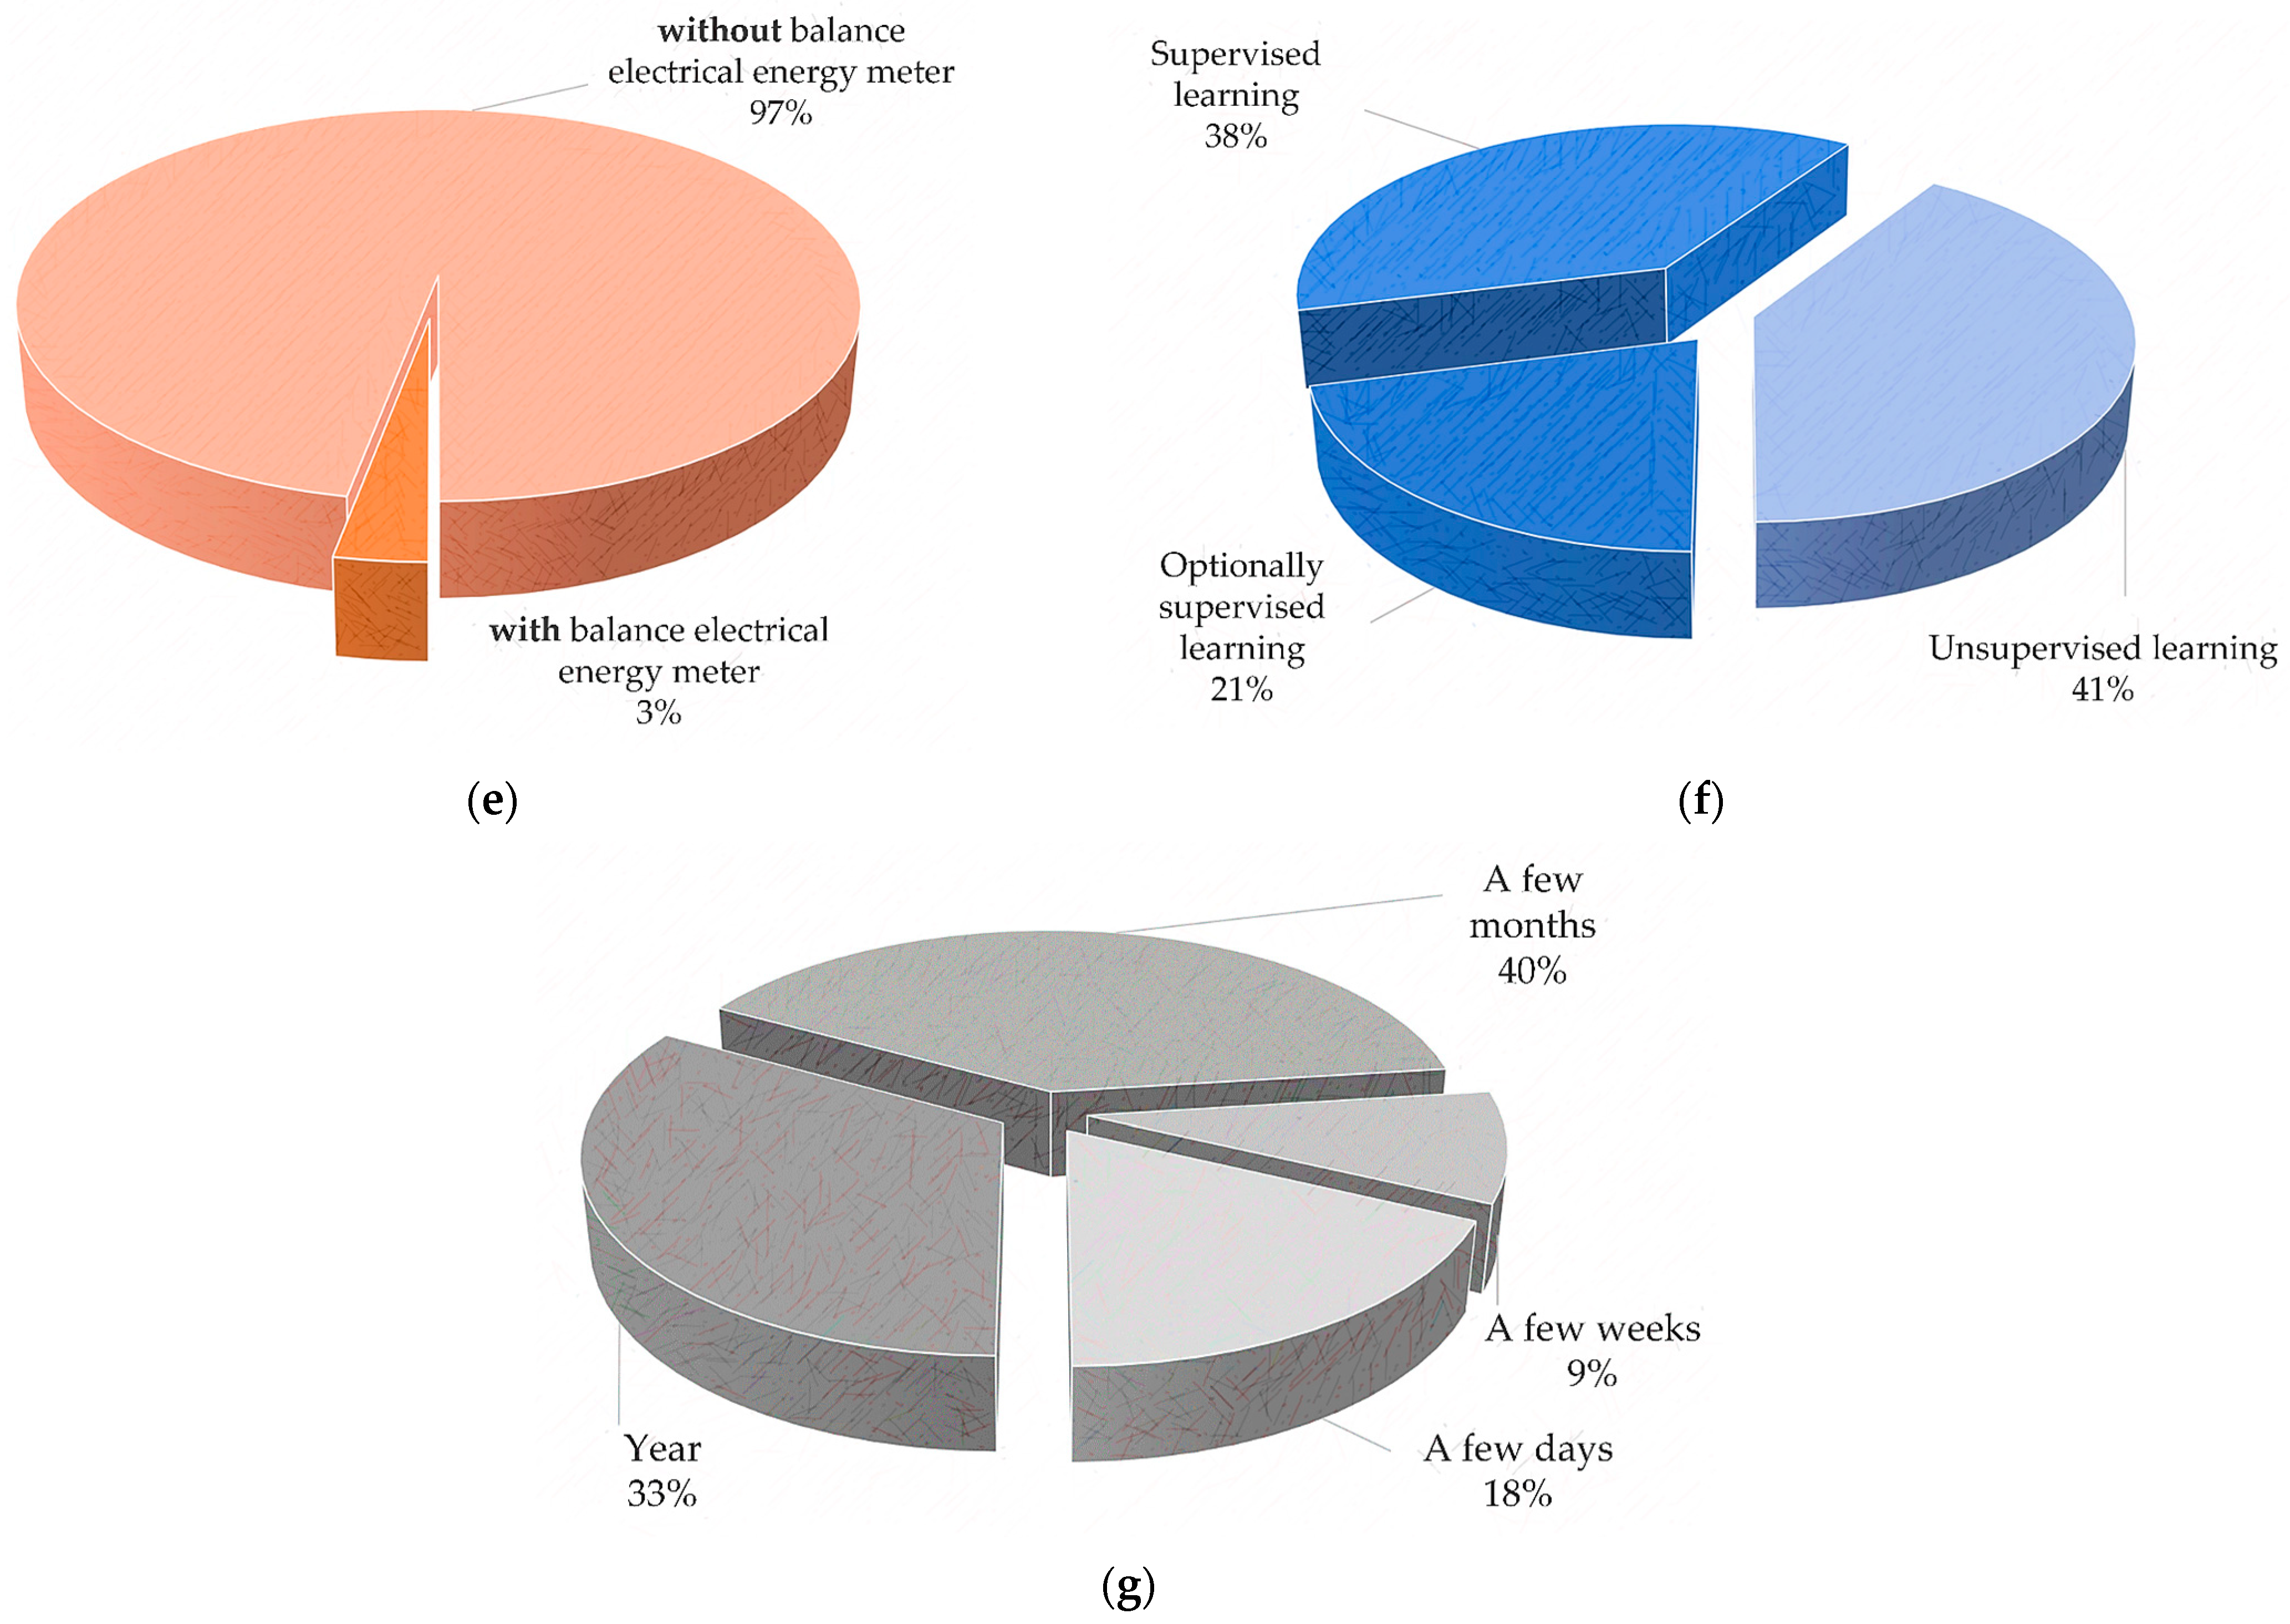
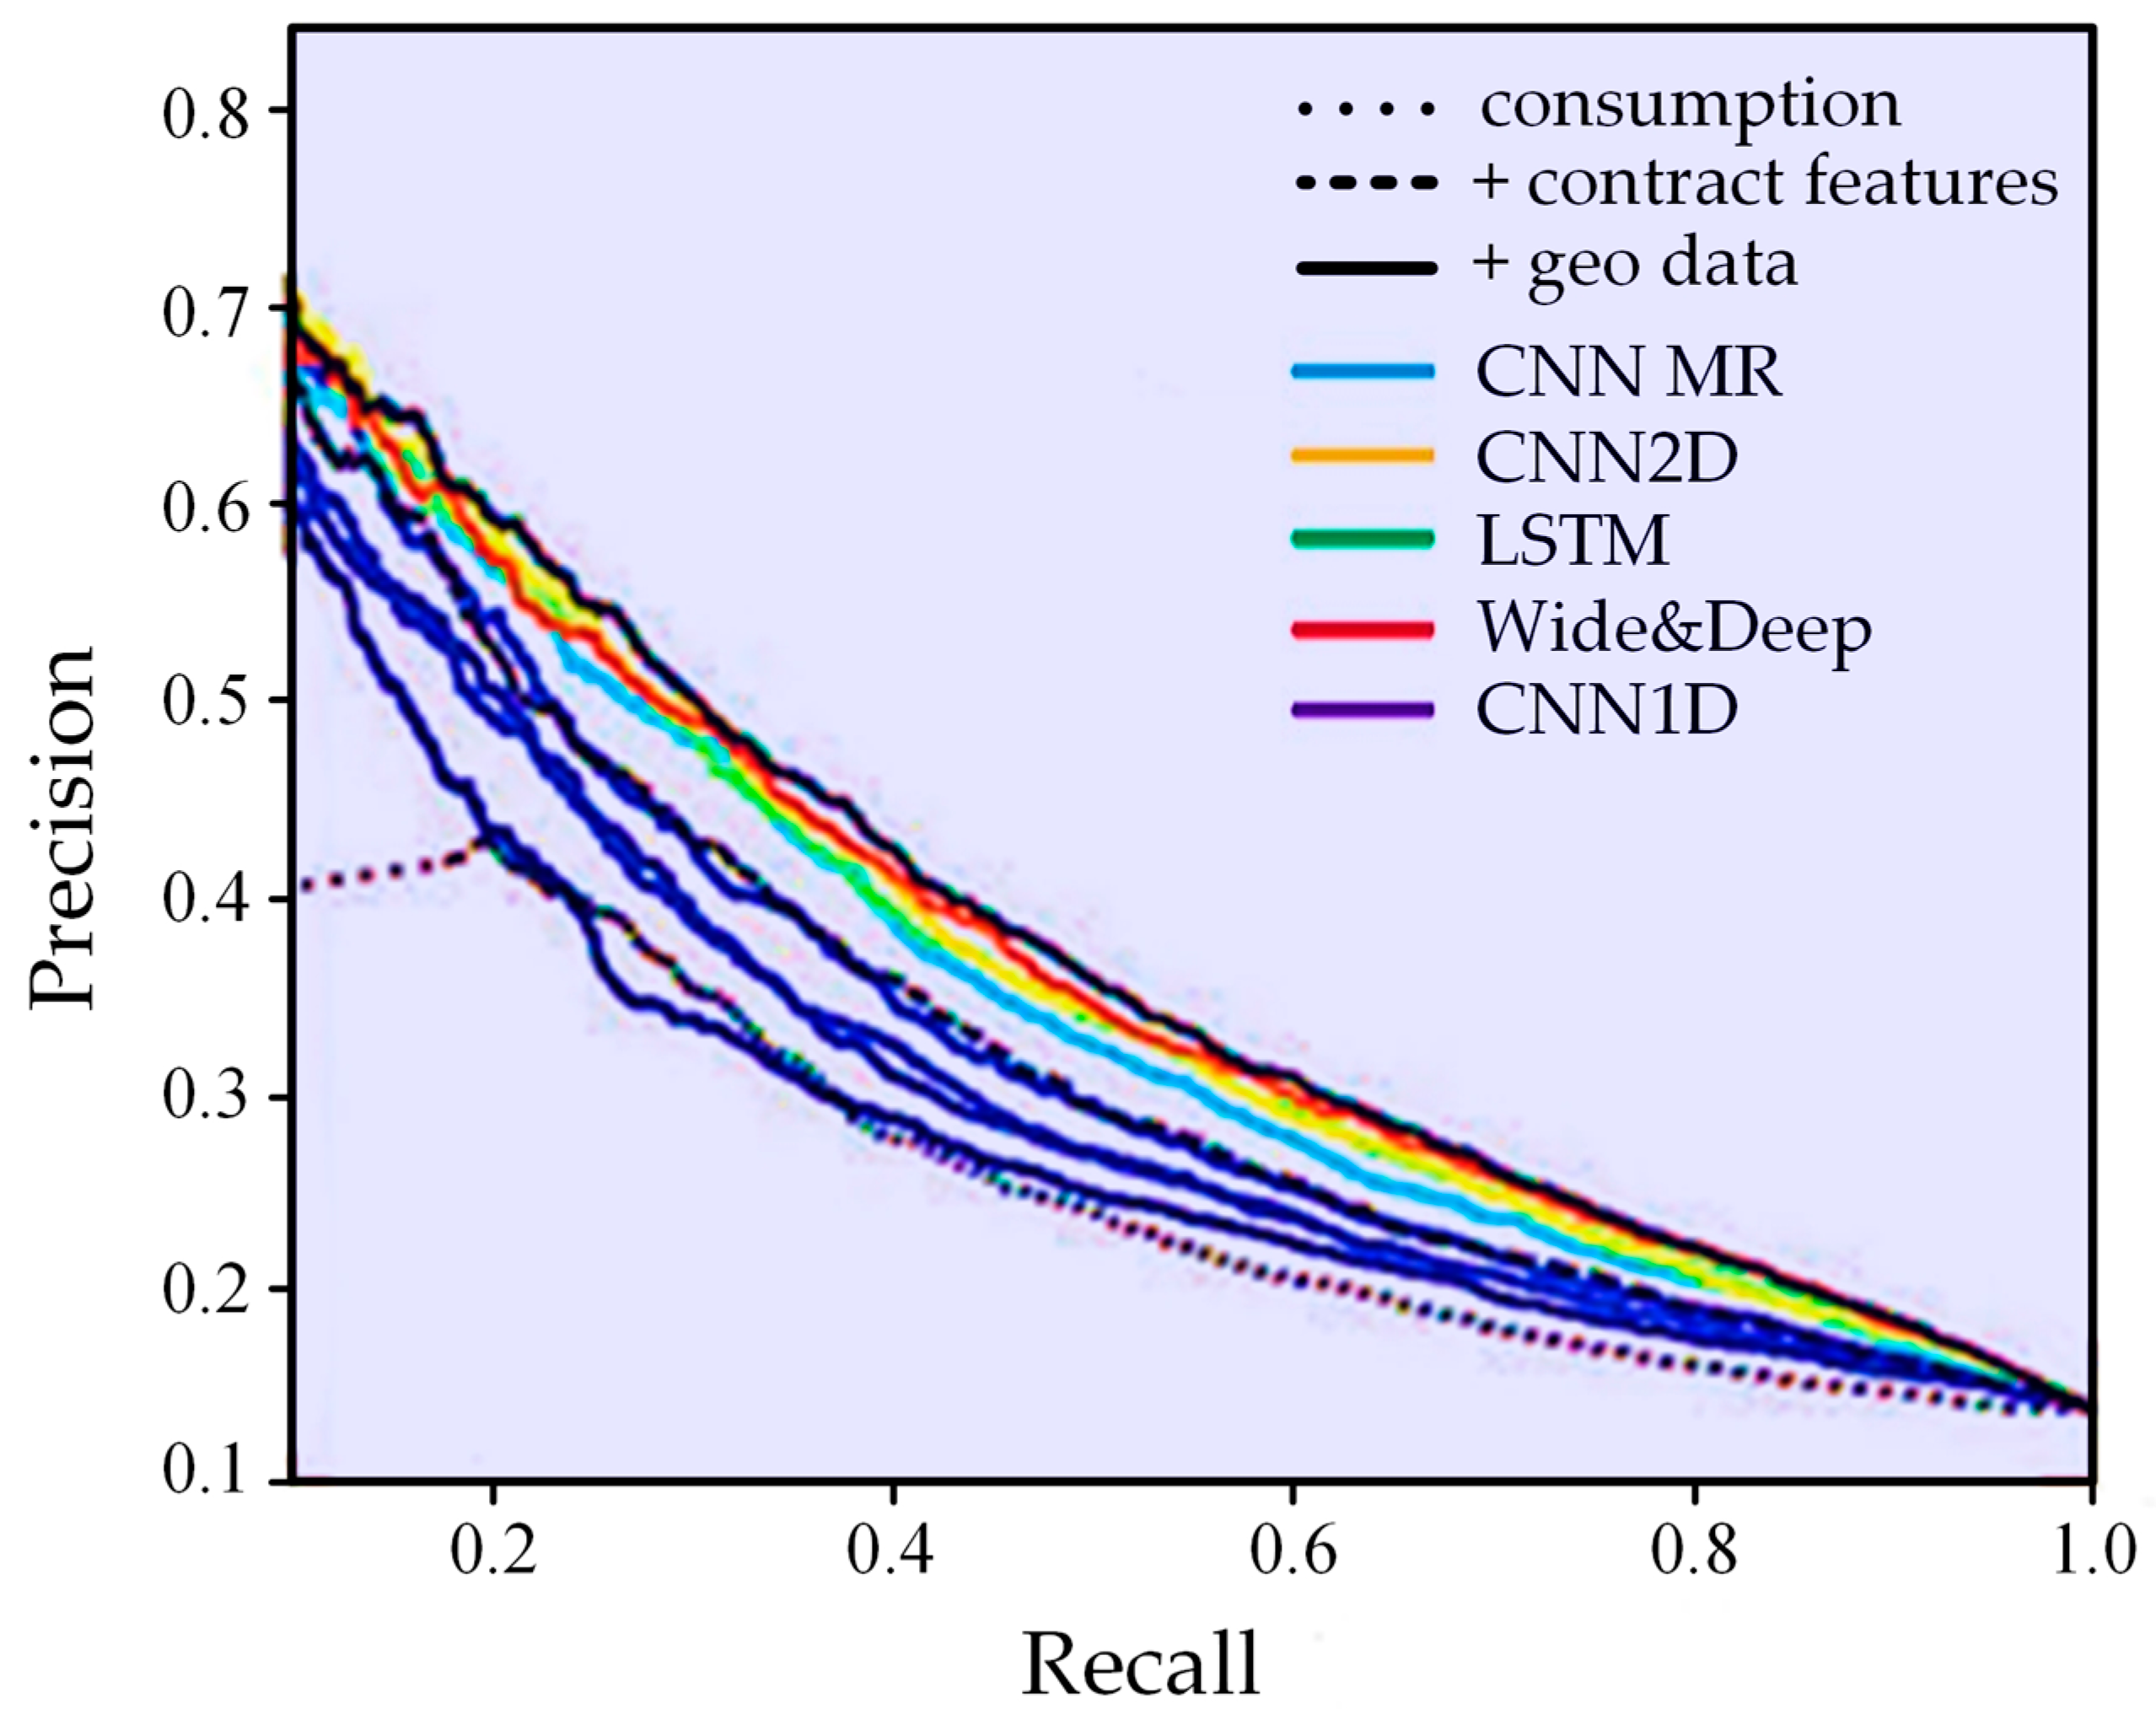

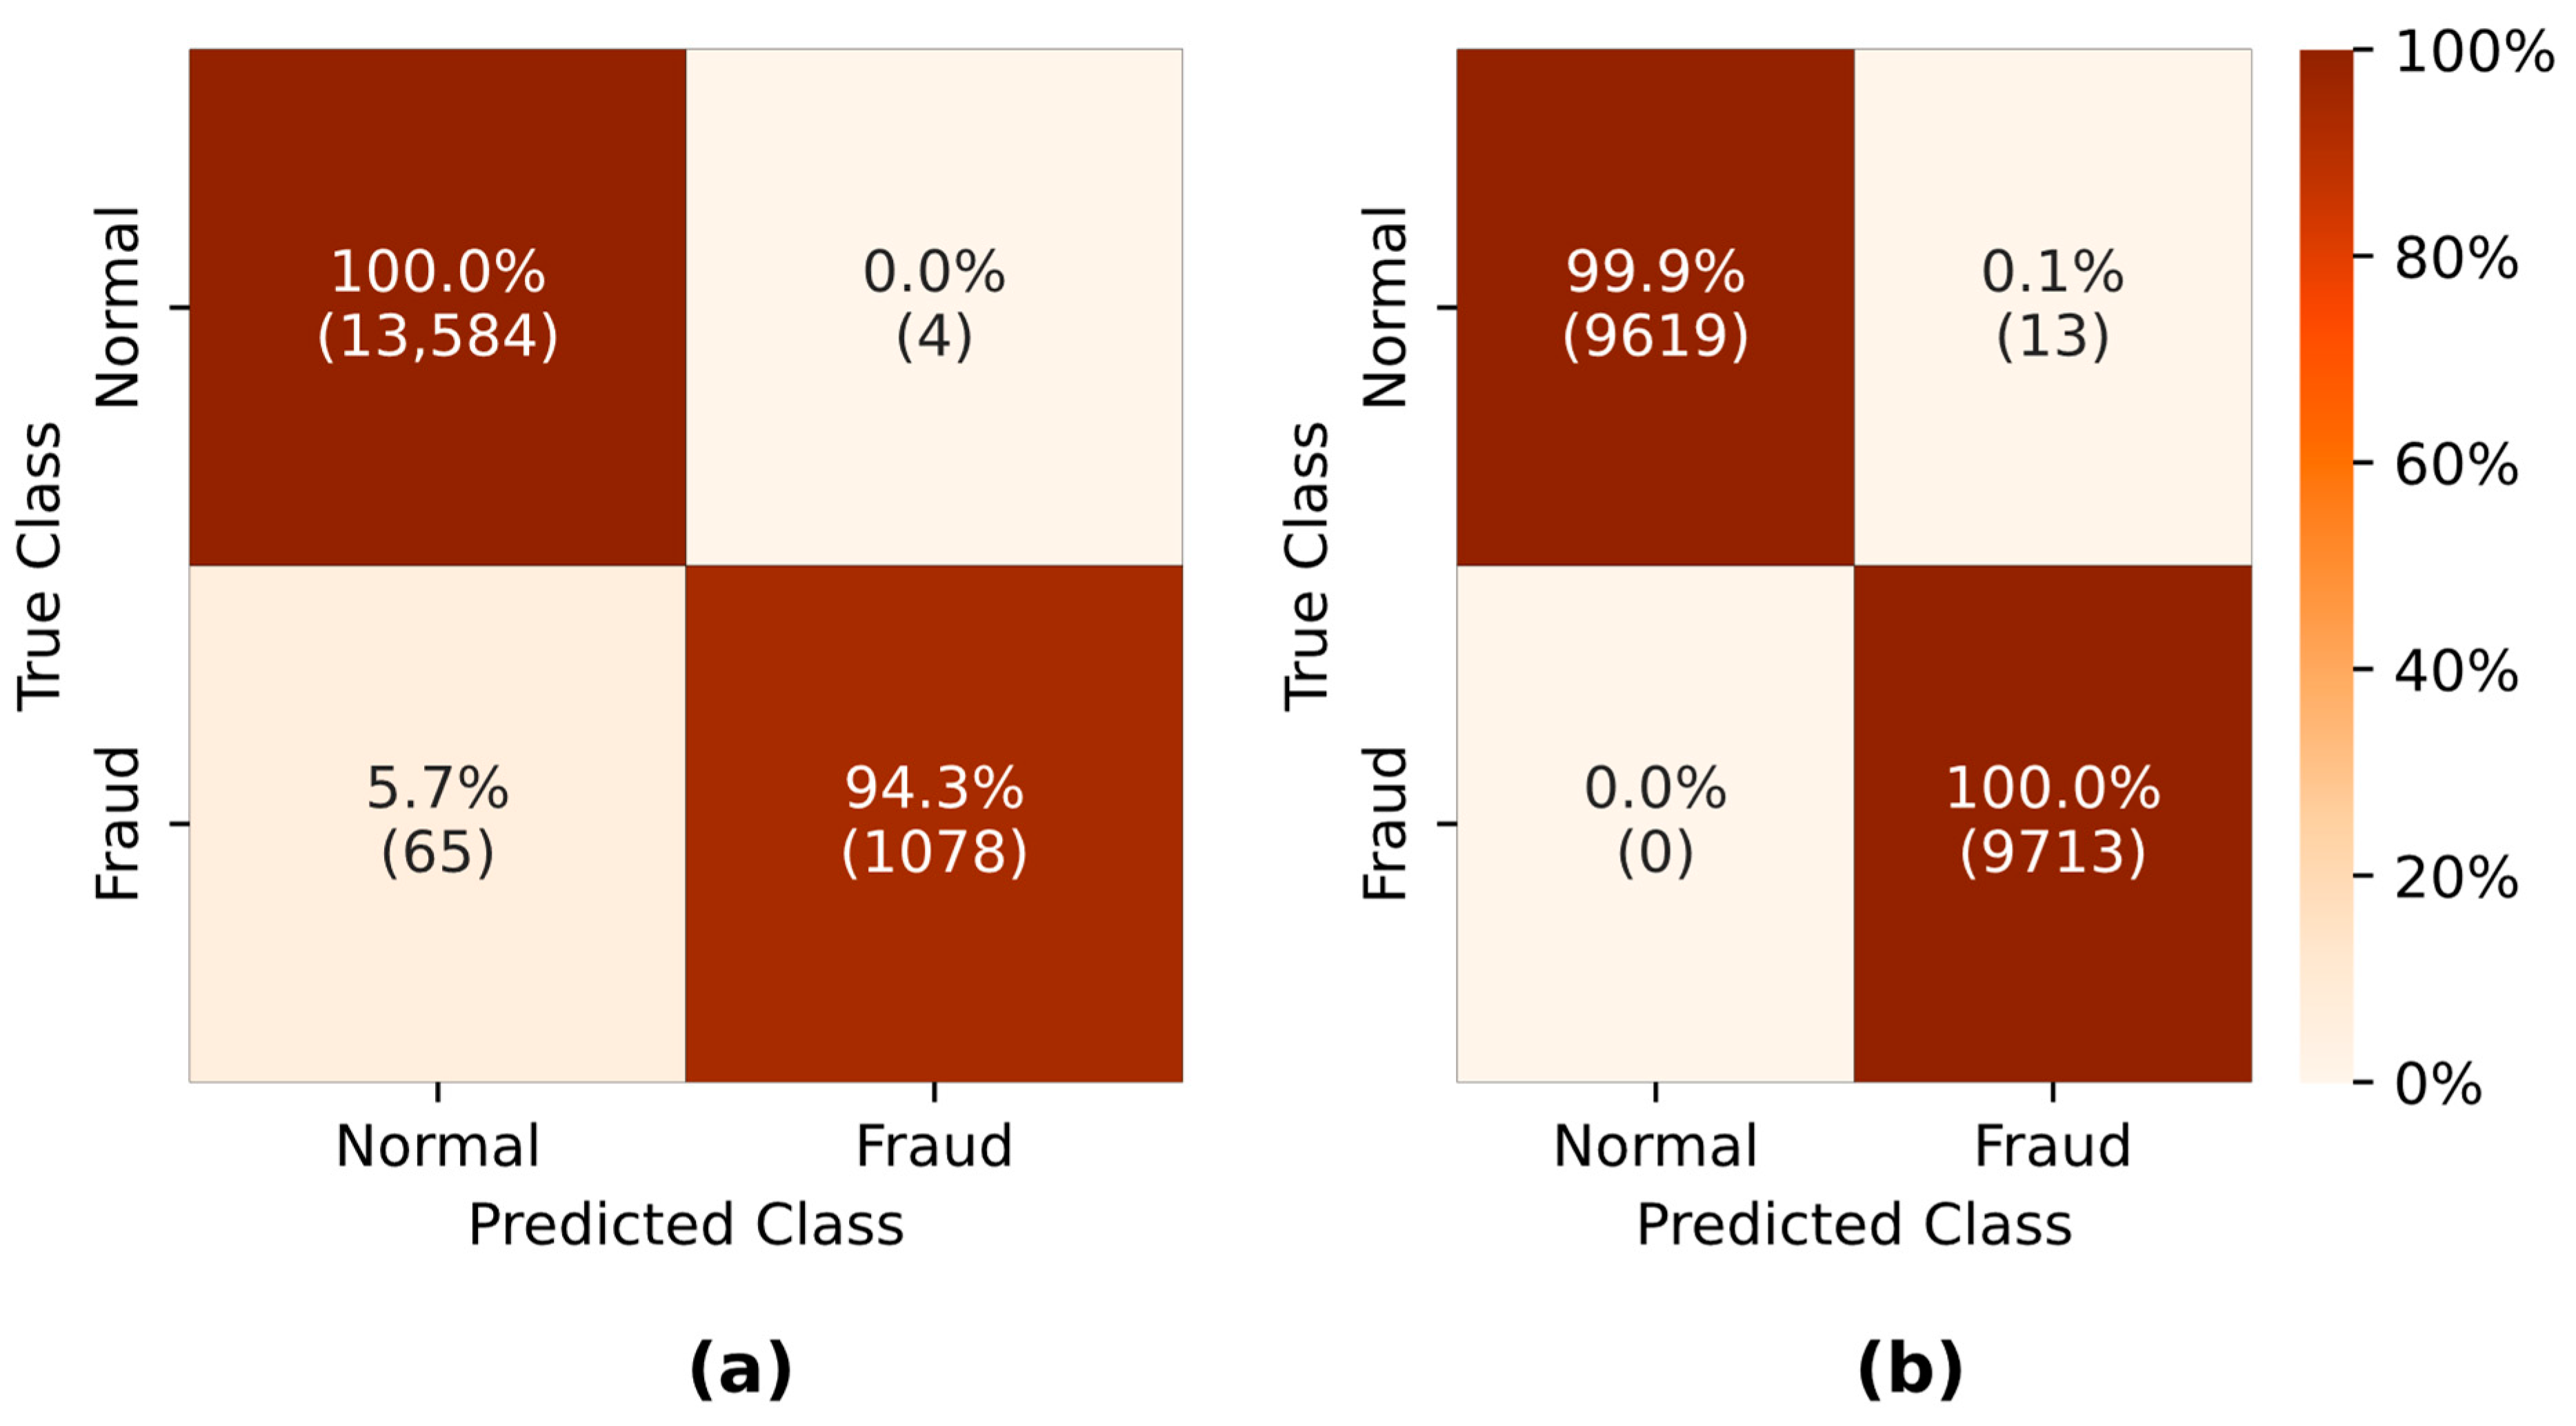

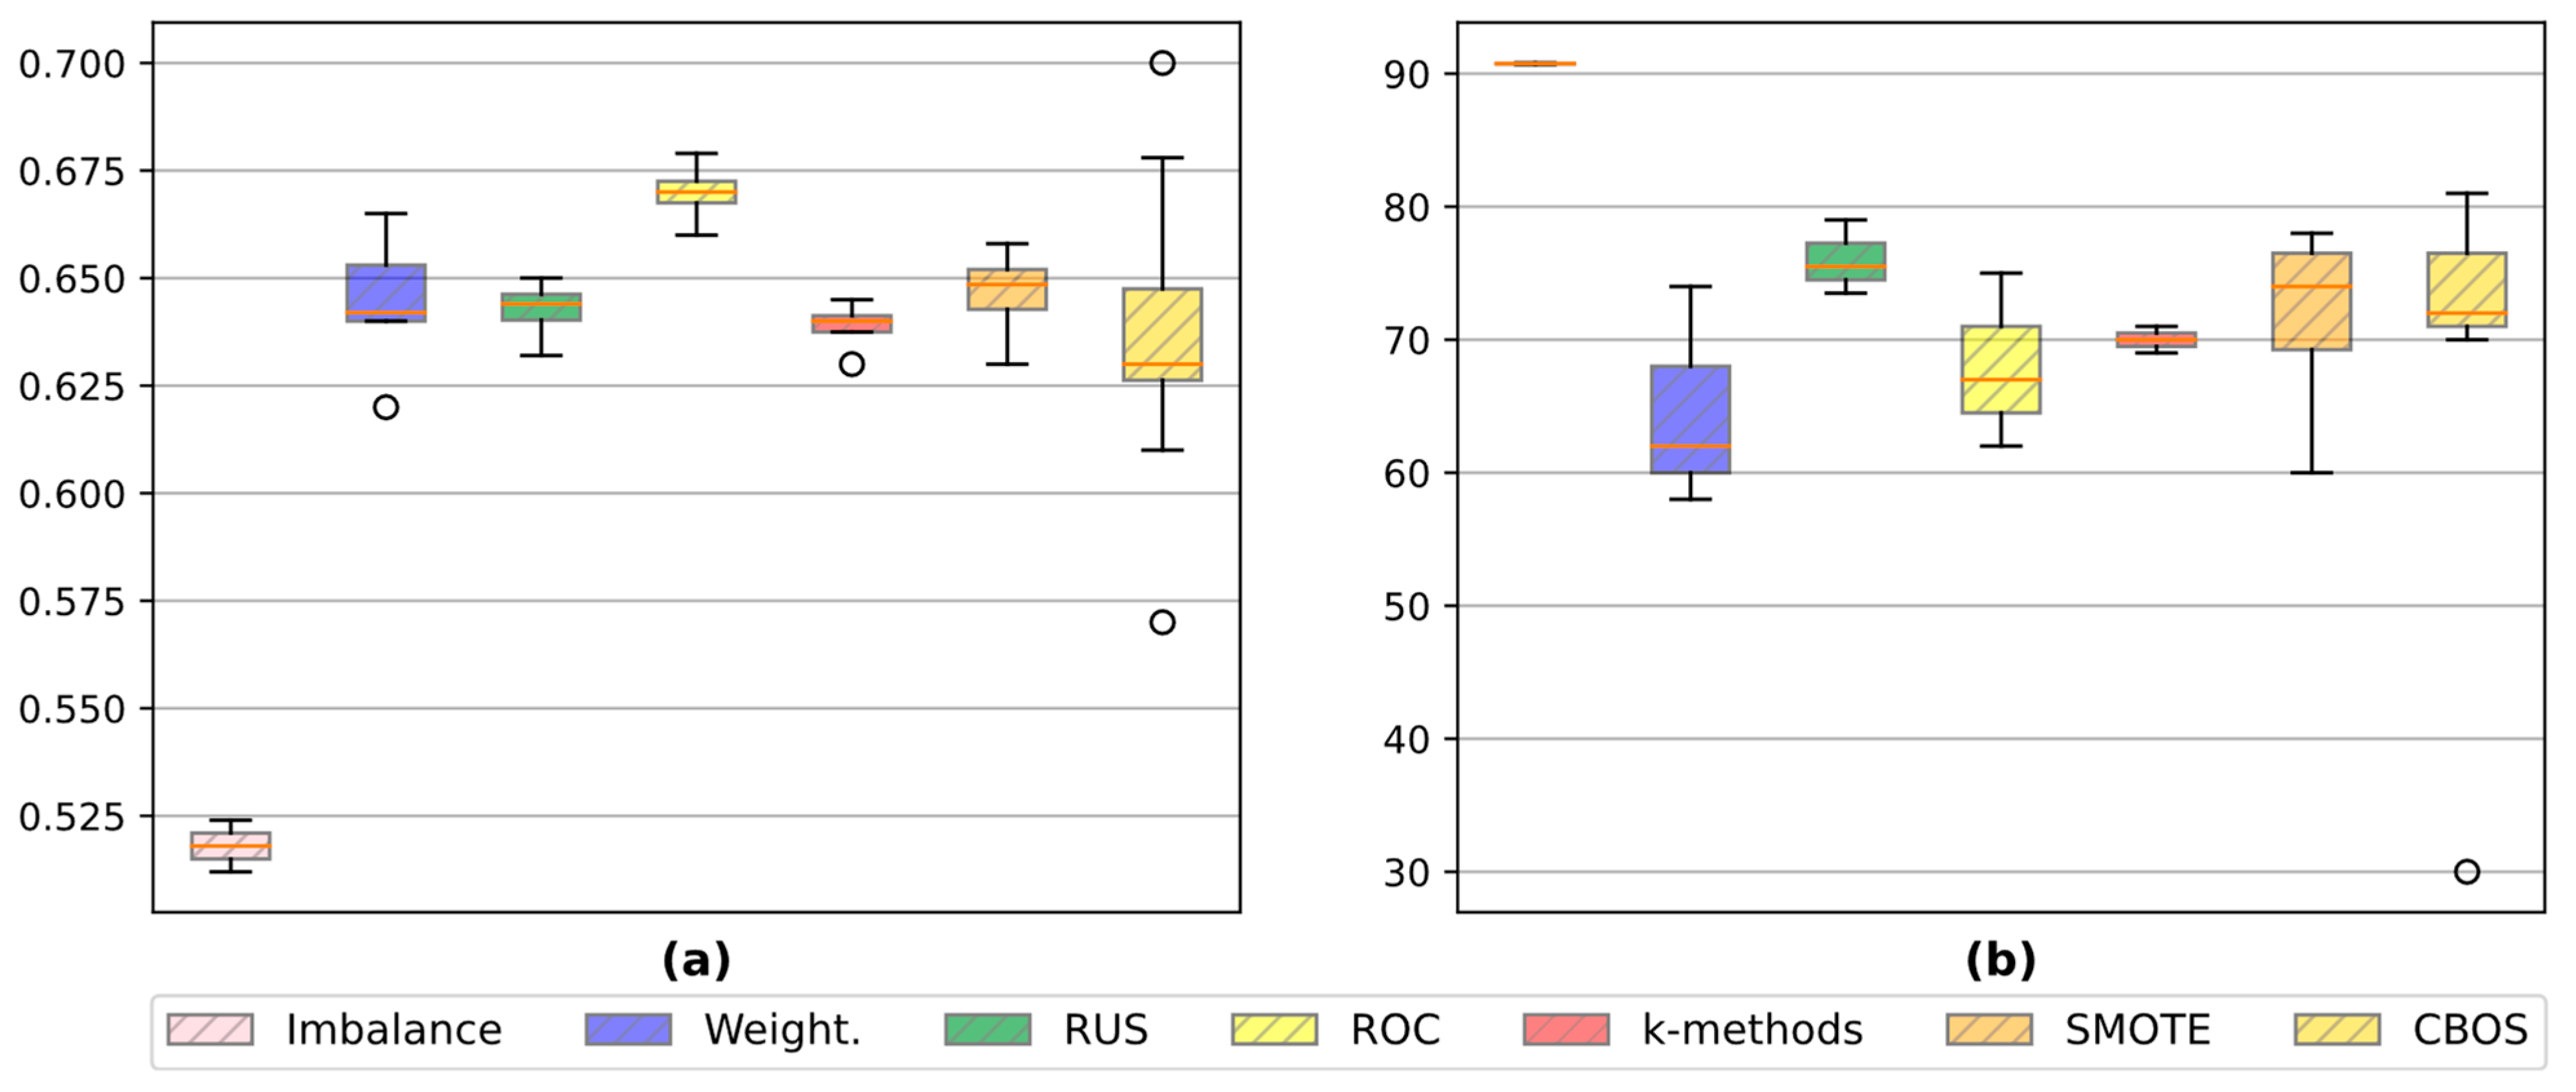
Disclaimer/Publisher’s Note: The statements, opinions and data contained in all publications are solely those of the individual author(s) and contributor(s) and not of MDPI and/or the editor(s). MDPI and/or the editor(s) disclaim responsibility for any injury to people or property resulting from any ideas, methods, instructions or products referred to in the content. |
© 2023 by the authors. Licensee MDPI, Basel, Switzerland. This article is an open access article distributed under the terms and conditions of the Creative Commons Attribution (CC BY) license (https://creativecommons.org/licenses/by/4.0/).