Abstract
KCERT 2050 is a modelling tool designed to assist in the identification and evaluation of synergies and trade-offs within sectoral decarbonization pathways for Kenya. KCERT 2050 is positioned as a user-friendly and dynamic tool that bridges complex energy systems and emissions models with integrated impact assessment tools, aimed at aiding decision making towards carbon neutrality in both public and private sectors. The tool considers greenhouse gas emissions from various economic sectors and is validated through a collaborative process involving experts from diverse backgrounds. This study uses KCERT 2050 to examine the prospects of achieving a net−zero emissions pathway by 2050. In the baseline scenario, a significant emission trajectory is observed, with the transport sector emerging as the largest contributor. Transitioning to the net−zero pathway reveals substantial reductions across key sectors, such as transport, industry, and land use, driven by strategies including electrification, waste reduction, and afforestation. The sensitivity analysis underscores the potential for emission mitigation through various levers, including land use optimization and the adoption of cleaner transportation modes. In conclusion, our findings emphasize the potential and feasibility of Kenya’s ambitious net−zero emissions target. To attain this goal, it is imperative to prioritize sustainable land use and innovative waste management strategies.
1. Introduction
Kenya, like many other countries, has been affected by the negative impacts of climate change, such as irregular weather patterns and increasing extreme weather events, due to increasing greenhouse gas (GHG) emissions. Kenya, which has a population of 50.6 million people and the biggest economy in East Africa, is the centre of the region’s trade, finance, and communications [1]. The nation’s economy is heavily reliant on tourism and agriculture, both prone to climate variability and extreme weather events.
The Climate Action Tracker [2] rates Kenya’s climate change targets and policies as “Almost Sufficient”; its unconditional nationally determined contribution (NDC) targets are aligned with its fair-share contribution to limiting warming to 1.5 °C, but its conditional NDC targets are only compatible with 4 °C of warming or higher [2]. Therefore, even though Kenya’s policies are currently 1.5 °C compatible, there is still room for greater ambition, with international support, to go beyond its fair share to limit warming.
Kenya’s historical emission contributions are negligible, at less than 0.1% (in 2019) of the total global emissions, while per-capita emissions are less than 2.06 MtCO2e compared to the global figure of 4.92 MtCO2e (2018). However, the country places a high priority on responses to climate change, based on the updated NDC 2020 [3]. Kenya has pledged to cut its GHG emissions by 32% by 2030 as part of its NDC [3], which is complemented by its National Climate Change Action Plan (NCCAP). The plans to reduce its total GHG emissions include (1) increasing geothermal, solar, and wind energy production; (2) improving energy and resource efficiency; (3) progressing toward achieving at least 10% tree cover on Kenya’s land area by 2030; (4) an increased use of clean energy technologies to reduce overreliance on wood fuels; (5) the adoption of low-carbon and efficient transportation; (6) enhanced waste management and the usage of Climate Smart Agriculture (CSA) by the National CSA Framework; and (7) improved waste management (through waste recycling and landfill gas management) [4].
Currently, the country has achieved a 92% renewable energy generation mix with geothermal and hydroelectric power being the predominant sources of electricity [5]. The 10% tree cover target has been surpassed; a 12.13% tree cover and a forest cover of 8.83% was achieved in 2021, with a new forest cover target of 28% by 2030 being achievable by planting 15 billion trees [6].
The country is pushing to meet all its emission reduction targets. With the help of the Kenya Carbon Emissions Reduction Tool 2050 (KCERT 2050), the government can actively monitor the success of these initiatives in meeting these emission targets. In this paper, we assess the KCERT 2050 model, specifically how its GHG emission scenarios consider the various Kenyan emission mitigation policy documents, the net-zero pathway scenario, energy consumption, and how the model can help Kenya meet its emission reduction targets. This study has two main objectives: (1) to investigate whether the KCERT 2050 emission scenarios tool takes into consideration the various emission mitigation policy documents; and (2) to demonstrate the technical viability of achieving a net−zero pathway using the model and the various existing mitigation target policy documents in Kenya.
2. Literature Review
2.1. Greenhouse Gas Emissions in Kenya: Trends and Consequences
Kenya’s total greenhouse gas emissions increased from 56.8 MtCO2e in 1995 to 93.7 MtCO2e in 2015 and are projected to increase to 143 MtCO2e by 2030 as the country pursues its Vision 2030 development agenda [3]. In 2015, the leading source of emissions was the agricultural sector, due to enteric fermentation and fertiliser application. Approximately 80% of the land mass is characterized as arid and semi-arid, with the main economic activity being pastoralism [7]. Methane (CH4) is expelled and belched from cattle during the process of “enteric fermentation”, which occurs in the rumination of such animals, as well as during the fermentation of manure [8]. Given the steady rise in the number of cattle, from 17.9 million animals in 2010 to 21.7 million animals in 2020 [9], methane emissions from enteric fermentation and manure decomposition are on the rise.
Projections of greenhouse gas emissions show that by 2030, energy will be the leading contributor due to the increased consumption of fossil fuels in meeting domestic, commercial, and industrial heating demands, as well as transportation [3]. More than 14% of the world’s primary energy comes from biomass, primarily fuel wood and charcoal, which is essential for satisfying the energy needs of emerging nations, notably in Sub-Saharan Africa [10]. A total of 90% of Kenya’s rural homes use firewood for cooking and heating and 80% depend on charcoal to meet their cooking demands [11]. The combustion of residential cooking fuels contributes 13.6 MtCO2e per year of greenhouse gas emissions from both urban and rural populations [12].
Forests, including closed forests, woodlands, shrub areas, grasslands, farmlands, and plantations, as well as agricultural and industrial waste, are the primary sources of biomass energy. When charcoal is not produced through reforestation schemes, it can cause forest loss and deforestation, given that an over-extraction of biomass materials from natural forests can undermine their resilience. In Sub-Saharan Africa, the usage of unsustainable charcoal has been very detrimental to ecosystems [13]. Growth in the rural and urban population, unemployment, and land tenure are major factors in woodland degradation and deforestation; therefore, any intervention should carefully consider these factors to manage forest resources effectively and sustainably [10].
In addition to the land use, land-use change, and forestry (LULUCF) sector, the transport sector is a significant source of GHG emissions. Globally, the transport sector contributes about 39% of the total GHG emissions produced through the operation of vehicles, motorbikes, trains, and aeroplanes [14]. Rapid urbanization with increased motorization and fragmented public transport systems in major cities has led to increased emissions, especially during heavy traffic along various roads. In 2019, emissions from the domestic transport sector amounted to 12.343 MtCO2e, an increase of 4.6 million tonnes compared to 2010 [15], putting the sector off its 2030 target of not more than 0.4 MtCO2e per year on average [16]. By 2030, it is estimated that the transport sector will account for 17% of the country’s greenhouse gas emissions [4].
Although Kenya’s share of global GHG emissions is comparatively small, the country’s population is rising rapidly, and its economy strengthening, which might lead to a significant increase in GHG levels over time and exacerbate the negative impacts of climate change. Furthermore, the economy is dependent on climate-sensitive sectors, such as rain-fed agriculture, water, energy, tourism, wildlife, and health, whose vulnerability is accentuated by climate change, as explained in the updated NDC [3]. Conflicts in Kenya, largely related to natural resources, are exacerbated by increased intensities and magnitudes of climate-related threats [17]. These effects are not gender-neutral, having varying impacts on men and women and other marginalized groups [18]. Consequently, the nation has frequently been obliged to reassign development funds to deal with climate-related problems [19]. Cumulative climate change consequences impede development efforts and cause socio-economic losses estimated at 3–4% of GDP yearly [3]. As a result, the Kenyan government has established ambitious action plans for climate change adaptation and mitigation [3,4].
2.2. Carbon Emission Mitigation Efforts in Kenya
A total of 194 out of 197 nations, including Kenya, have ratified the Paris Agreement on Climate Change as of February 2023, which aims to limit global warming to 1.5 °C above pre-industrial levels [20]. However, the global mean surface temperatures have already increased by 1.1 °C [21]. If this trend continues, it will increase well beyond 1.5 °C, to levels that will endanger the lives and livelihoods of people worldwide [22]. For this reason, an increasing number of nations are pledging to attain “net−zero” emissions, or carbon neutrality, within the next several decades. The term “net−zero” means balancing the carbon emitted into the atmosphere and the carbon removed from it. This balance—or net−zero—happens when the amount of carbon we add to the atmosphere is equivalent to the amount removed. To reach net−zero, emissions from homes, transport, agriculture, and industry must be cut drastically. However, some areas of the economy, such as aviation, shipping, cement, iron and steel, and variable electricity, are hard to fully decarbonize [23]. These ‘residual’ emissions can be removed from the atmosphere either by changing how we use our land so it can absorb more carbon dioxide or by being extracted directly through technologies such as carbon capture and storage (CCS). It is, therefore, clear that bold actions and significant contributions are required to achieve carbon neutrality [24].
Kenya has adopted a policy to direct national and subnational climate actions, making the country a leader in Sub-Saharan Africa in tracking climate change. Sustainable development that is low in carbon emissions and climate-resilient is guided by the Climate Change Act [25] and the National Climate Change Policy Framework [4]. On the 28th of December 2016, Kenya filled its first Intended Nationally Determined Contribution (INDC), in which the mitigation effort aimed to cut GHG emissions by 30% by 2030 [26]. Kenya revised this goal in its updated NDC, in 2020, to cut GHG emissions by 32% by 2030 [3]. The National Climate Change Action Plan (NCCAP) states that a critical component of the program is creating a dependable and climate-resilient energy system [4]. These policy documents outline the ambitious goals for climate change mitigation and adaptation, which include reforestation and afforestation, climate-smart agriculture, the development of geothermal and clean energy sources, energy efficiency, and drought management.
2.2.1. Energy Sector Initiatives
A substantial commercialization of the biomass energy sub-sector holds the most promise for reducing the high, and rising, level of over 57% biomass energy supply deficit [10]. This could provide energy for the nation, create jobs, and offer ecosystem services. The suggested methods include (a) large-scale corporate biomass energy productions in designated areas where land is not a significant constraint; (b) small-scale farmers producing charcoal and fuelwood as cash crops modelled after the tea industry; (c) the sustainable management of naturally growing forests guided by approved management plans; (d) making investments in residual biomass, after soil fertility has been addressed; (e) expanding the production of energy-efficient stoves, kilns, and biogas appliances [10].
Other than the use of biomass, the energy sector has also invested in different renewable sources for electric power generation, which include the use of geothermal, hydropower, wind, and solar energy. As of 2021, 46.69% of electricity generation stemmed from geothermal, 32.22% from hydropower, 0.8% from solar, and 11.2% from wind power plants, with the following two main plants: Ngong Hills Wind Farm, located in Ngong, Kajiado County, and Lake Turkana Wind Power Station, in Turkana County [5]. These low-carbon and low-pollutant energy sources have helped to reduce carbon emissions.
2.2.2. Agriculture Sector Initiatives
Kenya has invested in numerous activities that have contributed to curb carbon emissions in other sectors of the economy. For the agricultural sector, two projects have been developed. First, the Kenya Climate-Smart Agriculture Framework Program (KCSA-FP) aims to reduce 30% of the carbon emissions from the agricultural sector by 2030, by guiding investments into climate-resilient and low-carbon agriculture [27]. Second, the Climate and Clean Air Coalition (CCAC), developed by the dairy sector’s Nationally Appropriate Mitigation Actions (NAMAs) concept, aims to increase cattle productivity while reducing carbon emissions by improving cattle feeds and disease control, making solar-powered equipment for processing dairy products and creating manure-fed biogas systems in households [28]. A study assessing the adoption of rangeland enclosures (fenced areas) instead of extensive open systems in Kenya, for example, demonstrated significant reductions in GHG emissions under a lifecycle assessment through the enhancement of the biomass production and restoration of degraded soils. [29].
2.2.3. Transport Sector Initiatives
To minimize CO2 emissions from traffic, the country has constructed roads with improved traffic flow in Nairobi, such as the Thika Superhighway and the Nairobi Expressway. Moreover, due to the increase in motorists in the country over the years, the Transport Climate Strategies (TraCSs) project was initiated to incorporate climate change policies in the transport sector, thereby supporting the reduction of GHG emissions [30].
There are also plans to encourage non-motorized transportation, such as infrastructural improvements to walking paths and cycle tracks funded by several World Bank projects [31].
Kenya plans to mitigate emissions from the aviation sector by airport improvements and adopting sustainable aviation operations through initiatives which are to be implemented from 2022 to 2028 [32]. These initiatives include upgrading its international and domestic aircraft fleet to more modern aircraft, adopting a biofuel mix in aviation fuelling, piloting projects using sustainable aviation fuels (SAFs), and implementing fuel-efficient flight paths with continuous climb and descent operations. These projects have helped reduce GHG emissions but have not curbed them, thus requiring further projects to be developed and implemented, such as the adoption of small hybrid and electric aircrafts.
3. Materials and Methods
This study used KCERT 2050 (the KCERT tool is available at: https://kcert.ilabafrica.ac.ke) to simulate a net-zero emissions pathway by 2050 and identify the critical intervention points and activities. A sensitivity analysis was conducted on each of the levers selected to develop the net-zero pathway. KCERT 2050 belongs to the 2050 calculator family and was adapted from the UK-developed MacKay Carbon Calculator (Mackay Carbon Calculator: https://mackaycarboncalculator.beis.gov.uk (accessed on 19 July2023)) which was initially developed by the United Kingdom and has inspired the development of many other 2050 calculators (further information on the “2050 Calculators” is available at https://www.imperial.ac.uk/2050-calculator (accessed on 19 July 2023)) worldwide [33]. The calculators employ similar methodological approaches, restructured to suit a national context. The comprehensive methodology and assumptions are detailed in a guide developed by the 2050 calculator program consortium [34]. Further detailed information on how 2050 calculators (such as KCERT) work can be found in the available literature for analogous calculators, for instance, the Global Calculator [35], the European Calculator [36], and the Mexico 2050 Calculator [37].
3.1. KCERT Modelling Approach
Similar to other 2050 calculators, KCERT 2050 uses a system dynamics approach of modelling carbon stocks and flows to model Kenya’s energy supply and demand by considering physical units such as land, cars, and power plants. This contrasts with economic approaches to modelling, which tend to abstract energy systems into complex supply and demand equations, modelling outcomes based on economic behaviours and price assumptions.
KCERT 2050 models six sectors from the demand side—buildings, transport, industry, land use, and bioenergy production, as well as carbon capture, usage, and storage—and three from the energy supply side: electricity generation, bioenergy, and gas. The model also captures changes in Kenya’s population, economic activity, and use of interactions between sectors and policies to mitigate sector-specific emissions. Three main GHG (CO2, CH4, and N2O) gases are accounted for in the model.
The data collection was led by sector experts and sourced from government reports, national databases, and research studies. Data validation was performed on two fronts: during the model’s creation and via stakeholder engagements. During modelling, data was validated by observing the resulting emissions and using the Mackay Carbon Calculator input values and secondary data on emissions as benchmarks. Additionally, stakeholders from all the sectors gave feedback on the resulting emissions and energy balance values.
KCERT 2050 consists of 37 levers with 162 sub-levers, representing sets of interventions aimed at reducing GHG emissions. The levers are GHG reduction initiatives or policies, including switching to cleaner modes of transportation and increased production efficiency in industries.
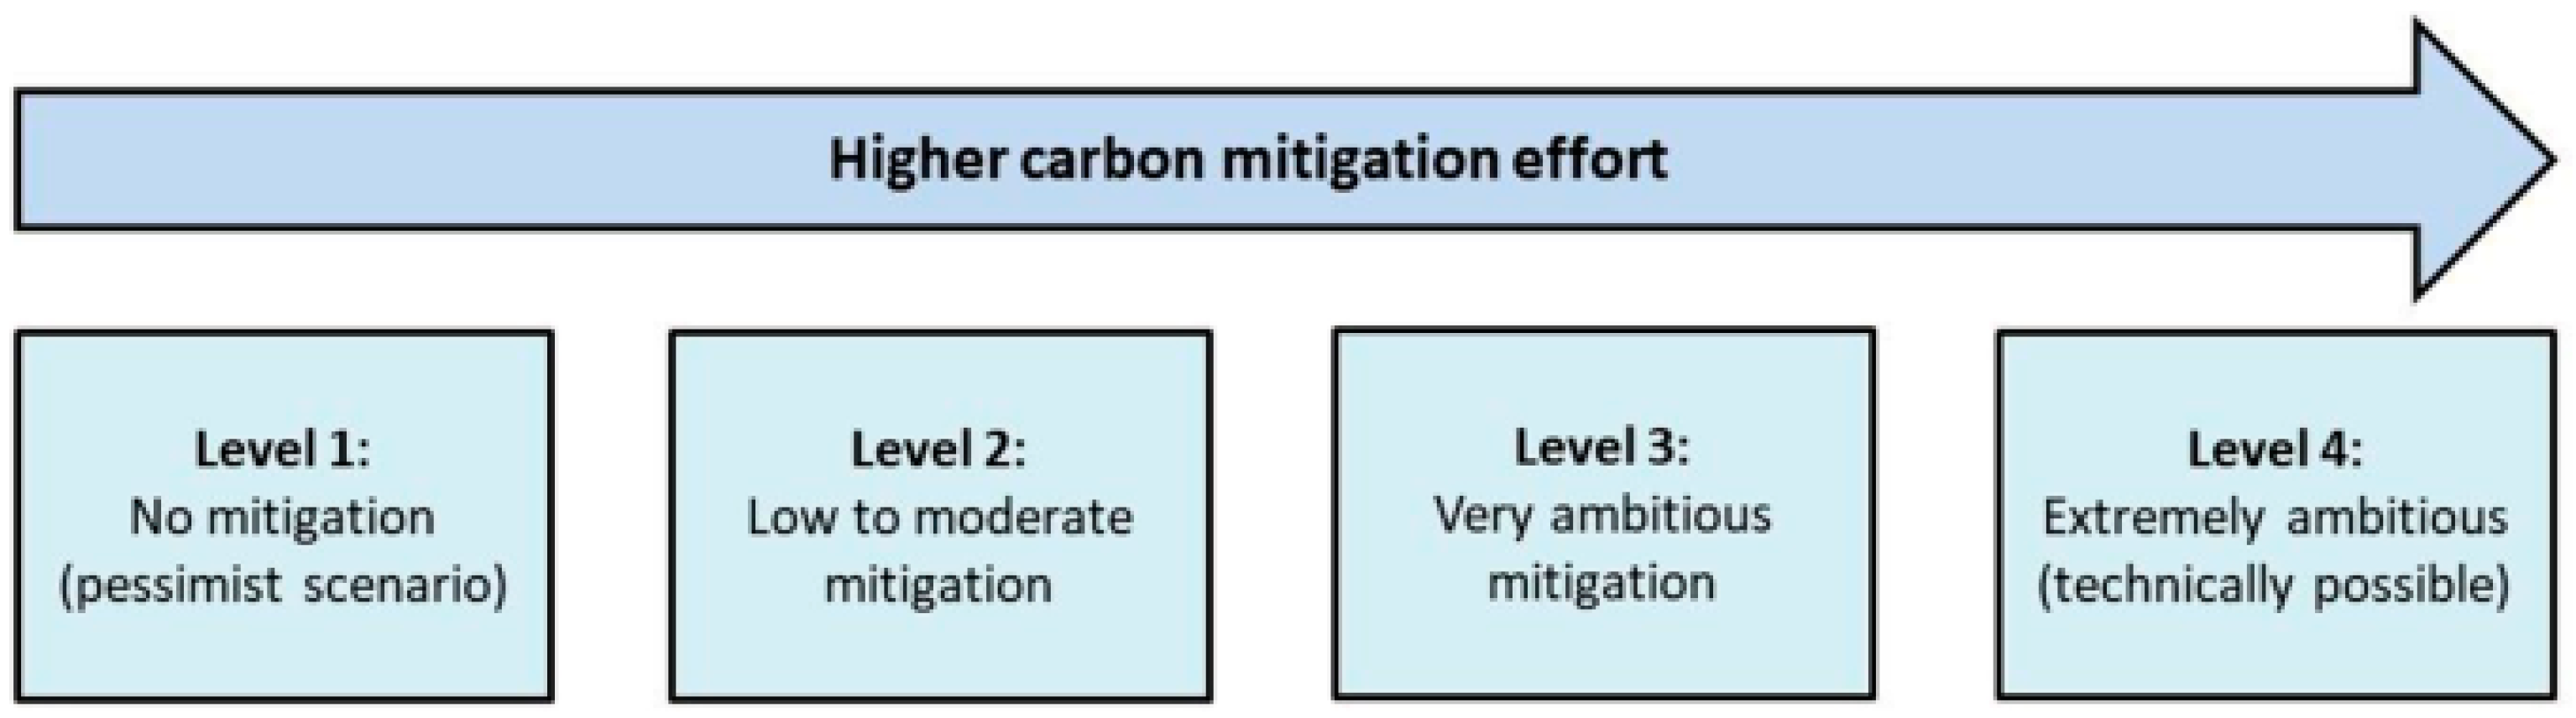
Each lever has four levels of ambition, representing the effort required to achieve the emission reduction initiative. Level 1 represents business as usual (BAU), level 2 represents a moderate effort that is not very challenging to attain, level 3 represents ambitious efforts that require significant systematic changes and technological breakthroughs, while level 4 represents extraordinarily transformative efforts on what is technologically possible (Figure 1).
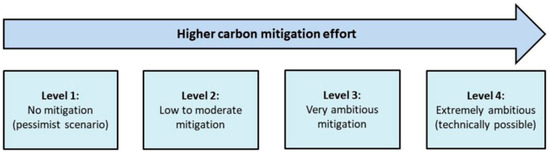
Figure 1.
Levels of ambition [35].
The levers under each sector considered in the KCERT model are discussed in the sections that follow. The sub-levers under each lever are available in the supplementary file to this article in Table S1.
3.1.1. Transport
KCERT 2050 considered 12 levers for this sector, aggregated into four major groups.
- Domestic Passenger Travel-Demand Lever: This lever controls the ambition levels for the domestic passenger transport demand per person across all transport modes. It considers both the total average transport demand per person set by the first sub-lever, controlling the ambition level for the passenger travel demand per person and the share of the total demand met by each domestic transport mode set by the model shift sub-levers, allowing users to control the ambition levels for the proportion of the total transport demand met by the domestic means of travel.
- International Air Travel-Demand Lever: This lever controls the ambition levels for the service demand for the distance travelled per international air travel passenger. The total international aviation demand is calculated by multiplying the passenger’s distance travelled per person by the population.
- Vehicle Distance Travel-Demand Lever: This lever controls the ambition levels for the share of occupancy rates for vehicles that consume electricity, hydrogen, hybrid-electricity, and biofuels. The passenger’s distance travelled is converted to the vehicle’s distance travelled by dividing it by the occupancy rate (passengers/vehicle) for each mode. Two mode categories are considered: light and heavy vehicles, where light vehicles refer to cars, matatus (14 seaters), and light lorries (rigid heavy goods vehicles—HGVs), while heavy vehicles refer to HGV-articulated, bus, passenger, and freight trains.
- Aviation Efficiency and Biofuel Lever: This lever controls the ambition levels for efficiency improvements, measured using an energy intensity index which gives a measure of how efficient an aircraft is. Lower energy intensities mean greater efficiencies. The aviation biofuel lever controls the ambition levels for the share of biofuels used in aviation fuels. KCERT 2050 carries the assumption from the Kenya Civil Aviation Authority (KCAA) that biofuels can be used directly in normal aircraft engines.
3.1.2. Buildings
For buildings, three lever groups were considered.
- Buildings’ Hot Water-Demand Lever: This lever consists of two sub-levers, the hot water-demand and hot water-deployment sub-levers. The hot water-demand sub-lever allows the user to control the ambition levels for the hot water demand per person for domestic buildings (the domestic hot water demand is calculated per person and is assumed to scale with the number of people in Kenya and not the number of dwellings) and per unit floor area for non-domestic buildings relative to the base year (2015) as an index. The index measures the gradual growth in demand through additional hot water use given the growth in population or amount of non-domestic buildings per unit floor area. The building’s hot water-deployment sub-lever controls the ambition levels for the share of energy technologies used to meet the demand for hot water in domestic and non-domestic buildings. The fuels used for hot water heating for domestic homesteads are electricity, solar, and wood, whereas those for non-domestic buildings are solar, wood electricity, and oil boilers.
- Domestic Dwelling Cooking Lever: This lever controls the ambition levels for the share of the energy supply used to meet the demand for cooking in domestic buildings and institutions. It does not influence non-domestic cooking, because, according to the sector experts, the predominant energy sources for non-domestic cooking are gas and electricity. For domestic buildings, the fuels considered were biomethane, bioethanol, biogas, kerosene, charcoal, wood, electricity, and Liquified Petroleum Gas (LPG).
- Lighting, Appliances, and Cooling-Demand Lever: This lever contains the demand and efficiency sub-levers that control the ambition levels for the energy demand and efficiency improvements for the lighting, appliances, and cooling in domestic and non-domestic buildings. Here, the demand is calculated per person and per unit floor area for domestic and non-domestic buildings, respectively. Domestic and non-domestic demands for cooling are defined as the share of dwellings with air conditioning and the index of demand per unit floor area. Domestic and non-domestic cooling demands are defined by the electricity required to deliver the service. For domestic energy service demands, the user controls the share of dwellings assumed to have air conditioning installed. For non-domestic energy service demands, the user controls an index for the cooling demand per unit floor area, relative to the 2015 base year.
3.1.3. Land Use and Bioenergy
KCERT 2050 considers emissions in terms of soil management (fertiliser usage), enteric fermentation regulation, and animal manure management. This sector focused on four levers.
- Farming Yield and Efficiency: This lever controls the ambition levels for livestock numbers and farming yields, agricultural fuel use, and the emission intensity index for agricultural-process emissions. For livestock numbers, this lever considers a reduction in the number of livestock. Ruminant livestock, especially cattle, release significant emissions during enteric fermentation, which happens during digestion. Reducing the number of ruminant livestock and substituting their meat protein with other non-ruminant livestock, such as poultry or pigs, reduces the emissions from the farming sector. In addition, monogastric animals are usually more efficient in converting grain feed into edible meat than ruminants. Farming yield deals with the units of food crop produced per unit of land. Farming efficiency concerning yields advocates for producing as much food crop per unit of land by improving farming practices, which would also make the land for forestry and bioenergy levers available for use. Currently, mechanical farming equipment is primarily powered by fossil fuels. This lever also controls the ambition level for reducing the use of fossil fuels in farming by substituting it for biofuels.
- Forestry: This lever allows the user to control the ambition levels for land dedicated to forests, which can store above-ground carbon and soil carbon. The levels of ambition are constrained to the land available that can be converted to forests, either through afforestation or reforestation.
- Land for Bioenergy: This lever controls the ambition levels for the land area dedicated to bioenergy and the proportion of agricultural waste converted to electricity. This lever works by increasing the land for bioenergy which is then used to generate biodiesel. Biomass wastes and agricultural residues are used to generate electricity. The ambition levels for the land available for bioenergy are constrained by land availability based on the yield and forestry levers.
- Waste Reduction: This lever controls the ambition levels for the proportion of dry waste, wet waste, and used cooking oil that is recycled, composted, incinerated to generate electricity, anaerobically digested, converted to biofuel, or openly burnt. Open burning and incineration to generate power only applies to dry waste.
3.1.4. Electricity Generation
The electricity generation model calculates the total annual electricity production required after transmission, distribution, and seasonal storage losses. This section defines technologies used in power generation and their associated emissions. It has been summarised into two major categories: seasonal storage and electricity generation capacity.
- Seasonal Storage: this lever controls the ambition levels for the maximum amount of electricity that can be stored for balancing at peak periods in seasonal electricity storage technologies.
- Electricity Generation Capacity: This lever controls the ambition levels for the proportion of electricity generated by each technology, including nuclear, onshore wind, hydro, biomass, power imports, solar, natural gas, geothermal, and thermal heavy fuel oil (HFO) plants. The levers under this section focus on reducing the use of fossil fuels in favour of renewable sources, such as solar, geothermal, and hydroelectric power.
3.1.5. CO2 Removal and Gases
Under CO2 removal and gases, two main levers were modelled: GHG-removal technologies and gas supply.
- GHG-Removal Technologies: KCERT 2050 considers similar technologies to those highlighted in the Mackay Carbon Calculator. These were enhanced weathering, direct air capture (DAC), CCS systems, and afforestation/reforestation. These technologies aim to capture GHGs from the air that could not be captured at the individual sector levels. The hydrogen produced using CCS in conjunction with either the gasification of biomass or steam methane reformation (SMR) were excluded from KCERT 2050, because it was determined from the stakeholder workshops that they are not currently feasible in the Kenyan context.
- Gas Supply: This sub-lever controls the ambition levels for various gases supplied to other sectors. KCERT 2050 considered four gases: hydrogen, natural gas, LPG, and biogas. Unlike the UK, Kenya has a decentralised gas supply system. Therefore, the model assumes that these gases will be supplied through canisters to meet their demand in sectors such as industry, buildings, and transport.
3.1.6. Industry
KCERT 2050 considered four major industries: cement manufacturing, steel fabrication, sugar processing, and tea processing. Kenya’s most emitting industry is cement manufacturing, with cement consumption on a steady rise over the past decade [1]. This sector considers five levers for industrial GHG emission mitigation.
- Industrial Efficiency: This lever allows the user to control the ambition levels for the energy intensity index and process emission intensity index. The energy intensity index measures the amount of energy used to generate a single output unit. This sub-lever reduces the industry sector’s energy intensity index, thereby reducing industrial energy consumptions. The process emissions intensity index measures the emissions generated per unit of output. This sub-lever controls the emissions generated per unit of output created. These two sub-levers work hand in hand in making industrial production processes efficient.
- Industrial Electrification: This lever controls the proportion of heating processes in industries met by electricity. This lever reduces the proportion of the natural gas, coal, heavy diesel, and biomass being used in industry since electricity has low emissions at the point of use, based on the current Kenyan energy mix and the pathway generated by the user. The more renewable energies in the grid, the fewer GHG emissions in industrial electrification. In contrast, for thermal end uses (e.g., hot water for industrial processes), it is usually more efficient to use thermal sources, such as natural gas and solid biomass, directly for heating (e.g., in water boilers) than for power generation and then for heating, requiring more conversions and associated energy losses [38].
- Industrial Shift to Biomass: This lever controls the proportion of biomass adoption in industrial heating processes. Since emissions from combustion biomass are assumed to be biogenic (that is, emissions that were once captured via photosynthesis, in equivalent terms), it is a cleaner alternative for meeting the industrial heating demand.
- Industrial Shift to Gas: This lever regulates the proportion of natural gas used in heating processes in the cement manufacturing industry. Currently, Kenya primarily uses woody biomass for tea processing, bagasse for sugar processing, electricity in steel fabrication, and coal and heavy fuel oil (HFO) for cement manufacturing; therefore, this lever focuses on the latter. Natural gas, which Kenya plans to pipe in from its neighbours for industrial use, has a lower emission factor, compared to coal and HFO. As such, this lever encourages the usage of natural gas instead of coal and HFO for the cement sector.
- Industrial Carbon Capture and Storage (CCS) Systems: This lever allows the user to control the ambition levels for the share of heating processes, incorporating CCS for each industry as a fraction of the total number of factories in each industry. CCS is the process of capturing and storing CO2 from processes before they are released into the atmosphere.
3.2. Net−Zero Pathway for Kenya
During COP26 held in Glasgow, Kenya declared that it would attain net-zero emissions by the year 2050 [39]. To simulate this pathway in KCERT 2050, the modelling team used the original model in Microsoft Excel (rather than its webtool interface) to find the optimal level of ambition for each lever for all the sectors that brought down net GHG emissions to zero by 2050. The ambition level for each lever for the net-zero emissions pathway is available as a supplementary file to this article in Table S2.
3.3. Sensitivity Analysis
We conducted a sensitivity analysis on the KCERT 2050 tool, which was meant to quantify the approximate impact of each lever of a particular sector in mitigating GHGs and their effects on the energy mix. The KCERT 2050 web tool, by default, has all levers set to level 1, representing the business-as-usual scenario (BAU).
The sensitivity analysis was performed by moving a single lever’s level from 1 to 2 (moderate effort), then from 2 to 3 (ambitious effort), and then lastly from 3 to 4 (transformative ambition) while keeping all the other lever’s levels as BAU (level 1). This was conducted to determine the isolated effect of a single lever on GHG emissions and the energy balance in 2050. This was performed for all levers. The order in which the levers were changed did not impact the results since each lever was independently evaluated, keeping all the other levers at business as usual (BAU).
The sensitivity analysis assesses the weight of each lever’s level in the total GHG emissions. However, given that the model is all dynamically integrated, the effect of changing a single lever’s level one at a time may not be the same as when changing other parameters simultaneously. For example, the impact of changing the industry electrification lever can be different whilst having a higher or lower share of renewable energy in the electricity grid, which is determined by other levers.
4. Results and Discussion
4.1. Kenya 2050 BAU Emissions Scenario
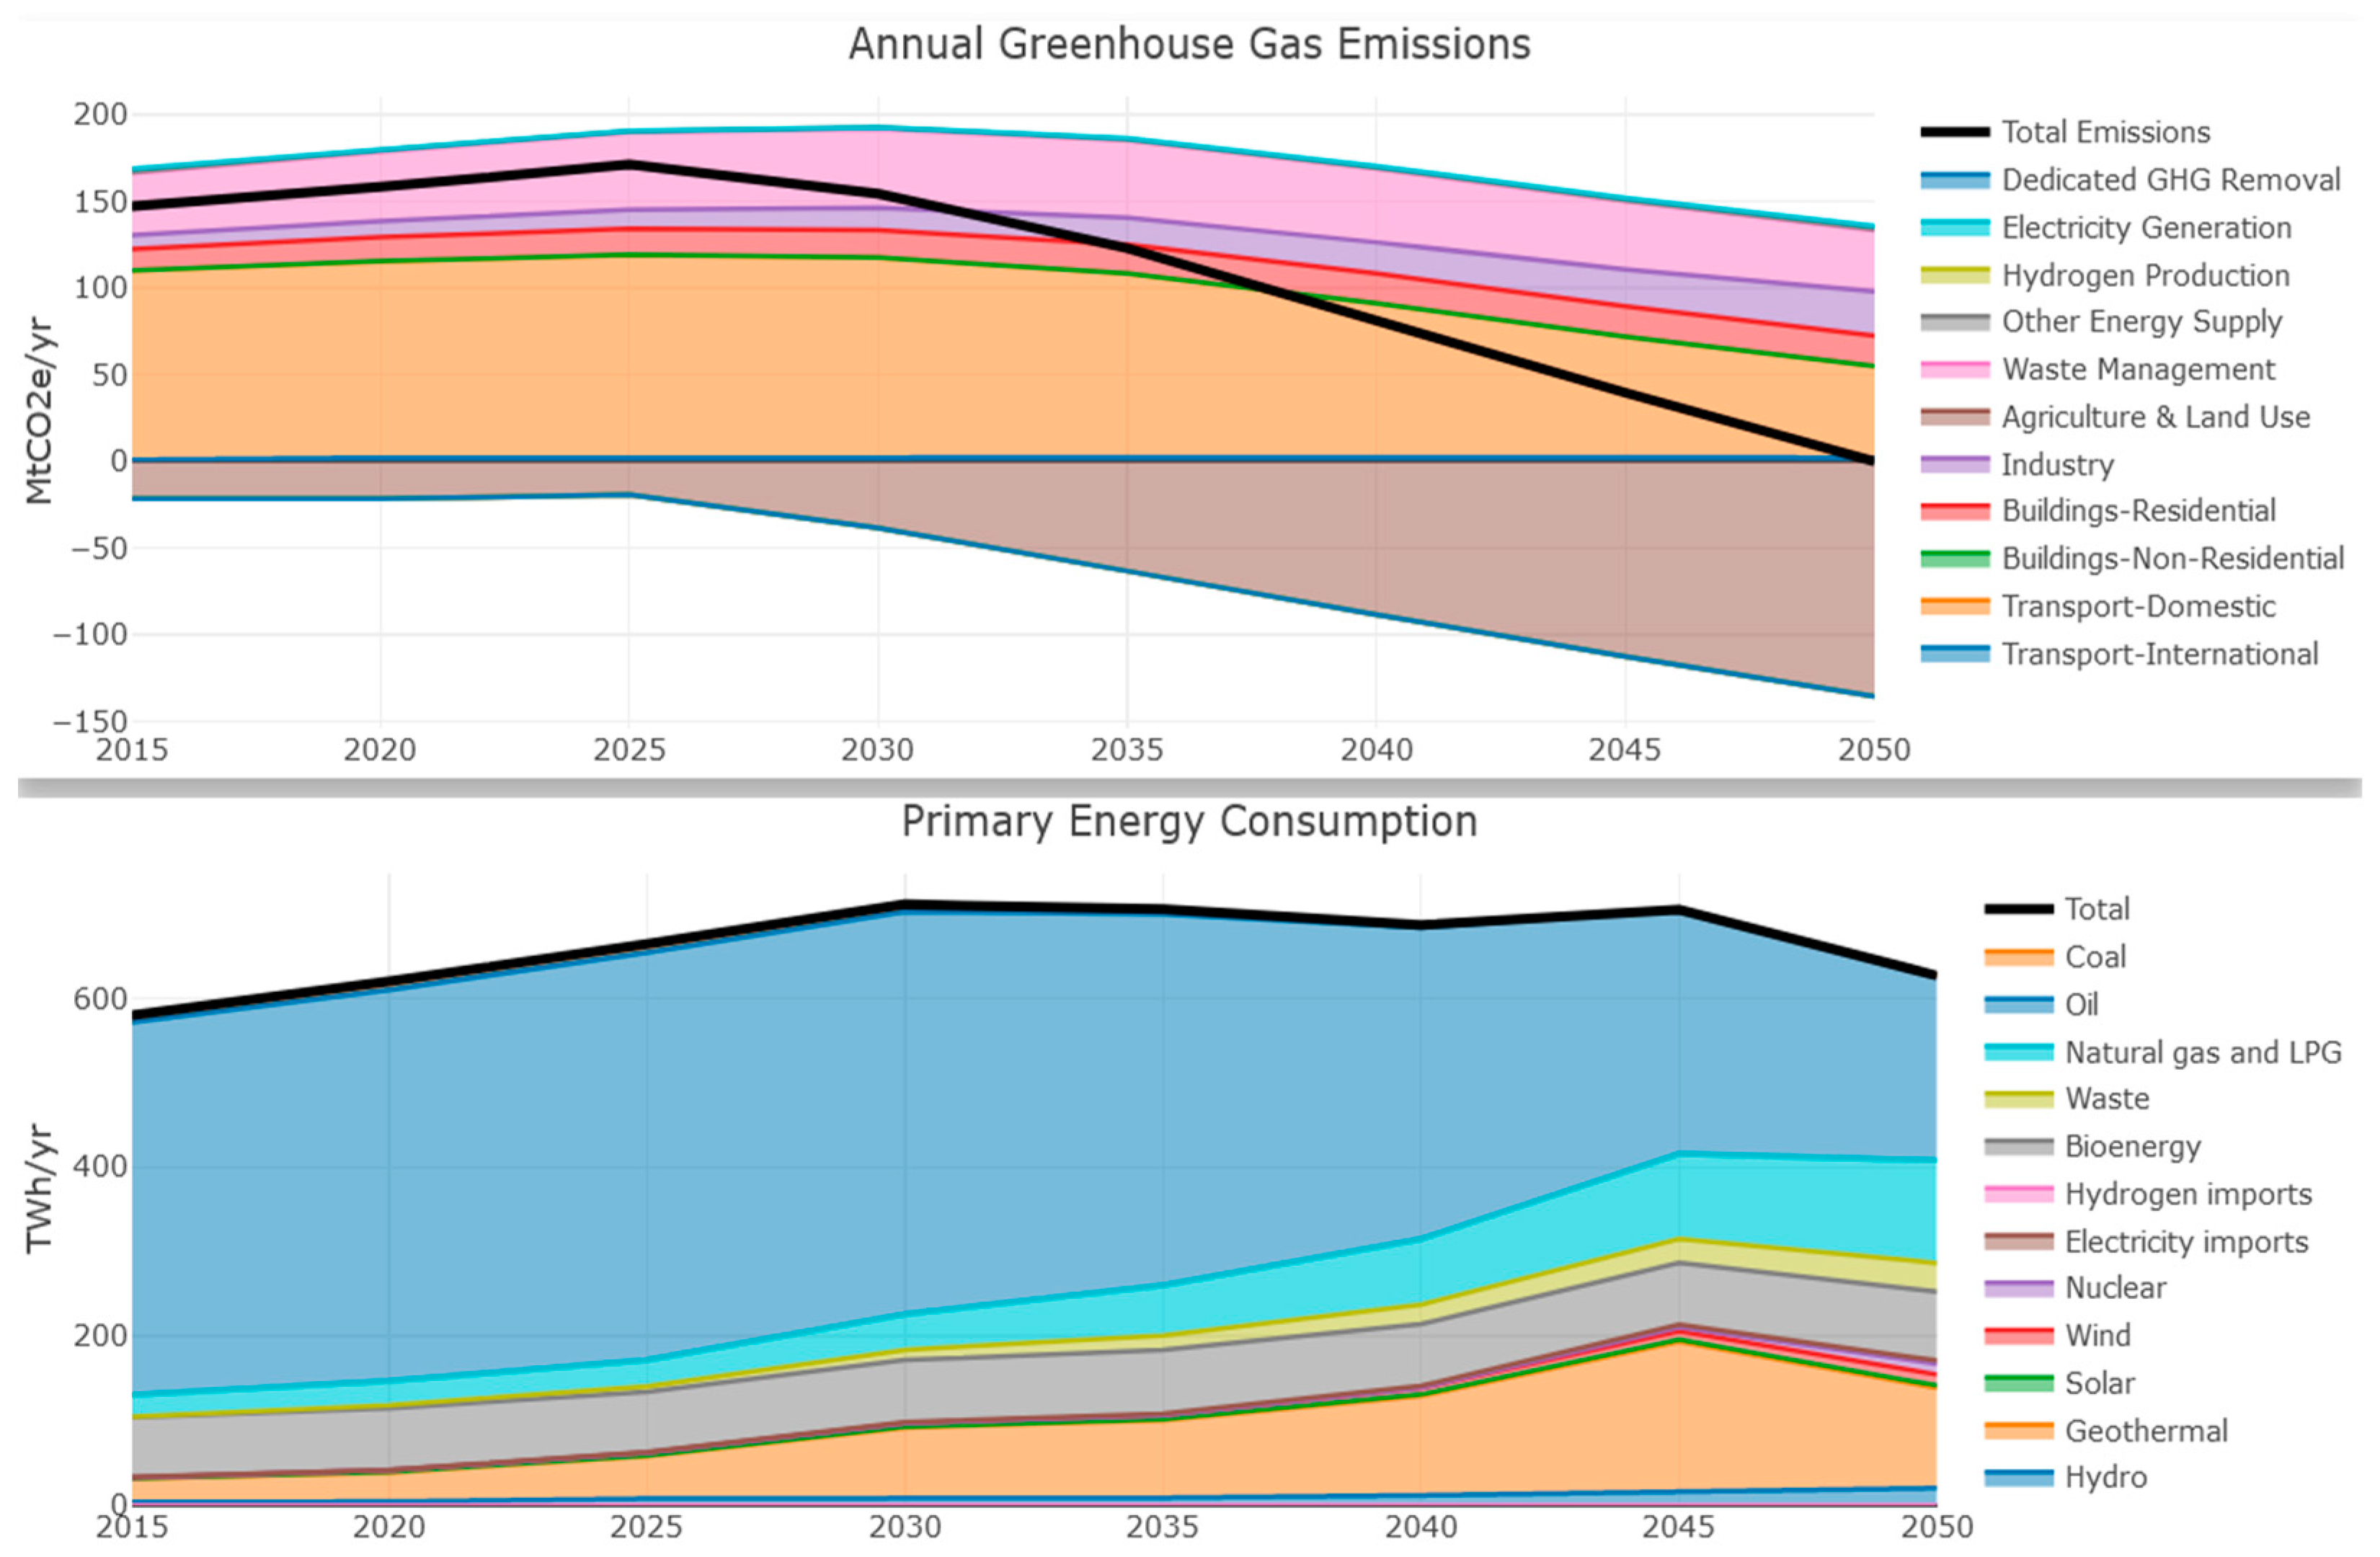
Figure 2 shows the GHG emission trajectories from the KCERT 2050 model for the years 2015 to 2050. These emissions are under BAU, in which a minimal effort is applied to mitigate emissions. The top graph shows the emissions per sector, whereas the bottom graph shows the energy consumed, concerning the fuels used.
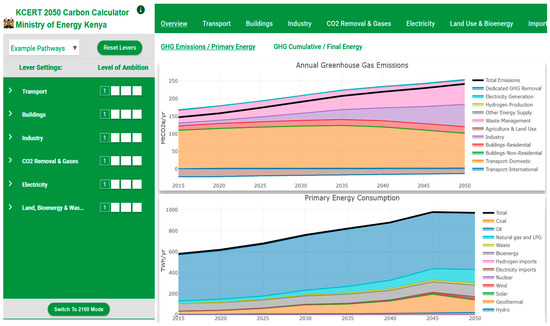
Figure 2.
Snapshot of KCERT interface and emissions during BAU scenario.
As also shown in Figure 2, in 2050, the transport sector will be the biggest emitter in Kenya, in line with the projections in the National Climate Change Action Plan [4]. Given this increasing trend, KCERT 2050 estimates that under BAU, the emissions from this sector will reach 101 MtCO2e in 2030. The industry sector follows the transport sector with emissions of about 61 MtCO2e, a land use with 56 MtCO2e, driven by the agriculture and waste management sectors, and buildings with 18 MtCO2e, arising from the fuels used in heating water and cooking. These projections are also in line with national policy documents [4,12].
Electricity generation is achieved using 92% renewable sources; thus, this sector is the lowest emitter, at around 1.68 MtCO2e. At BAU for all the sectors, the main energy vector driving the economy is oil, followed by geothermal energy, with consumptions of 539 TWh/y and 118 TWh/y, respectively, by 2050. For the remaining fuels, these have an aggregate consumption of about 171 TWh/y by 2050.
4.2. The 2050 Net−Zero Pathway
Figure 3 shows the emissions and energy demand for Kenya under the net-zero pathway. Overall, in this net-zero simulation, it is anticipated that, from 2015 to 2050, the annual emissions from the transport sector will drop from 96.27 MtCO2 to 54 MtCO2e per year. Industry annual emissions would move from 64.65 MtCO2e to 24 MtCO2e, land use from −12.56 MtCO2e to −99 MtCO2e, buildings from 19.53 MtCO2e to 17 MtCO2e, and electricity to 1.5 MtCO2e. As of 2050, the consumption of oil drops to 218 TWh/y, while the consumption of power from non-fossil sources such as wind, hydro, waste, imports, geothermal energy, bioenergy, and nuclear energy yields a combined consumption of 140 TWh/y.
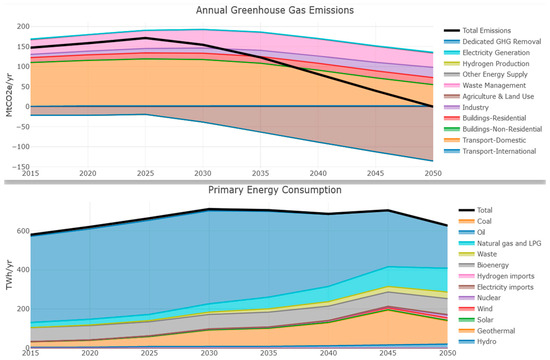
Figure 3.
KCERT emission trajectories under the net-zero pathway.
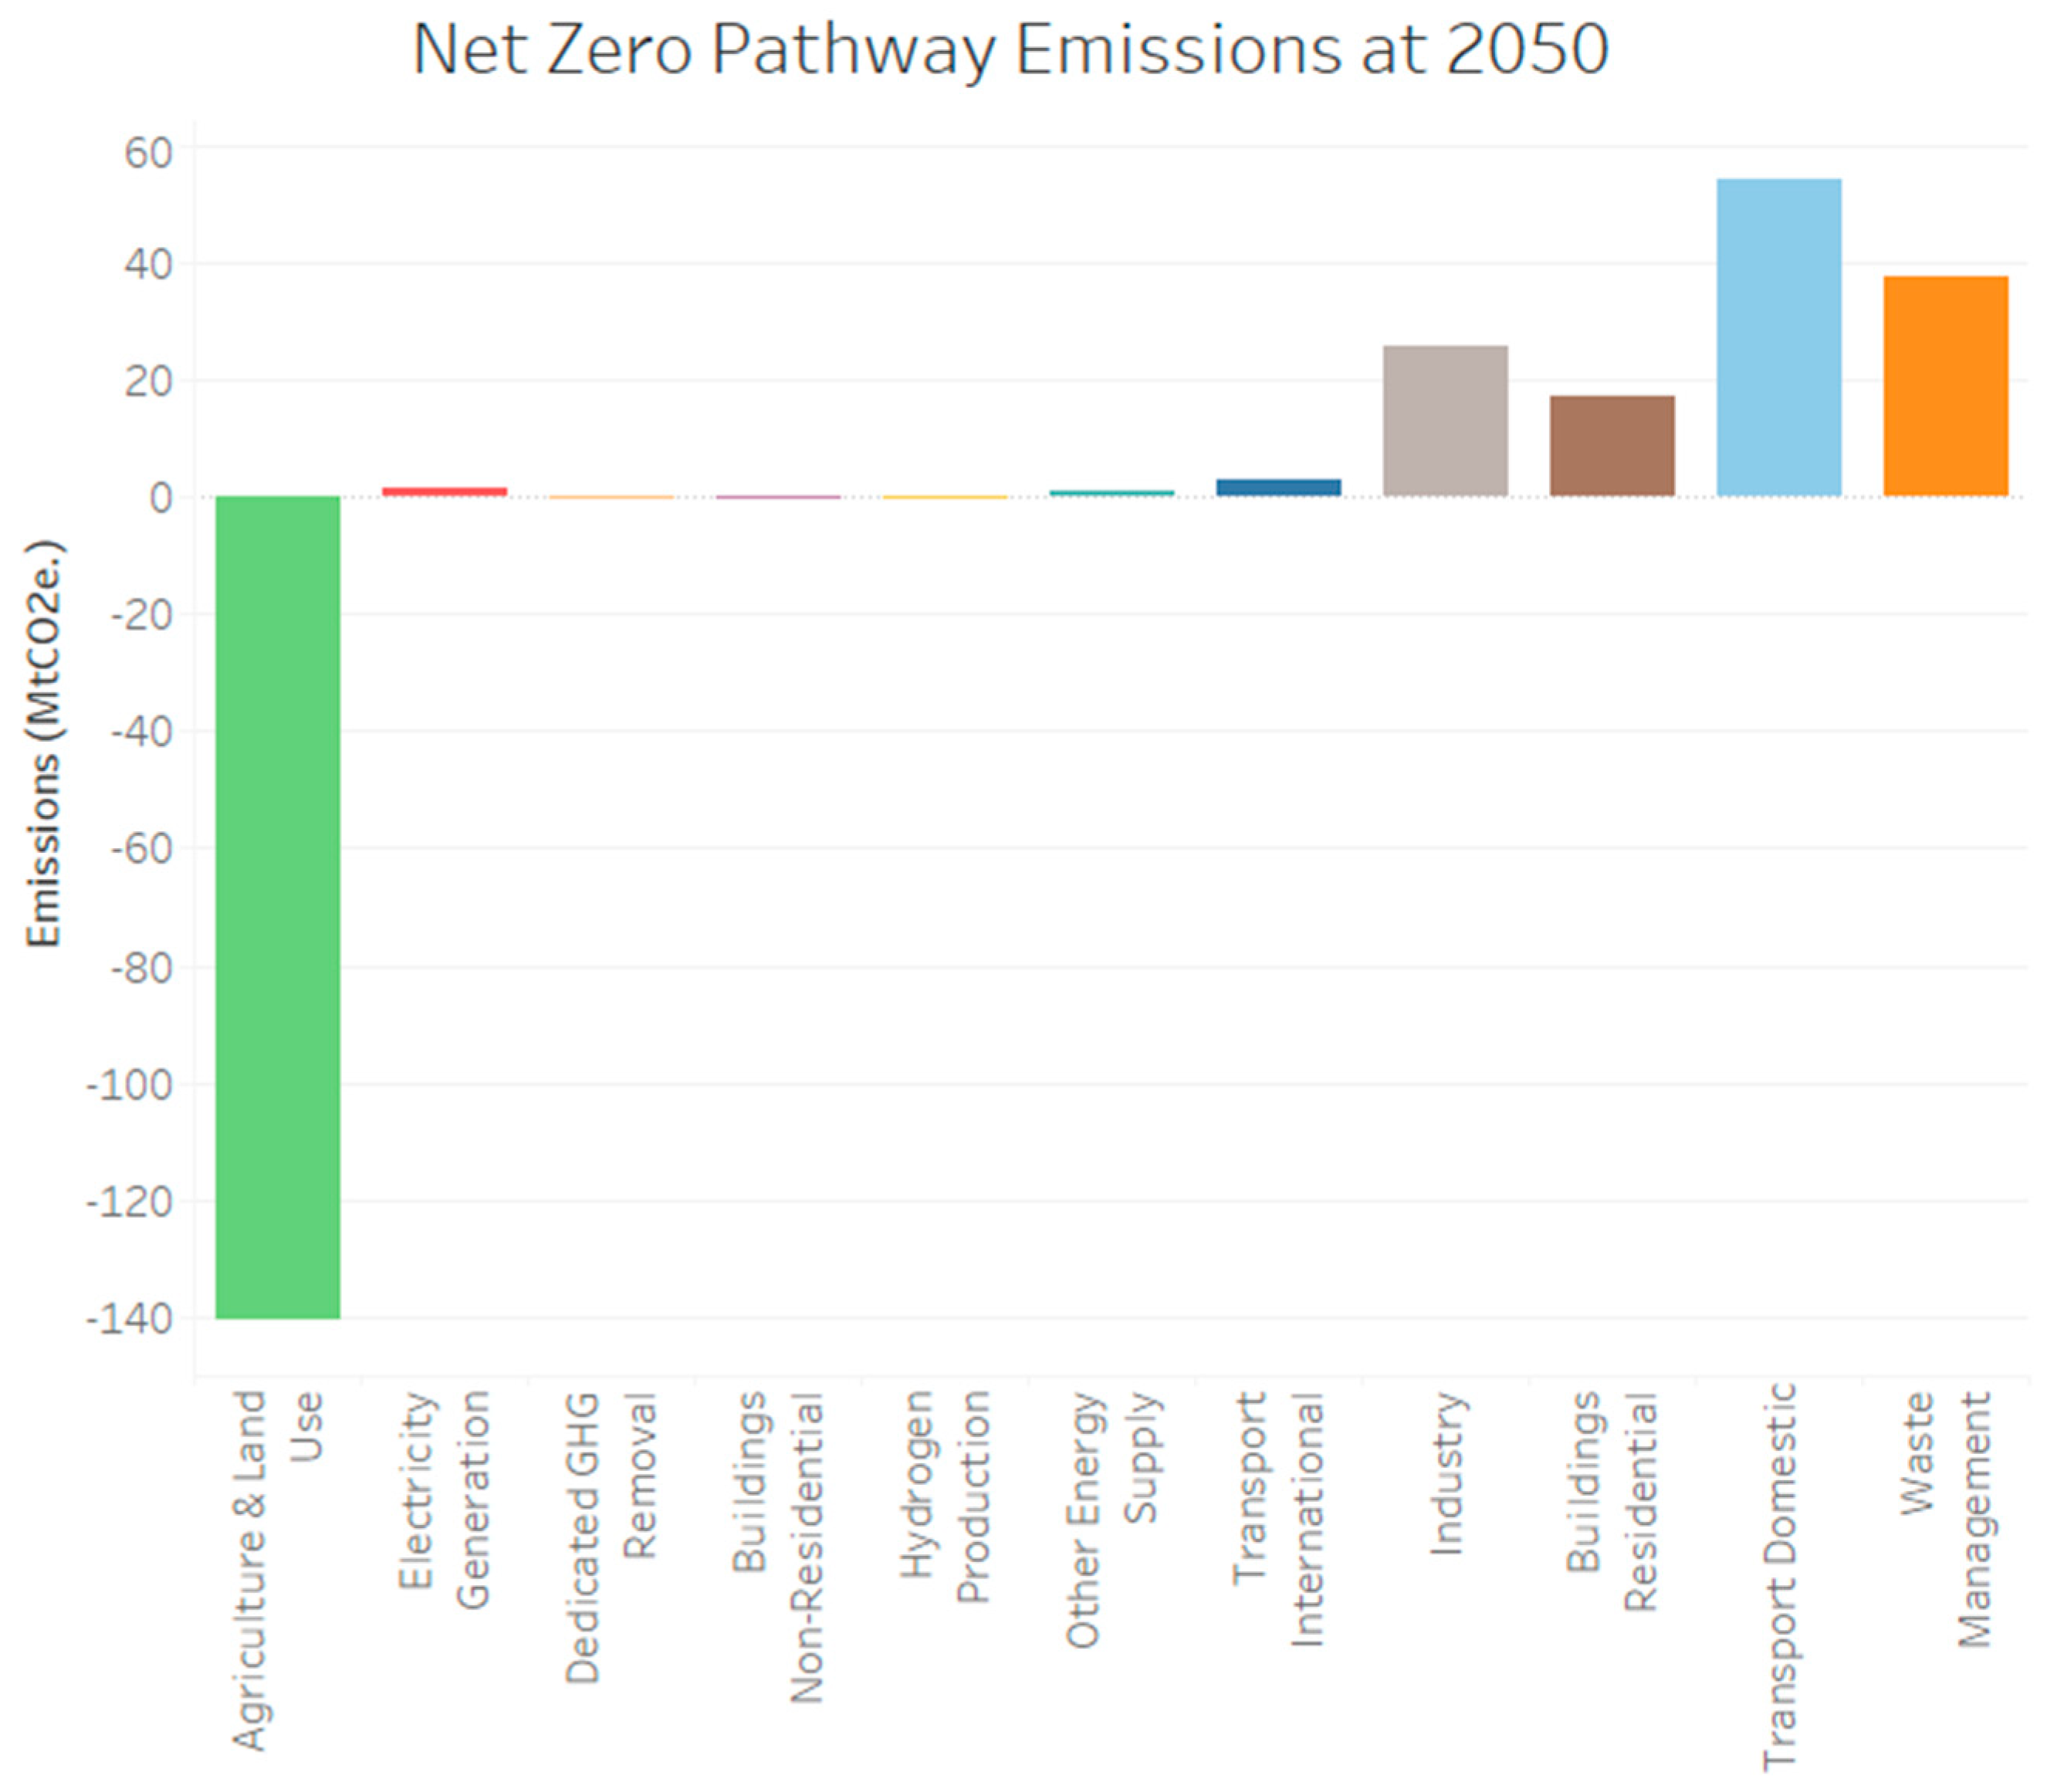
Figure 4 shows the emissions of each of the six sectors considered by the KCERT 2050 tool under the net-zero pathway by 2050. The updated NDCs aim at reducing its total carbon emissions by 46 MtCO2e by 2030 by targeting a 24.1 MtCO2e and an 11.9 MtCO2e reduction in emissions from the energy and land use forestry sectors, respectively, by the year 2030 [3]. The sections that follow discuss the sector-specific strategies for the net−zero pathway. The net−zero pathway-sector levers and their selected levels for the assessed scenarios in KCERT 2050 are available in the supplementary material (Table S1).
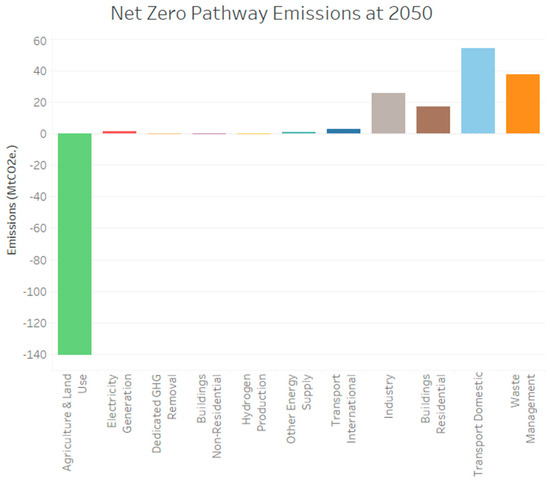
Figure 4.
KCERT net−zero pathway emissions in 2050.
4.2.1. Land Use
From Figure 4, for the net−zero scenario, KCERT 2050 simulates Kenya requiring a significant carbon sink of approximately 140 MtCO2e from the land use and forestry sectors through level 4 ambition’s afforestation and reforestation efforts to meet a 10% tree cover in the country. Additionally, the level 4 ambition for farming yields and efficiency is achieved by reducing the number of livestock in the country and employing farming practices that both increase the yields per unit land area and reduce emission intensities.
The net−zero pathway aligns with Kenya’s plans to mitigate emissions from all sectors by using the LULUCF sector as a carbon sink, increasing the area under agroforestry by 200,000 acres by 2022 and 400,000 acres by 2030, breeding improved livestock and optimizing the waste-to-energy production, such that 50% of the total abattoir waste is used in electricity generation, and by improving manure management, among other strategies [3].
4.2.2. Waste Management
In the assessed net−zero scenario, KCERT 2050 predicts that about 52 MtCO2e/y of carbon emissions will be mitigated from this sector in 2050 by reducing the waste going to landfills through recycling and diversion to energy generation. Level 4 waste management aims at a 30% reduction in waste by applying circular economy approaches to municipal solid waste management, facilitating the diversion of 100% of both organic and recyclable waste from landfills.
Under waste management, Kenya, through the Ministry of Environment and environmental agencies such as The National Environment Management Authority (NEMA), will implement proper waste handling initiatives, e.g., recycling, conversion to biofuels, composting and the usage of waste in power generation [40].
4.2.3. Transport
For the transport sector, the main objective is to reduce the usage of fossil fuels in favour of cleaner transportation modes, such as walking, public transport, and the use of electric, hydrogen, or even biofuel-powered vehicles. In particular, to obtain a net−zero pathway, the transport sector will need to reduce the annual distance travelled per person by 32% from 22,220 passenger kilometres/person in 2015, with no more than 25% of this performed by cars and the rest performed by walking, cycling, and public transport. Another lever of importance is an increase in the share of plug-in hybrid electric vehicles (PHEVs), hybrid electric vehicles (HEVs), and battery electric vehicles by 25% and 10% for light and heavy vehicles, respectively. This strategy aligns with the Ministry of Transport, which aims to ensure that that 30% of all light-duty vehicles will be powered by either electricity or hydrogen by 2030 [15].
4.2.4. Industry
To achieve the net−zero pathway, KCERT 2050 simulates a fuel shift from the traditional HFO and coal to electricity and biomass, with the shift to electricity having the biggest impact. Additionally, industries must become more efficient in terms of power consumption during production. Under this pathway, the sector emissions are estimated at 25 MtCO2e/y by 2050 compared to 61 MtCO2e by 2050 under the BAU scenario. Given the increase in demand for steel, iron, and cement, which rely on fossil fuels, KCERT 2050 identifies these two sectors as the leading emitters in the industry sector. The country’s plan to mitigate emissions from the industry sector is to reduce the cement demand in favour of cleaner building materials such as interlocking bricks, using carbon capture and storage technologies and improving industrial-production efficiency [3].
4.2.5. Electricity
The net−zero pathway simulates a level-1 ambition for the levers in the electricity sector. This could be attributed to the fact that Kenya’s electricity supply is primarily from renewable energy sources and therefore requires minimal decarbonisation efforts in the sector. The ambition at level 1 includes increasing generations from geothermal, hydropower, solar mini-grids, and wind onshore that constitute the current generation mix. Additionally, at level 1, nuclear power is expected to be introduced to provide 417 MW by 2040, and liquified natural gas (LNG) is expected to provide 327 MW by 2025. These trajectories are in line with the country’s Least Cost Power Development Plan 2021–2030. Kenya also aims to decommission all fossil fuel power plants. As shown in Figure 4, KCERT 2050 predicts that emissions from electricity generation will drop from 1.68 MtCO2e at the baseline to 1.12 MtCO2e by 2050.
4.2.6. CO2 Gases and Removal
For GHG removal and CCS systems, Kenya currently only uses afforestation/reforestation schemes as its main way of sequestering GHG emissions [41]. For the net−zero pathway, KCERT 2050 simulates a level 2 ambition for the conversion of biogenic resources with the integration of carbon capture and storage, where one-third of all bio-transformation processes have CCS applied. However, these technologies are in their research and development stage, and KCERT 2050 assumes that some of these technologies would be adopted from the year 2040 onwards. Additionally, CCS-based removal methods have not yet been integrated into Kenya’s climate policies.
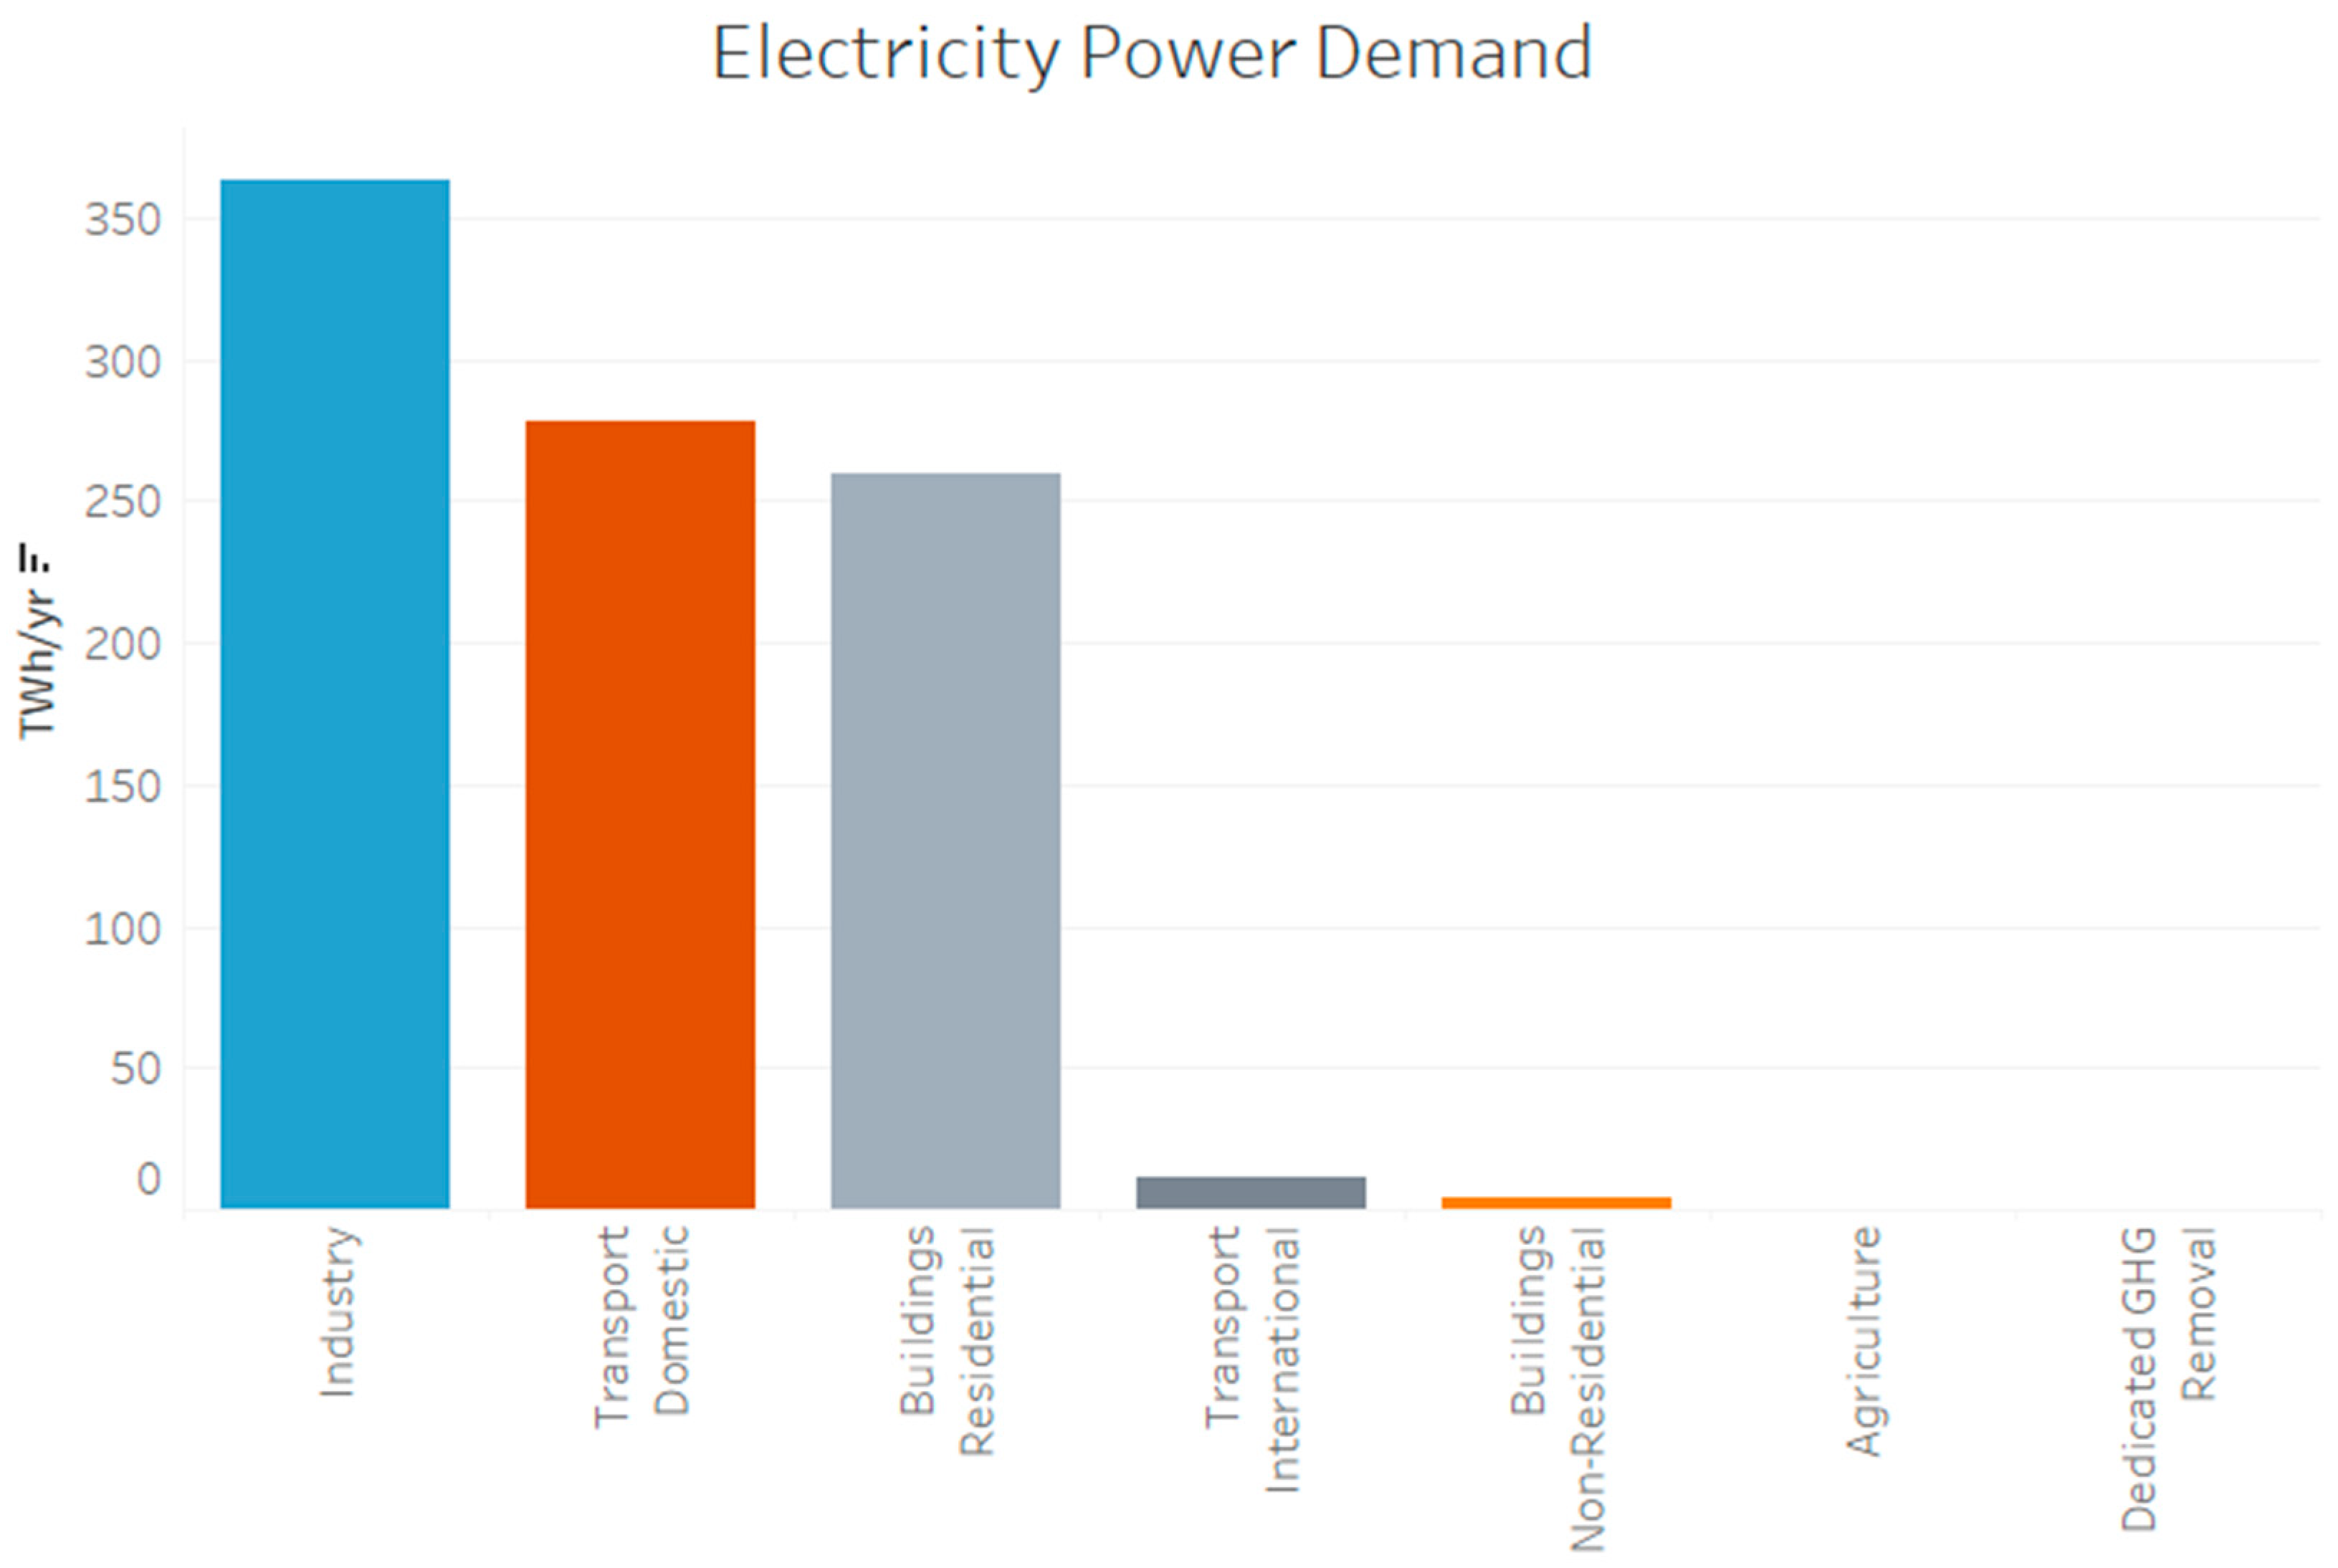
4.2.7. Overall Electricity Demand
Figure 5 shows the power consumption across the six assessed sectors under the net-zero pathway in TWh/y as of 2050. Industry is the largest power consumer at approximately 360 TWh/y, followed by transport at around 277 TWh/y, and residential buildings at around 260 TWh/y.

Figure 5.
Sectoral electricity demand under the net-zero pathway for the year 2050.
The main cooking mode in non-residential buildings is either gas or electricity, leaning more toward gas and, therefore, the power consumption is relatively low, because electricity is mostly used to power electrical devices and heat water for the net−zero pathway.
On the other hand, residential buildings have an electricity demand of around 260 TWh/y, since KCERT 2050 (under the net-zero pathway) simulates that cooking and water-heating needs would be met by electricity. Kenya plans to electrify 99% of its households by 2030, thus allowing all Kenyans to meet their household energy needs primarily by using electricity [42].
For international transport, at the net-zero pathway, the introduction of hybrid and partially electrified small aeroplanes with turboprop systems is in line with the action plans for emission reductions in the aviation sector [32]. The electricity consumed by the aviation sector will be used to power them at a low rate of 10 TWh/y. However, these vehicles will be scarce, given that they are expensive and not technologically ready for commercialisation.
Fossil fuels are primarily used to power farming equipment in the agriculture sector. During the modelling of the tool, land use and farming sector experts stated that switching the farming equipment from biofuels to electricity was not feasible due to few mechanised farms and a large number of them being smallholdings. Therefore, for the net-zero pathway, a minimal use of electricity in agricultural machinery is projected at about 0.3 TWh/yr.
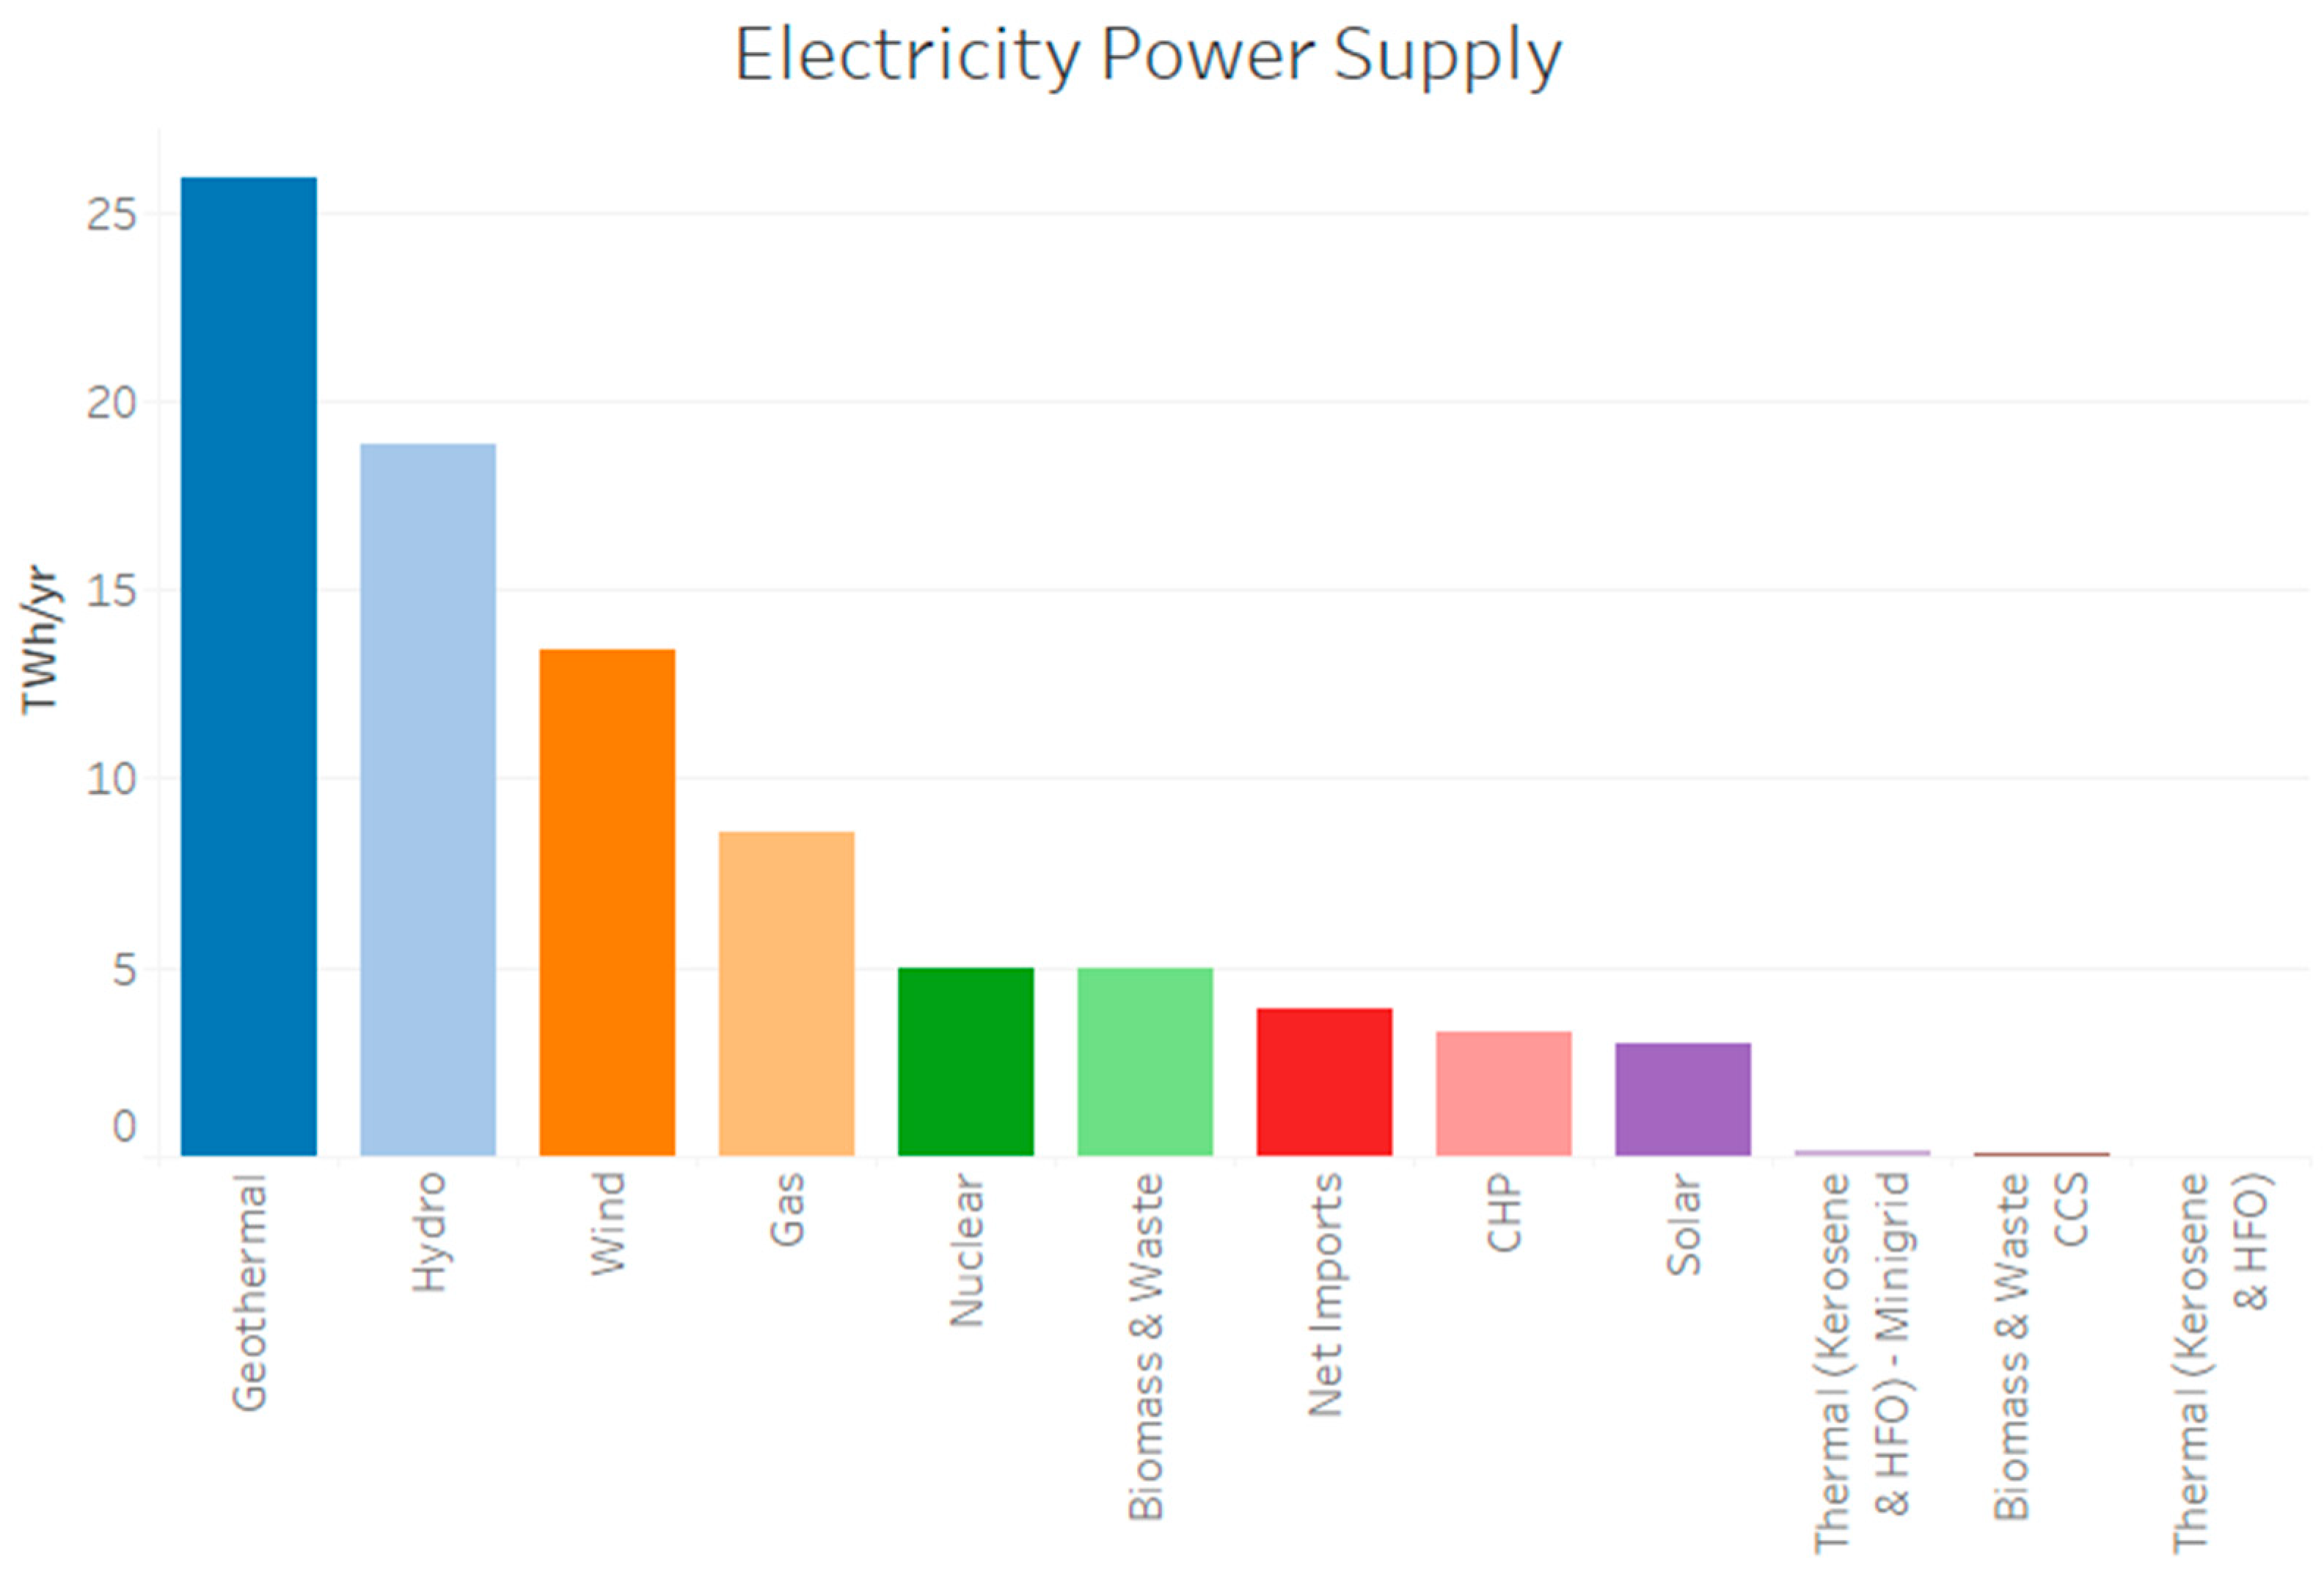
4.2.8. Overall Electricity Supply
Figure 6 shows the electricity power supply in Kenya as of the year 2050 under the net-zero pathway. KCERT 2050 models energy generation as an aggregate process. This means that any activity that generates power is considered as power generation. Industries have a significant power demand, given their electricity and heating requirements. The industry experts consulted during modelling stated that switching their power needs to the electric grid would be uneconomical in most cases. Therefore, the energy demand for the industry sector was modelled as grid-sourced power and Combined Heat and Power (CHP) units.
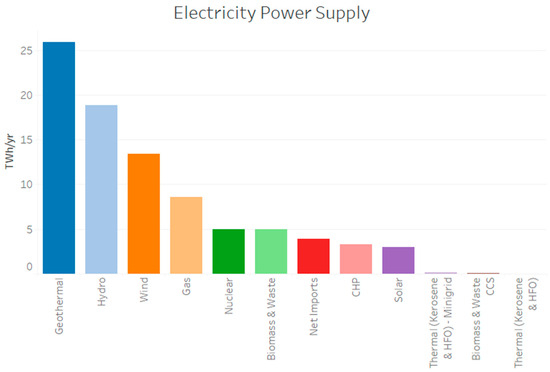
Figure 6.
Electricity generation mix under the net-zero pathway.
KCERT 2050 simulates the current trend of the electricity power generation mix with geothermal, hydropower, and wind leading under the net-zero pathway, as shown in Figure 6. In addition, there are feasibility studies assessing the availability of uranium oxide locally for nuclear power generation. However, as it stands, the country uses geothermal and hydroelectric power for the baseload with the added advantage that they are cheap to run, whereas nuclear power plants are expensive to both construct and operate. Given this situation, the Ministry of Energy advocates that before nuclear options are explored, geothermal and hydroelectric power should be exhaustively utilised [42].
Power generation through the incineration of waste is not only a renewable source of energy but also a way to manage waste. Nevertheless, the best option would be first to reduce, reuse, and recycle the available waste. Currently, Kenya has several water-to-energy plants, including the 10 MW Kericho power plant [43] and the 40 MW Dandora plant [44].
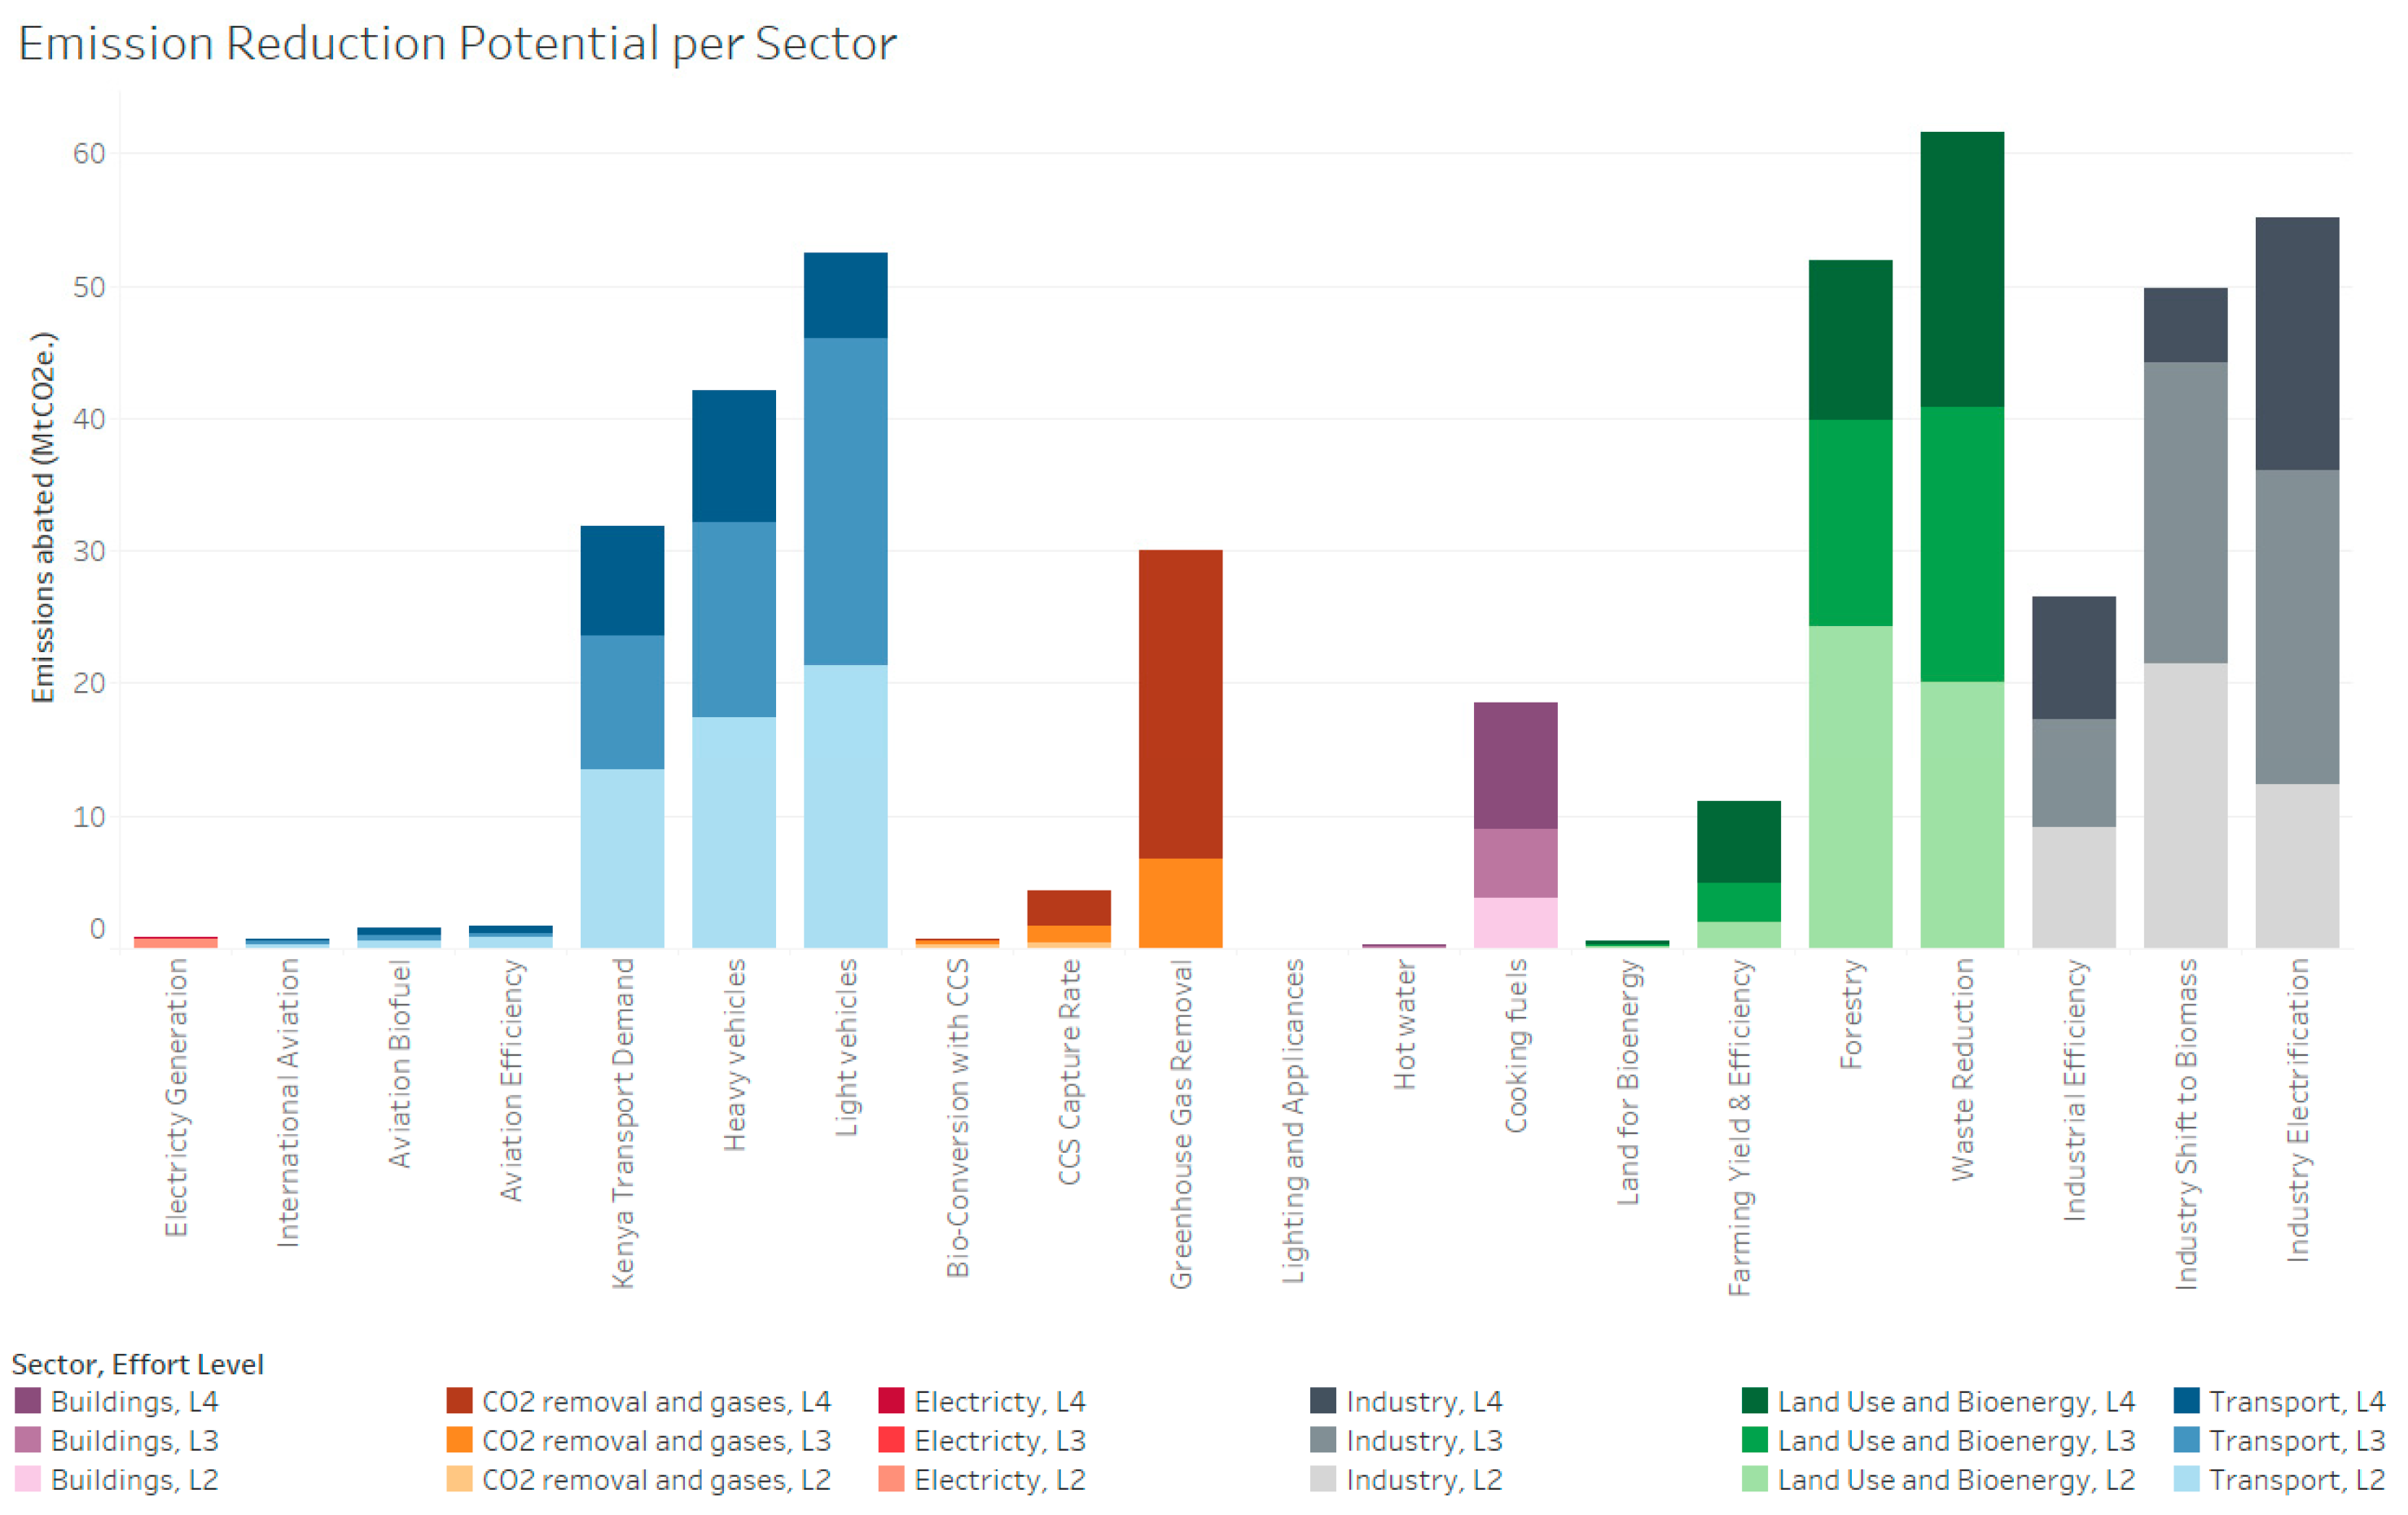
4.3. Sensitivity Analysis
Figure 7 shows the results of the sensitivity analysis for each lever of the KCERT 2050 tool. This figure shows the emission mitigation potential that can be achieved by each sector by varying each lever individually, level by level, one at a time. However, as already mentioned in the Methods section, the sensitivity analysis does not reflect the impact of varying other levers simultaneously, that is, the systemic effect on the results.
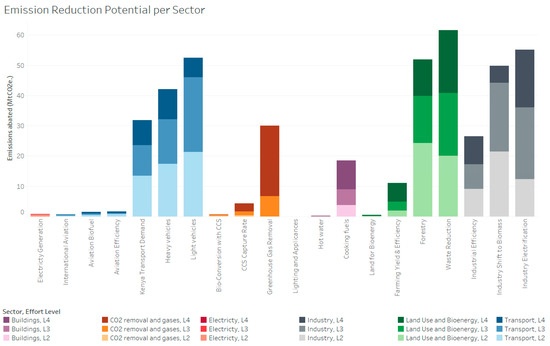
Figure 7.
Sensitivity analysis of KCERT levers. Note: The sectors here are grouped by colour: grey for industries, blue for transport, purple for buildings, green for land use and bioenergy, orange for CO2 removal, and red for electricity generation. The different shades of colour associated with each sector represent the aggregate changes in GHG emission abatement from a moderate level (level 1 to level 2, light shade) to an ambitious effort (level 2 to level 3, medium shade) to a very ambitious effort (level 3 to level 4, dark shade) as implemented by [37].
At a moderate level, the land use and bioenergy sector have the largest GHG abatement potential through the increase in land area under forests and the proper handling of waste, yielding a 50 MtCO2e and a 20 MtCO2e reduction in emissions from forests and waste management efforts, respectively, in 2050. Therefore, based on this estimate, Kenya could reduce its total emissions by 42.9 MtCO2e by the year 2050 (Figure 7).
Waste reduction also has a huge potential for waste mitigation. The country aims to recycle 90% of its waste, which otherwise would have ended up in landfills, in at least 20 urban centres by 2030 [4]. The waste management methods considered are recycling, the energy from waste, methane capture in landfills, power generation from the methane in landfills, composting, and flaring as an alternative for methane capture. However, since not all the waste produced is biodegradable, recycling will be used to cater for inorganic waste material, and whatever cannot be recycled will be deposited into landfills.
However, for energy from waste, only a proportion of the municipal solid waste is biomass-based and, when incinerated, the CO2 emitted is biogenic, while the non-biomass part of the waste will release fossil fuel-based emissions. In 2050, on moderate efforts, KCERT 2050 estimates that approximately 20 MtCO2e could be avoided with increased recycling, power generation from waste, composting, and the conversion to biofuels (Figure 7). This is almost double what Kenya aims to achieve by 2050.
Under the transport sector, emission mitigation levers with the highest impact in terms of emission reduction, were heavy-duty vehicles, light-duty vehicles, and international aviation. For light and heavy vehicles, the mitigation activities considered were around switching from the traditional internal combustion engines in favour of cleaner electric, hybrid, hydrogen, LPG, and biofuel-powered engines, leading to a 24 MtCO2e reduction at level 3 for light vehicles and a 17 MtCO2e reduction at level 2 for heavy vehicles. For behavioural initiatives, measures such as switching from private to public transport, carpooling, switching to non-motorized transport, and reducing the use of air travel were considered to reduce emissions by 13 MtCO2e at ambition level 2.
Focusing on the industry sector, as shown in Figure 7, the GHG emissions are largely reduced by shifting to biomass for industrial heating processes. This shift abates approximately 23 MtCO2e by the year 2050, whereas a shift to electricity and industrial efficiency reduces GHG emissions by 13 MtCO2e and 8 MtCO2e, respectively. Currently, tea processing is performed via the use of woody biomass as fuel. By 2050, as dictated by the net-zero pathway, industries will have a portion of their heating process requirements met using biomass.
Kenya’s demand for power is growing, due to population growth and with no intervention to enhance its non-fossil energy sources, and their proportion may fall. To avoid this, there are ambitious plans to add nuclear power to the base load mix, retire all fossil fuel plants by the year 2047, introduce electricity storage batteries, and use 50% of the biogas produced by biogas plants to generate 50 MW of electricity from waste. From Figure 7, the GHG emission mitigation initiatives for electricity generation by 2050 are nearly zero.
For residential buildings, the emissions abated stem mostly from clean cooking and water heating. The penetration of lighting and appliances, especially air conditioning, is low, thus these have a minimal emission reduction potential. Instead, focus should be placed on improving cooking and water heating methods that have the potential for emission reductions of around 18 MtCO2e and 1 MtCO2e, respectively.
For carbon capture technologies, around 11 MtCO2e emissions will be captured by 2050 (Figure 7). Carbon capture technologies are still under research; thus, their emission reduction potential is far lower than that of forestry and waste reductions.
5. Conclusions and Recommendations
This study presents a comprehensive analysis of Kenya’s emission scenarios and pathways toward achieving a net−zero carbon footprint by 2050 using KCERT 2050. The mitigation efforts highlighted come from both the supply and demand sides. The supply side actions are related to transport, buildings, manufacturing, power generation, and land use, while the demand side actions are related to travel and diet. Examples of supply-side emission abatement measures include power generation from renewable sources, the development of green buildings, energy-efficient product creations in industries using cleaner fuels, and optimal land use for food production, while leaving room for forest expansion. The emission reduction initiatives considered by KCERT 2050 cut across both the supply and demand side since significant emission reductions can only be achieved by ambitious efforts from both sides.
In the BAU scenario, characterized by minimal efforts to mitigate emissions, various sectors contribute to Kenya’s carbon emission profile. The transport sector emerges as the leading emitter by 2050, closely followed by industry, land use, and buildings. Interestingly, the electricity generation sector demonstrates a contrasting trend, with its reliance on renewable sources resulting in relatively low emissions. The energy landscape is dominated by oil as the primary energy source, complemented by geothermal and other fuel types.
On the other hand, the net−zero pathway envisions a significant shift towards ambitious emission reduction strategies such as reductions in transport demand, the adoption of clean cooking, cleaner modes of transportation and electricity and biomass in industrial processes, increases in industrial energy efficiency, forest cover, and improved farming efficiency and waste handling, with the latter through recycling and energy generation from waste.
The sensitivity analysis reveals that land use and waste management hold a significant potential for emission reduction. The land use sector is expected to become a carbon sink, with afforestation and reforestation efforts playing a crucial role in sequestering carbon emissions. However, balancing carbon sequestration efforts with agricultural needs will require sustainable farming practices, increased efficiency, and potentially, technological innovations. Strategies like agroforestry can help reconcile these competing demands.
The transport sector is one of the most challenging sectors to decarbonize, given its heavy reliance on fossil fuels. Initiatives to reduce emissions include the uptake of public transport by developing a Mass Rapid Transit System in Nairobi, Mombasa, and other major cities in the long term; increasing the efficiency of light and heavy vehicles by improving road infrastructure and creating strict vehicle standards, the electrification of the Standard Gauge Railway (SGR); encouraging the adoption of electric-powered vehicles; and promoting sustainable aviation, using SAFs and the use of solar and biodiesel in airport operations, which require heavy investments in the sector but have a significant impact in the reduction of emissions even at moderate ambition levels. Achieving these mobility goals will depend on factors like infrastructure developments, affordability, and behavioural changes. Furthermore, addressing international travel emissions, especially in the aviation sector, remains a challenge due to technological and economic limitations.
In summary, the net-zero pathway for Kenya is an ambitious and necessary endeavour to combat climate change and ensure a sustainable future. While the pathway provides a comprehensive roadmap, realizing its full potential will require continuous dedication and collaboration across all sectors of society. Addressing the questions of resource availability, energy transition, food security, and sustainable mobility will be pivotal in ensuring that Kenya can thrive with net−zero emissions by 2050.
Policies such as non-motorized transport, stringent energy audits for industries, forest restoration, and green electricity generation are captured by both KCERT 2050 and government policy documents such as NCAAP [4] and NDCs [3]. This shows that KCERT 2050 can be used to guide the policy implementation aimed at decarbonizing Kenya with reasonable accuracy. Similar tools in other countries have been used to develop GHG reduction and mitigation polices and regulations. For instance, the Nigeria Energy Calculator 2050 (NECAL 2050) has been used to monitor GHG emissions and establish its NDCs [45,46]. The Mexico 2050 tool has been used to conduct an integrated assessment of energy planning and climate change mitigation in Mexico [37]. Similarly, the Taiwan 2050 calculator has been used to evaluate the effects of energy efficiency improvements on energy demand and the environment [47].
However, the model has several uncertainties due to its broad spectrum, the restricted number of levers and levels, the assumptions involved, database accuracy, and spatial resolution, among other issues. Thus, it must be complemented by detailed models at the sectorial level, for instance, the Markal and Message models in the electricity sector and the GTAP model in the land use sector. There is also the need for KCERT 2050 to be constantly updated with new data. As such, a framework that can upload new data into the model should be developed to ensure that policymakers are making policies based on the most current data. The model could also be upgraded to include new levers and visual dynamics, in line with Kenya’s ambitions and challenges to achieve a net−zero pathway.
Supplementary Materials
The following supporting information can be downloaded at: https://www.mdpi.com/article/10.3390/en16217459/s1, Figure S1. KCERT 2050 Buildings Module logic tree showing the methodology for calculating demand for domestic and non-domestic buildings. Emission Factor CO2 bioenergy solid is zero. For hot water heating KCERT considered 4 major fuels that is wood, solar, electricity and fossil fuel boilers. Where electricity, wood and solar were used for domestic households, while for non-domestic buildings there was the addition of fossil fuels. For the levers, they are aimed at moving non-domestic and domestic households from using wood and fossil fuel-based means of water heating to cleaner fuels that is solar an electricity; Figure S2. Hot water supplied by each technology is calculated by multiplying total demand by the technology demand share. Efficiencies are set for each technology for each input fuel and output demand individually. Energy balance for each technology is calculated based on the heat supplied (activity) and efficiency. Figure S3. Buildings non heat module - cooking fuel share. The cooking fuels considered were LPG, electricity, charcoal, kerosene, wood, bioethanol, biogas, and biomethane for institutions and domestic buildings. For non-domestic buildings, only LPG and electricity were considered. Cooking efficiency was deemed not to have significant room for improvement and therefore has no associated efficiency lever. Figure S4. Buildings non heat module–cooking energy and emissions. Figure S5. Buildings non heat module–non-domestic cooling energy and emissions. Figure S6. Buildings non heat module–non-domestic lighting and appliances energy and emissions. Figure S7. Transport module fuel consumption and emissions calculation summary. Table S1. Levers and Sub-Levers by Sector in KCERT 2050. Table S2. Sector Levers and the levels of ambition for the net−zero emissions pathway. The supplementary material presents the general calculation procedure followed by KCERT 2050 and gives an example with the buildings and transport modules. It is not possible to document the entire energy model in this paper, but the model documentation is available online at https://kcert.ilabafrica.ac.ke/, accessed on 1 July 2023. The lever one-pagers’ descriptions are available by clicking on each selected lever. Table S1 summarises the levers and sub-levers considered by KCERT 2050 while Table S2 describes the net-zero pathway levers and corresponding ambition levels.
Author Contributions
Conceptualisation, J.G., B.M., O.M. and F.M.; methodology, J.G. and B.M.; analysis, J.G., B.M., O.M. and F.M.; software, A.M.; reviewing and editing, J.O., I.P.D.S., A.S. and P.S.; funding acquisition, O.M. All authors have read and agreed to the published version of the manuscript.
Funding
The development of KCERT 2050 was made possible via the UK government’s international 2050 calculator programme, which is funded by the UK’s International Climate Finance, led by Mott MacDonald, and a consortium which includes Imperial College London, Climact and Ricardo. The International 2050 Calculator Programme (“2050 Calculator”) grant code: GB-GOV-13-ICF-0028-2050C.
Data Availability Statement
The data presented in this study are available on request from the corresponding author. The data are not publicly available pending authorisation from the Kenya Ministry of Energy.
Acknowledgments
We would like to acknowledge the Strathmore Energy Research Centre (SERC) and sector leads who lead communities of practice workshops and the data curation and validation during the development of the KCERT 2050 tool. In addition, the authors acknowledge the kind contributions provided by Jaqueline Sophie Edge, David Orr, and Victoria Hoare in proofreading the manuscript.
Conflicts of Interest
The authors declare no conflict of interest.
References
- Kenya National Bureau of Statistics. Economic Survey 2019; Kenya National Bureau of Statistics: Nairobi, Kenya, 2019. Available online: https://www.knbs.or.ke/download/economic-survey-2019/ (accessed on 10 June 2023).
- Climate Analytics and New Climate Institute. Climate Action Tracker. Available online: https://climateactiontracker.org/countries/kenya/ (accessed on 10 August 2023).
- Government of Kenya. Kenya’s Updated Nationally Determined Contribution (NDC) and JCM Activities; Ministry of Environment and Forestry: Nairobi, Kenya, 2021.
- Government of Kenya. National Climate Change Action Plan (Kenya) 2018–2022; Ministry of Environment and Forestry: Nairobi, Kenya, 2018. Available online: https://climate-laws.org/documents/national-climate-change-action-plan-nccap-2018-2022-volume-i_7d48 (accessed on 11 August 2023).
- Kenya Power and Lighting Company. Annual Report and Financial Statements; Kenya Power and Lighting Company: Nairobi, Kenya, 2021. [Google Scholar]
- Kenya Forest Service. National Forest Resources Assessment Report 2021, Kenya; Kenya Forest Service: Nairobi, Kenya, 2021. Available online: http://www.kenyaforestservice.org/national-forest-resources-assesment-report-2021-kenya/ (accessed on 10 August 2022).
- Nyariki, D.M.; Amwata, D.A. The value of pastoralism in Kenya: Application of total economic value approach. Pastoralism 2019, 9, 9. [Google Scholar] [CrossRef]
- Wolz, K.; Leitner, S.; Merbold, L.; Wolf, B.; Mauder, M. Enteric methane emission estimates for Kenyan cattle in a nighttime enclosure using a backward Lagrangian Stochastic dispersion technique. Theor. Appl. Climatol. 2022, 147, 1091–1103. [Google Scholar] [CrossRef]
- Kamer, L. Stock of Cattle in Kenya from 2010 to 2020, Statista. Available online: https://www.statista.com/statistics/1204302/stock-of-cattle-in-kenya/ (accessed on 5 August 2023).
- Mugo, F.; Gathui, T. Biomass Energy Use in Kenya: A Background Paper Prepared for the International Institute for Environment and Development (IIED) for an International ESPA Workshop on Biomass Energy; Practical Action: Nairobi, Kenya, 2010; Available online: https://www.iied.org/sites/default/files/pdfs/migrate/G02985.pdf (accessed on 10 August 2023).
- Ndegwa, G.; Breuer, T.; Hamhaber, J. Woodfuels in Kenya and Rwanda: Powering and driving the economy of the rural areas. Rural 2011, 45, 26–30. [Google Scholar]
- Government of Kenya. Kenya Household Cooking Sector Study; Ministry of Energy: Nairobi, Kenya, 2019.
- Sedano, F.; Lisboa, S.N.; Sahajpal, R.; Duncanson, L.; Ribeiro, N.; Sitoe, A.; Hurtt, G.; Tucker, C.J. The connection between forest degradation and urban energy demand in sub-Saharan Africa: A characterization based on high-resolution remote sensing data. Environ. Res. Lett. 2021, 16, 064020. [Google Scholar] [CrossRef]
- Tiseo, I. Distribution of Carbon Dioxide Emissions Produced by the Transportation Sector Worldwide in 2021, by Subsector, Statista. 2023. Available online: https://www.statista.com/statistics/1185535/transport-carbon-dioxide-emissions-breakdown/ (accessed on 11 August 2023).
- Government of Kenya. Transport Sector Climate Change Annual Report 2019–2020: Performance and Implementation of Climate Change Actions; Ministry of Transport, Infrastructure, Housing, Urban Development and Public Works: Nairobi, Kenya, 2020; Available online: https://changing-transport.org/wp-content/uploads/Kenya-transport-annual-report_Jan-2021.pdf (accessed on 11 July 2023).
- Government of Kenya. Transport Sector Climate Change Annual Report 2018–2019: Performance and Implementation of Climate Change Actions; Ministry of Transport, Infrastructure, Housing, Urban Development and Public Works: Nairobi, Kenya, 2019; Available online: https://www.kcaa.or.ke/sites/default/files/publication/Transport_Sector_Climate_Change_Annual_Report.pdf (accessed on 10 August 2023).
- Medina, L.; Belli, A.; Caroli, G.; DuttaGupta, T.; Tarusarira, J.; Schapendonk, F.; Savelli, A.; Wamukoya, G.; Ogallo, L.; Nying’uro, P.; et al. Towards a Common Vision of Climate Security in Kenya; CGIAR Focus Climate Security: Rome, Italy, 2022. [Google Scholar]
- Ngigi, M.W.; Mueller, U.; Birner, R. Gender differences in climate change adaptation strategies and participation in group-based approaches: An intra-household analysis from rural Kenya. Ecol. Econ. 2017, 138, 99–108. [Google Scholar] [CrossRef]
- Kenya Needs $62bn Bill to Mitigate Climate-Linked Drought and Conflict. The Guardian, 8 January 2021. Available online: https://www.theguardian.com/global-development/2021/jan/08/kenya-faces-62bn-bill-to-mitigate-climate-linked-hunger-drought-and-conflict (accessed on 10 June 2023).
- UN. What Is Net−zero and Why Is It Important? UN News, 2 December 2020. Available online: https://news.un.org/en/story/2020/12/1078612 (accessed on 10 August 2023).
- Celik, S. The effects of climate change on human behaviors. In Environment, Climate, Plant and Vegetation Growth; Springer: Berlin, Germany, 2020; pp. 577–589. [Google Scholar]
- McKay, D.A.A.; Staal, A.; Abrams, J.; Winkelmann, R.; Sakschewski, B.; Loriani, S.; Fetzer, I.; Cornell, S.; Rockström, J.; Lenton, T. Exceeding 1.5 C global warming could trigger multiple climate tipping points. Science 2022, 377, eabn7950. [Google Scholar] [CrossRef]
- Davis, S.; Lewis, N.; Shaner, M.; Aggarwal, S.; Arent, D.; Azevedo, I.; Benson, S.; Bradley, T.H.; Brouwer, J.; Chiang, Y.; et al. Net−Zero emissions energy systems. Science 2018, 360, eaas9793. [Google Scholar] [CrossRef]
- Climate Council. What Does Net Ero Emissions Mean? Climate Council Explainers. Available online: https://www.climatecouncil.org.au/resources/what-does-net-zero-emissions-mean/ (accessed on 10 August 2023).
- The Climate Change Act of 2016. 2016, Volume 11. Available online: http://kenyalaw.org:8181/exist/rest//db/kenyalex/Kenya/Legislation/English/Acts%20and%20Regulations/C/Climate%20Change%20Act%20-%20No.%2011%20of%202016/docs/ClimateChangeAct11of2016.pdf (accessed on 5 June 2023).
- Government of Kenya. Kenya’s Intended Nationally Determined Contribution (INDC); Ministry of Environment and Natural Resources: Nairobi, Kenya, 2015. Available online: https://www4.unfccc.int/sites/submissions/INDC/Published%20Documents/Kenya/1/Kenya_INDC_20150723.pdf (accessed on 10 August 2023).
- Chesterman, S.; Neely, C. Evidence and Policy Implications of Climate-Smart Agriculture in Kenya; CCAFS Working Paper, No. 90; CGIAR Research Program on Climate Change, Agriculture and Food Security (CCAFS): Copenhagen, Denmark, 2015; Available online: https://hdl.handle.net/10568/65098 (accessed on 8 June 2023).
- Climate and Clean Air Coalition. Kenya Aims to Reduce Livestock Methane Emissions without Sacrificing Productivity. Available online: https://www.ccacoalition.org/news/kenya-aims-reduce-livestock-methane-emissions-without-sacrificing-productivity (accessed on 10 August 2023).
- Strapasson, A.; Oduor, C.; Domeniconi, B. Livestock production. In Life Cycle Assessment: A Metric for the Circular Economy; Royal Society of Chemistry: London, UK, 2021; pp. 290–316. [Google Scholar]
- Taeger, N. Four Years of Advancing Climate Strategies in Kenya’s Transport Sector. Changing Transport. Available online: https://changing-transport.org/four-years-of-advancing-climate-strategies-in-kenyas-transport-sector/ (accessed on 10 August 2023).
- Koinange, C. NMT Strategy for Kenya; UN Environment: Nairobi, Kenya, 2017. [Google Scholar]
- Kenya Civil Aviation Authority. Action Plan for CO2 Emissions Reduction in the Aviation Sector 2022–2028; Kenya Civil Aviation Authority: Nairobi, Kenya, 2022. [Google Scholar]
- Faculty of Natural Sciences, Imperial College London. Completed Calculators. Available online: https://www.imperial.ac.uk/2050-calculator/completed-calculators/ (accessed on 19 July 2023).
- How to Build a 2050 Calculator: A Guide. 2023. Available online: https://www.imperial.ac.uk/media/imperial-college/faculty-of-natural-sciences/centre-for-environmental-policy/2050-calculator/public/How-to-build-a-Calculator-Guide_website.pdf (accessed on 31 August 2023).
- Strapasson, A.; Woods, J.; Pérez-Cirera, V.; Elizondo, A.; Cruz-Cano, D.; Pestiaux, J.; Cornet, M.; Chaturvedi, R. Modelling carbon mitigation pathways by 2050: Insights from the Global Calculator. Energy Strategy Rev. 2020, 29, 100494. [Google Scholar] [CrossRef]
- Strapasson, A.; Mwabonje, O.; Woods, J.; Baudry, G. Pathways towards a Fair and Just Net-Zero Emissions Europe by 2050: Insights from the EUCalc for Carbon Mitigation Strategies; EUCalc Policy Brief No. 9; 2020; 53p. Available online: https://www.european-calculator.eu/wp-content/uploads/2020/04/EUCalc-PB9_Pathways-towards-a-fair-and-just-net-zero-emissions-Europe-by-2050.pdf (accessed on 1 June 2022).
- Elizondo, A.; Pérez-Cirera, V.; Strapasson, A.; Fernández, J.C.; Cruz-Cano, D. Mexico’s low carbon futures: An integrated assessment for energy planning and climate change mitigation by 2050. Futures 2017, 93, 14–26. [Google Scholar] [CrossRef]
- Strapasson, A.B.; Werneck, M.T. Energy efficiency and heat generation an integrated analysis of the Brazilian energy mix. Int. Energy J. 2007, 8, 171–180. [Google Scholar]
- Tharani, A.; Arrumm, M.; Kimanzi, E.; Mutemi, J. Kenya: The Road to COP27—Actions Towards a Greener Future for Kenya—Bowmans. Available online: https://bowmanslaw.com/insights/mergers-and-acquisitions/kenya-the-road-to-cop27-actions-towards-a-greener-future-for-kenya/ (accessed on 27 October 2023).
- Government of Kenya. National Sustainable Waste Management Policy; Ministry of Environment and Forestry: Nairobi, Kenya, 2021. Available online: https://www.environment.go.ke/wp-content/uploads/2023/03/SWM_Policy_2021_final_copy.pdf (accessed on 12 August 2023).
- Government of Kenya. The National Forest Reference Level for REDD+ Implementation; Ministry of Environment and Forestry: Nairobi, Kenya, 2019. Available online: https://redd.unfccc.int/files/national_frl_report_for_redd__in_kenya.pdf (accessed on 10 August 2022).
- Government of Kenya. Least Cost Power Development Plan 2021–2030; Ministry of Energy: Nairobi, Kenya, 2021. Available online: https://communications.bowmanslaw.com/REACTION/emsdocuments/LCPD%202021.pdf (accessed on 11 August 2023).
- Wansi, B.-I. A Waste-to-Energy Plant Will Be Built in Kericho. Afrik21. Available online: https://www.afrik21.africa/en/kenya-a-waste-to-energy-plant-will-be-built-in-kericho/ (accessed on 10 August 2023).
- Power Technology. Power Plant Profile: Dandora Waste to Energy Plant, Kenya. Available online: https://www.power-technology.com/marketdata/power-plant-profile-dandora-waste-to-energy-plant-kenya/ (accessed on 10 August 2022).
- Dioha, M.O.; Emodi, N.V.; Dioha, E.C. Pathways for low carbon Nigeria in 2050 by using NECAL2050. Renew. Energy Focus 2019, 29, 63–77. [Google Scholar] [CrossRef]
- Nkechi, I. Nigeria Can Use NECAL 2050 Calculator to Deepen Its NDCs—Bala; Science, Abuja, Nigeria: Abuja, Nigeria, 2021. [Google Scholar]
- Wu, Y.-H.; Liu, C.-H.; Hung, M.-L.; Liu, T.-Y.; Masui, T. Sectoral energy efficiency improvements in Taiwan: Evaluations using a hybrid of top-down and bottom-up models. Energy Policy 2019, 132, 1241–1255. [Google Scholar] [CrossRef]

Disclaimer/Publisher’s Note: The statements, opinions and data contained in all publications are solely those of the individual author(s) and contributor(s) and not of MDPI and/or the editor(s). MDPI and/or the editor(s) disclaim responsibility for any injury to people or property resulting from any ideas, methods, instructions or products referred to in the content. |
© 2023 by the authors. Licensee MDPI, Basel, Switzerland. This article is an open access article distributed under the terms and conditions of the Creative Commons Attribution (CC BY) license (https://creativecommons.org/licenses/by/4.0/).