Abstract
Low-power photovoltaic distributed generators are increasing rapidly in number by the grids of the modern era, but they also bring up the concern of grid stability. To maintain grid stability, it is essential for the network operators to update the grid codes at regular intervals due to the case of highly penetrated grid-connected photovoltaic systems (GCPVs). Integration of large-scale electrical grids with renewable energy sources, one being photovoltaic systems, faces the challenge of riding through low-voltage (LVRT) phases. As compared to the previous grid codes for power generation, recent advances require distributed generation resources to provide for such capabilities under grid faults. This work contributes to the ongoing investigation of this specified and destabilizing fault condition. Various simulations of a PV microgrid system are carried out with the ability to ride through low-voltage faults, with the help of a DC-chopper circuit to absorb DC-link over-voltage, and the current is also maintained within acceptable limits according to the required standards. The fundamental contribution of this research is a proposed neural network (NN) control framework. This framework effectively detects voltage sags, comprehends their characteristics, and provides support to the system by injecting reactive current in accordance with the demands imposed by designated grid codes. This NN control model has been systematically developed utilizing data gathered from a vast array of testing simulations conducted under different and dynamic conditions. The proposed strategy, on the other hand, is compared with the RMS fault detection method in combination with the conventional LVRT algorithm. The NN control approach showed better results as compared to the conventional methods in terms of accuracy and robustness, especially when confronted with difficult sag situations.
1. Introduction
In the past decade or so, grid systems with distributed generation (DG) units like the photovoltaic (PV) have increased in number tremendously. This ever-increasing number is due to the fact that these integrated systems have low energy generation costs, low carbon emissions, and high reliability. PV systems preferably work in a specified voltage range to keep the entire microgrid stable and operating in normal conditions. However, due to the spasmodic nature of power generation by PV systems, the normal working of the microgrid is possibly affected [1]. Because of this, operators of such networks have to create and update the grid codes to keep the system stable. The most essential requirement of these grid codes is the process of LVRT of the PV microgrid [2]. LVRT is basically an act of control that keeps the PV power generator connected to the utility grid during a short-term voltage sag in the grid voltage. In normal operation mode, PV operates on the maximum power point (MPP) value and injects real power to the grid. However, in the case of LVRT, PV power systems have to inject reactive power in the grid for stabilizing it [3].
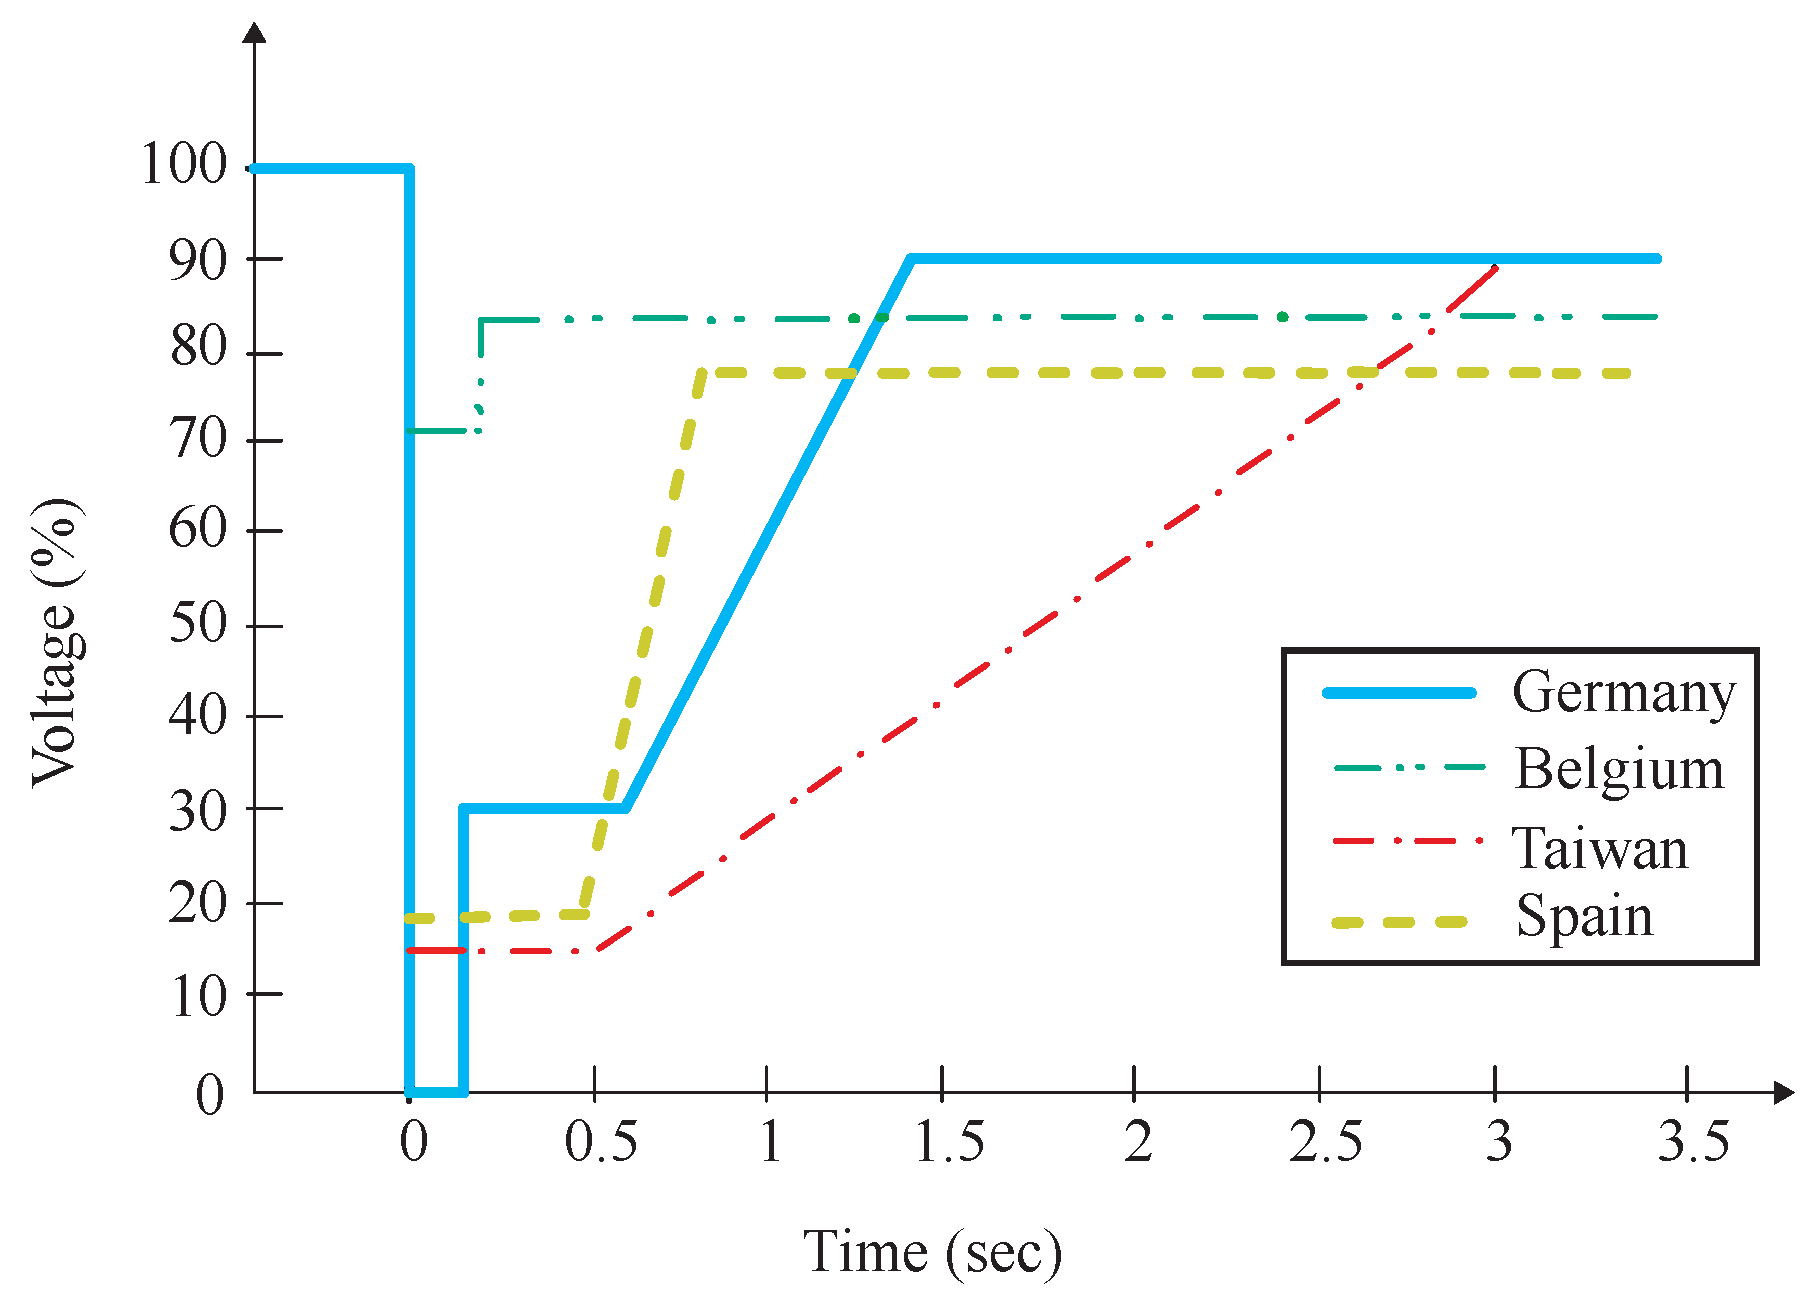
Voltage versus time characteristics provide the necessary description of the LVRT requirements. It is essentially the minimum time period for which a system can withstand the specific level of voltage sag. The minimum time that a system stays connected with the utility under voltage sag situations for some countries according to their grid codes is shown in Figure 1. To describe LVRT characteristics in a better and easy way, taking into account the German grid codes, the PV system should perform the ride through process from the fault of even zero voltage (100% voltage sag) for at least 0.15 s before isolating from the utility. For Taiwan and Spain, the minimum limit according to their grid codes is 0.5 s for voltage sags of 85% and 80%, respectively [2] (for this work, we take into consideration the grid code requirements specified for Germany). LVRT is an important requirement for the system to work properly and to provide for the loads without any interruptions. In a fault case, if multiple generating units disconnect, it would cause a breakdown of the system, which may eventually lead to a blackout.
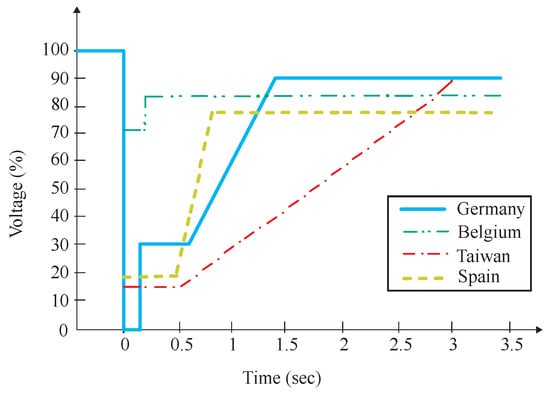
Figure 1.
LVRT time span of various grid codes.
In our work, the state of weak grid is also addressed as it is well-known that the inertia of a grid is dependent on the synchronously rotating generators present in the grid system [4]. Because our designed system is made up of renewable energy sources (PV, battery) that lack synchronous rotating generators, the grid is already in a weak inertial state. Two of the other major issues addressed during the voltage ride through are DC-link over-voltage and the injection of reactive power, which is an efficient way to support the grid and a good solution for voltage recovery to overcome voltage sag faults.
Various publications have focused on decreasing the DC-link over-voltage along with limiting the current amplitude of the PV inverter for protection of inverters undergoing voltage sags. The DC-link adaptive voltage control method was applied in [5] for PV inverters for quality improvement in output waveform. This control, by a variable DC-link setting of voltage, accomplished the limiting of DC-link over-voltage. In [6], the author proposed another control strategy that performed well to control over-current and also the DC-link over-voltage during the faults. A proportional-resonant (PR) current controller was implemented in [7] for the limitation of over-current, and it also provided good sinusoidal output waveform. However, all the above cited articles did not talk about the idea of injection of reactive power for the support of the grid under conditions of fault.
Identifying voltage sag events effectively is an important part of low-voltage ride through capability. Some of the recent methods for detecting voltage dips reported in the literature are the peak value detection method [8], droop-control method [9], and missing voltage method [10]. Best amongst the recently introduced methods is the root mean square (RMS) method [11]. The RMS detection method for voltage sag monitors the () grid voltage component’s RMS value at the phase-locked loop (PLL) stage. This technique calculates the grid voltage () at present time.
Taking into account the dynamical support of voltage (the reactive power injection), various techniques have been deployed for the betterment of the capability for microgrids to ride through the sag faults. Some of these involve the use of specialized devices, such as active crowbar systems, storage energy systems [12], flexible AC transmissions system devices (FACTS), brake choppers [13], dynamic-voltage restorers (DVR), and fault-current limiters (FCL) [14]. With a DVR, a control design of two stages for the reactive power insertion into the grid and voltage sag compensation was proposed in [15]. A combination of a supercapacitor storage energy system and a static synchronous compensator (STATCOM) is proposed in [16] for the enhancement of LVRT capability. These external devices play a significant role in the maintenance and stabilization of the microgrid system under voltage faults. However, they increase the overall cost and complexity of the system. Hence, more efforts for improvement with minimum cost are directed towards the modifications in the control algorithms or procedures. Recently, a current saturation strategy (CSS) [17] was introduced that showed improved results of riding through low voltage in grid-forming inverters. An improved particle swarm optimization (PSO) [18]-based method has also been utilized for the effective operation of LVRT in high-power applications. Advanced networks, including NN processing, are also used for optimal control of grids under dynamic conditions, and they have proved quite effective in the process. The authors in [19] presented the integration of NN controls with the conventional methods, enhancing the behavior of the grid under practical conditions, providing new ways forward for optimal control of power systems.
The primary contributions of this article encompass two key features enabled by the designed NN control model.
- The NN control model effectively processes grid voltage data to accurately detect voltage sags and extract their distinctive characteristics. This initial feature ensures a comprehensive understanding of sag events.
- Subsequently, the NN model leverages this sag information to provide vital grid support through the precise injection of reactive current in compliance with grid code stipulations.
The article extensively examines and validates these dual functionalities of the proposed NN control model through comprehensive testing, offering a comparative analysis against conventional methods.
The arrangement of the paper is in a way that Section 2 describes the designed system with its configurations. The ability of riding through voltages of low value of the microgrid system is elaborated in Section 3. Section 4 provides details about the proposed NN control model. The simulation results obtained through testing are explained in Section 5. Finally, conclusions are drawn in Section 6.
2. System Configuration and Modelling
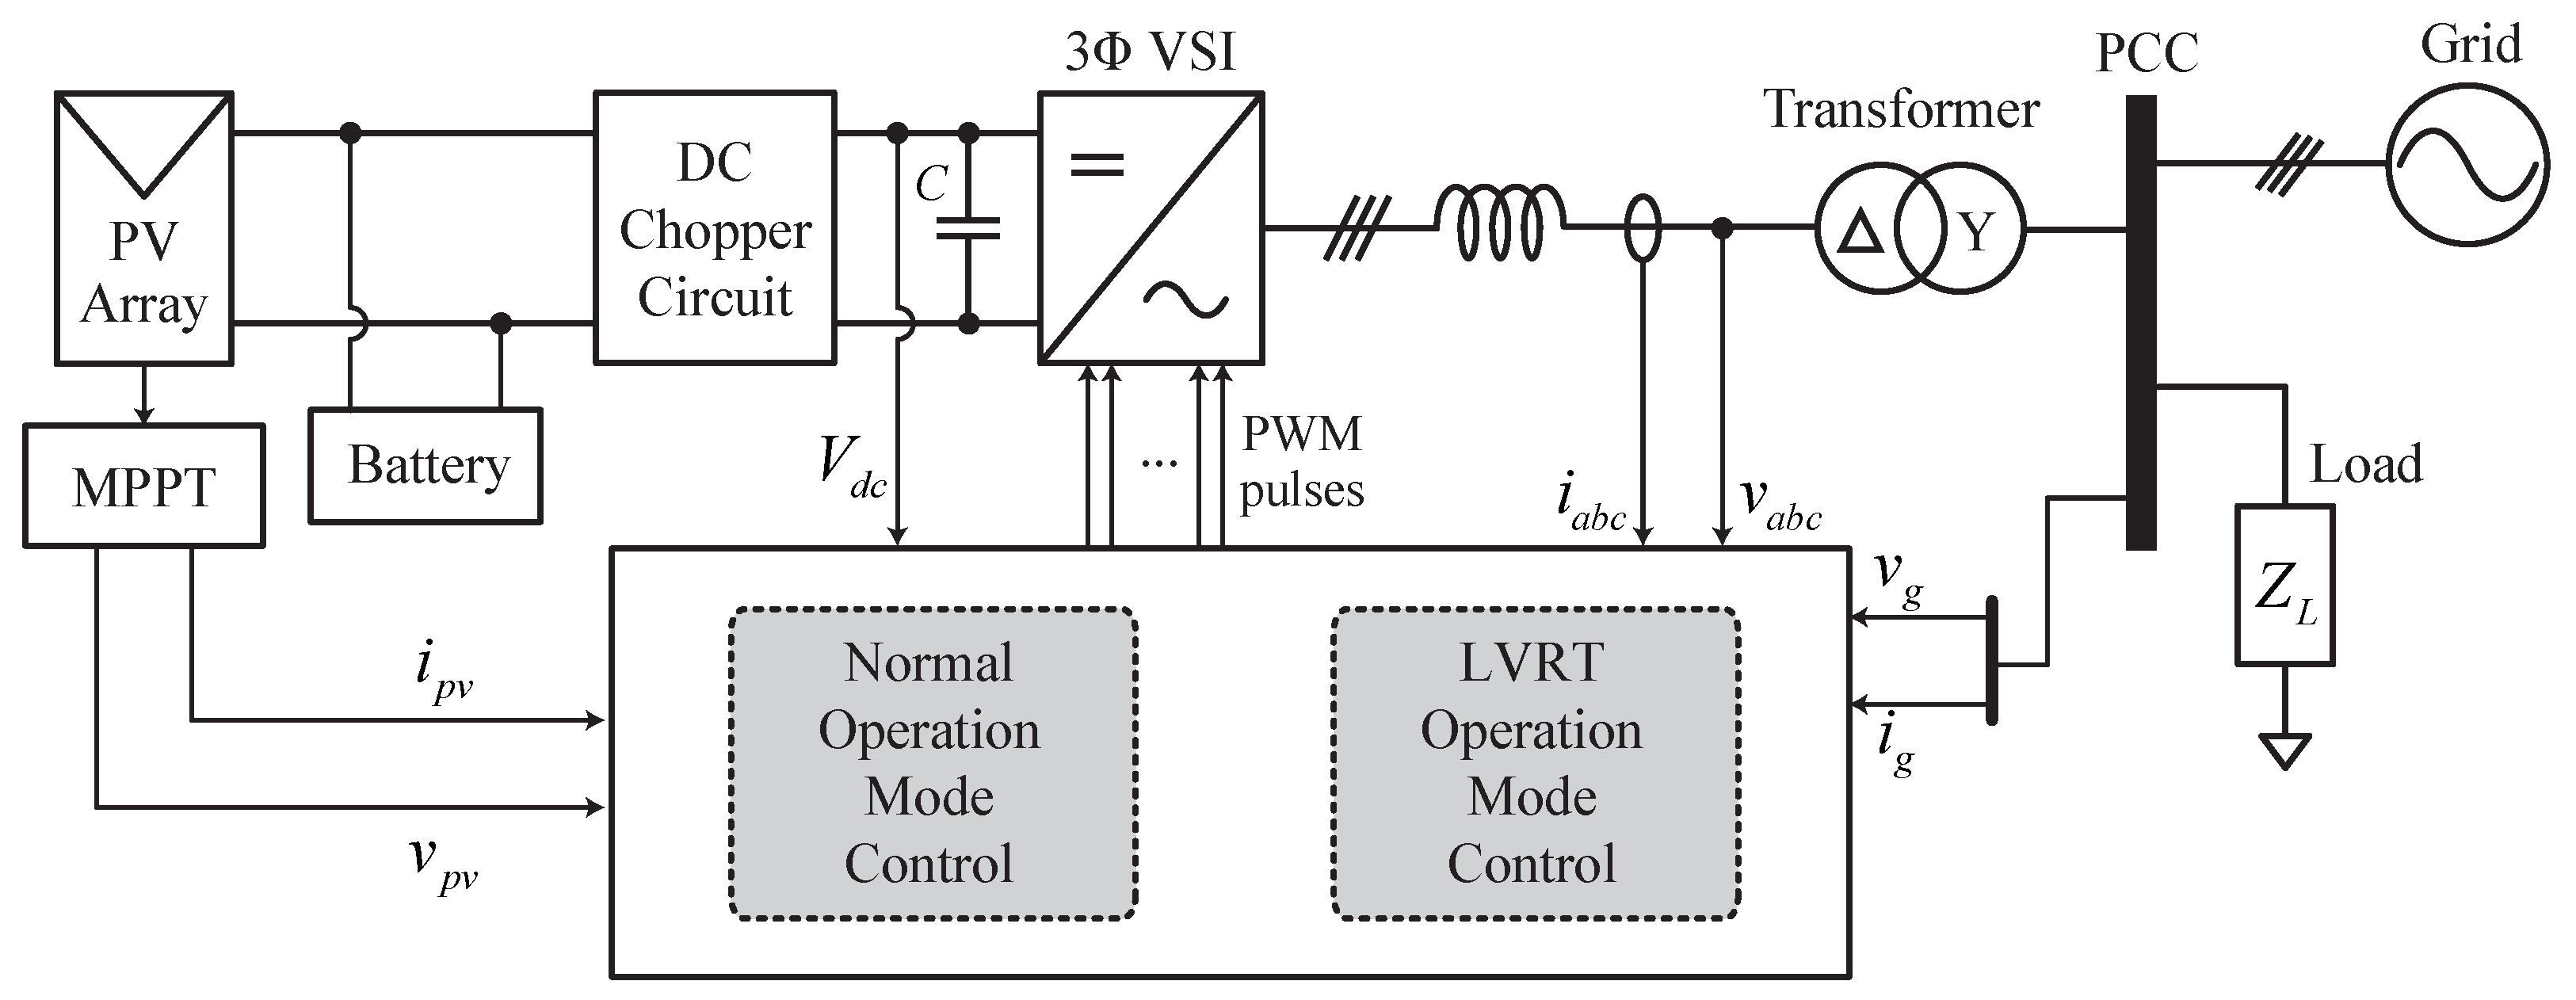
The PV microgrid system designed in this paper is represented in Figure 2. The system is made up of a PV array with a technique of tracking power point of maximum value, controlled by perturb & observe (P&O) method, with the help of a boost converter connected to a battery system. A DC-chopper circuit also installed to absorb any over-voltage at the DC-link stage. A voltage source inverter (VSI) [20] of three phases is connected to a filter attached to the low-voltage side of a step-up transformer as shown. The side with medium voltage of transformer is connected to the utility grid.
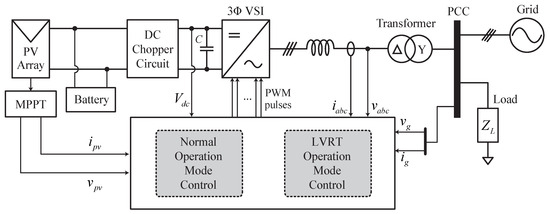
Figure 2.
System configuration of PV microgrid.
2.1. PV Module’s Equivalent Circuit
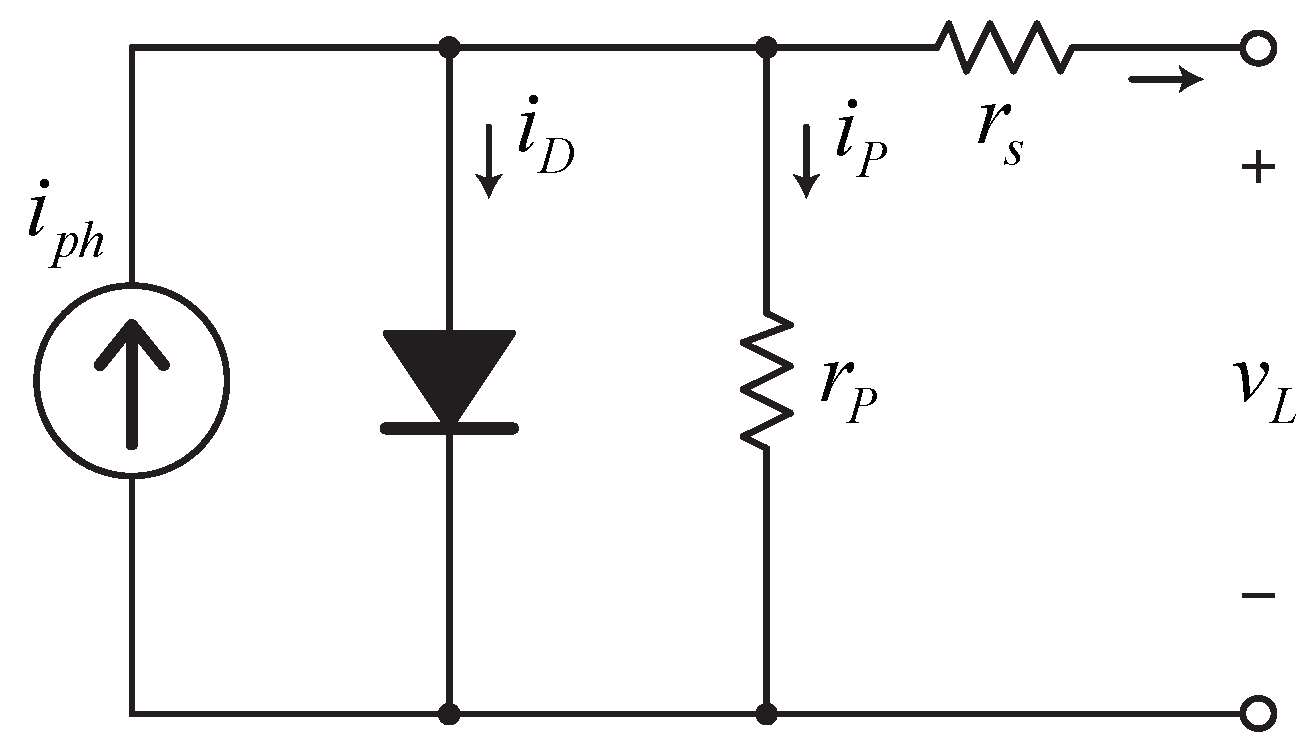
The equivalent circuit of a photovoltaic module with several solar cells is illustrated in Figure 3.
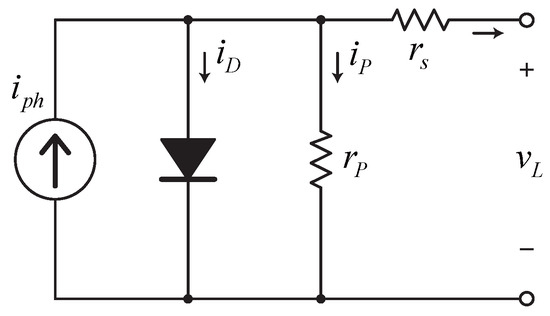
Figure 3.
Equivalent PV cell circuit.
Equations given in [21] describe the relationship between a PV module’s output current and voltage, where and represent the module’s photocurrent and reverse saturation current, respectively. m stands for the diode factor in ideal state, k for the Boltzman constant, q for the electron charge, and , for the module’s equivalent parallel and series resistance, respectively.
The parameters applied for the evaluation of the PV module can also be taken for the equivalent circuit and the calculations as given by Equations (2)–(4) for the general value of temperature () and irradiation (). For any value of temperature and irradiation, can be calculated by the equations taken from [21,22], where is the short-circuit current of nominal value. G and represent the actual and the nominal irradiance, with T being the temperature of PV module in kelvins, whereas is the coefficient of current–temperature.
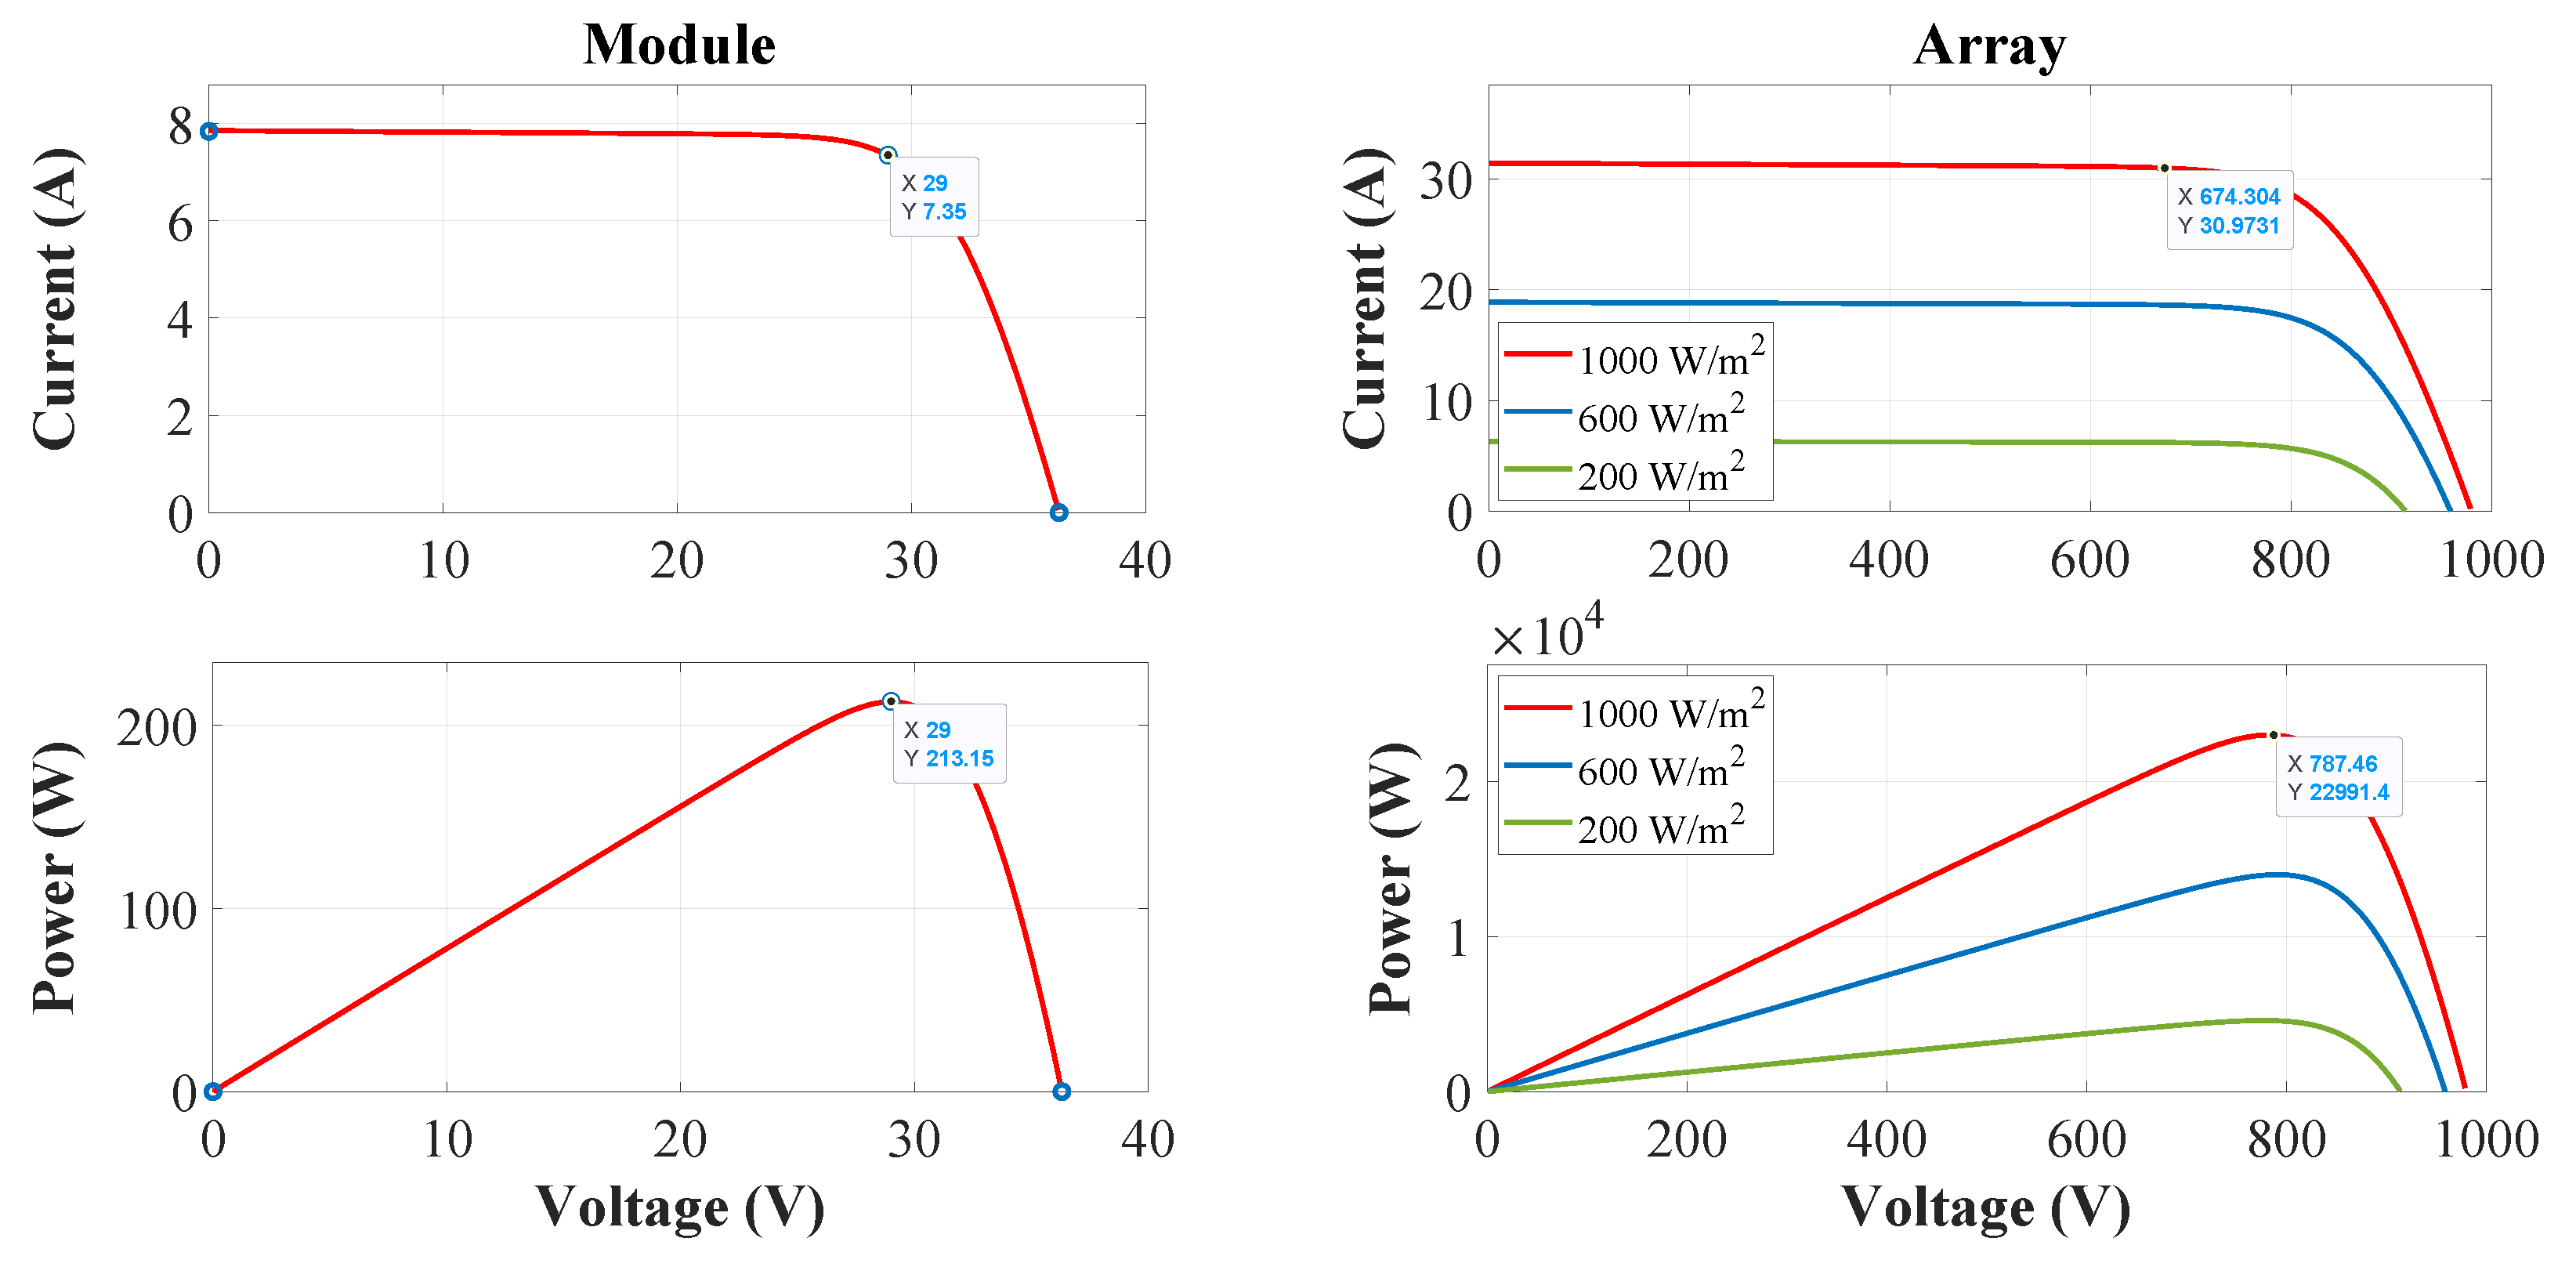
Power with current characteristics across the voltage of the PV module with a standard = 25 C and = 1000 W/m designed in this paper generated in Simulink are presented in Figure 4.
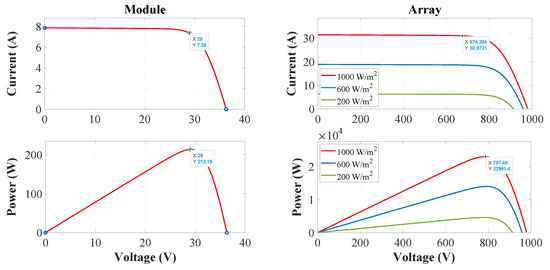
Figure 4.
Power and current characteristics across voltage of PV system.
2.2. Size of PV Array and MPPT
For modeling the PV microgrid system, values of parameters given in Table 1 are selected for each PV module that is distributed as 235 parallel strings of 16 modules. With described parameters, the calculations of an accumulative PV system can be described as in Matlab/Simulink as presented in Figure 4.

Table 1.
PV module parameters.
As for the maximum power point tracking (MPPT), several different techniques have been established [23,24]. However, considering simplicity and feasibility, P & O technique is used most widely. This algorithm is best explained in [22,24]. The function of this algorithm is to obtain the maximum value of power possible from the PV array by tracking the maximum voltage and current of the module with regard to the change in temperature and irradiation.
2.3. Control Strategy for Microgrid System
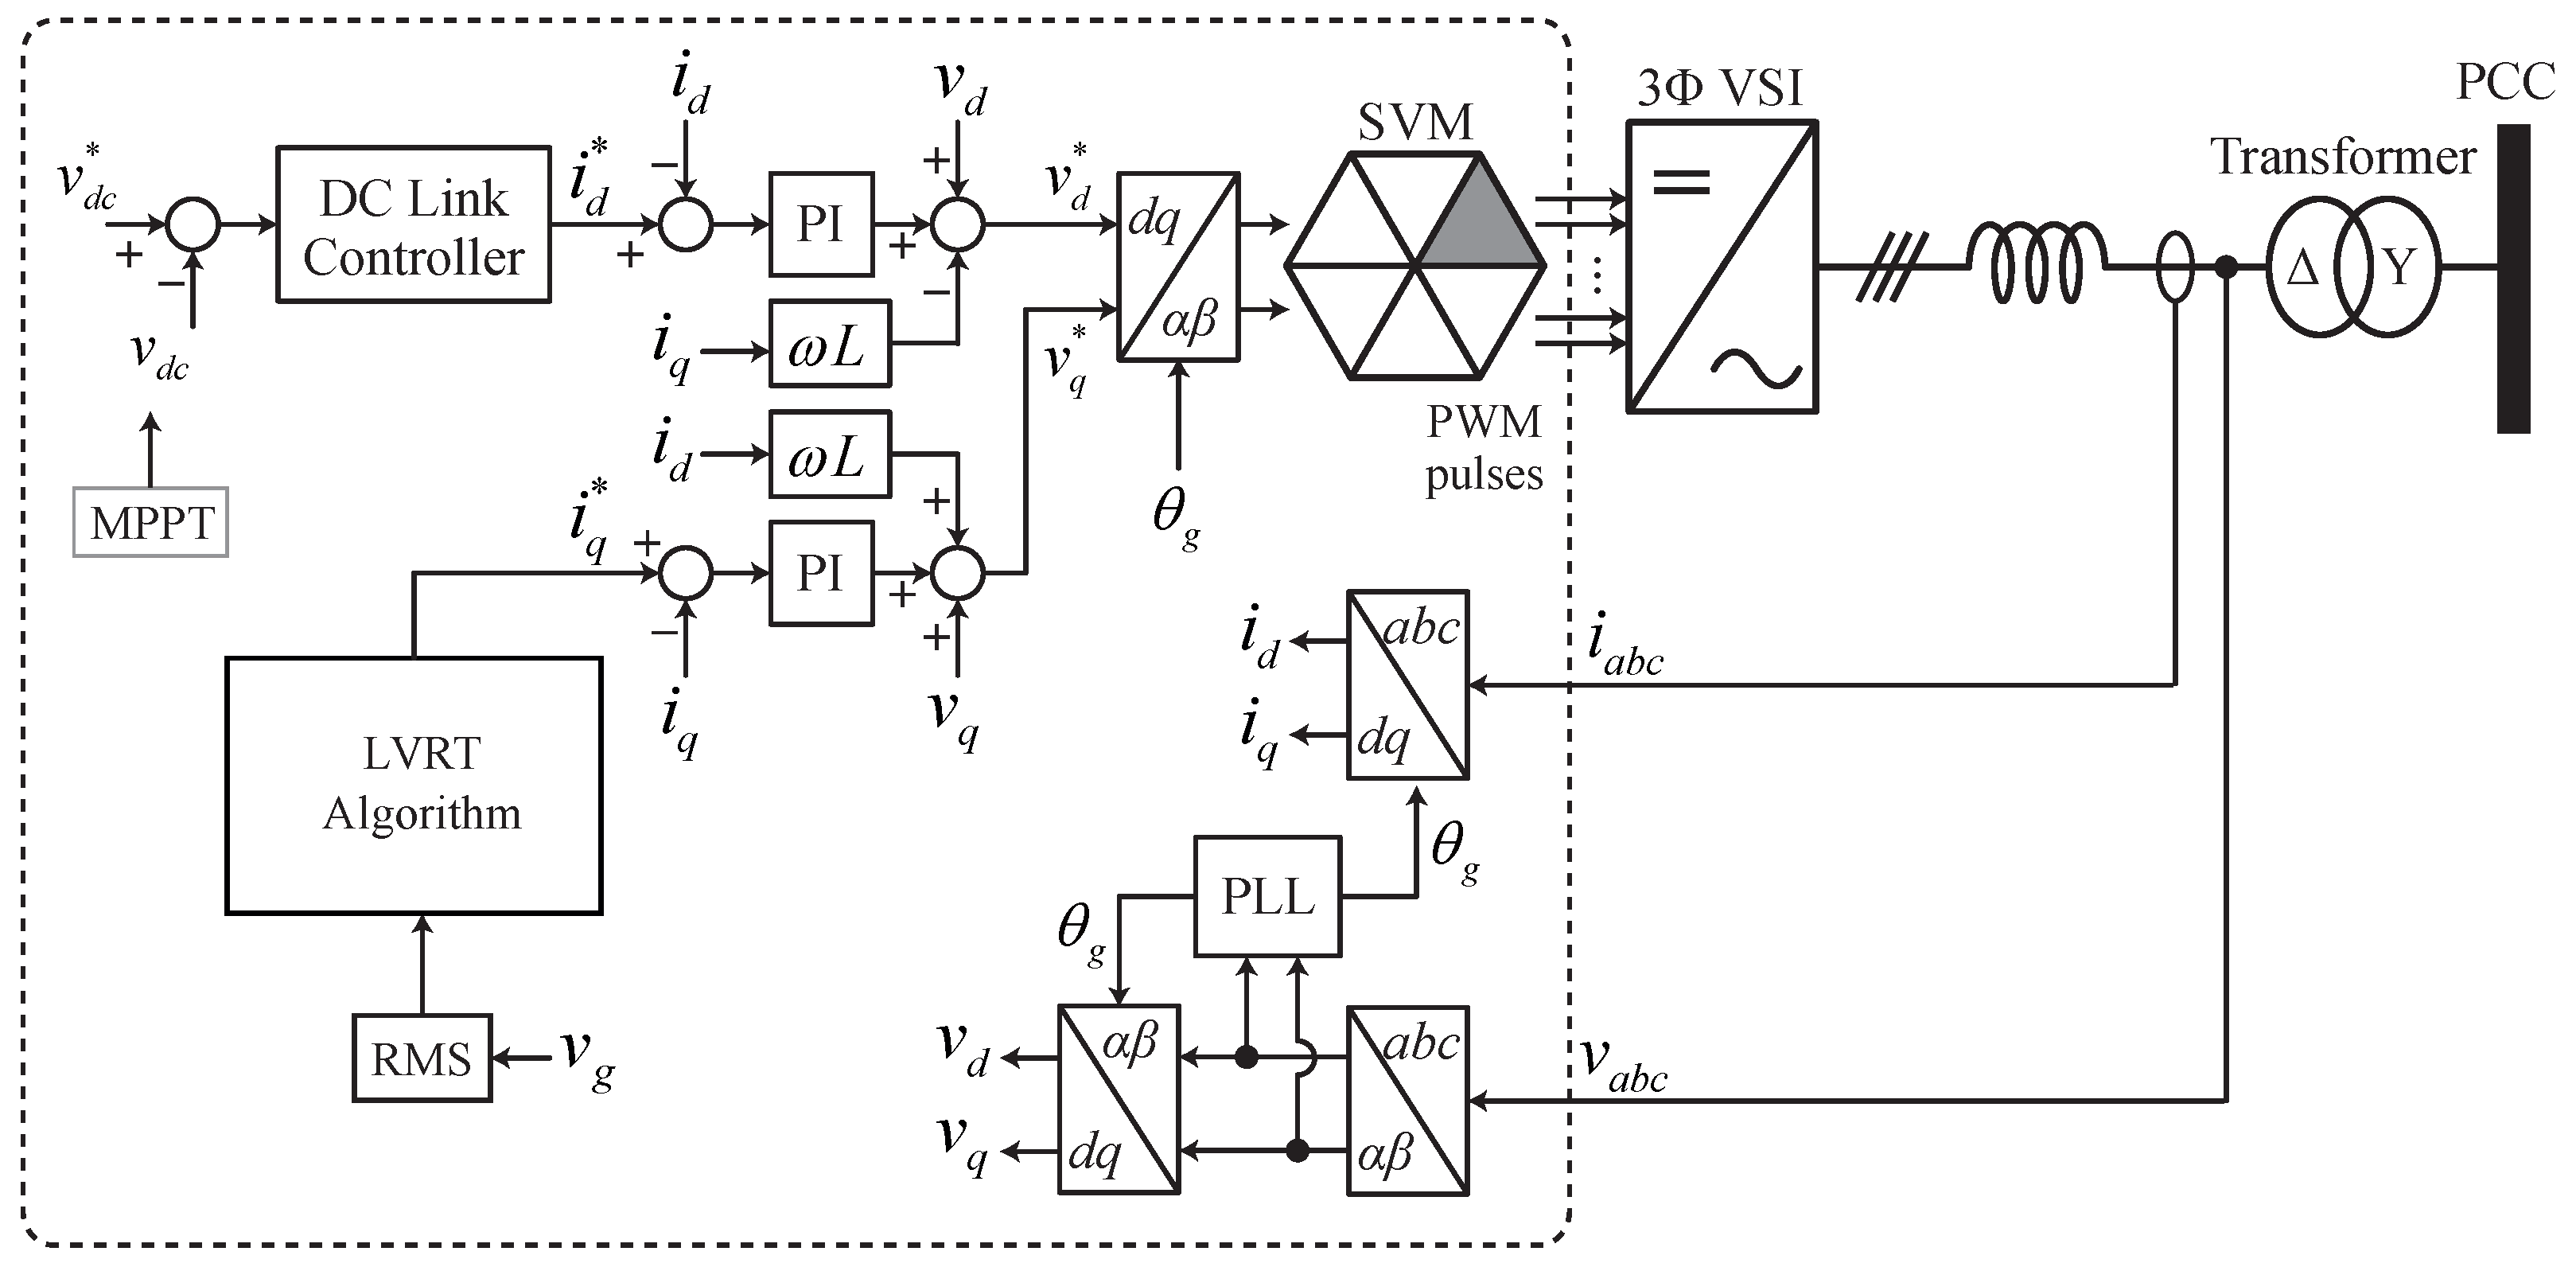
The conventional control method designed in this work can be observed in Figure 5. It is a three-phase (two-stage) grid-connected PV system. DC to DC converter is the first stage, which minimizes effects of shading, to a great extent, by enhancing the performance of PV array, and three-phase VSI (DC/AC converter) makes the 2nd stage of this control system.
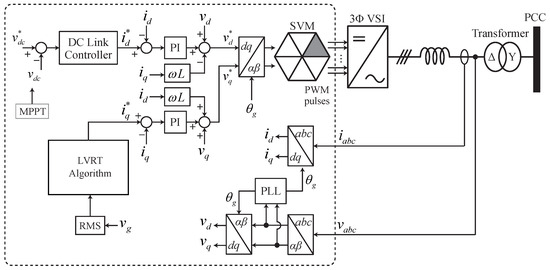
Figure 5.
PV microgrid system’s control structure.
So, the conventional control system is divided into two parts as discussed above, those being the inverter control and boost converter control. The composition of this three-phase DC/AC inverter involves DC-link voltage feedback PI controller with a power balance controller, a phase-locked loop (PLL) containing transformation module, proportional integral [25] (PI) regulators, and also coordinate DQ transformations.
2.3.1. DC Boost Converter Control
A DC boost converter’s primary purpose is typically to maximize output of the PV panels, which is often changed by variations in temperature and the quantity of irradiation. The use of the MPPT algorithm plays its role in this part of the control.
During the normal operation mode of the microgrid, the MPPT algorithm, together with the help of a proportional integral controller, utilizes the boost converter for the tracking of expected maximum power point in the process.
2.3.2. Control of the VSI
For this control, a constant predefined value is compared with the voltage at DC-link and passed from a PI controller to obtain a compensated reference value of current. This is basically the outer loop of the control. So, it is clear that the reference value of real current is taken from the voltage loop output, whereas, on the other hand, the reference value of reactive current is taken from LVRT algorithm, which in normal operation mode is set to zero.
For inner control loop, a current controller injects the current quality from that reference current value. There is some advanced work also being conducted for better performance of current controller based on model predictive control [26] that has better efficiency. Here, because of the fact that the implementation of a three-phase PV system can be completed in a reference frame that is synchronously rotating, also known as DQ-control, regulation of the injected current using an orthogonal signal generator is possible through a PI controller, as depicted in Figure 5. So, the injected grid current is in synchronism with the grid voltage utilizing a PLL.
For the process of simplification of each current control and , a decoupling strategy (feed-forward) is used to decouple them [27]. Some important parameters for this grid-connected inverter system are given in Table 2. As said earlier, a synchronous reference frame phase-locked loop (SRF-PLL) is utilized for the synchronization of phase angle and voltage of grid. This SRF-PLL generates , which is used for the transformation from abc to dq0.
Table 2.
System parameters.
Voltage equations for grid inverter passing through the filter can be given as follows:
where () indicate inverter voltage, whereas () and () denote inverter current and grid voltage, respectively. In dq reference frame, after the transformation, equations are
With the idea that, in normal operation mode, system works at power factor of unity [27], losses can be ignored. So, for real and reactive power calculation, the equations are given as above.
3. Ability of Low-Voltage Ride Through (LVRT)
Being sensitive to voltage changes or disturbances is one of the major drawbacks of VSI. For example, a sudden decline in voltage of the grid will cause an increment in the current value as part of control for keeping the DC-link voltage at constant level. As it is, most of the dips in voltage are due to the propagation of unbalanced faults in the grid. The undesirable power oscillations brought on by these unbalanced voltages have a significant impact on regulation of DC-link voltage. This causes the converter to trip for avoiding any kind of damage to the equipment that may occur by DC over-voltage.
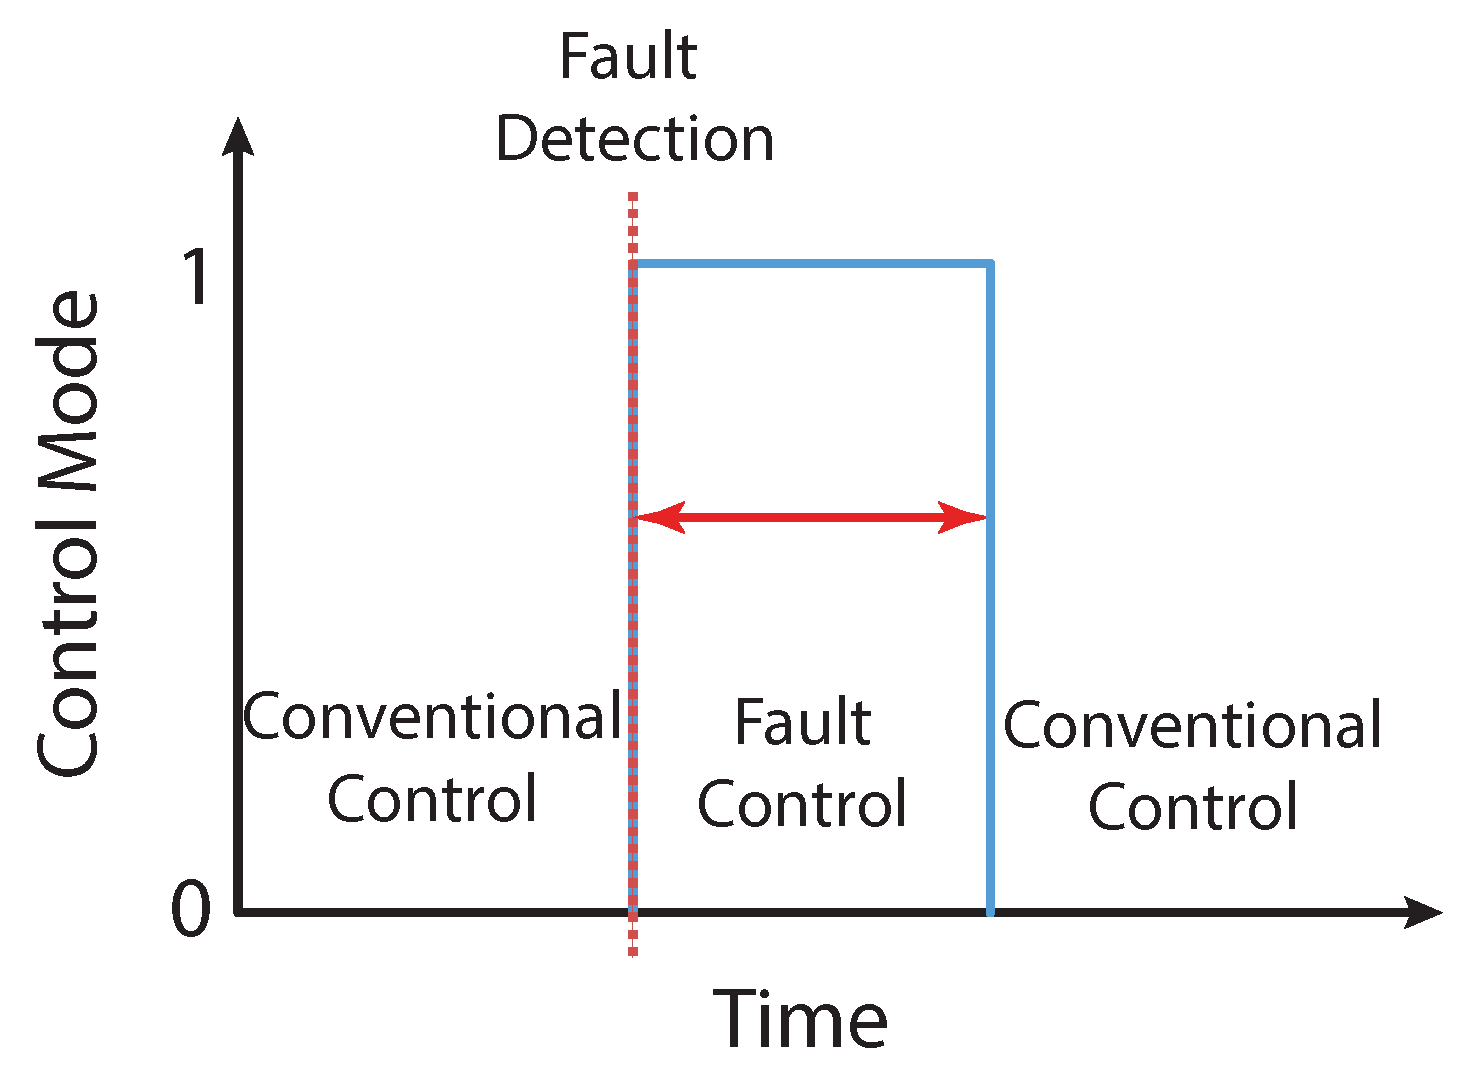
Because of the fault, the power recieved by the grid and the power coming from the PV system are not balanced. As discussed earlier, this leads to over-voltage at the DC side and excessive AC side current [28]. Now, for the protection of electronic devices from undesired value of current and over-voltage, the technique of control comprising the circuit of a DC-chopper and fault-current limiter is utilized. The designed control also helps support voltage recovery during the fault time with the reactive power insertion according to the sag level. A simplified scheme showing the change in control modes is given in Figure 6. When a defect is discovered, the value changes from 0 to 1, indicating the normal or conventional mode of control, and then the fault control mode is turned on. Fault control mode runs for a specific time period, and, after that, the conventional control mode kicks back in. After the sag is recognized, it is observed that the chopper circuit activates to use the insufficient energy, and the current limiter regulates the aberrant current [28]. These processes keep the microgrid system in a normal state and save the power electronics equipment through the fault event.
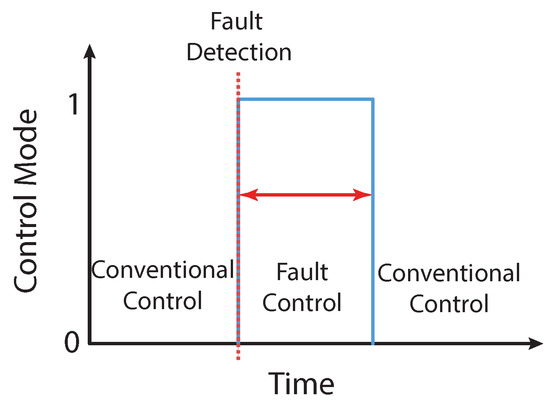
Figure 6.
Basic scheme of control mode.
3.1. Method of Fault Detection
The most crucial role of the LVRT control is the instant switch from normal operation mode to grid fault operation mode. Hence, it is essential to equip a fast and accurate fault detection device or method. Some of the fault detection methods identified in recent years include the droop-control method [9], missing voltage method [10], and peak value detection method [8]. Root mean square (RMS) [11] method of fault detection has proven to be much effective and most widely used method in recent years.
RMS detection method for voltage sags monitors the () grid voltage component’s RMS value at the PLL stage. This technique calculates the grid voltage at present time () using the following equation:
here, , are d and q components of the voltage of the grid, respectively.
3.2. Control of DC Over-Voltage
The electricity provided to the electric grid under a fault is significantly less than the power being produced by the PV array. This causes the accumulation of high voltage at the DC-link. The increase in DC-link voltage makes the MPP move down in the direction of open circuit voltage (), causing a decrease in the array output current. This deviation in MPP during a fault event may also cause a delay in time for the values of PV current, PV voltage, and voltage at the DC-link point to come back to normal upon the clearance of the fault. To prevent this problem of over-voltage, a DC-chopper circuit [29] is utilized for this system.
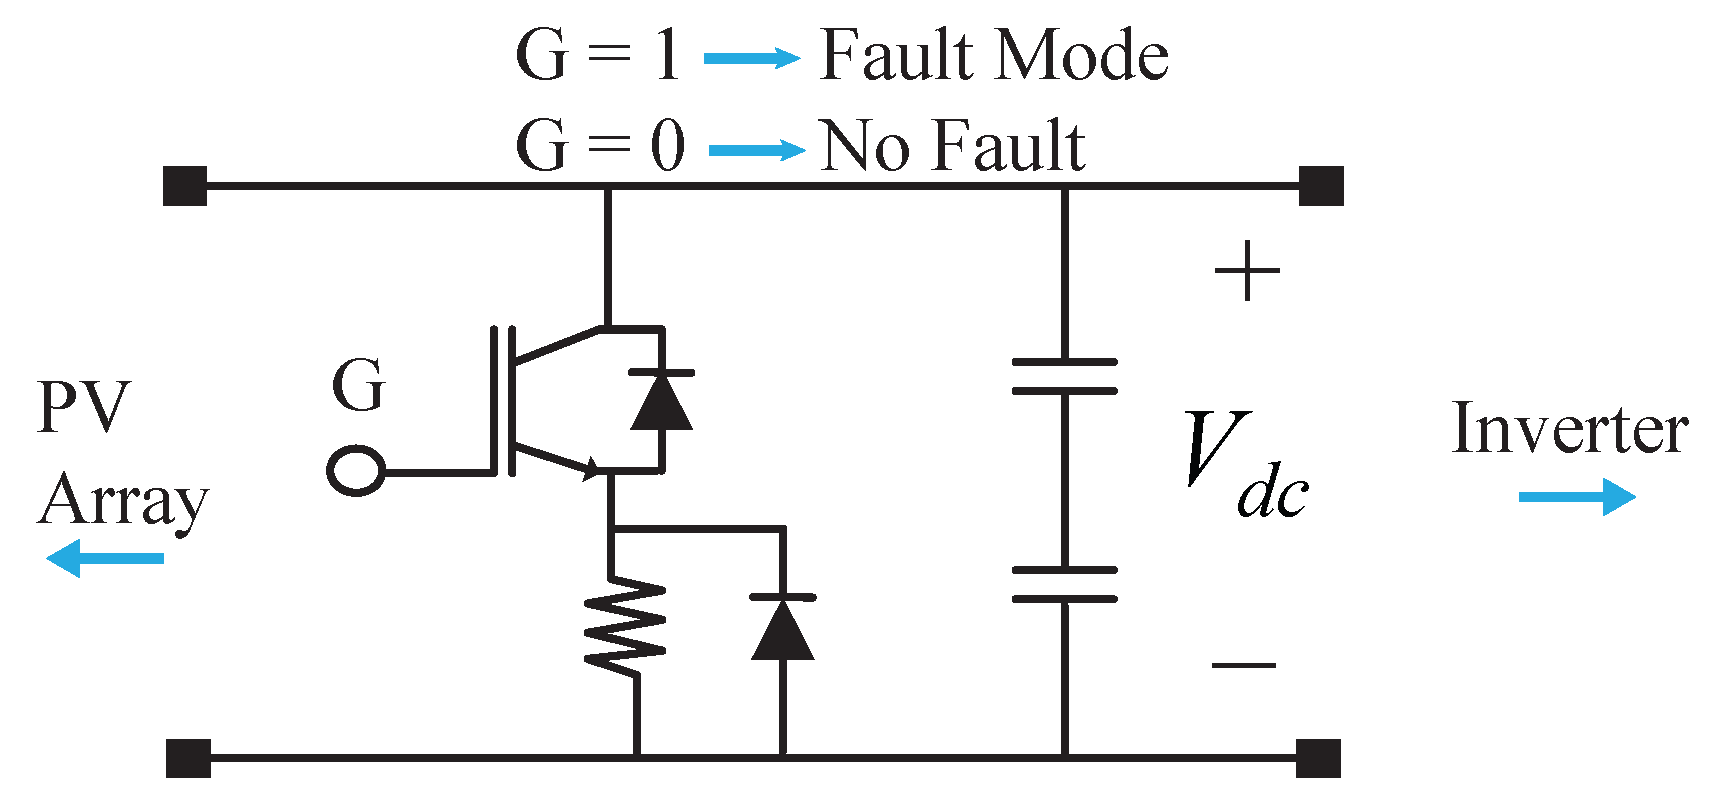
A conventional DC-chopper circuit to prevent DC-link over-voltage is shown in Figure 7. A DC-chopper is basically a protection circuit that is placed with the DC-link capacitor in parallel. It consists of a resistor and an IGBT that, whenever the voltage exceeds a certain threshold value, is switched on by the fault signal. The ideal function of the resistor is for stabilizing the system by absorbing excess power generated by the PV array. Diode is also connected to the resistor in parallel for stray inductance effects when IGBT is turned off.
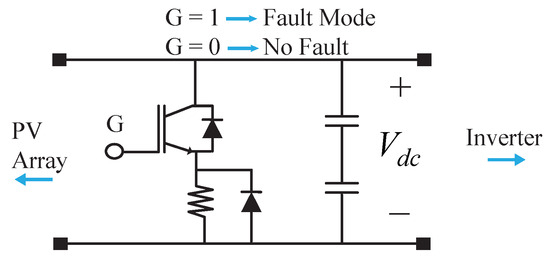
Figure 7.
DC-chopper circuit.
3.3. Limiting of Excessive AC Current
Every PV connected inverter to a grid system has a specific limit of max. AC current that it can withhold. During a fault, AC current exceeds the max. allowed limit of inverter and leads to disconnection from the grid. Now, when a fault occurs, the controller tries to keep the voltage of grid constant by reducing the real power insertion to the grid. However, as a response, d-component of the current experiences increment in SRF-PLL [1]. Because the inverter should insert reactive current during this sag situation, q-component of the current also increases. This increment in current components may cause the inverter to isolate from the system for protection purposes. A current value limiter is used to maintain current level within the allowed range for the inverter to work continuously and efficiently in order to resolve this problem.
3.4. Reactive Current Injection
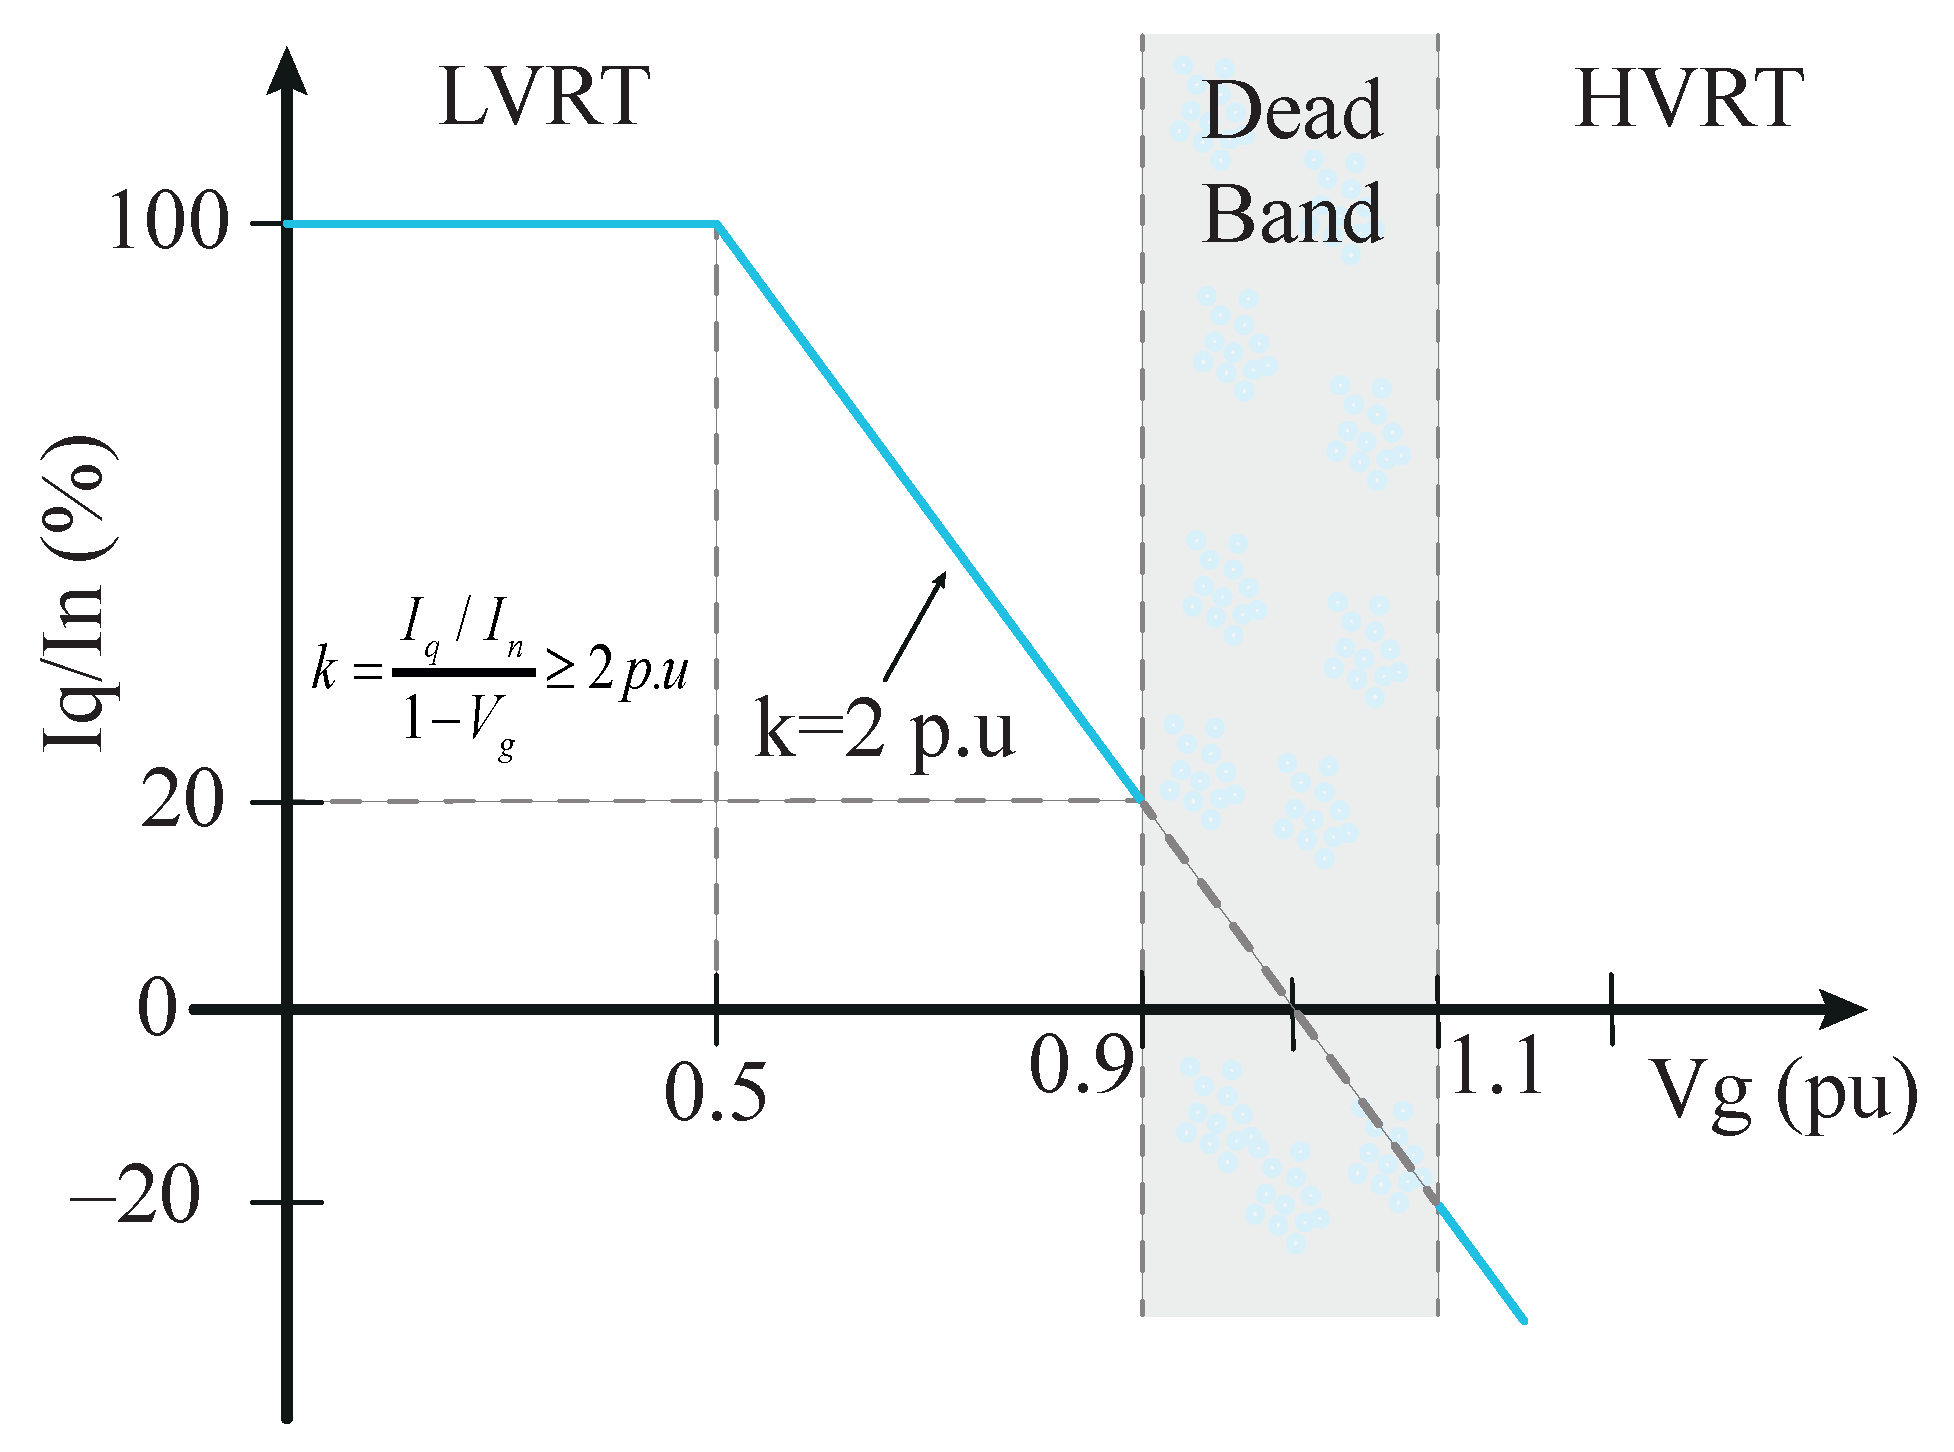
To facilitate voltage restoration and provide grid support subsequent to identifying a voltage sag, an inverter must exhibit LVRT capability by injecting reactive current. As outlined by German grid regulations [30], a PV microgrid system encountering grid faults necessitates a specific quantity of reactive current, as illustrated in Figure 8. These guidelines indicate that the system operates within a normal mode when the voltage amplitude (grid voltage) falls within the range of 0.9 p.u to 1.0 p.u. In this standard mode, the inverter only injects active current. However, the inverter must seamlessly transition to LVRT mode when the grid voltage descends below 0.9 p.u, and it must have the capacity to introduce reactive current in this state.
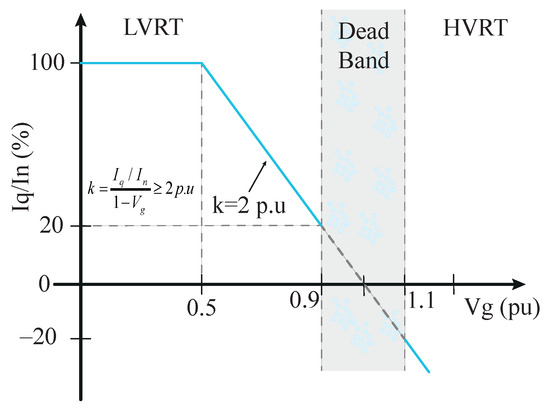
Figure 8.
Required reactive current injection.
In accordance with the designated grid regulations and with consideration for the context presented in Figure 8, the necessary reactive current injection can be represented as follows:
where is the injected reactive current, k is the droop constant (). and represent grid voltage and rated current, respectively.
4. Proposed NN Controller
Demanding tasks necessitate a potent, resilient, and dependable controller for their execution. For instance, intricate responsibilities like pattern recognition, system identification, classification, speech and vision processing, as well as control systems require substantial computational capability. Artificial neural networks (ANNs) have gained significant traction in tackling these multifaceted challenges and addressing diverse engineering issues [31]. ANNs emerge as a fitting choice for predicting nonlinear parameters, such as current in GCPV systems. The NN control proposed in this paper for the detection of grid fault and injection of required reactive current is shown in Figure 9. Modelling a NN that can perform both the functions of fault detection and reactive current injection involves several steps that may be divided in the following manner:
- Data Collection and Preprocessing: The initial step in building a neural network model, involves gathering voltage, current, and relevant parameter data from the grid system, cleaning and formatting it, and then normalizing or scaling to ensure consistent input. This process also encompasses selecting pertinent features, engineering new ones, and addressing imbalances if necessary. By organizing and enhancing the dataset, the neural network can better understand and learn from the data, ultimately leading to a more accurate and reliable model for detecting grid faults and predicting required reactive current injection.
- NN Architecture: The second step involves labeling the collected data, distinguishing between grid fault instances labeled as “fault” and normal operation as “normal”. Then, the dataset is divided into distinct training, validation, and testing subsets to facilitate model training and evaluation. Finally, the architecture of the NN is designed (Figure 10a), encompassing multiple layers for input with 2 neurons (voltage and/or current), hidden layers with 10 neurons for feature extraction, and output layer with 1 neuron for fault detection and reactive current prediction. This architecture is structured to capture intricate relationships in the data and enable the network to perform the dual functions of detecting grid faults and predicting the requisite reactive current.
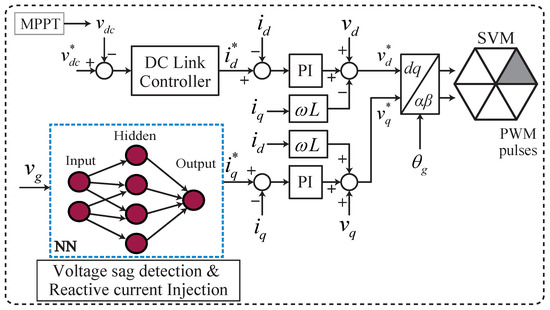
Figure 9.
NN control structure.
Figure 9.
NN control structure.
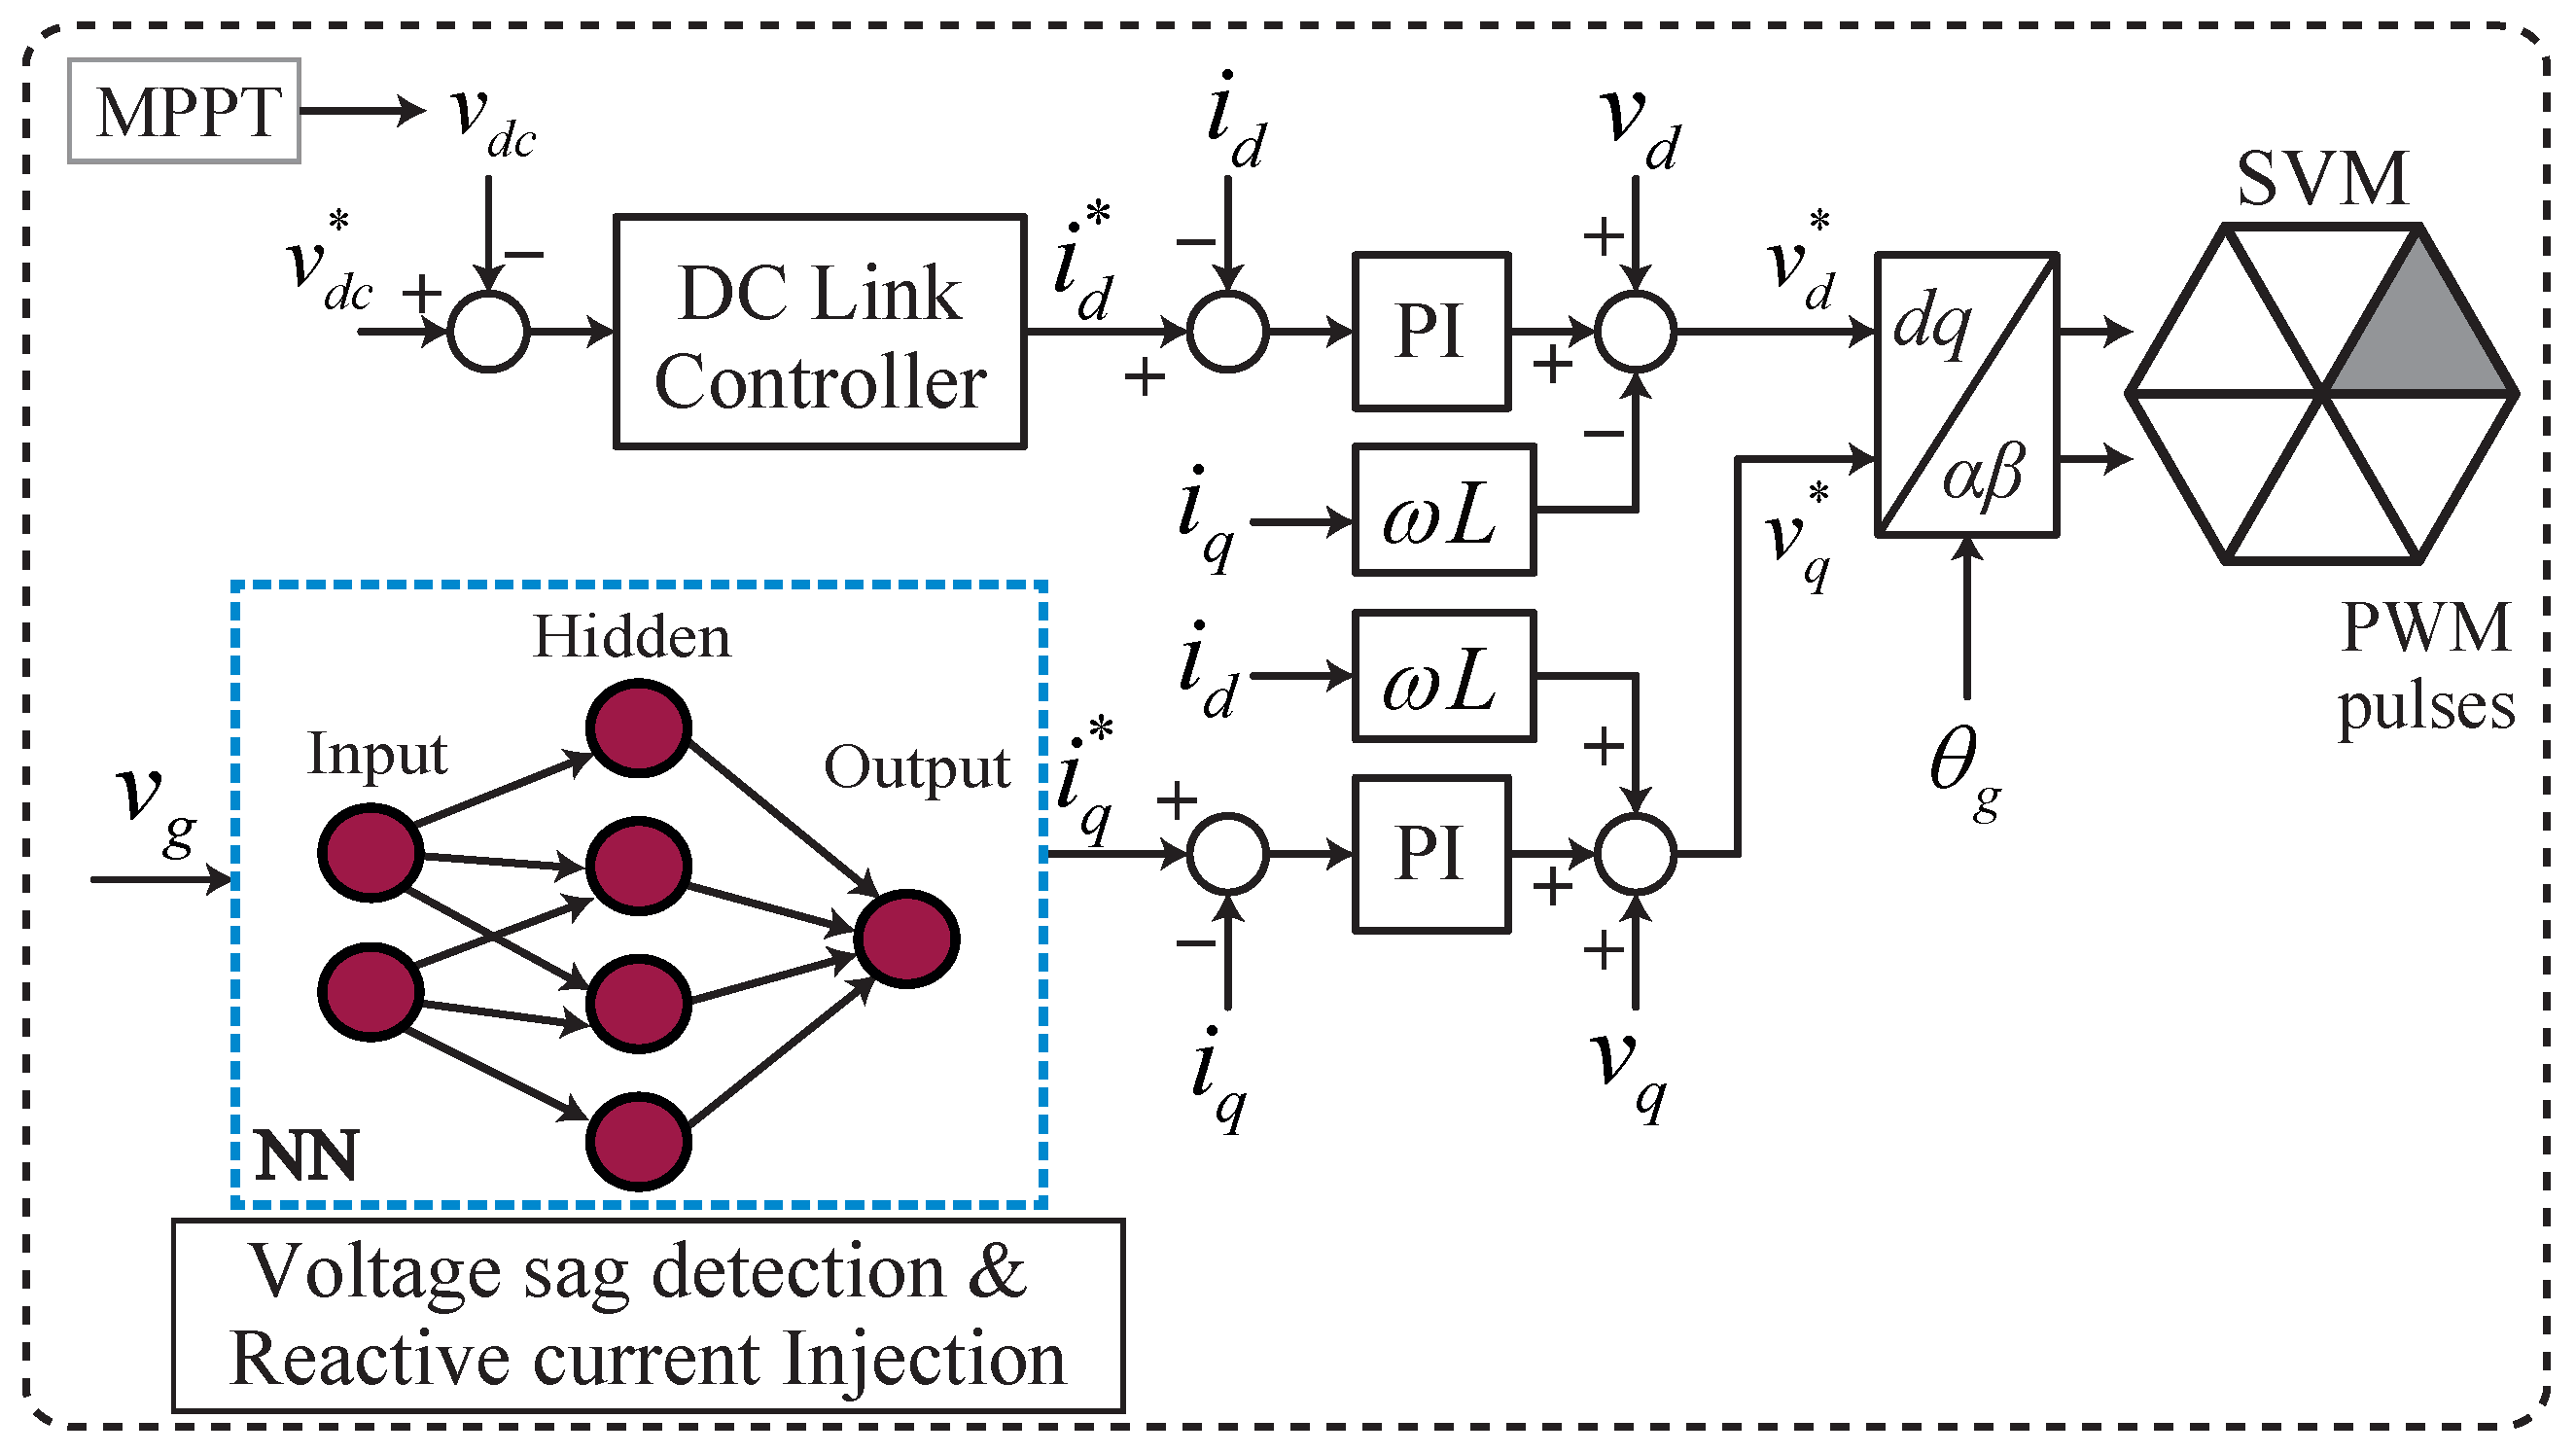
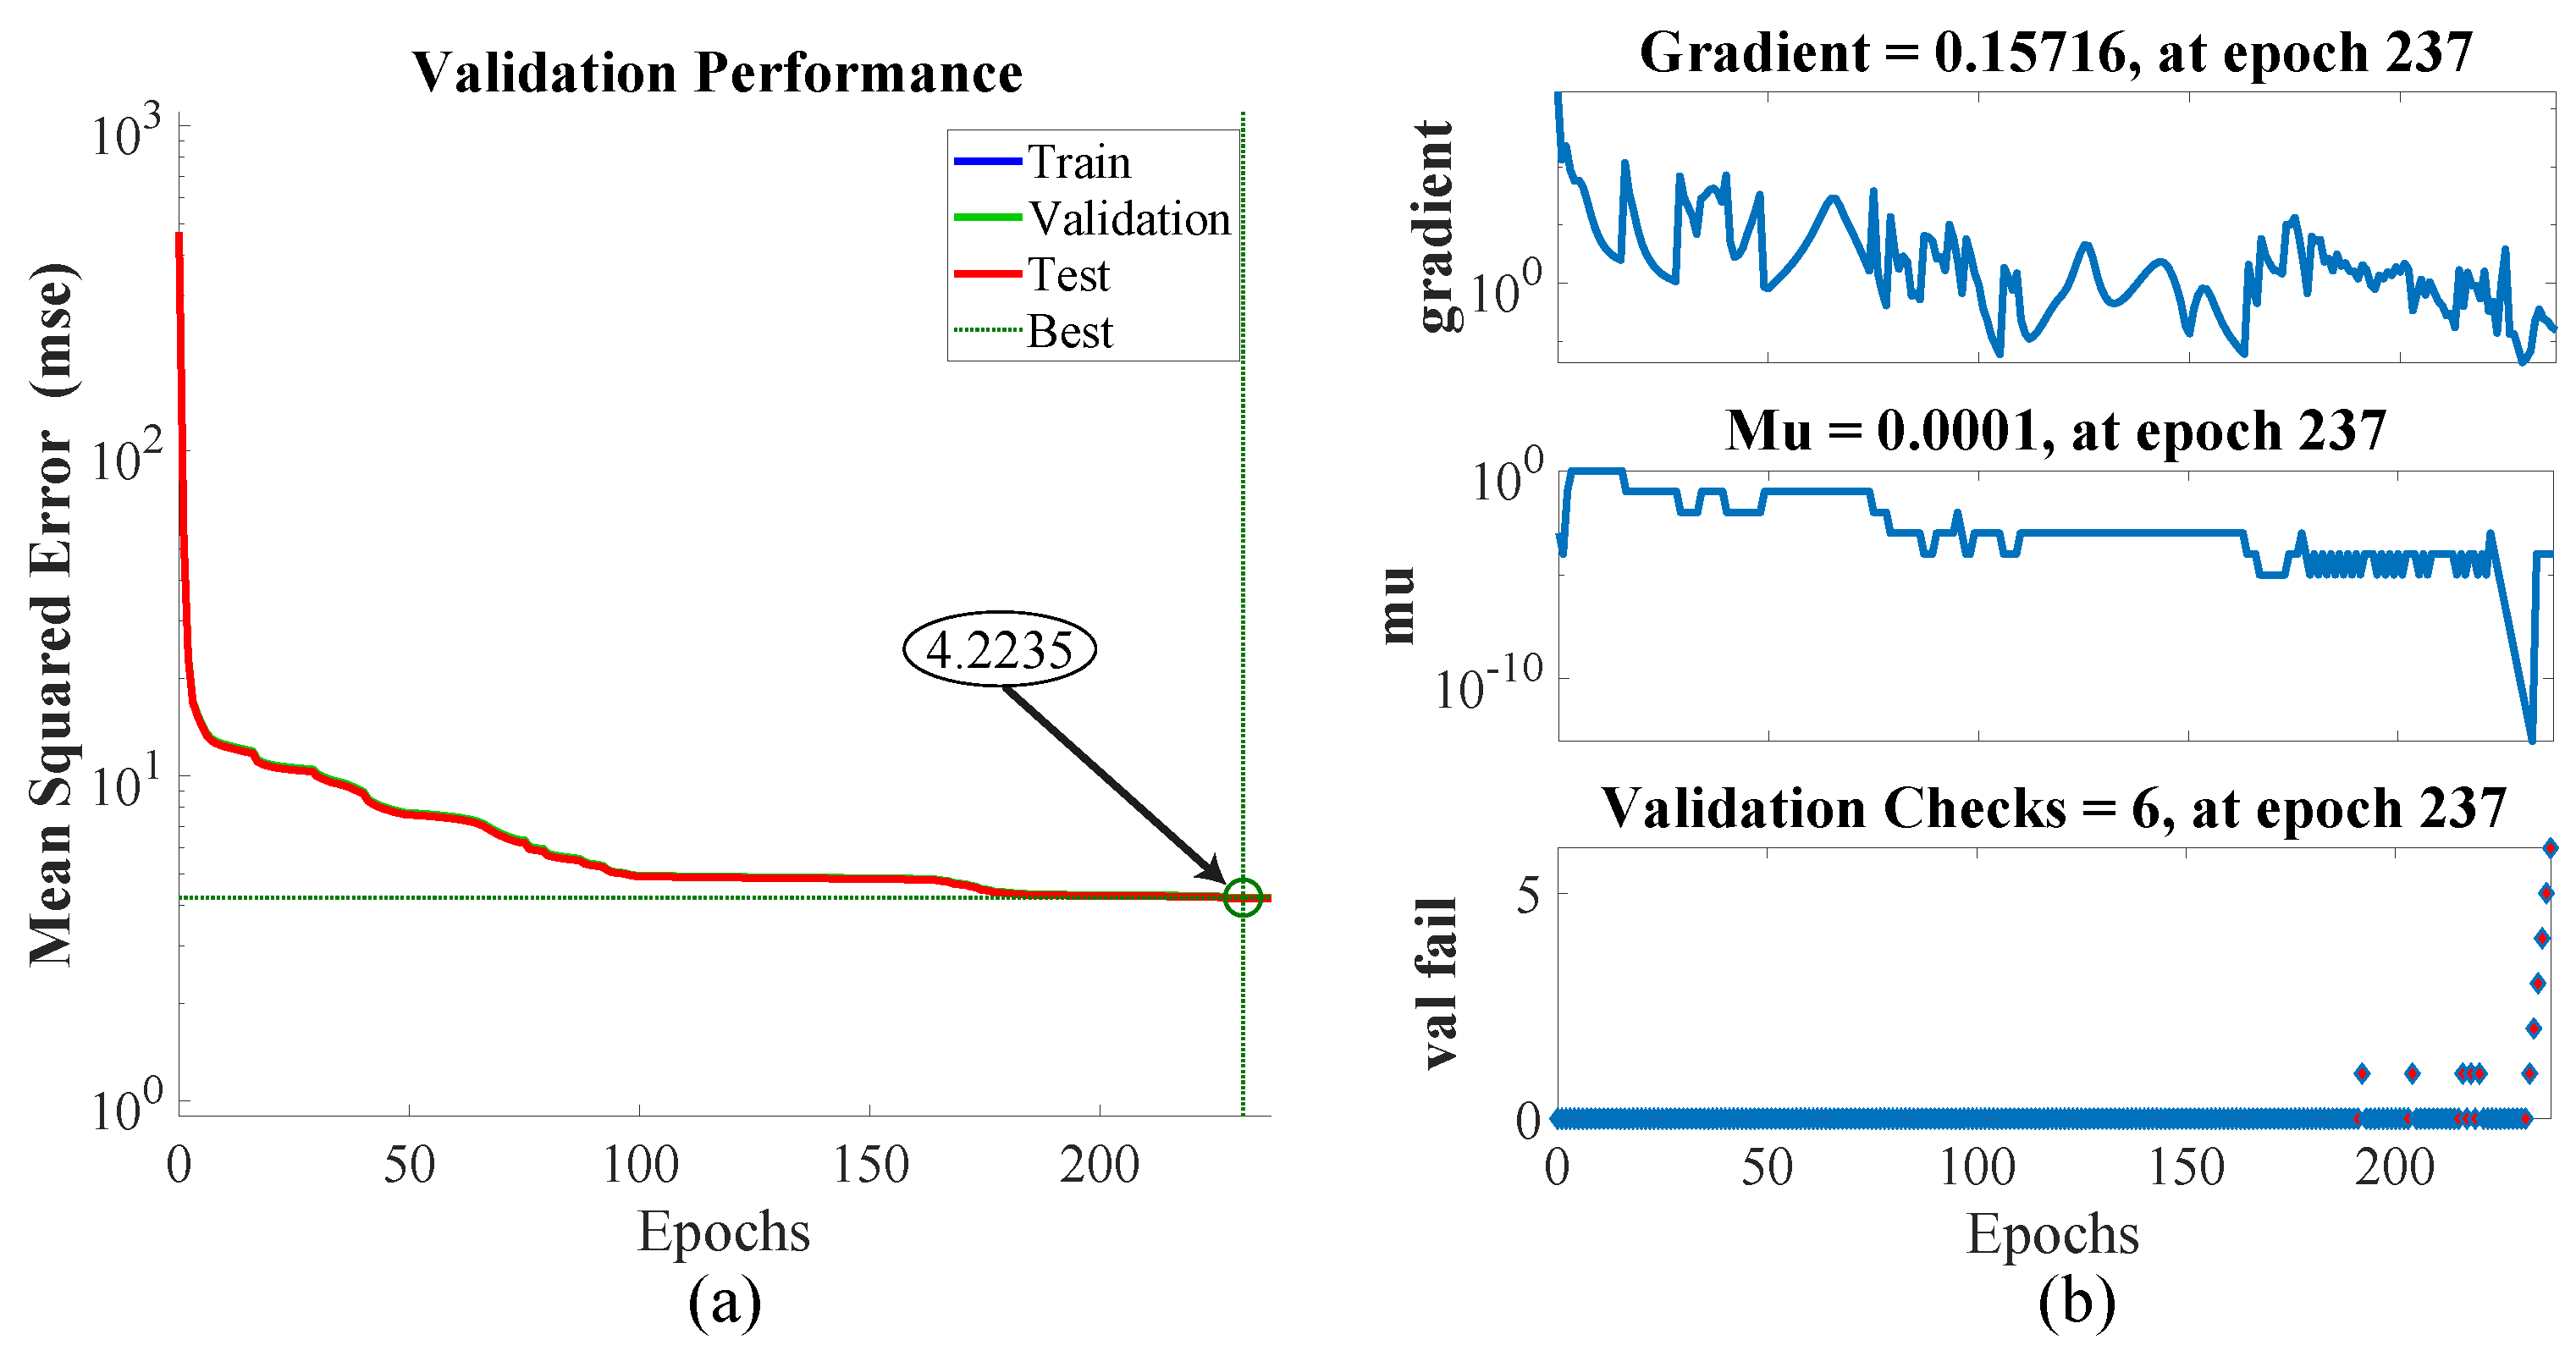
- Training and Evaluation: In the third step, the designed neural network (NN) is trained using the labeled training dataset, with a focus on developing an accurate loss function that considers fault detection accuracy and reactive current prediction. The NN’s weights are adjusted through back-propagation [32], and its performance is monitored using the validation set to prevent overfitting. After evaluating the trained neural network’s performance standards, achieving high accuracy entails the correlation coefficient (R) approaching a value of 1 [33], while minimizing the mean squared error (MSE) to approach a value close to 0. Next, the trained NN is rigorously evaluated using the separate testing dataset. This involves calculating performance metrics like accuracy, precision, recall, and mean absolute error (Figure 11a) for both fault detection and reactive current prediction. The evaluation results (Figure 10b and Figure 11b) offer insights into the model’s proficiency in simultaneously detecting grid faults and accurately predicting the reactive current required for stabilization.

Figure 10.
NN. (a) Network structure; (b) regression curve.
Figure 10.
NN. (a) Network structure; (b) regression curve.
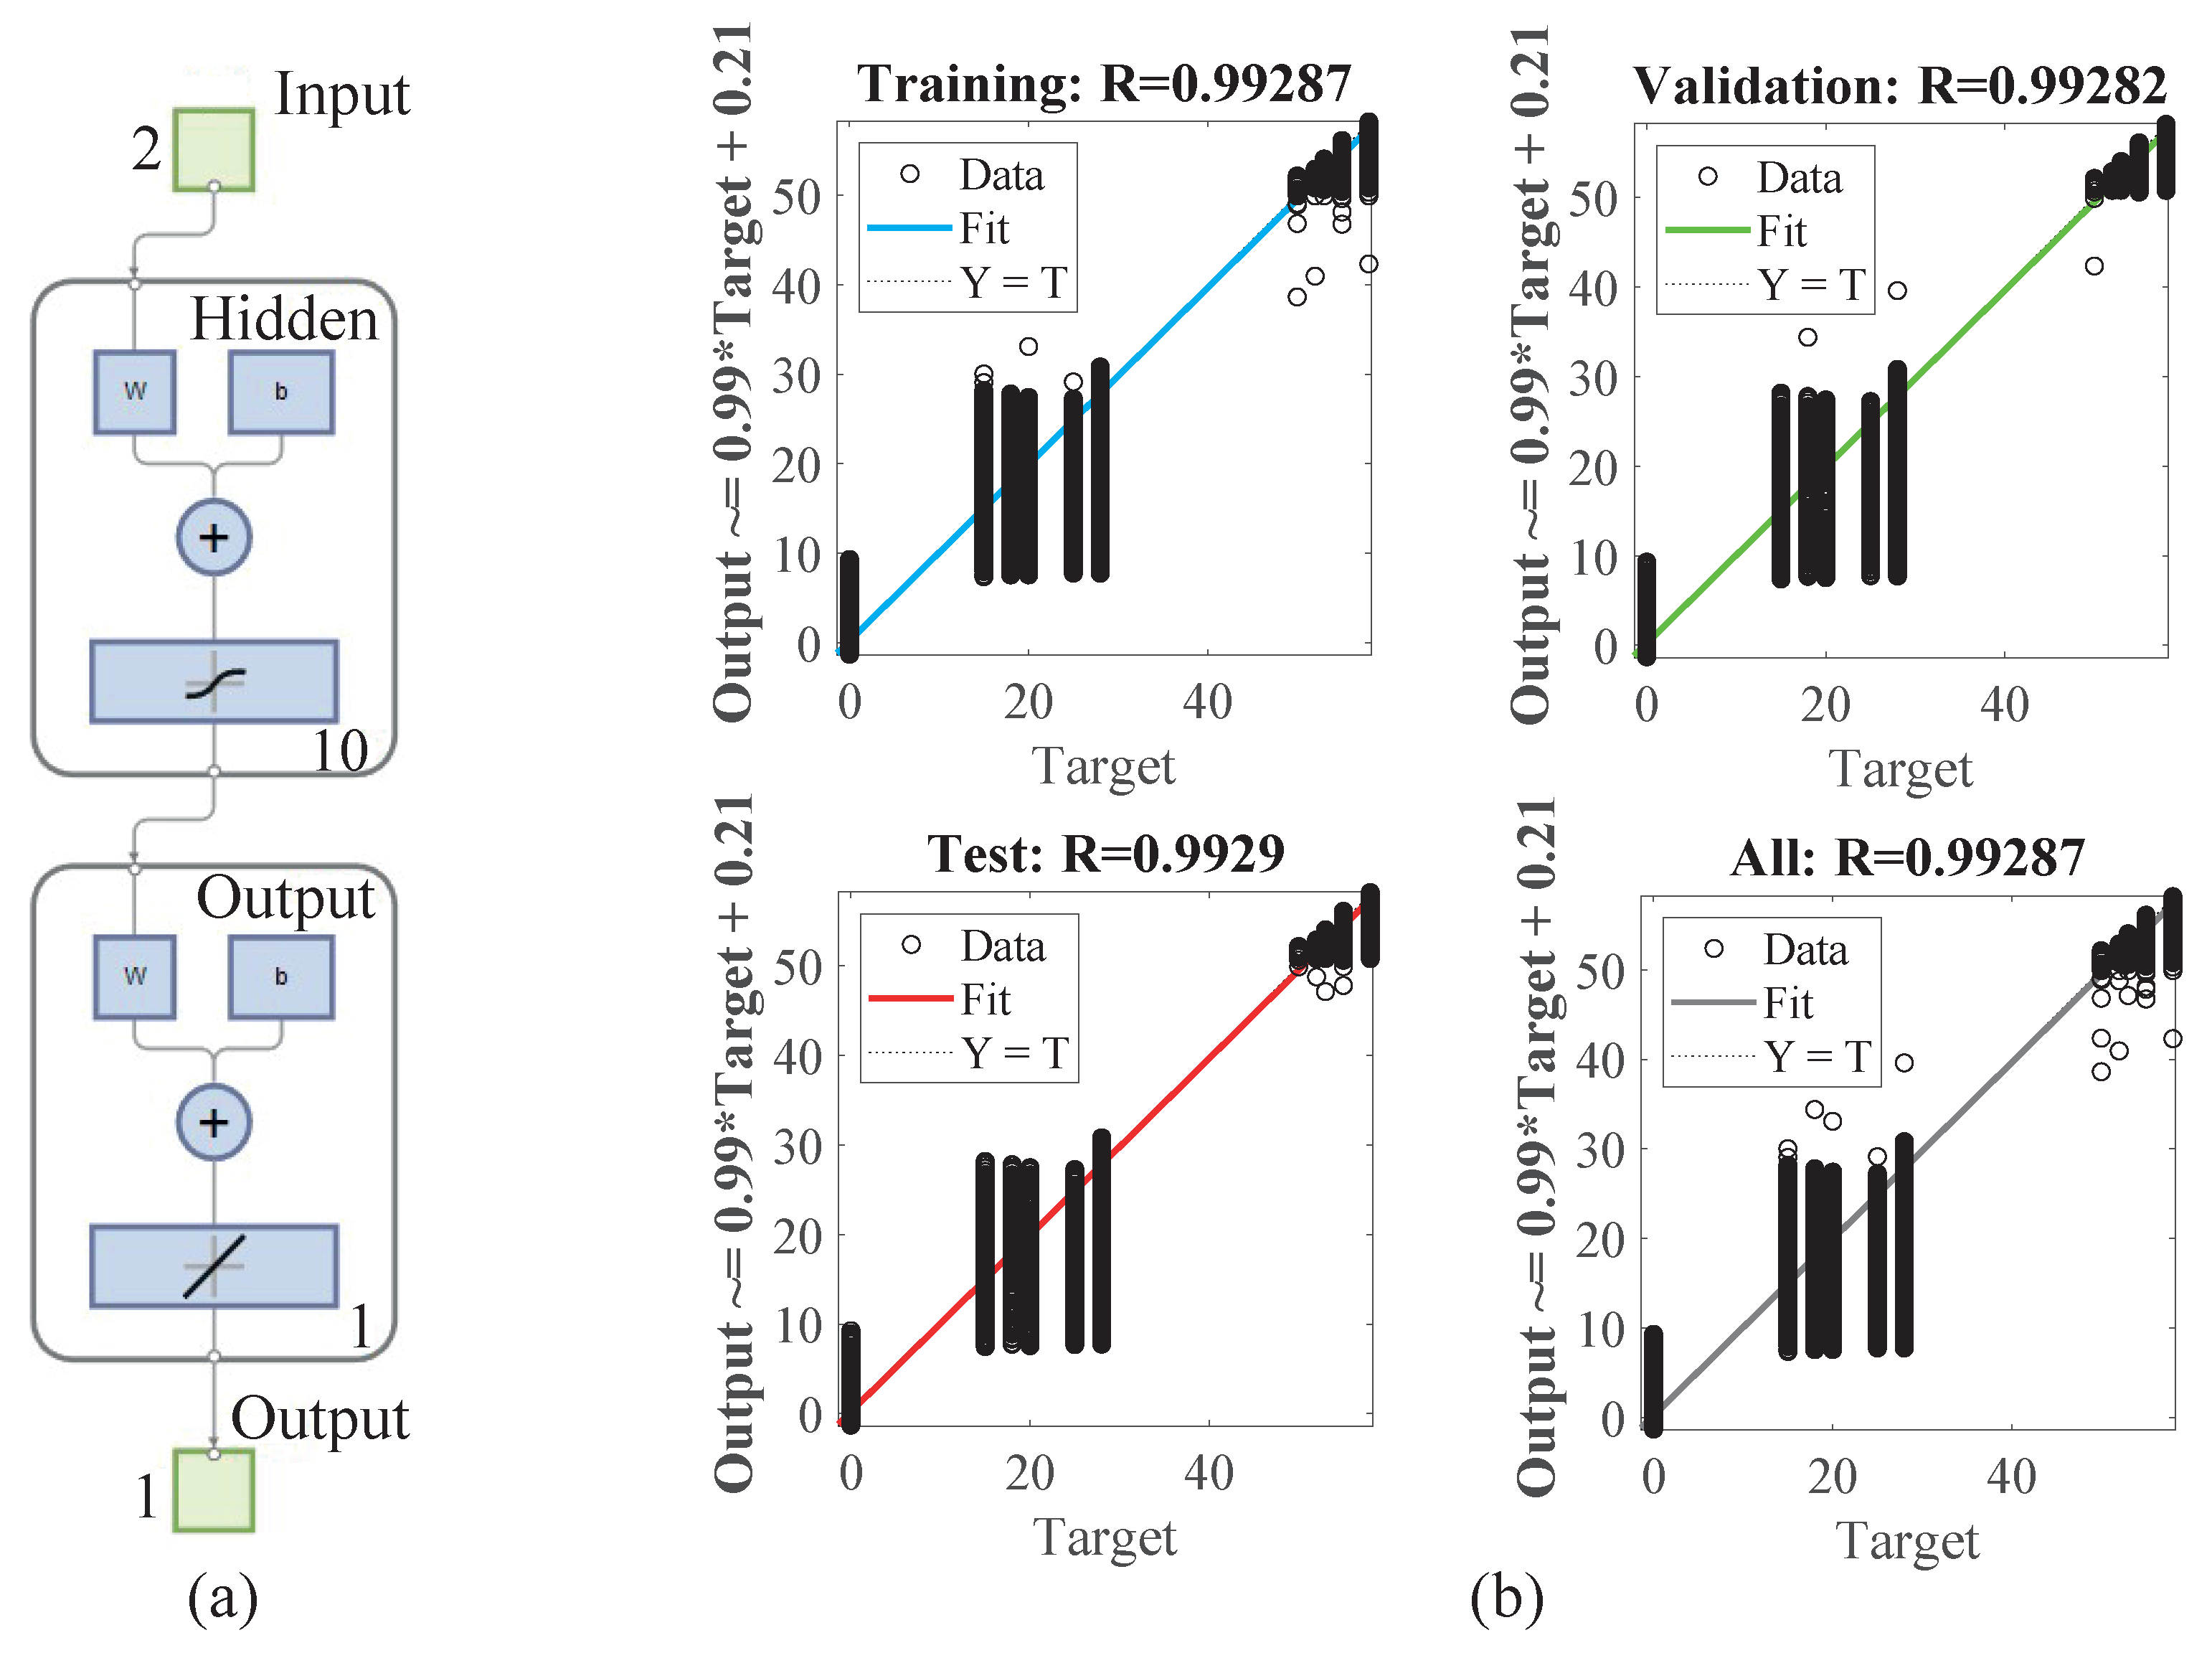
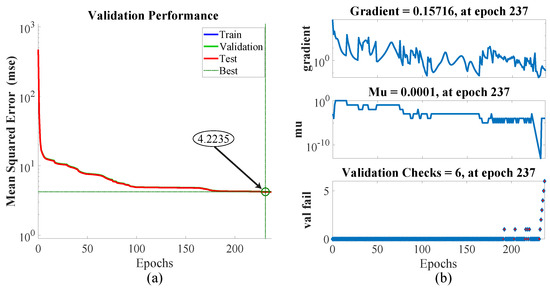
Figure 11.
Evaluation of NN. (a) MSE performance; (b) training state.
Figure 11.
Evaluation of NN. (a) MSE performance; (b) training state.
- Integration into the Grid system: In the final step, the trained NN is integrated into the actual grid system, continuously gathering real-time voltage and current data. Then, the NN is utilized to predict grid fault occurrences and reactive current injection needs based on real-time data, thus enabling timely response to grid anomalies. After that, the model’s performance is monitored and refined as needed, ensuring its reliability and effectiveness over time. Eventually, it is confirmed that the NN’s reactive current injection complies with specified grid codes and regulations, ensuring that the predictions align with the required standards and maintaining grid stability and safety.
NN-Based Control
The proposed NN control method plays a pivotal role in enhancing grid reliability during voltage sag events. By taking grid voltage () as input, the NN not only detects the occurrence of voltage sags but also assesses their severity and duration. Crucially, it operates in accordance with grid code regulations, having been trained to understand and adhere to these standards. This comprehensive approach allows the NN to accurately predict the required amount of reactive current injection () needed to support the grid during sags while ensuring compliance with regulatory limits. The injection of this precise reactive power level stabilizes the grid, mitigates voltage sag impacts, and upholds uninterrupted power supply, thus reinforcing the resilience and reliability of the PV microgrid system in challenging grid conditions.
5. Results
The PV microgrid system presented in Figure 2 is prepared in Simulink for simulation testing of the proposed LVRT control technique. The system is provided with a utility grid having a nominal voltage of 25 kV. From the point of common coupling (PCC), instantaneous values of current and voltage are recorded. The designed system performs effectively for AC current, limiting and restricting the voltage at DC-link according to the requirements. Hence, the control manages to keep the connection of the inverter through a fault event and then injects the value of reactive current required by the process carried out through the proposed NN model. In this section, the behavior of the designed PV microgrid system through voltage sags after connection and protection of the inverter is shown, and other equipment is guaranteed. All the results are taken with the input parameters of PV being temperature (T) of 25 C and irradiation (G) of 1000 W/m.
The testing is divided into three cases, with each case having a different sag scenario. The designed PV microgrid system’s response to the scenario of three phase to ground (L-L-L-G) faults in a spam of two seconds is considered under different sag values. It is confirmed that the system maintains connectivity and can endure voltage drops without experiencing any diverse changes in stability. To guarantee that the entire microgrid system functions properly, voltage at the DC-link is also controlled within allowable bounds.
5.1. Case 1
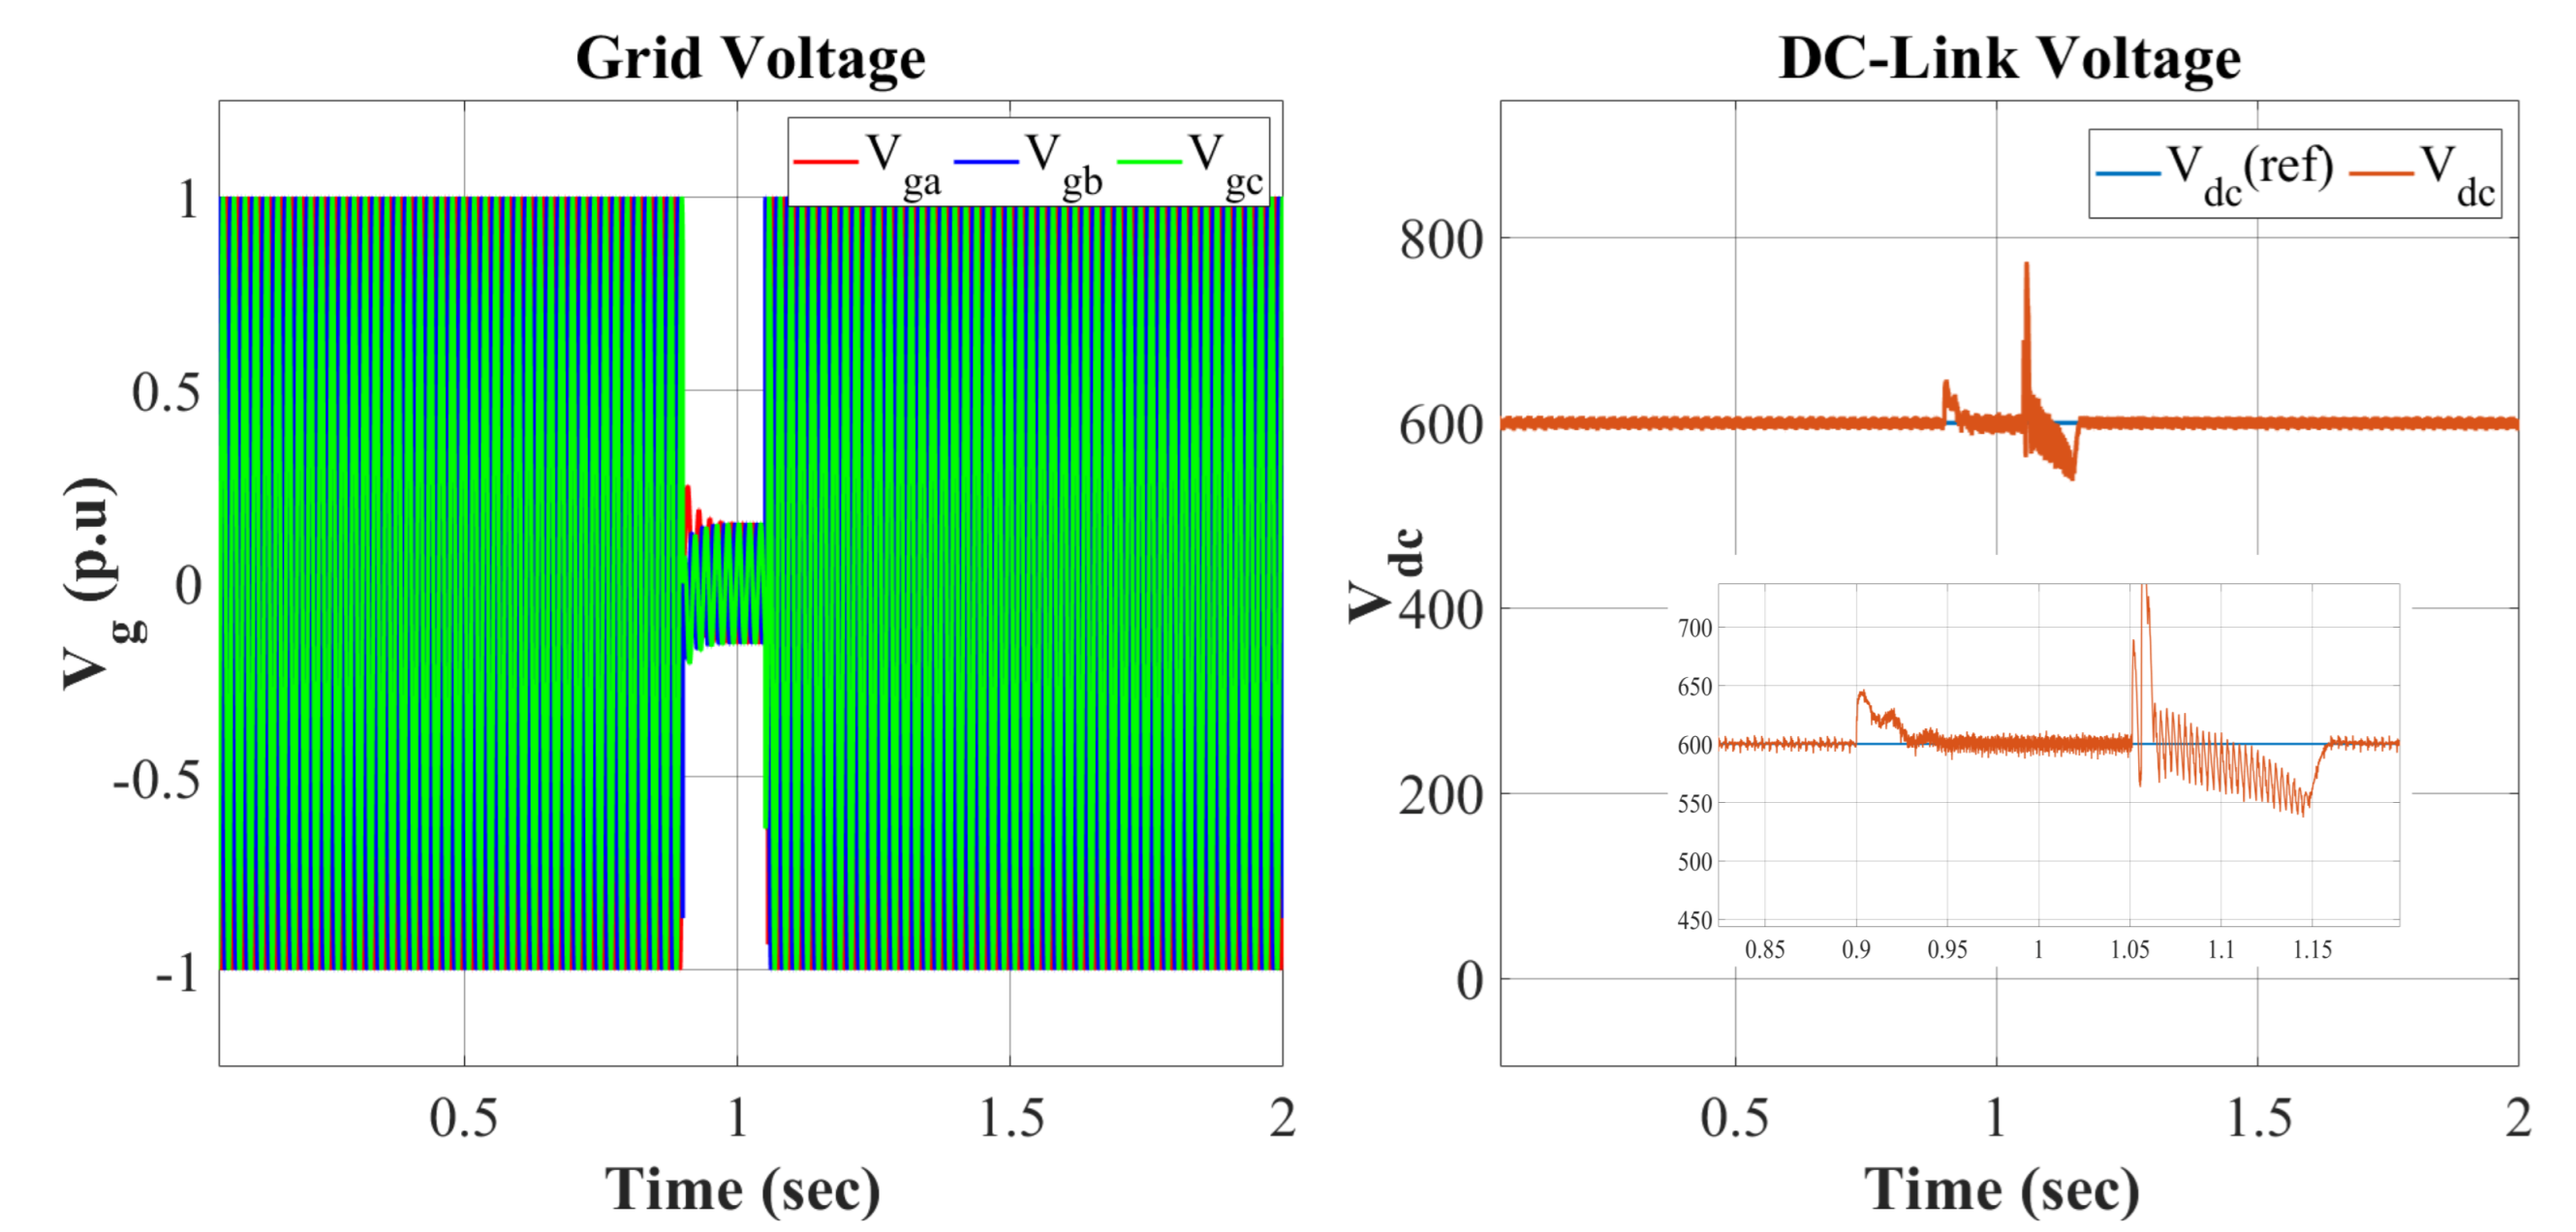
The first case involved subjecting the grid to an 85% voltage sag, allowing for a comprehensive assessment of the proposed control system’s performance. The results from Figure 12 depict the behavior of the grid voltage in per unit (pu) values during the voltage sag, clearly delineating the sag occurrence between 0.9 s and 1.05 s.
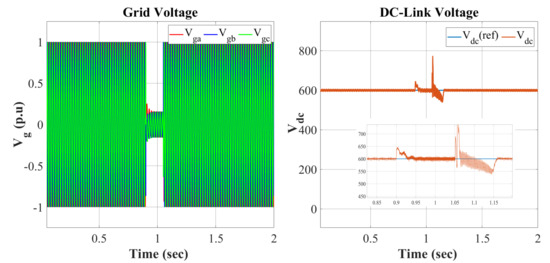
Figure 12.
Grid and DC-link voltage with 85% sag.
Furthermore, it also illustrates the dynamics of the DC-link voltage throughout the voltage sag. This dynamic analysis provides a deeper understanding of how the DC-chopper circuit managed the stability of the DC-link voltage in an acceptable range during the sag, a critical aspect of maintaining the system’s overall stability.
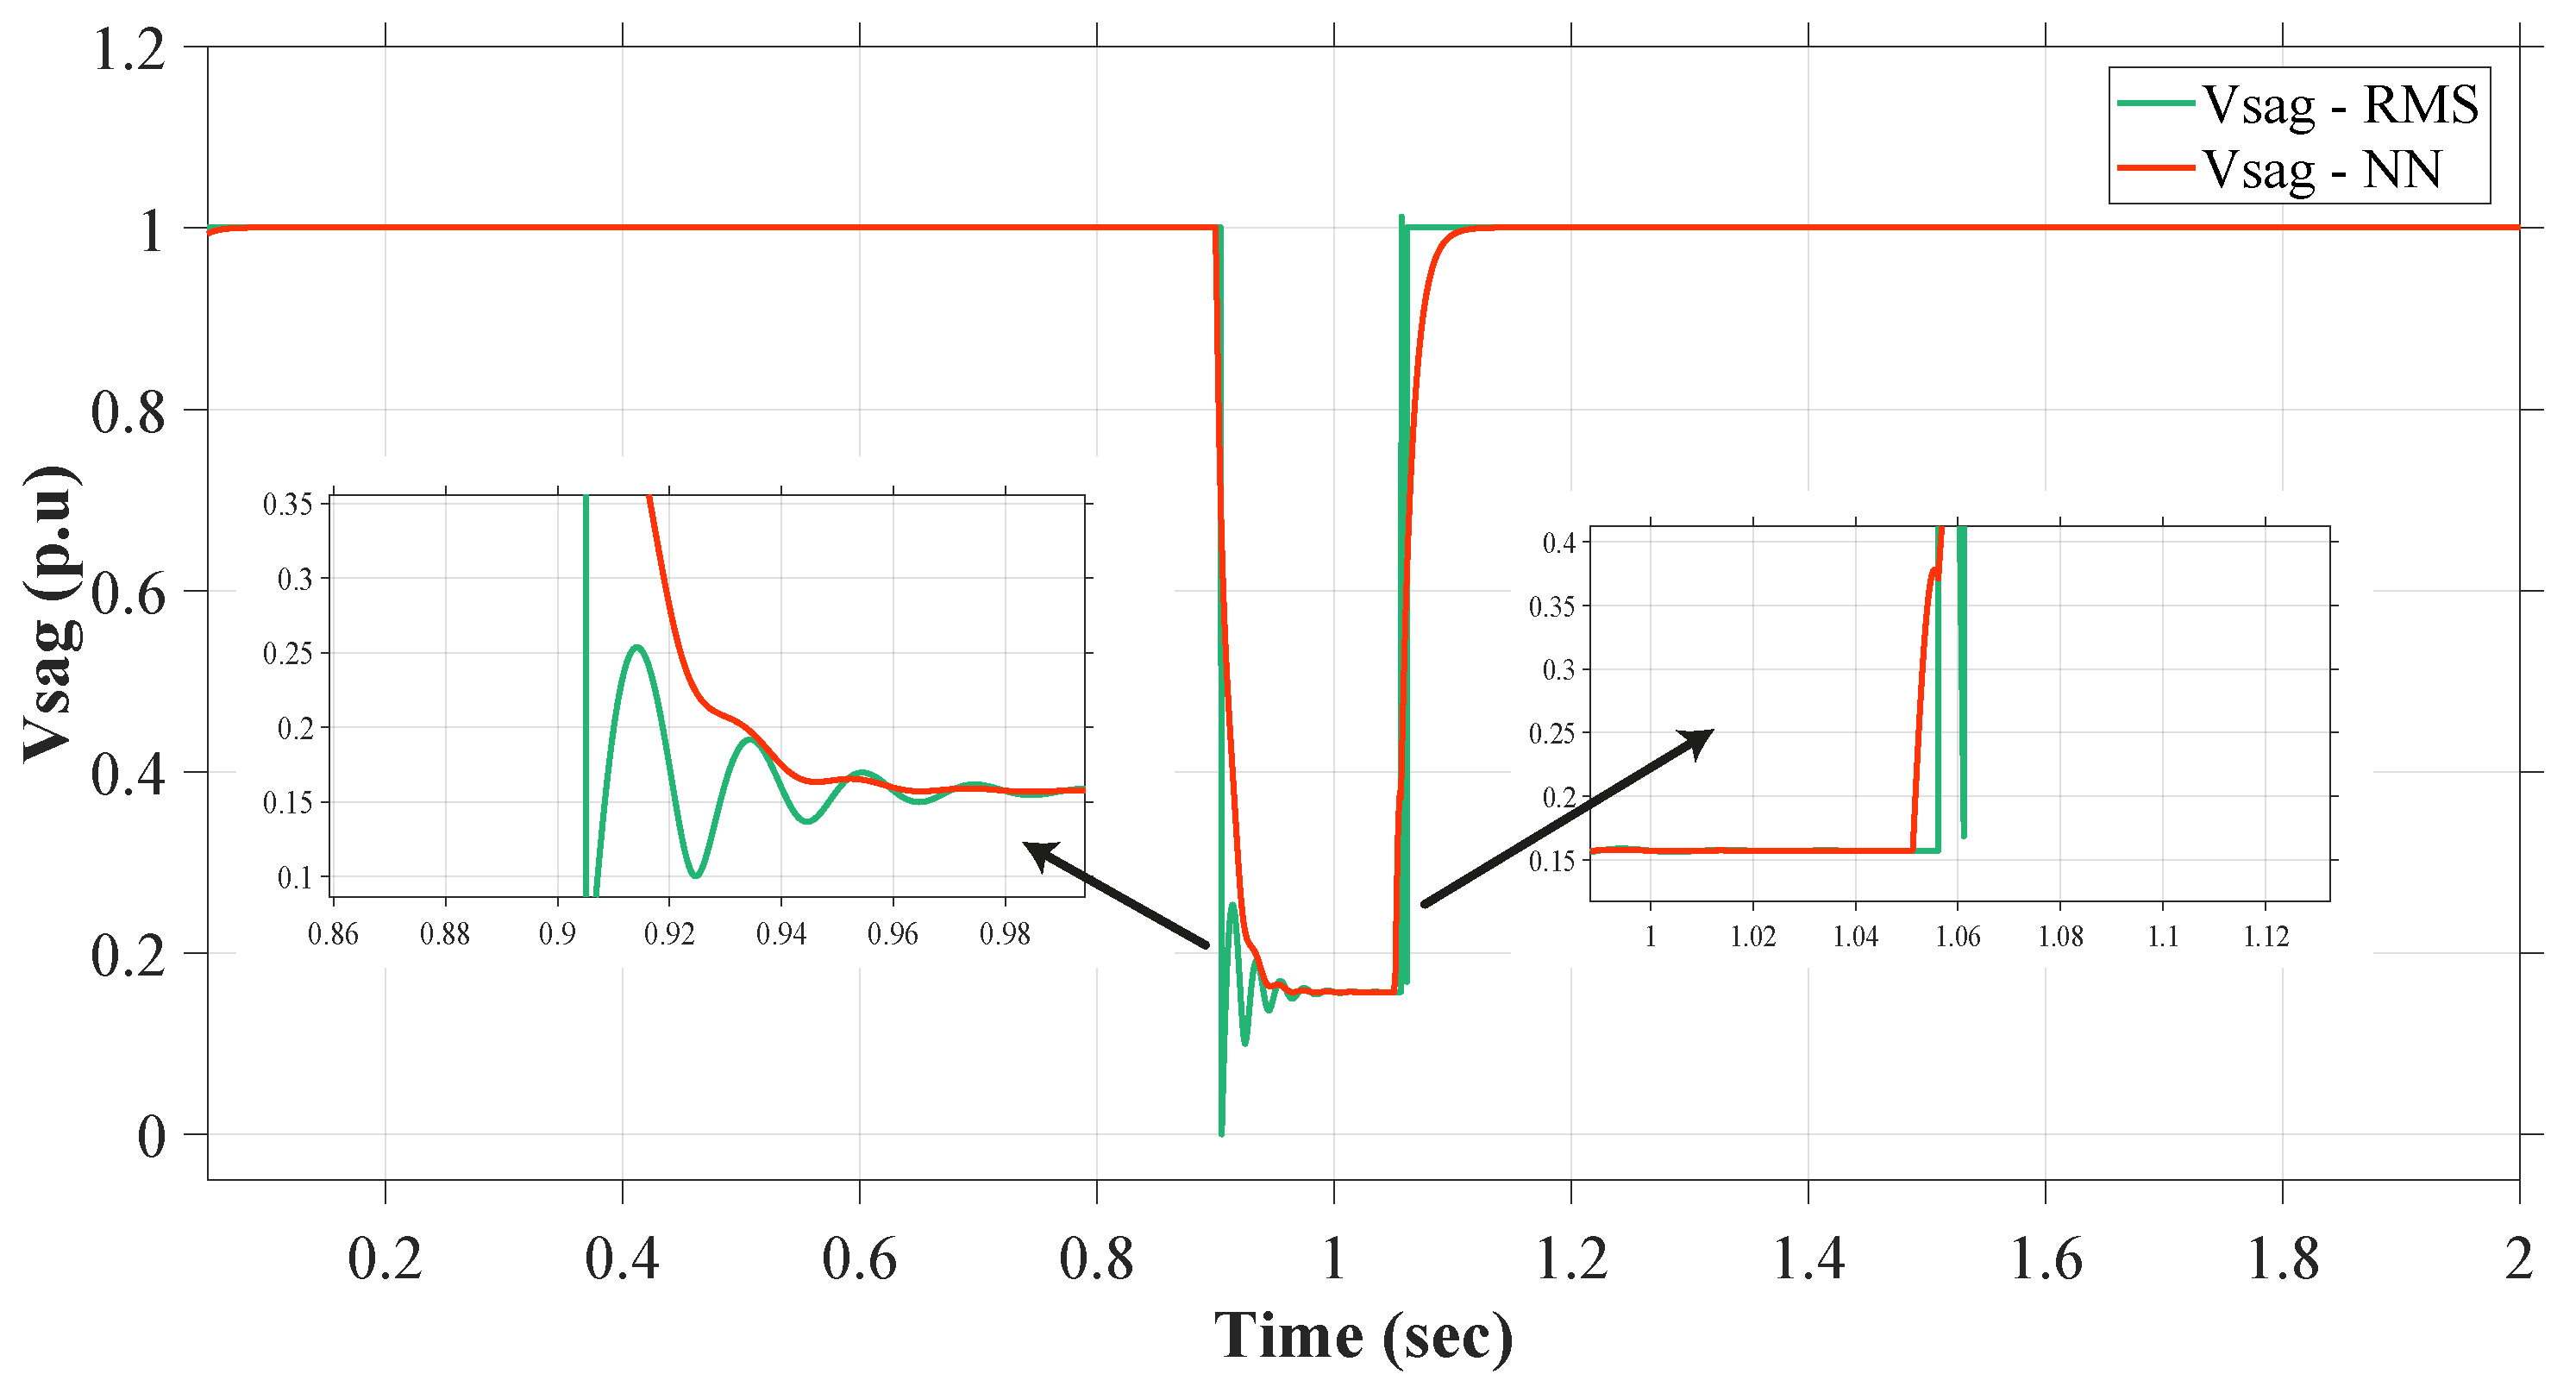
Figure 13 shows the result of comparison of fault detection accuracy between the RMS method and the proposed NN method. Despite a marginally slower convergence rate, the NN-based approach demonstrated remarkable stability, robustness, and precision in detecting faults. In contrast, the RMS method exhibited a minor delay in its response along with occasional overshoots and undershoots, highlighting the advantages of the NN method for accurate fault detection, especially during challenging scenarios.
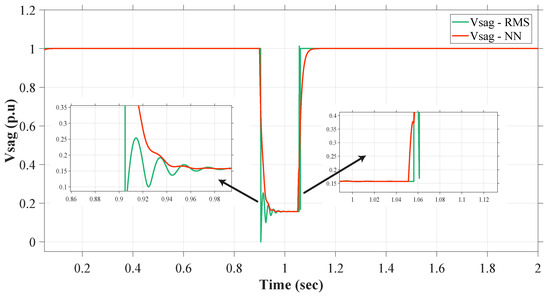
Figure 13.
Detection of fault (85% sag).
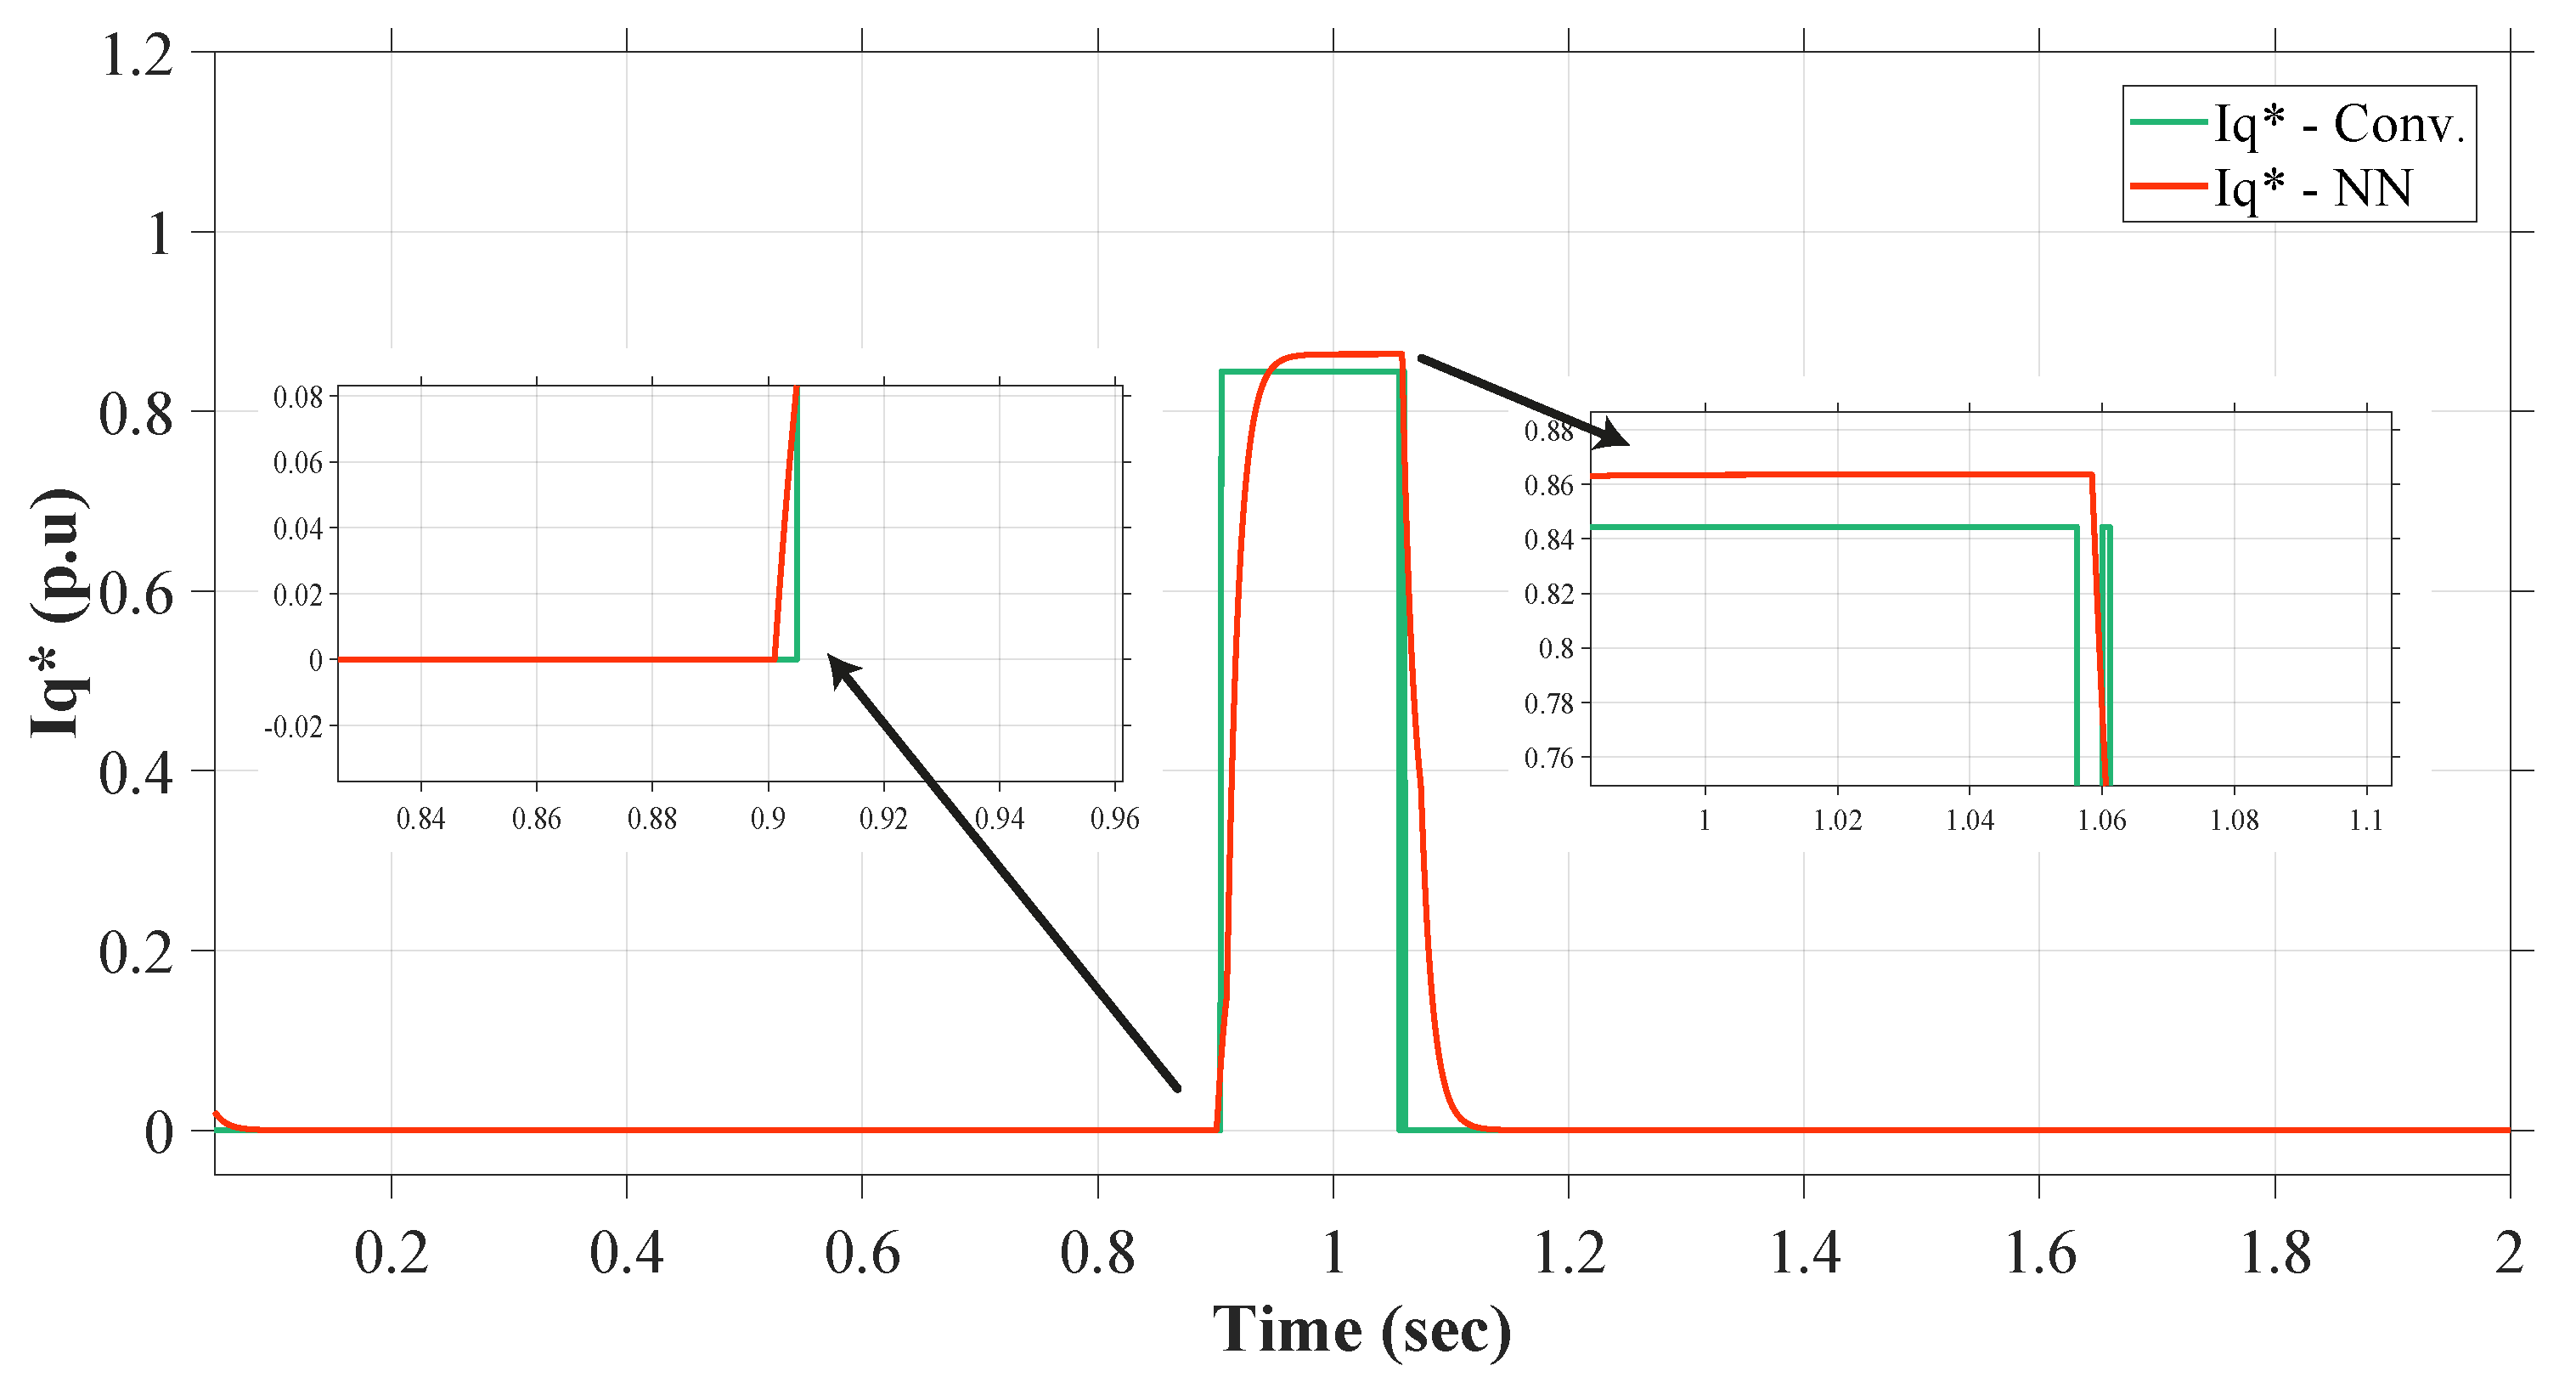
In the analysis of reactive current injection within the simulation results shown in Figure 14, the proposed NN control method exhibited a notable advantage in terms of robustness and accuracy when contrasted with the conventional LVRT algorithm. Notably, the NN control method showcased consistent and accurate reactive current injection responses, highlighting its resilience in managing the system’s reactive power demands. Conversely, the conventional LVRT algorithm displayed a slight delay in its reactive current injection and experienced stability concerns during the operation. This disparity underscores the enhanced performance and reliability of the NN control approach in optimizing reactive current injection, making it a more effective and promising solution for maintaining grid stability.
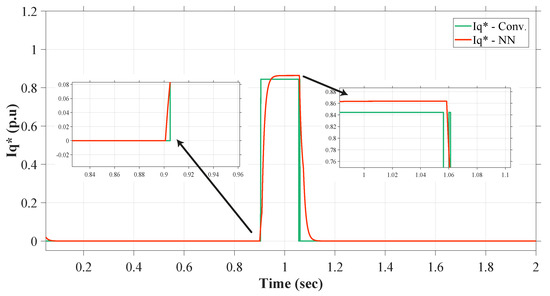
Figure 14.
Reactive current injection (85% sag).
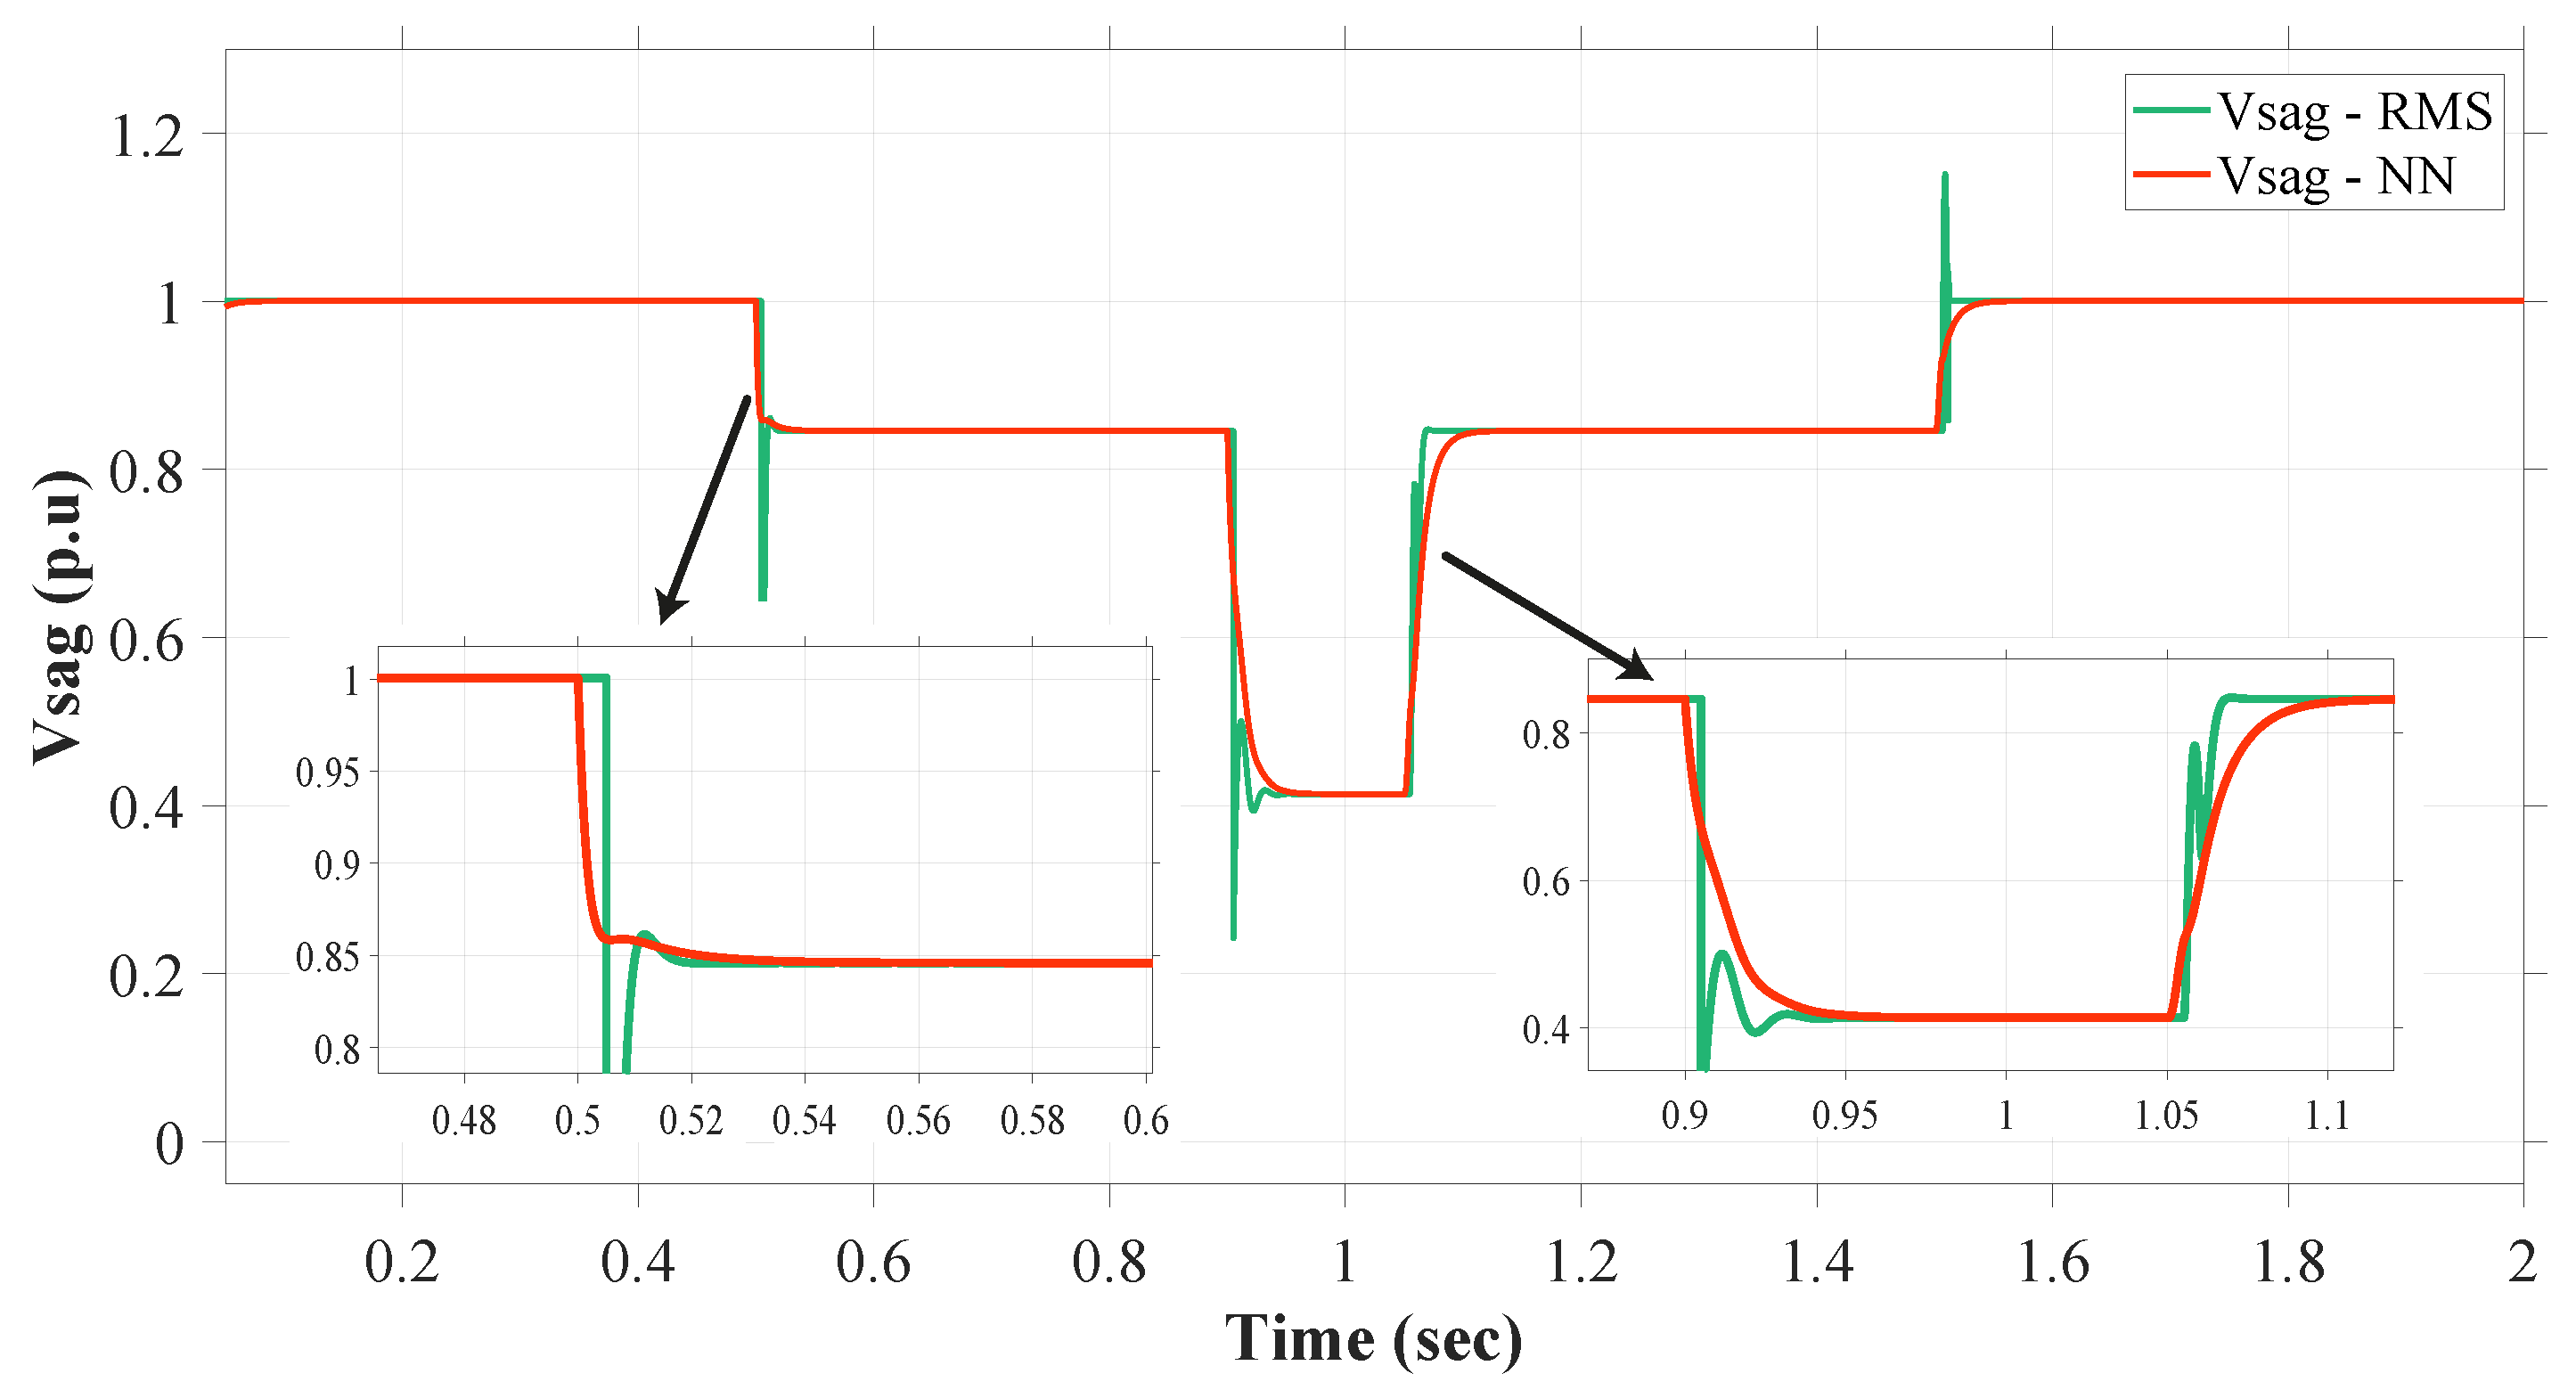
5.2. Case 2
The second case study involves grid voltage’s response during the voltage sag, effectively illustrating the sag occurrence spanning from 0.5 s to 1.5 s. It can be seen from Figure 15 that the DC-chopper circuit is also performing well to keep the DC-link voltage as stable as possible under the changing conditions of grid voltage, or, in other words, during the fault situations occurring in the system.
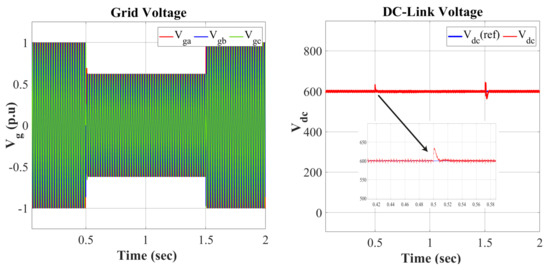
Figure 15.
Grid and DC-link voltage with 38% sag.
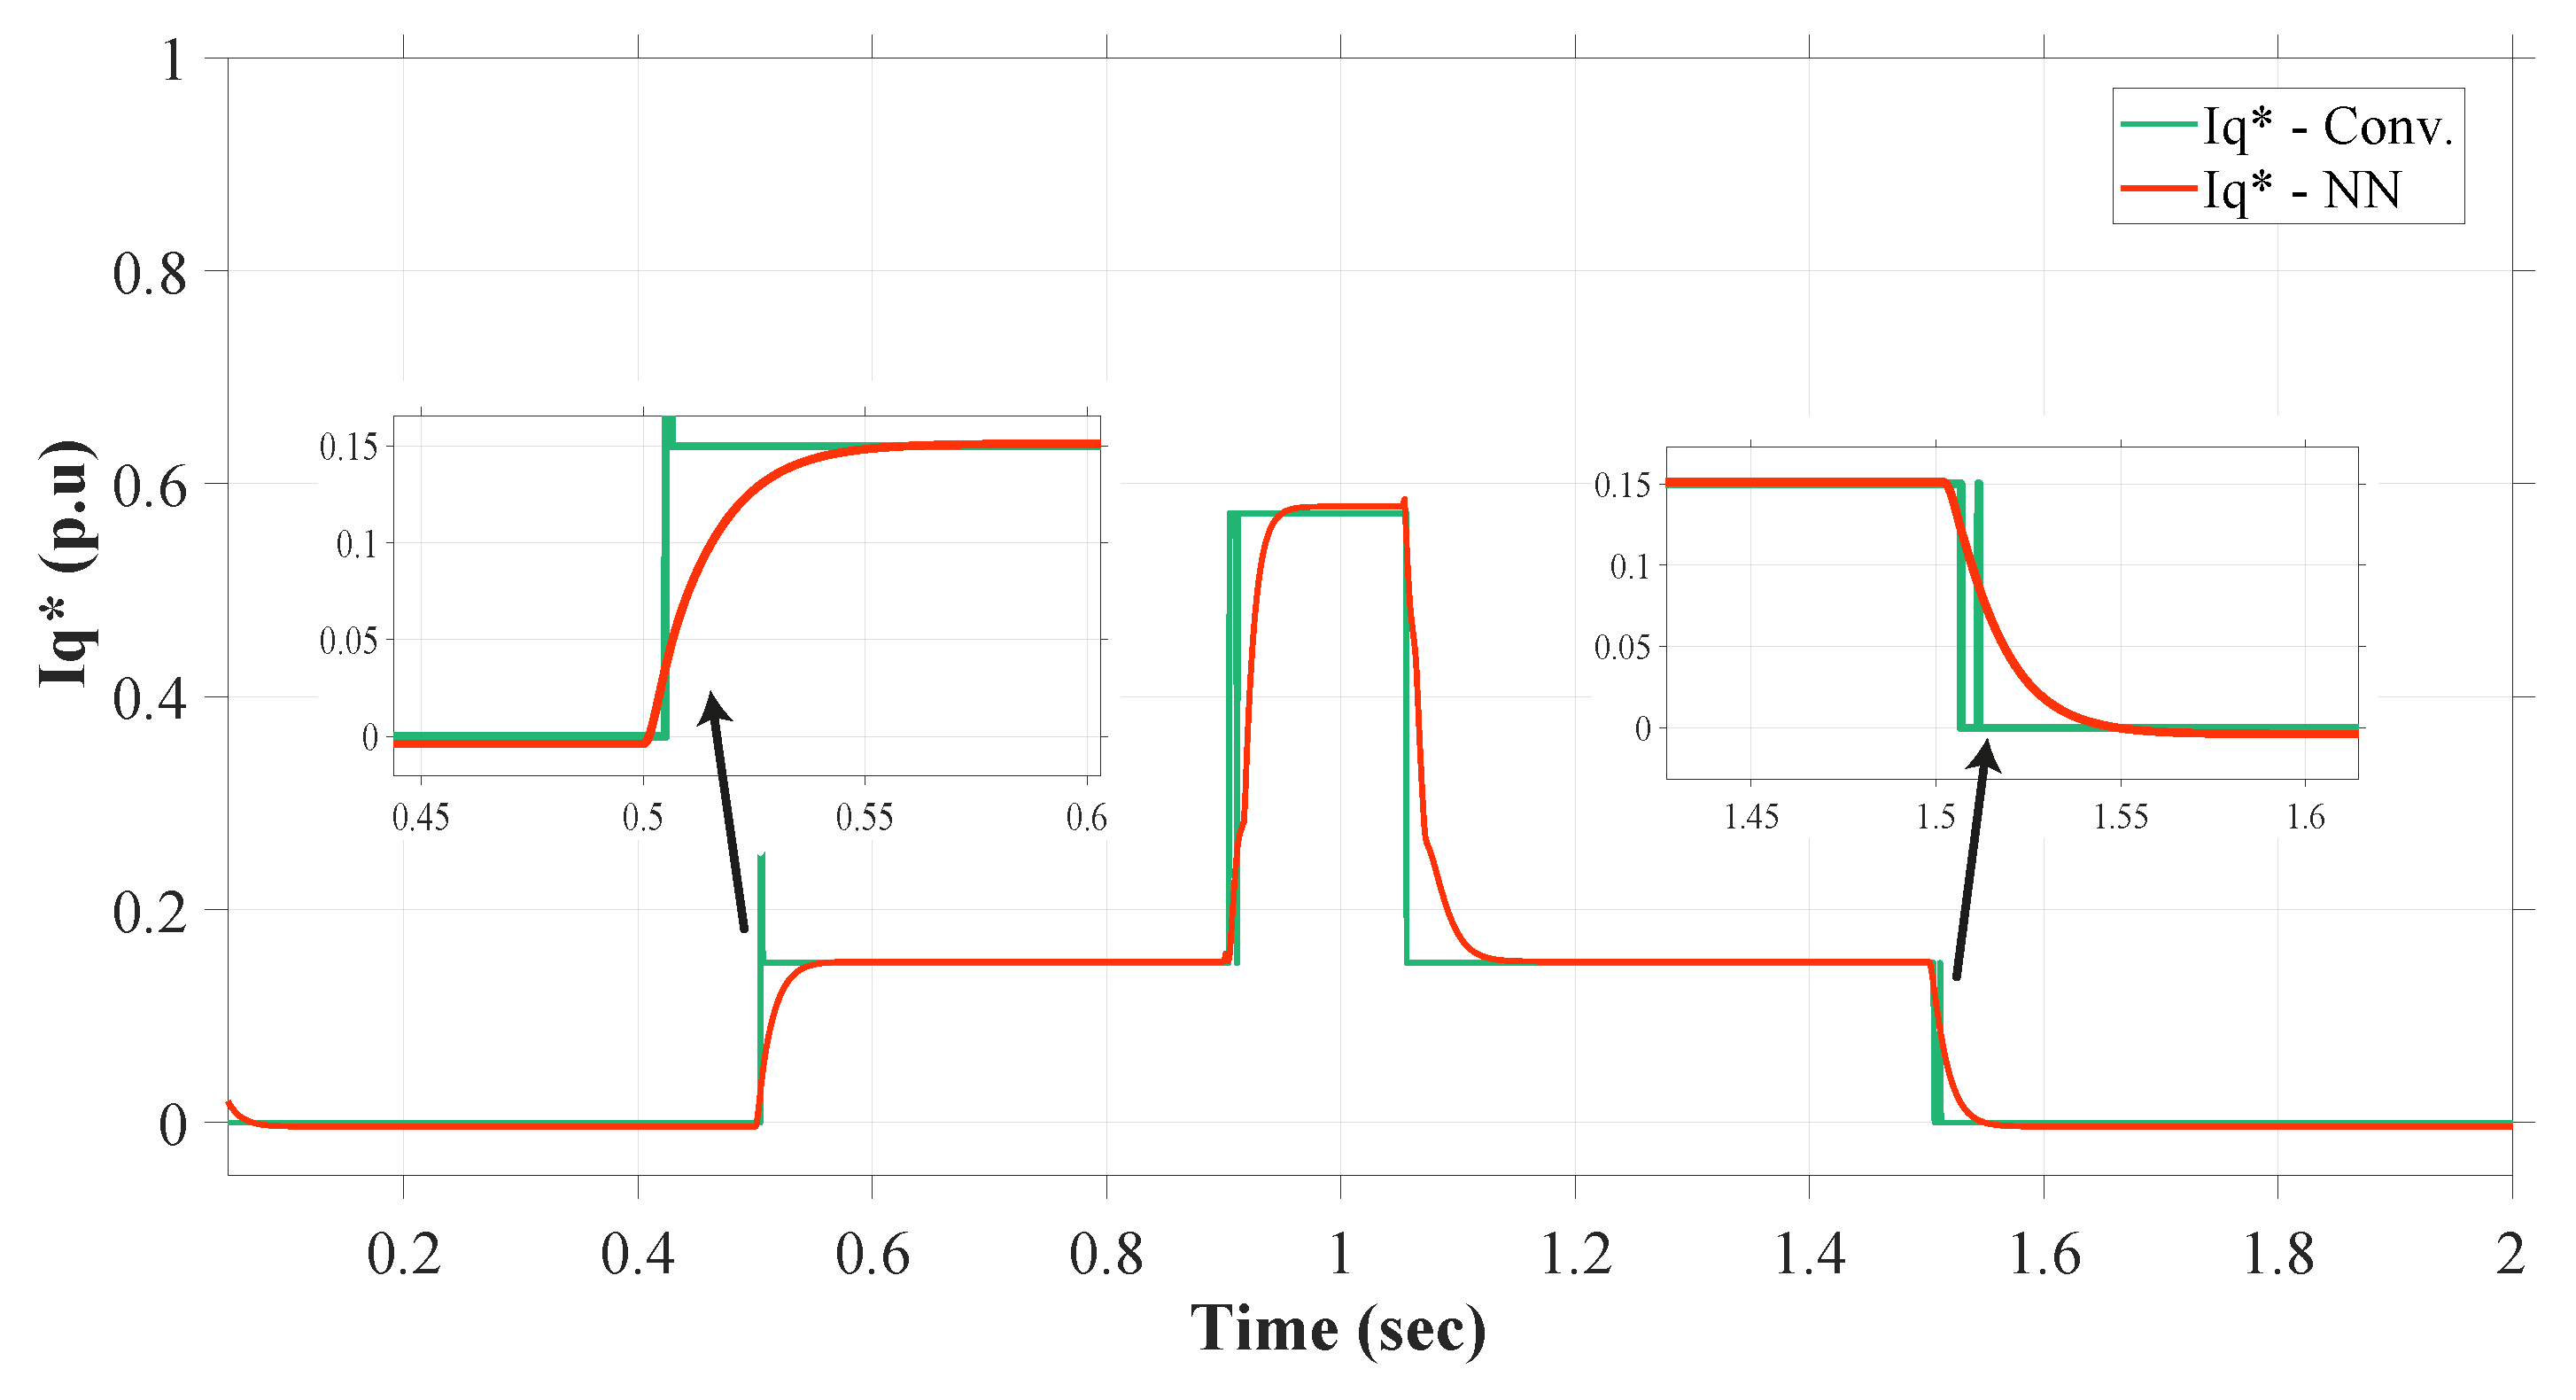
Now, for the detection of voltage sag under this second scenario and with a fault of about 38%, the proposed NN control stayed consistent with its advantages of robustness and stability. From Figure 16, it can be seen that the RMS method of fault detection is experiencing some problems in the face of undershoot at the time of fault occurrence. This distorted signal of sag detection causes further instability in the system. Again, with the overshoot at the time of fault clearance, the system might show irregular behavior because of this. Some minor delay is also observed in both the instances of changing conditions. So, because of these drawbacks, the injection of required reactive current that is attached with this signal also presents instability and some of the similar drawbacks, as can be seen from Figure 17.
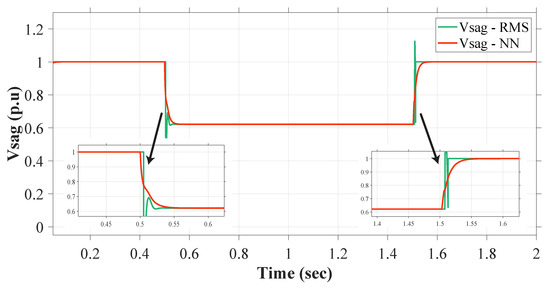
Figure 16.
Detection of fault (38% sag).
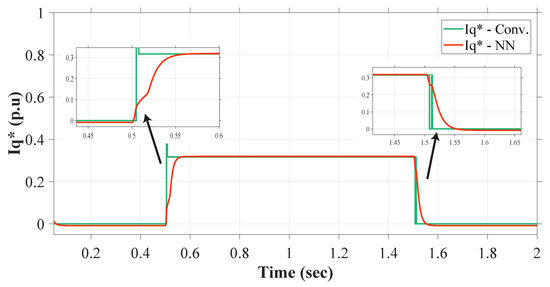
Figure 17.
Reactive current injection (38% sag).
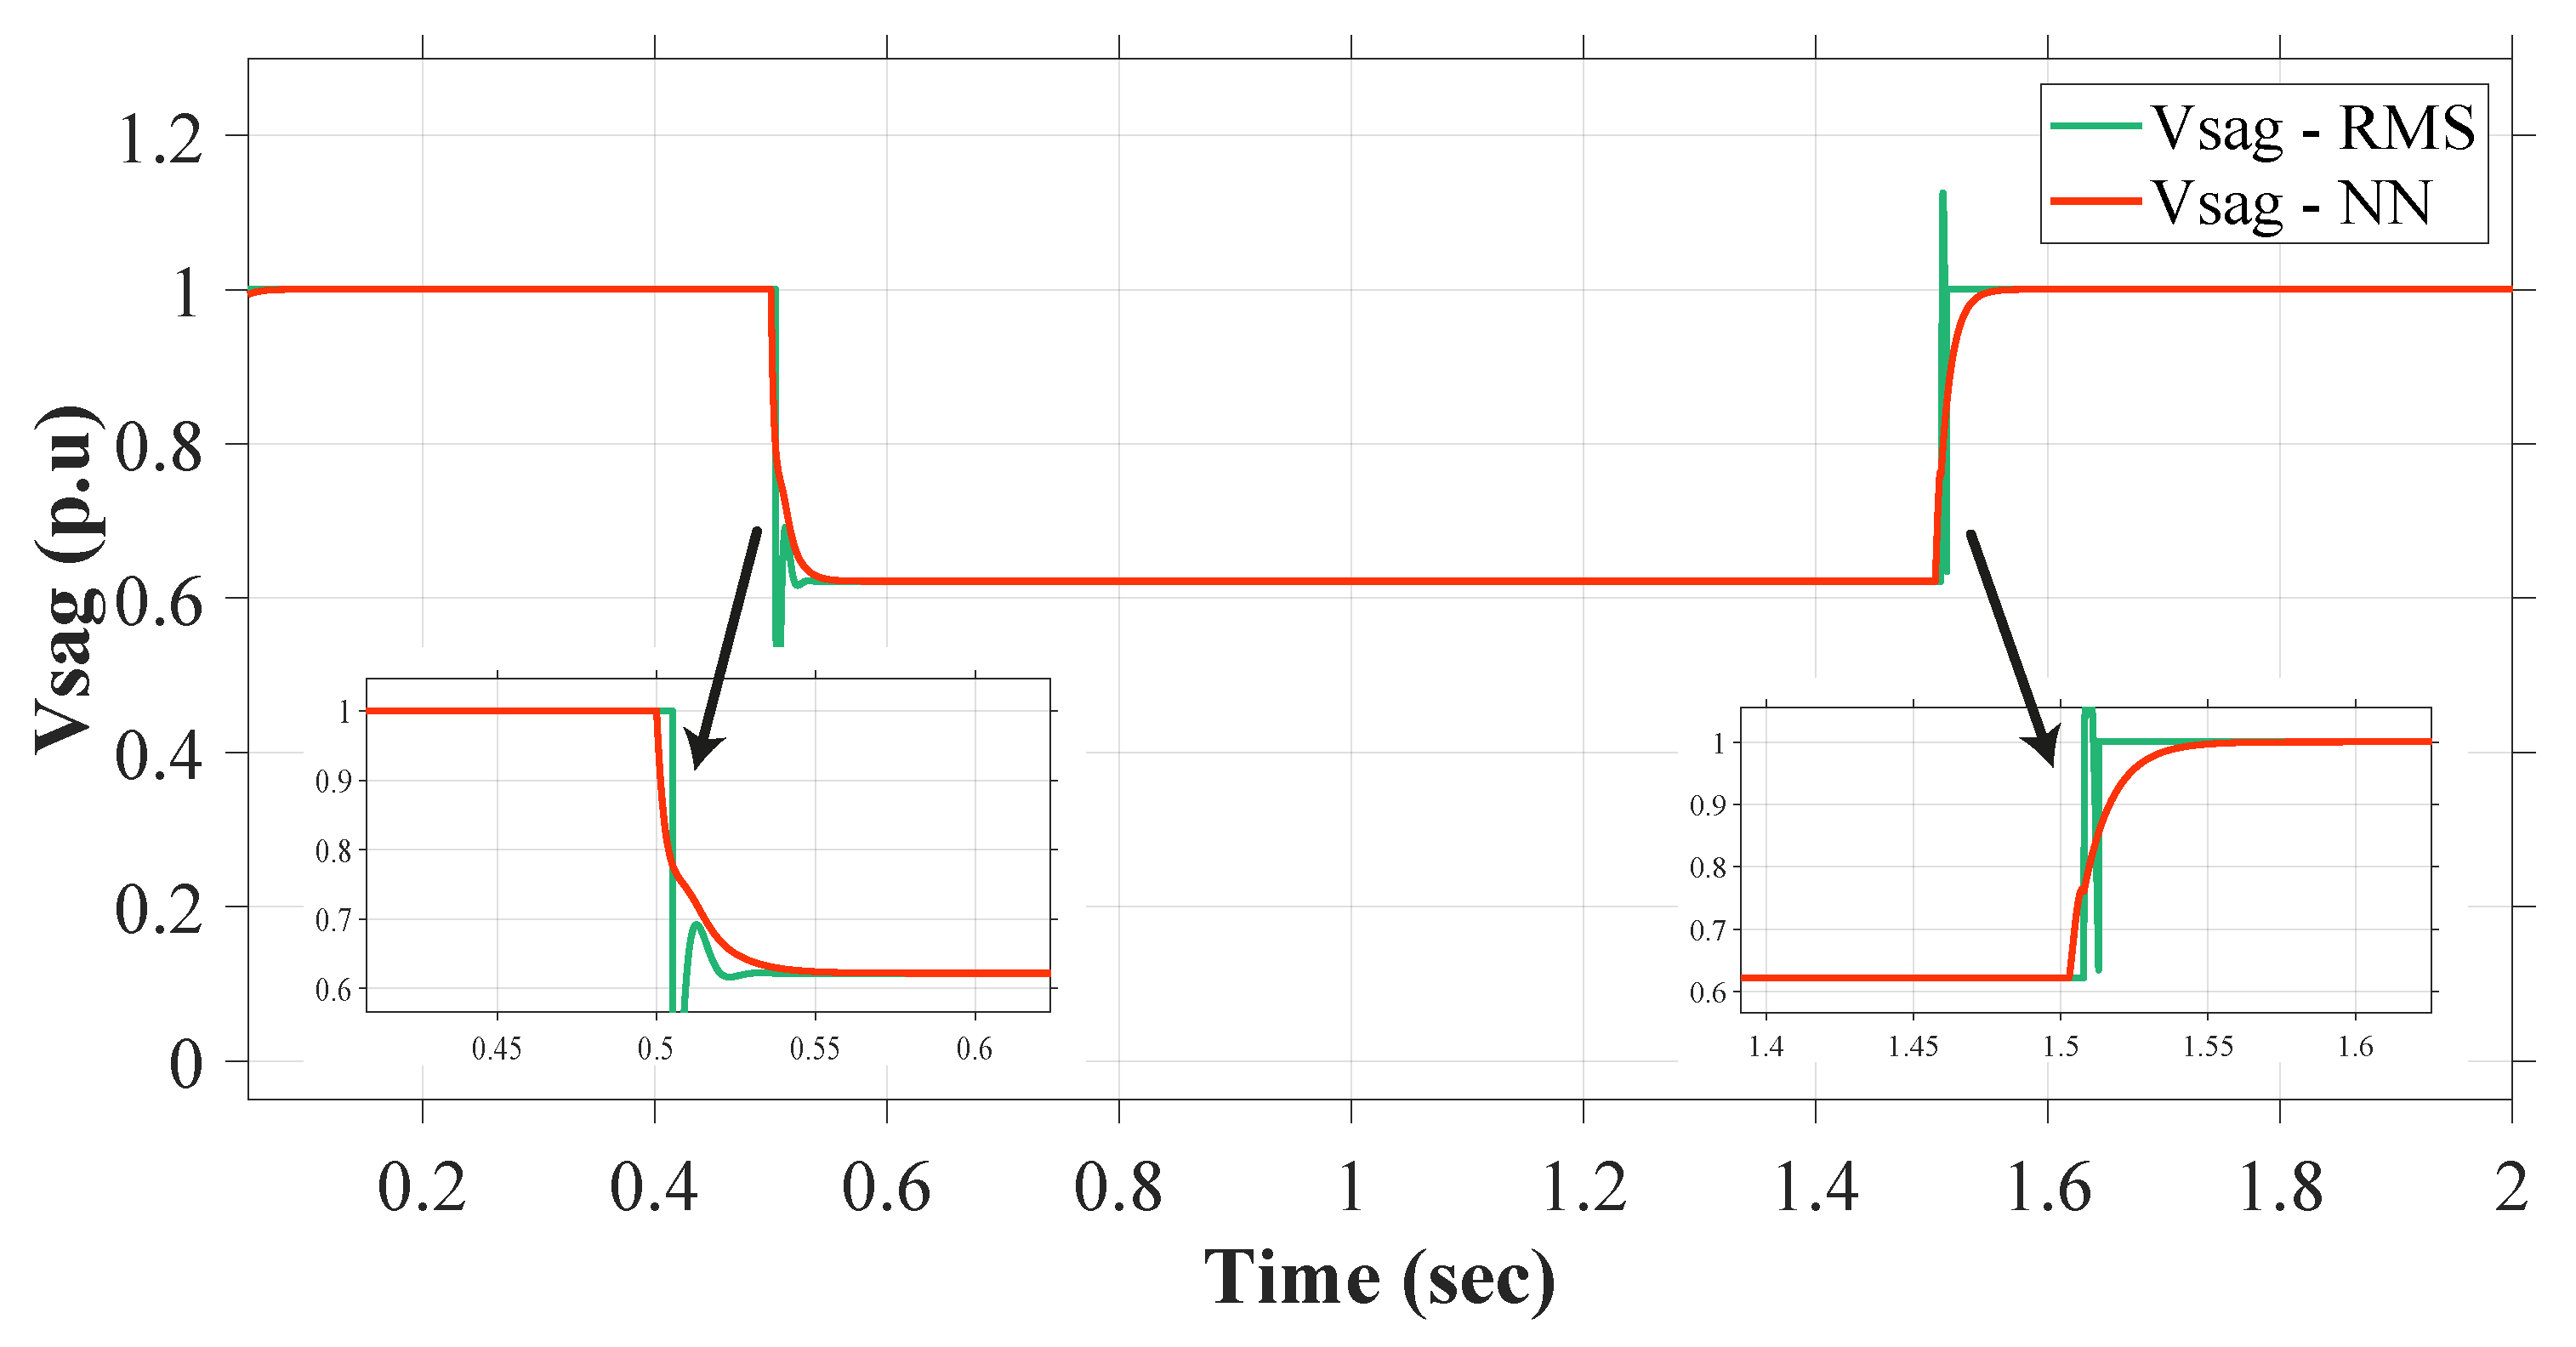
5.3. Case 3
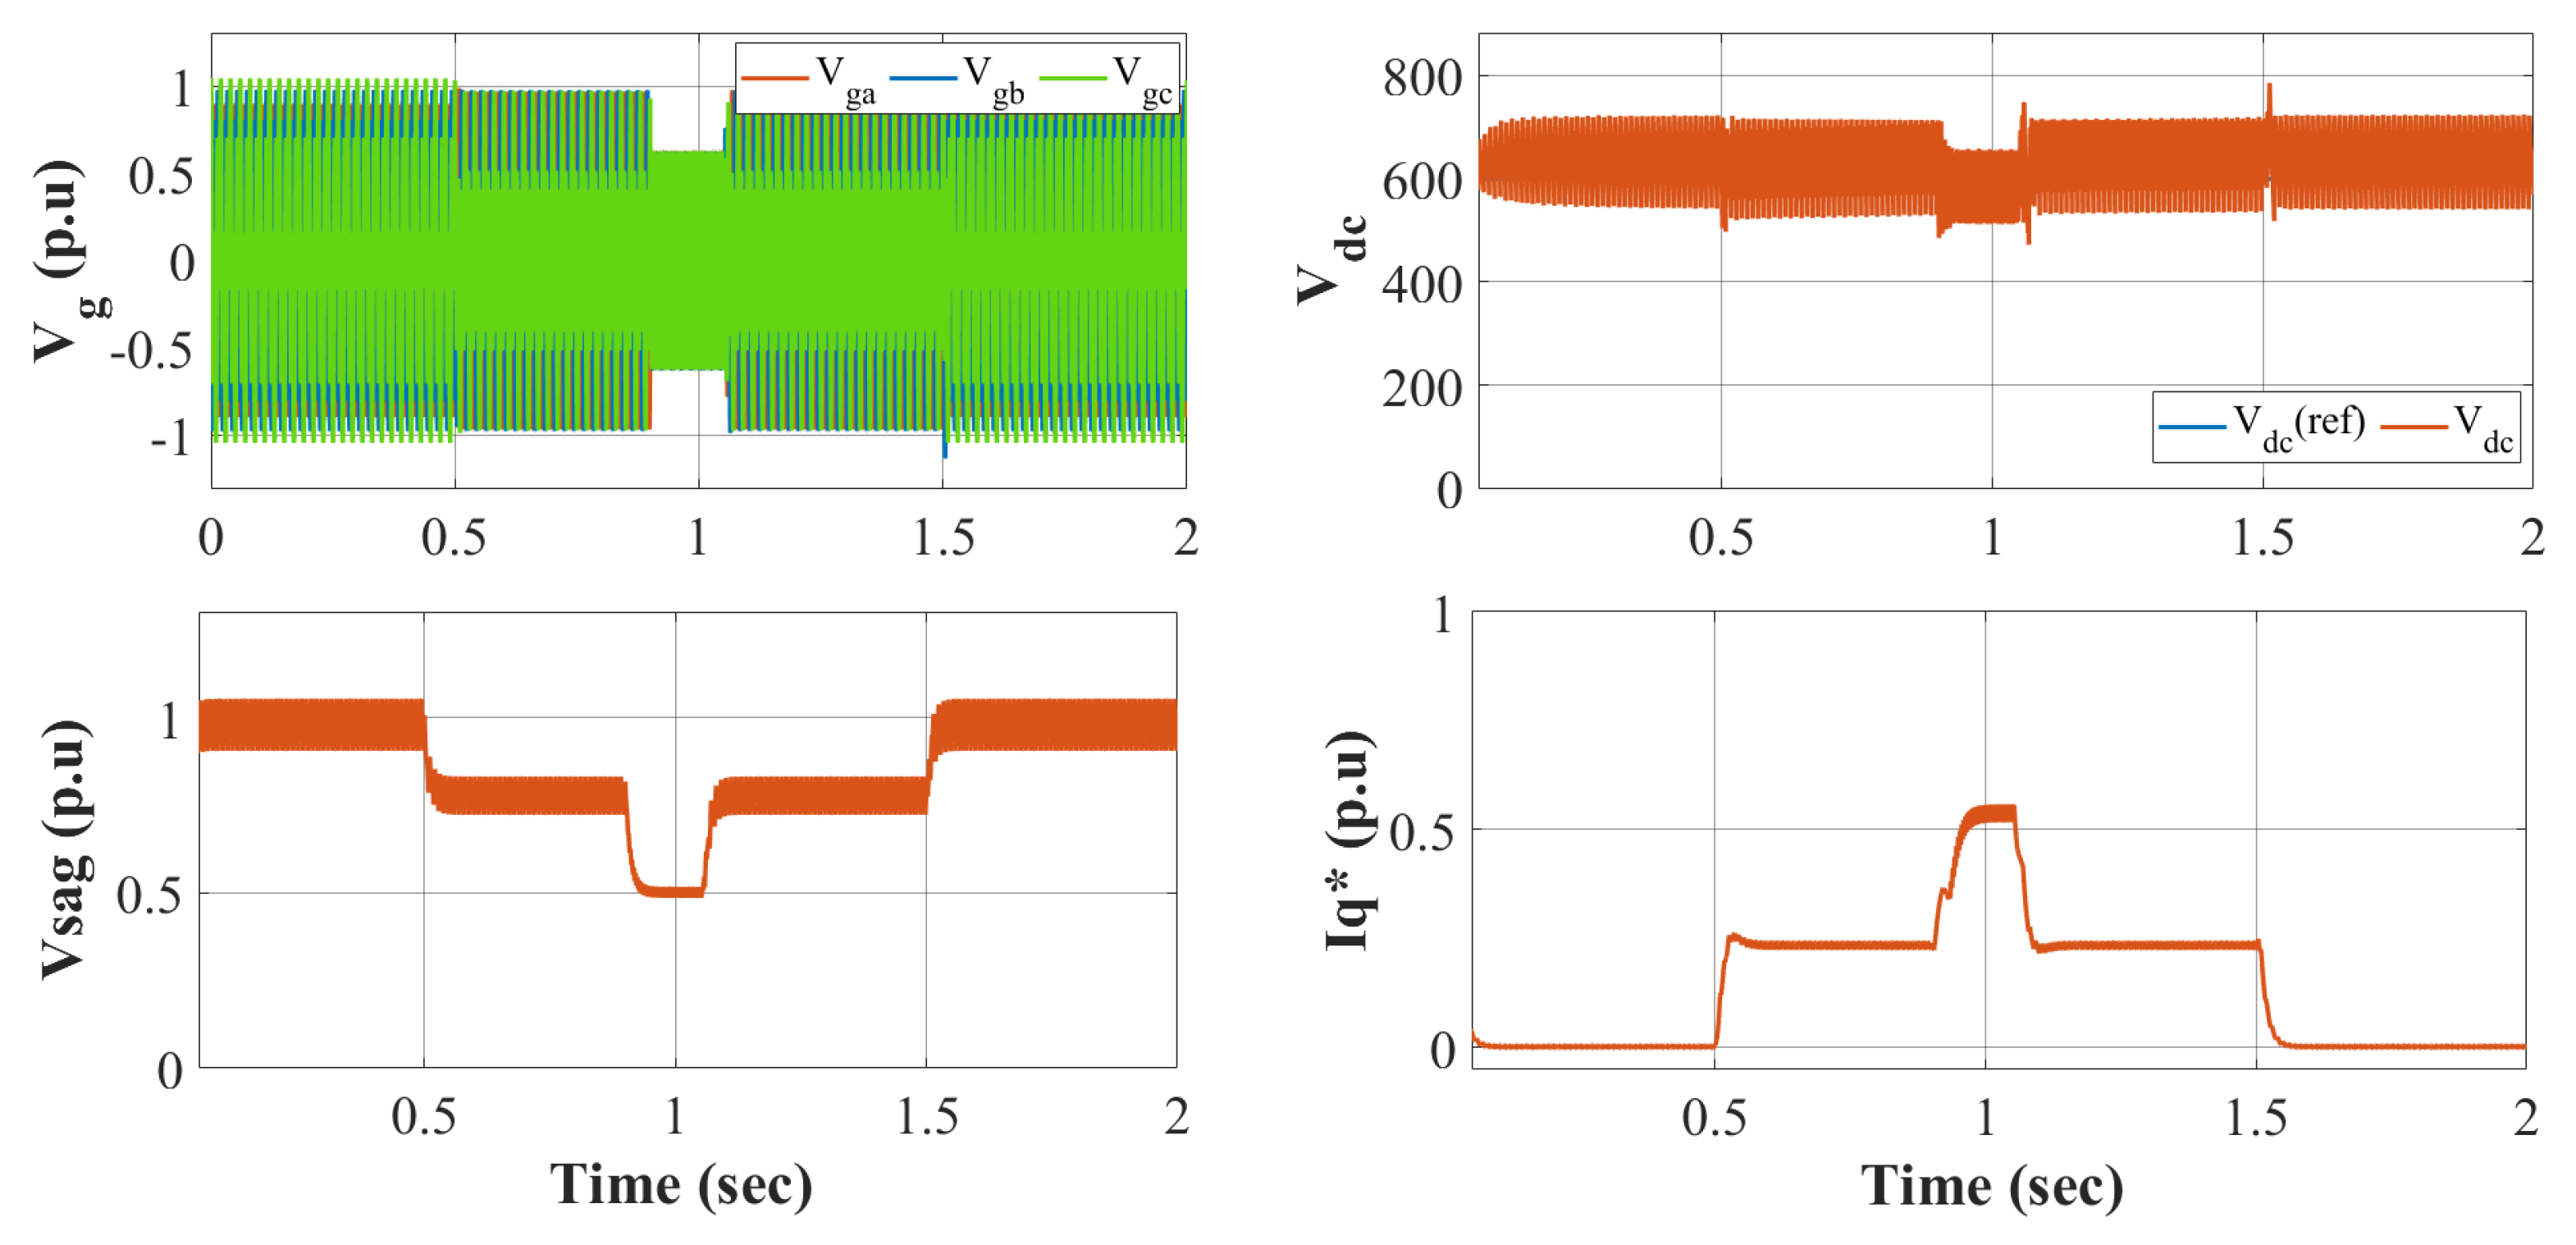
In the third case study, a simulation spanning a total of 2 s was conducted to examine the system’s behavior under complex fault condition. Initially, an 18% sag fault was introduced at the 0.5 s mark, persisting until 1.5 s. Amidst this ongoing fault, a subsequent fault of significantly greater magnitude occurred, resulting in a combined fault magnitude of approximately 60% sag. This scenario of concurrent and overlapping sags was employed to assess how the proposed system responded and demonstrated resilience in the face of such challenging circumstances. Yet again, the DC-chopper circuit performed its duty and kept the DC-link voltage in check even in these dire conditions. Figure 18 shows the results of DC-link voltage along with the grid voltage during these overlapping fault conditions.
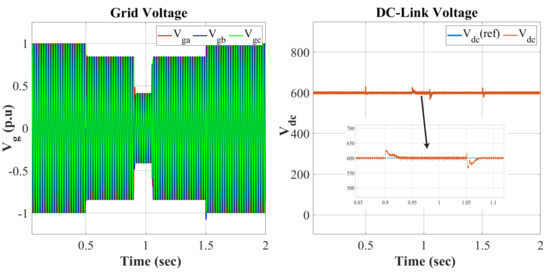
Figure 18.
Grid and DC-link voltage with overlapping sag.
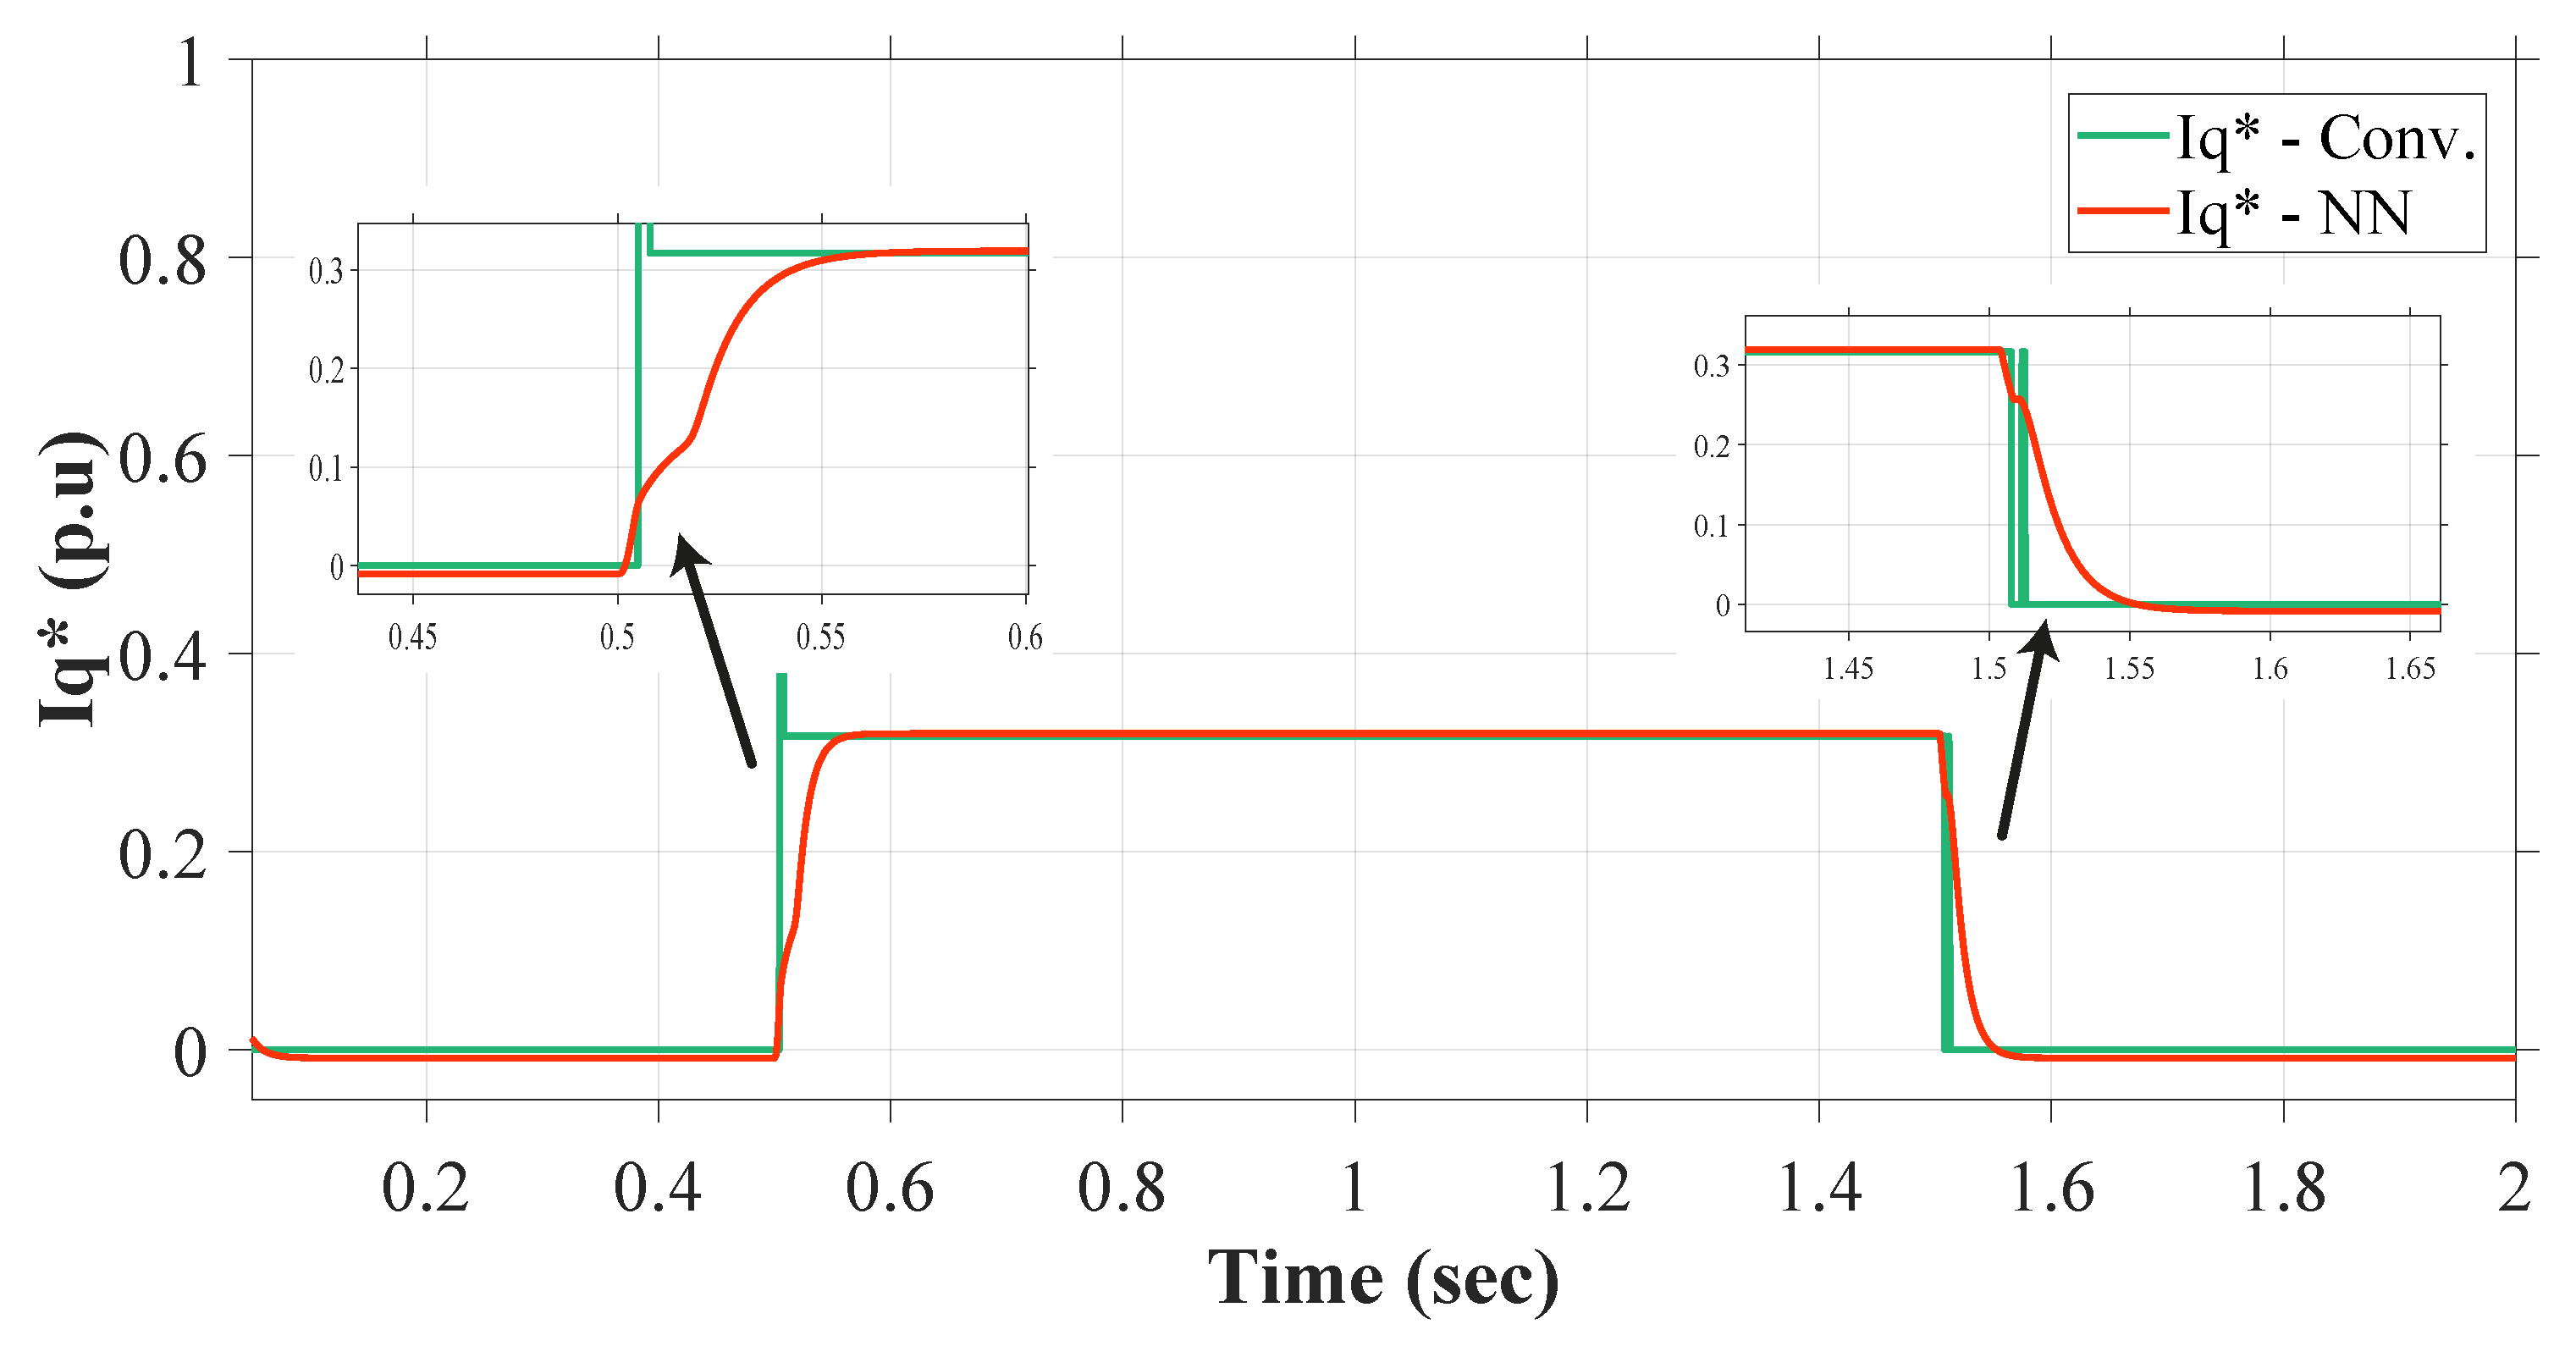
The superiority of the developed NN method for sag detection and necessary reactive current injection persisted consistently in these demanding circumstances, outperforming the RMS and conventional LVRT methods. The graphical depiction of this comparative analysis throughout the severe fault scenario is illustrated in Figure 19 and Figure 20.
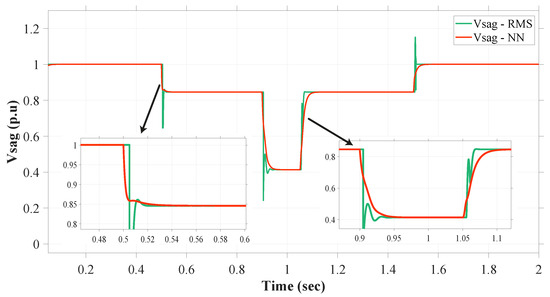
Figure 19.
Detection of fault (overlapping sag).
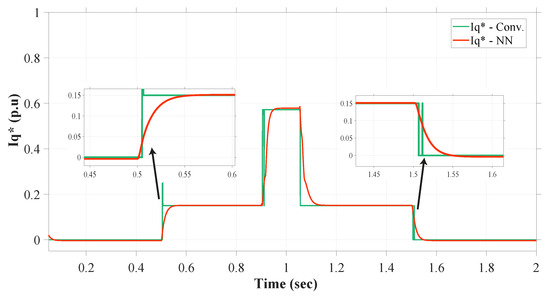
Figure 20.
Reactive current injection (overlapping sag).
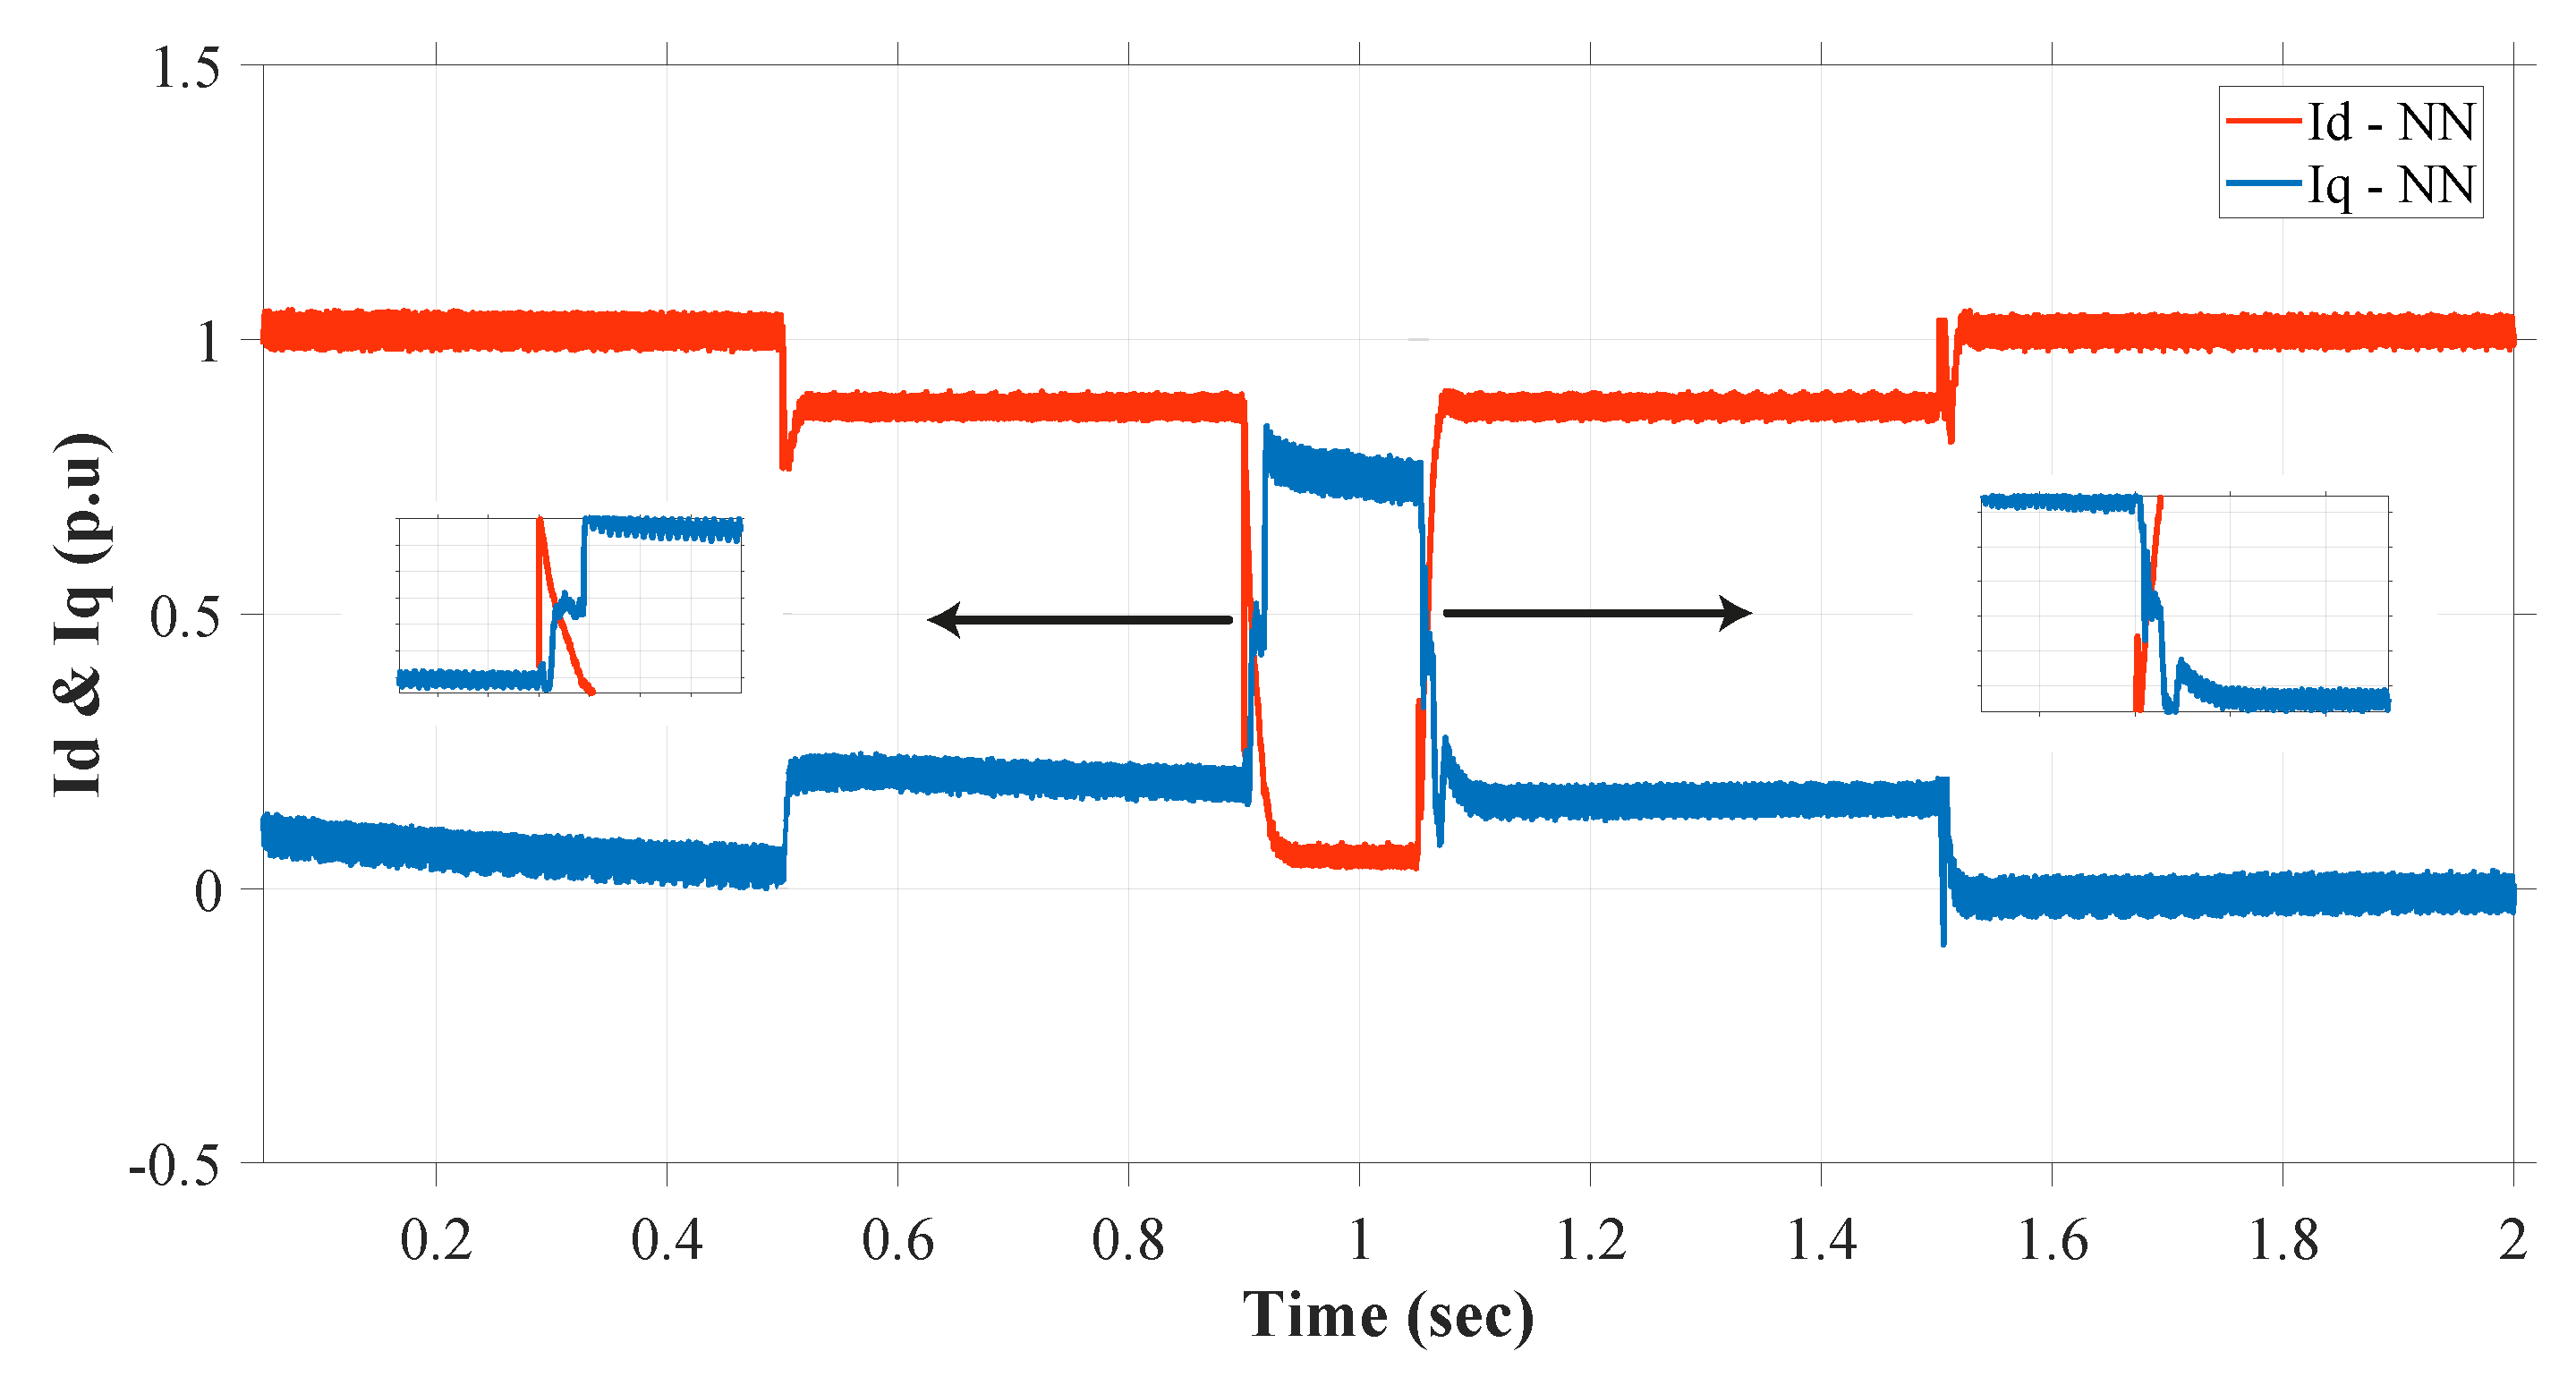
Figure 21 and Figure 22 illustrate the active and reactive currents flowing through the system under the influence of these fault scenarios, utilizing both the modeled NN control and the conventional control. Additionally, the figures provide a closer examination of the curve dynamics, allowing for an observation of the transition behavior exhibited by the control methods.

Figure 21.
Active and reactive currents with NN-based control (overlapping sag).
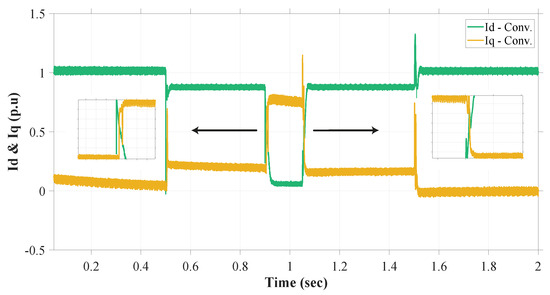
Figure 22.
Active and reactive currents with conventional control (overlapping sag).
In this context, the proposed NN control method once again demonstrates remarkable stability and resilience in the face of these intricate overlapping fault conditions. Notably, the proposed method effectively mitigates overshoots and undershoots, offering a smoother response compared to the less steady performance displayed by the conventional method.
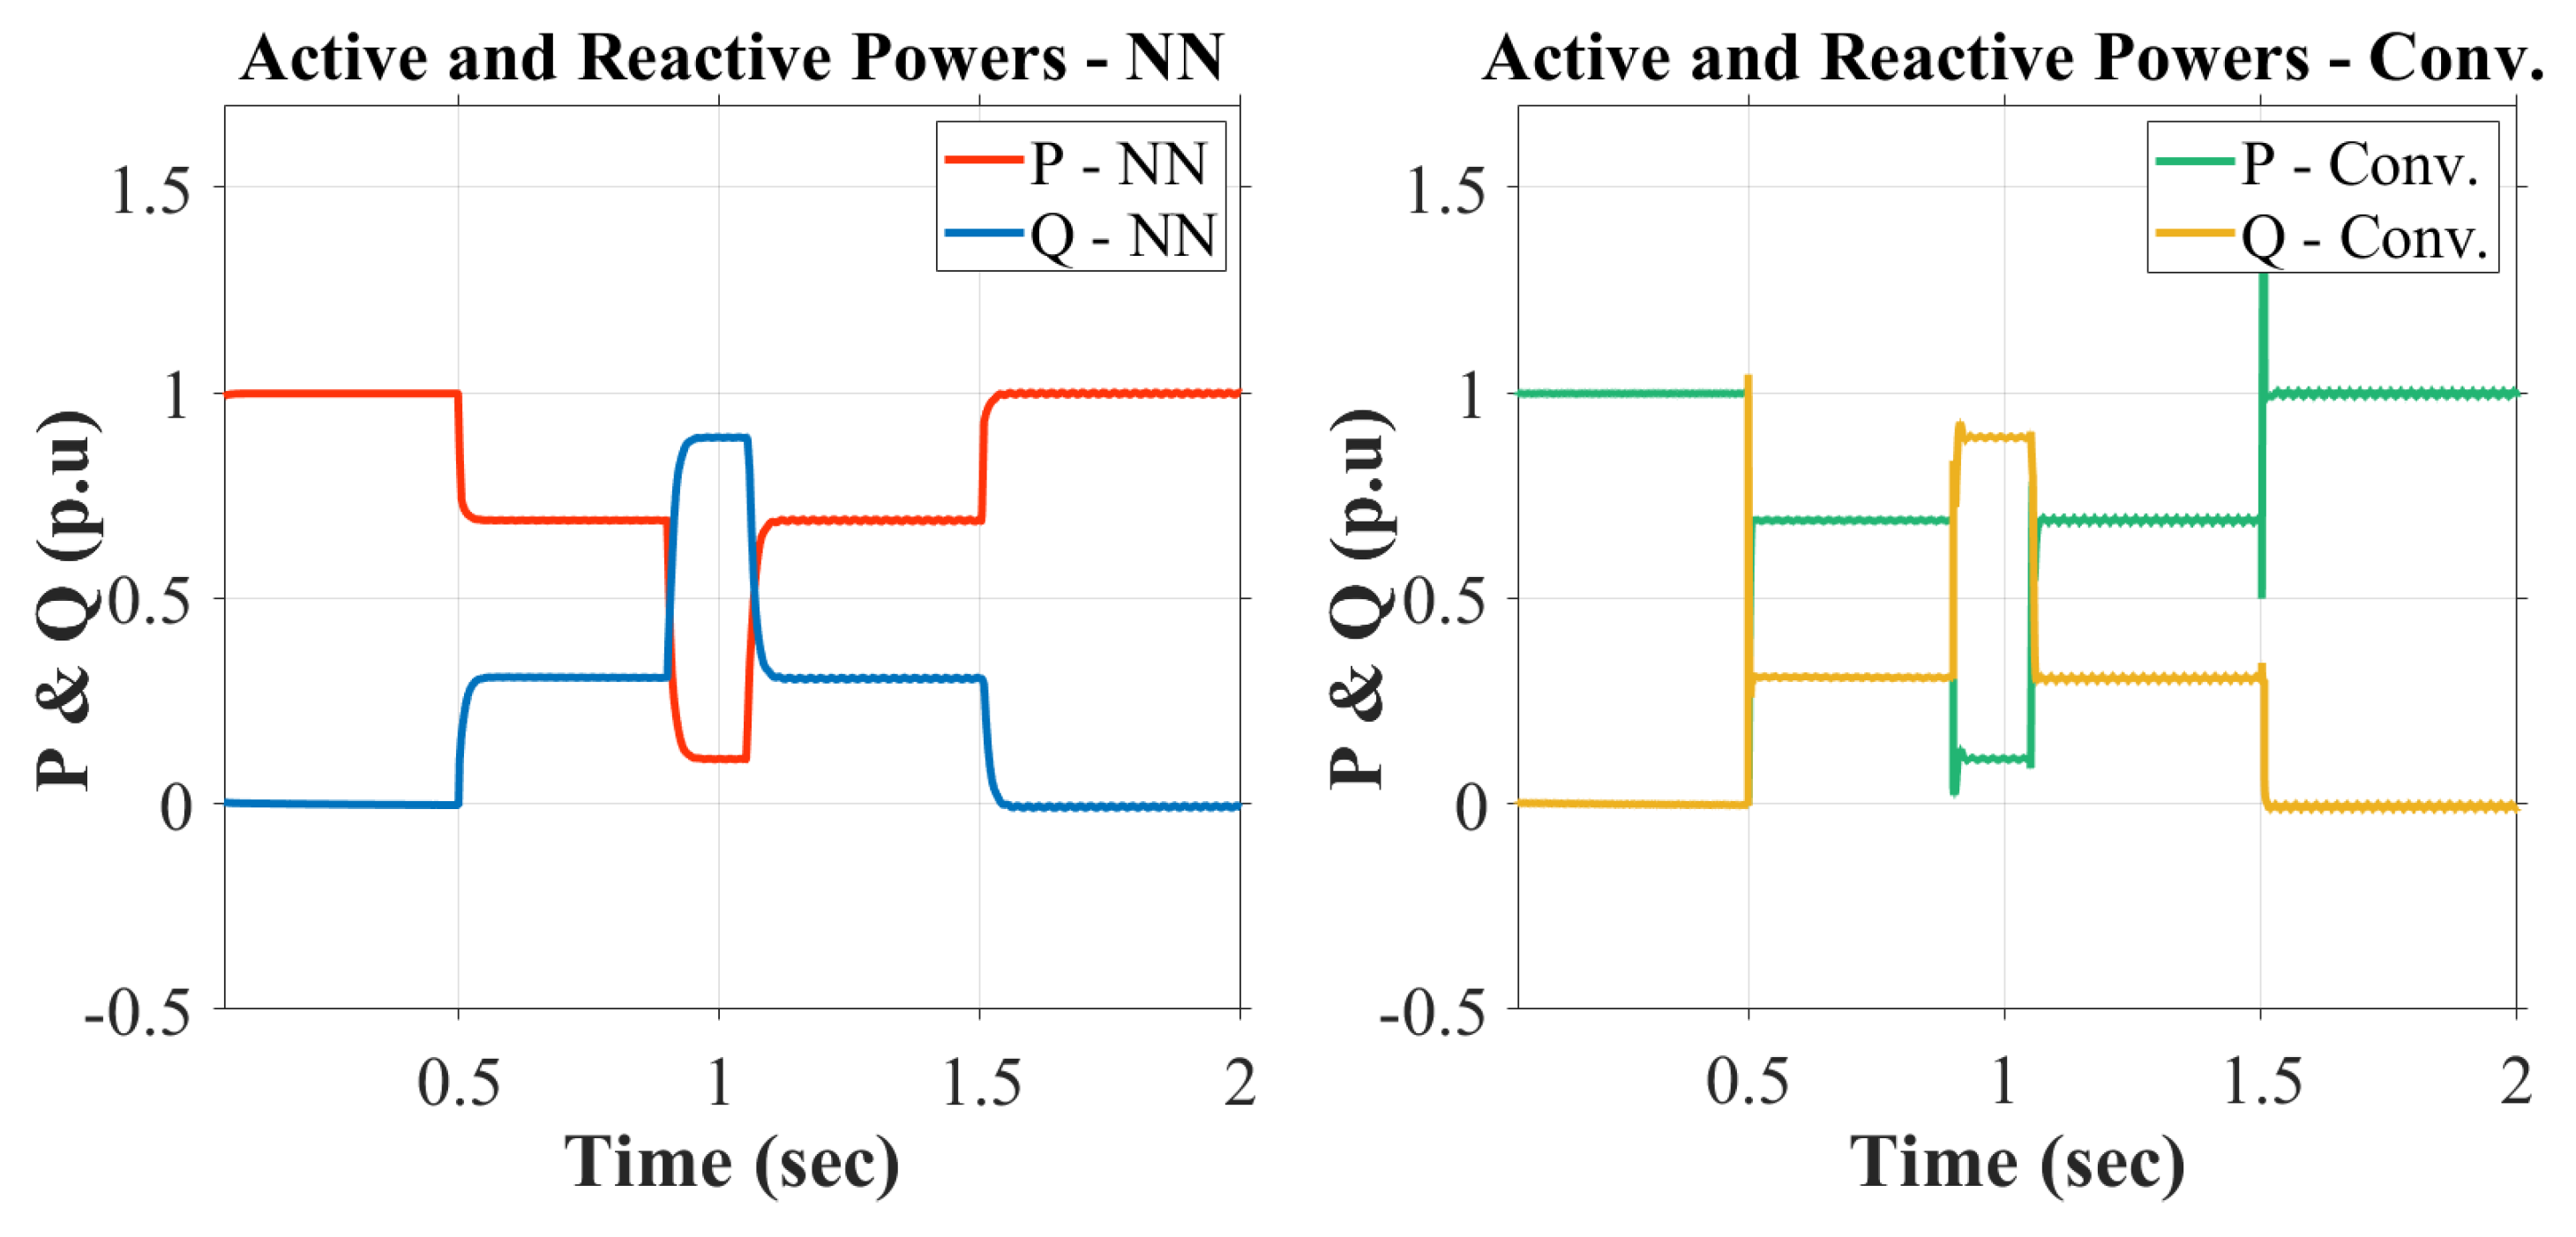
Ultimately, Figure 23 showcases the resultant active and reactive power dynamics within the system, employing the two examined methods. Undoubtedly, the sustained superiority of the proposed NN control system’s outcomes is evident, emphasizing its enduring stability and resilience even in the face of such severe sag conditions.
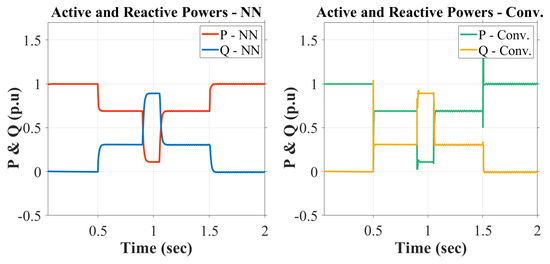
Figure 23.
Active and reactive powers (overlapping sag).
5.4. Case 4
In case 4, we further test the ruggedness of the proposed NN-based LVRT control under harmonically polluted environments. For this test case, the harmonic disturbances were introduced into the voltage of grid (); this is because our proposed NN-based control is majorly dependent on the measurements taken from the the grid. Figure 24 presents the results obtained under the conditions of continuous 3rd harmonic disturbance and voltage sags with the proposed NN-based LVRT control.

Figure 24.
Results of NN-based control under 3rd harmonic disturbance.
Figure 24 shows grid voltage (), DC-link voltage (), detection of sag voltage (), and required reactive current injection () going through the conditions of fault in such a harmonically polluted environment. There is some distortion observed in the resultant signals from the test scenario, but, overall, the performance of the proposed NN control is up to the required mark, and it works well even under such dire conditions.
In Figure 25, another test scenario with a time span of 3 s is displayed. For this simulation, multiple harmonic distortion conditions were applied for three different time sections. From starting time to 1 s point, harmonic distortion of 3rd order was applied and the simulation was carried out. This simulation also carries three fault conditions, with the first starting at 0.3 s and ending at 1.2 s.
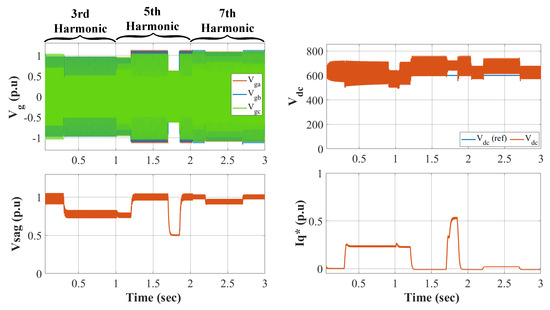
Figure 25.
Results of NN-based control under multiple harmonic disturbances.
Starting at 1 s point, harmonic distortion of 5th order was introduced to the system and this ended at 2 s point. Second fault of higher value was observed in the section of 5th order harmonic, from 1.7 s to 1.85 s. A third condition of 7th order harmonic was introduced from 2 s point to 3 s point; in this period, third fault was injected and the proposed NN-based LVRT control was extensively evaluated for these multiple harmonic distorted environments. The response of the proposed control is presented figuratively in Figure 25.
6. Conclusions
Contemporary requirements for grid-connected power systems necessitate the inclusion of auxiliary services such as uninterrupted power supply and LVRT mechanisms for device protection. This paper stems from a comprehensive study that led to the creation of an LVRT control strategy, designed to effectively manage diverse grid failure scenarios and fault states. Through assessments involving the system’s immunity against DC-link over-voltage, the DC-chopper circuit was utilized. Leveraging the capabilities of the proposed NN model, the system demonstrated the capability to identify specific failure types and promptly supply the necessary reactive current injections to ensure stable and uninterrupted operations.
The seamless integration of the custom-designed NN control model brought about notable enhancements within the photovoltaic (PV) microgrid system, including refined control mechanisms, heightened resilience, augmented system stability, minimized losses, and a more adaptable system architecture. The NN control model’s proficiency in mitigating voltage disturbances and furnishing reactive power support during instances of low-voltage faults played a pivotal role in ensuring the reliable and efficient operation of the PV microgrid system. The development and evaluation of this system hinged on cutting-edge technologies, showcasing the imperative role of innovative approaches in shaping modern power systems.
Author Contributions
M.A.K. designed the proposed control, performed the simulation, and wrote the paper. J.K. analyzed data and wrote the paper. All authors have read and agreed to the published version of the manuscript.
Funding
This study was supported by a research fund from Chosun University, 2022.
Data Availability Statement
Data can be made available under reasonable requests.
Conflicts of Interest
The authors declare no conflict of interest.
Abbreviations
The following abbreviations are used in this manuscript:
| GCPV | Grid-Connected Photovoltaic System |
| LVRT | Low-Voltage Ride Through |
| NN | Neural Network |
| RMS | Root Mean Square |
| DG | Distributed Generation |
| MPP | Maximum Power Point |
| PCC | Point of Common Coupling |
| PR | Proportional Resonant |
| PLL | Phase-Locked Loop |
| FCL | Fault-Current Limiters |
| CSS | Current Saturation Strategy |
| PSO | Partical Swarm Optimization |
| P&O | Perturb and Observe |
| VSI | Voltage Source Inverter |
| SRF | Synchronous Reference Frame |
| ANN | Artificial Neural Network |
| MSE | Mean Squared Error |
References
- Joshi, J.; Swami, A.; Jately, V.; Azzopardi, B. A comprehensive review of control strategies to overcome challenges during LVRT in PV systems. IEEE Access 2021, 9, 121804–121834. [Google Scholar] [CrossRef]
- Tang, C.; Chen, Y.; Chen, Y. PV power system With multi-mode operation and low-voltage ride-through capability. IEEE Trans. Ind. Electron. 2015, 62, 7524–7533. [Google Scholar] [CrossRef]
- Shetwi, A.; Sujod, M.; Blaabjerg, F. Low voltage ride-through capability control for single-stage inverter-based grid-connected photovoltaic power plant. Sol. Energy 2018, 159, 665–681. [Google Scholar] [CrossRef]
- Peter, M.; Ramon, Z.; Tek-Tjing, L. The role of inertia for grid flexibility under high penetration of variable renewables—A review of challenges and solutions. Renew. Sustain. Energy Rev. 2021, 147, 111223. [Google Scholar]
- Ding, G.; Gao, F.; Tian, H.; Ma, C.; Chen, M.; He, G.; Liu, Y. Adaptive DC-link voltage control of two-stage photovoltaic inverter during low voltage ride-through operation. IEEE Trans. Power Electron. 2016, 31, 4182–4194. [Google Scholar] [CrossRef]
- Zeng, D.; Guo, J.; Ding, M.; Geng, D. Fault ride-through capability enhancement by ADAPATIVE Voltage Support Control for inverter interfaced distributed generation. In Proceedings of the 5th International Conference on Electric Utility Deregulation and Restructuring and Power Technologies (DRPT), Changsha, China, 26–29 November 2015. [Google Scholar]
- Miret, J.; Castilla, M.; Camacho, A.; Vicuña, L.G.; Matas, J. Control scheme for photovoltaic three-phase inverters to minimize peak currents during unbalanced grid-voltage sags. IEEE Trans. Power Electron. 2012, 27, 4262–4271. [Google Scholar] [CrossRef]
- Yang, Y.; Blaabjerg, F.; Zou, Z. Benchmarking of Grid Fault modes in single-phase grid-connected photovoltaic systems. IEEE Trans. Ind. Appl. 2013, 49, 2167–2176. [Google Scholar] [CrossRef]
- Vasquez, J.C.; Mastromauro, R.A.; Guerrero, J.M.; Liserre, M. Voltage support provided by a droop-controlled multifunctional inverter. IEEE Trans. Ind. Electron. 2009, 56, 4510–4519. [Google Scholar] [CrossRef]
- Ding, K.; Cheng, K.W.E.; Xue, X.D.; Divakar, B.P.; Xu, C.D.; Che, Y.B.; Wang, D.H.; Dong, P. A novel detection method for voltage sags. In Proceedings of the 2nd International Conference on Power Electronics Systems and Applications, Hong Kong, China, 12–14 November 2006. [Google Scholar]
- Silvestre, S.; Chouder, A.; Karatepe, E. Automatic fault detection in Grid Connected PV systems. Sol. Energy 2013, 94, 119–127. [Google Scholar] [CrossRef]
- Naderi, S.; Negnevitsky, M.; Muttaqi, K. A Modified DC Chopper for Limiting the Fault Current and Controlling the DC-Link Voltage to Enhance Fault Ride-Through Capability of Doubly-Fed Induction-Generator-Based Wind Turbine. IEEE Trans. Ind. Appl. 2019, 55, 2021–2032. [Google Scholar] [CrossRef]
- Al-Durra, A.; Fayyad, Y.; Muyeen, S.; Blaabjerg, F. Fault Ride-through of a Grid-connected Photovoltaic System with Quasi Z Source Inverter. Electr. Power Components Syst. 2016, 44, 1786–1800. [Google Scholar] [CrossRef]
- Islam, M.; Muttaqi, K.; Sutanto, D. A Novel Saturated Amorphous Alloy Core Based Fault Current Limiter for Improving the Low Voltage Ride Through Capability of Doubly-Fed Induction Generator Based Wind Turbines. IEEE Trans. Ind. Appl. 2021, 57, 2023–2034. [Google Scholar] [CrossRef]
- Ramirez, D.; Martinez, S.; Platero, C.; Blazquez, F.; de Castro, R. Low-Voltage Ride-Through Capability for Wind Generators Based on Dynamic Voltage Restorers. IEEE Trans. Energy Convers. 2011, 26, 195–203. [Google Scholar] [CrossRef]
- Döşoğlu, M.; Basa Arsoy, A.; Güvenç, U. Application of STATCOM-supercapacitor for low-voltage ride-through capability in DFIG-based wind farm. Neural Comput. Appl. 2016, 28, 2665–2674. [Google Scholar] [CrossRef]
- Pal, A.; Pal, D.; Panigrahi, B.J. A Current Saturation Strategy for Enhancing the Low Voltage Ride-Through Capability of Grid-Forming Inverters. IEEE Trans. Circuits Syst. 2023, 70, 1009–1013. [Google Scholar] [CrossRef]
- Jiang, Y.; Li, X.; Qin, C.; Xing, X.; Chen, Z. Improved Particle Swarm Optimization Based Selective Harmonic Elimination and Neutral Point Balance Control for Three-Level Inverter in Low-Voltage Ride-Through Operation. IEEE Trans. Ind. Inform. 2022, 18, 642–652. [Google Scholar] [CrossRef]
- Fu, X.; Li, S.; Fairbank, M.; Wunsch, D.C.; Alonso, E. Training Recurrent Neural Networks With the Levenberg–Marquardt Algorithm for Optimal Control of a Grid-Connected Converter. IEEE Trans. Neural Netw. Learn. Syst. 2015, 26, 1900–1912. [Google Scholar] [CrossRef]
- Hussain, A.; Sher, H.A.; Murtaza, A.H.; Al-Hadeed, K. Improved Voltage Controlled Three Phase Voltage Source Inverter Using Model Predictive Control for Standalone System. In Proceedings of the IECON (2018)-44th Annual Conference of the IEEE Industrial Electronics Society, Washington, DC, USA, 21–23 October 2018. [Google Scholar]
- Al-Shetwi, A.; Muhamad Zahim, S. Modeling and simulation of photovoltaic module with enhanced perturb and observe MPPT algorithm using Matlab/Simulink. ARPN J. Eng. Appl. Sci. 2016, 11, 12033–12038. [Google Scholar]
- Villalva, M.; Gazoli, J.; Filho, E. Comprehensive Approach to Modeling and Simulation of Photovoltaic Arrays. IEEE Trans. Power Electron. 2009, 24, 1198–1208. [Google Scholar] [CrossRef]
- Saravanan, S.; Ramesh Babu, N. Maximum power point tracking algorithms for photovoltaic system—A review. Renew. Sustain. Energy Rev. 2016, 57, 192–204. [Google Scholar] [CrossRef]
- Durusu, A.; Nakir, I.; Ajder, A.; Ayaz, R.; Akca, H.; Tanrioven, M. Performance Comparison of Widely-Used Maximum Power Point Tracker Algorithms under Real Environmental Conditions. Adv. Electr. Comput. Eng. 2014, 14, 89–94. [Google Scholar] [CrossRef]
- Usama, M.; Kim, J. Low-speed transient and steady-state performance analysis of IPMSM for nonlinear speed regulator with effective compensation scheme. Energies 2021, 14, 6679. [Google Scholar] [CrossRef]
- Usama, M.; Jaehong, K. Simplified model predicted current control method for speed control of non-silent permanent magnet synchronous motors. In Proceedings of the 3rd International Conference on Computing, Mathematics and Engineering Technologies (iCoMET), Sukkur, Pakistan, 29–30 January 2020. [Google Scholar]
- Azit, A.; Sulaiman, S.; Hussein, Z.; Balakhrisnan, M.; Busrah, A.; Devaraju, P.; Mohamed, A.; Kumaran, R.; Ramasami, A.; Ismail, M. TNB Technical Guidebook on Grid-Interconnection of Photovoltaic Power Generation System to LV and MV Networks; Tenaga Nasional Berhad: Kuala Lumpur, Malaysia, 2012; pp. 1–38. [Google Scholar]
- Saeedul Islam, G.M.; Al-Durra, A.; Muyeen, S.M.; Tamura, J. Low voltage ride through capability enhancement of grid connected large scale photovoltaic system. In Proceedings of the IECON-37th Annual Conference of the IEEE Industrial Electronics Society, Melbourne, VIC, Australia, 7–10 November 2011. [Google Scholar]
- Pannell, G.; Zahawi, B.; Atkinson, D.J.; Missailidis, P. Evaluation of the performance of a DC-link brake chopper as a DFIG low-voltage fault-ride-through device. IEEE Trans. Energy Convers. 2013, 28, 535–542. [Google Scholar] [CrossRef]
- Neumann, T.; Erlich, I. Modelling and control of photovoltaic inverter systems with respect to German grid code requirements. In Proceedings of the IEEE Power and Energy Society General Meeting, San Diego, CA, USA, 22–26 July 2012. [Google Scholar]
- Hassan, Z.; Amir, A.; Selvaraj, J.; Rahim, N.A. A review on current injection techniques for low-voltage ride-through and grid fault conditions in grid-connected photovoltaic system. In Solar Energy; Elsevier: Amsterdam, The Netherlands, 2020; pp. 851–873. [Google Scholar]
- Akpolat, A.N.; Habibi, M.R.; Baghaee, H.R.; Dursun, E.; Kuzucuoglu, A.E.; Yang, Y.; Dragicevic, T.; Blaabjerg, F. Dynamic Stabilization of DC Microgrids Using ANN-Based Model Predictive Control. IEEE Trans. Energy Convers. 2022, 37, 999–1010. [Google Scholar] [CrossRef]
- Okwako, O.E.; Lin, Z.; Xin, M.; Premkumar, K.; Rodgers, A.J. Neural Network Controlled Solar PV Battery Powered Unified Power Quality Conditioner for Grid Connected Operation. Energies 2022, 15, 6825. [Google Scholar] [CrossRef]


Disclaimer/Publisher’s Note: The statements, opinions and data contained in all publications are solely those of the individual author(s) and contributor(s) and not of MDPI and/or the editor(s). MDPI and/or the editor(s) disclaim responsibility for any injury to people or property resulting from any ideas, methods, instructions or products referred to in the content. |
© 2023 by the authors. Licensee MDPI, Basel, Switzerland. This article is an open access article distributed under the terms and conditions of the Creative Commons Attribution (CC BY) license (https://creativecommons.org/licenses/by/4.0/).