
Integrated Methodology for Community-Oriented Energy Investments: Architecture, Implementation, and Assessment for the Case of Nisyros Island

 , , , ,
Abstract
:1. Introduction
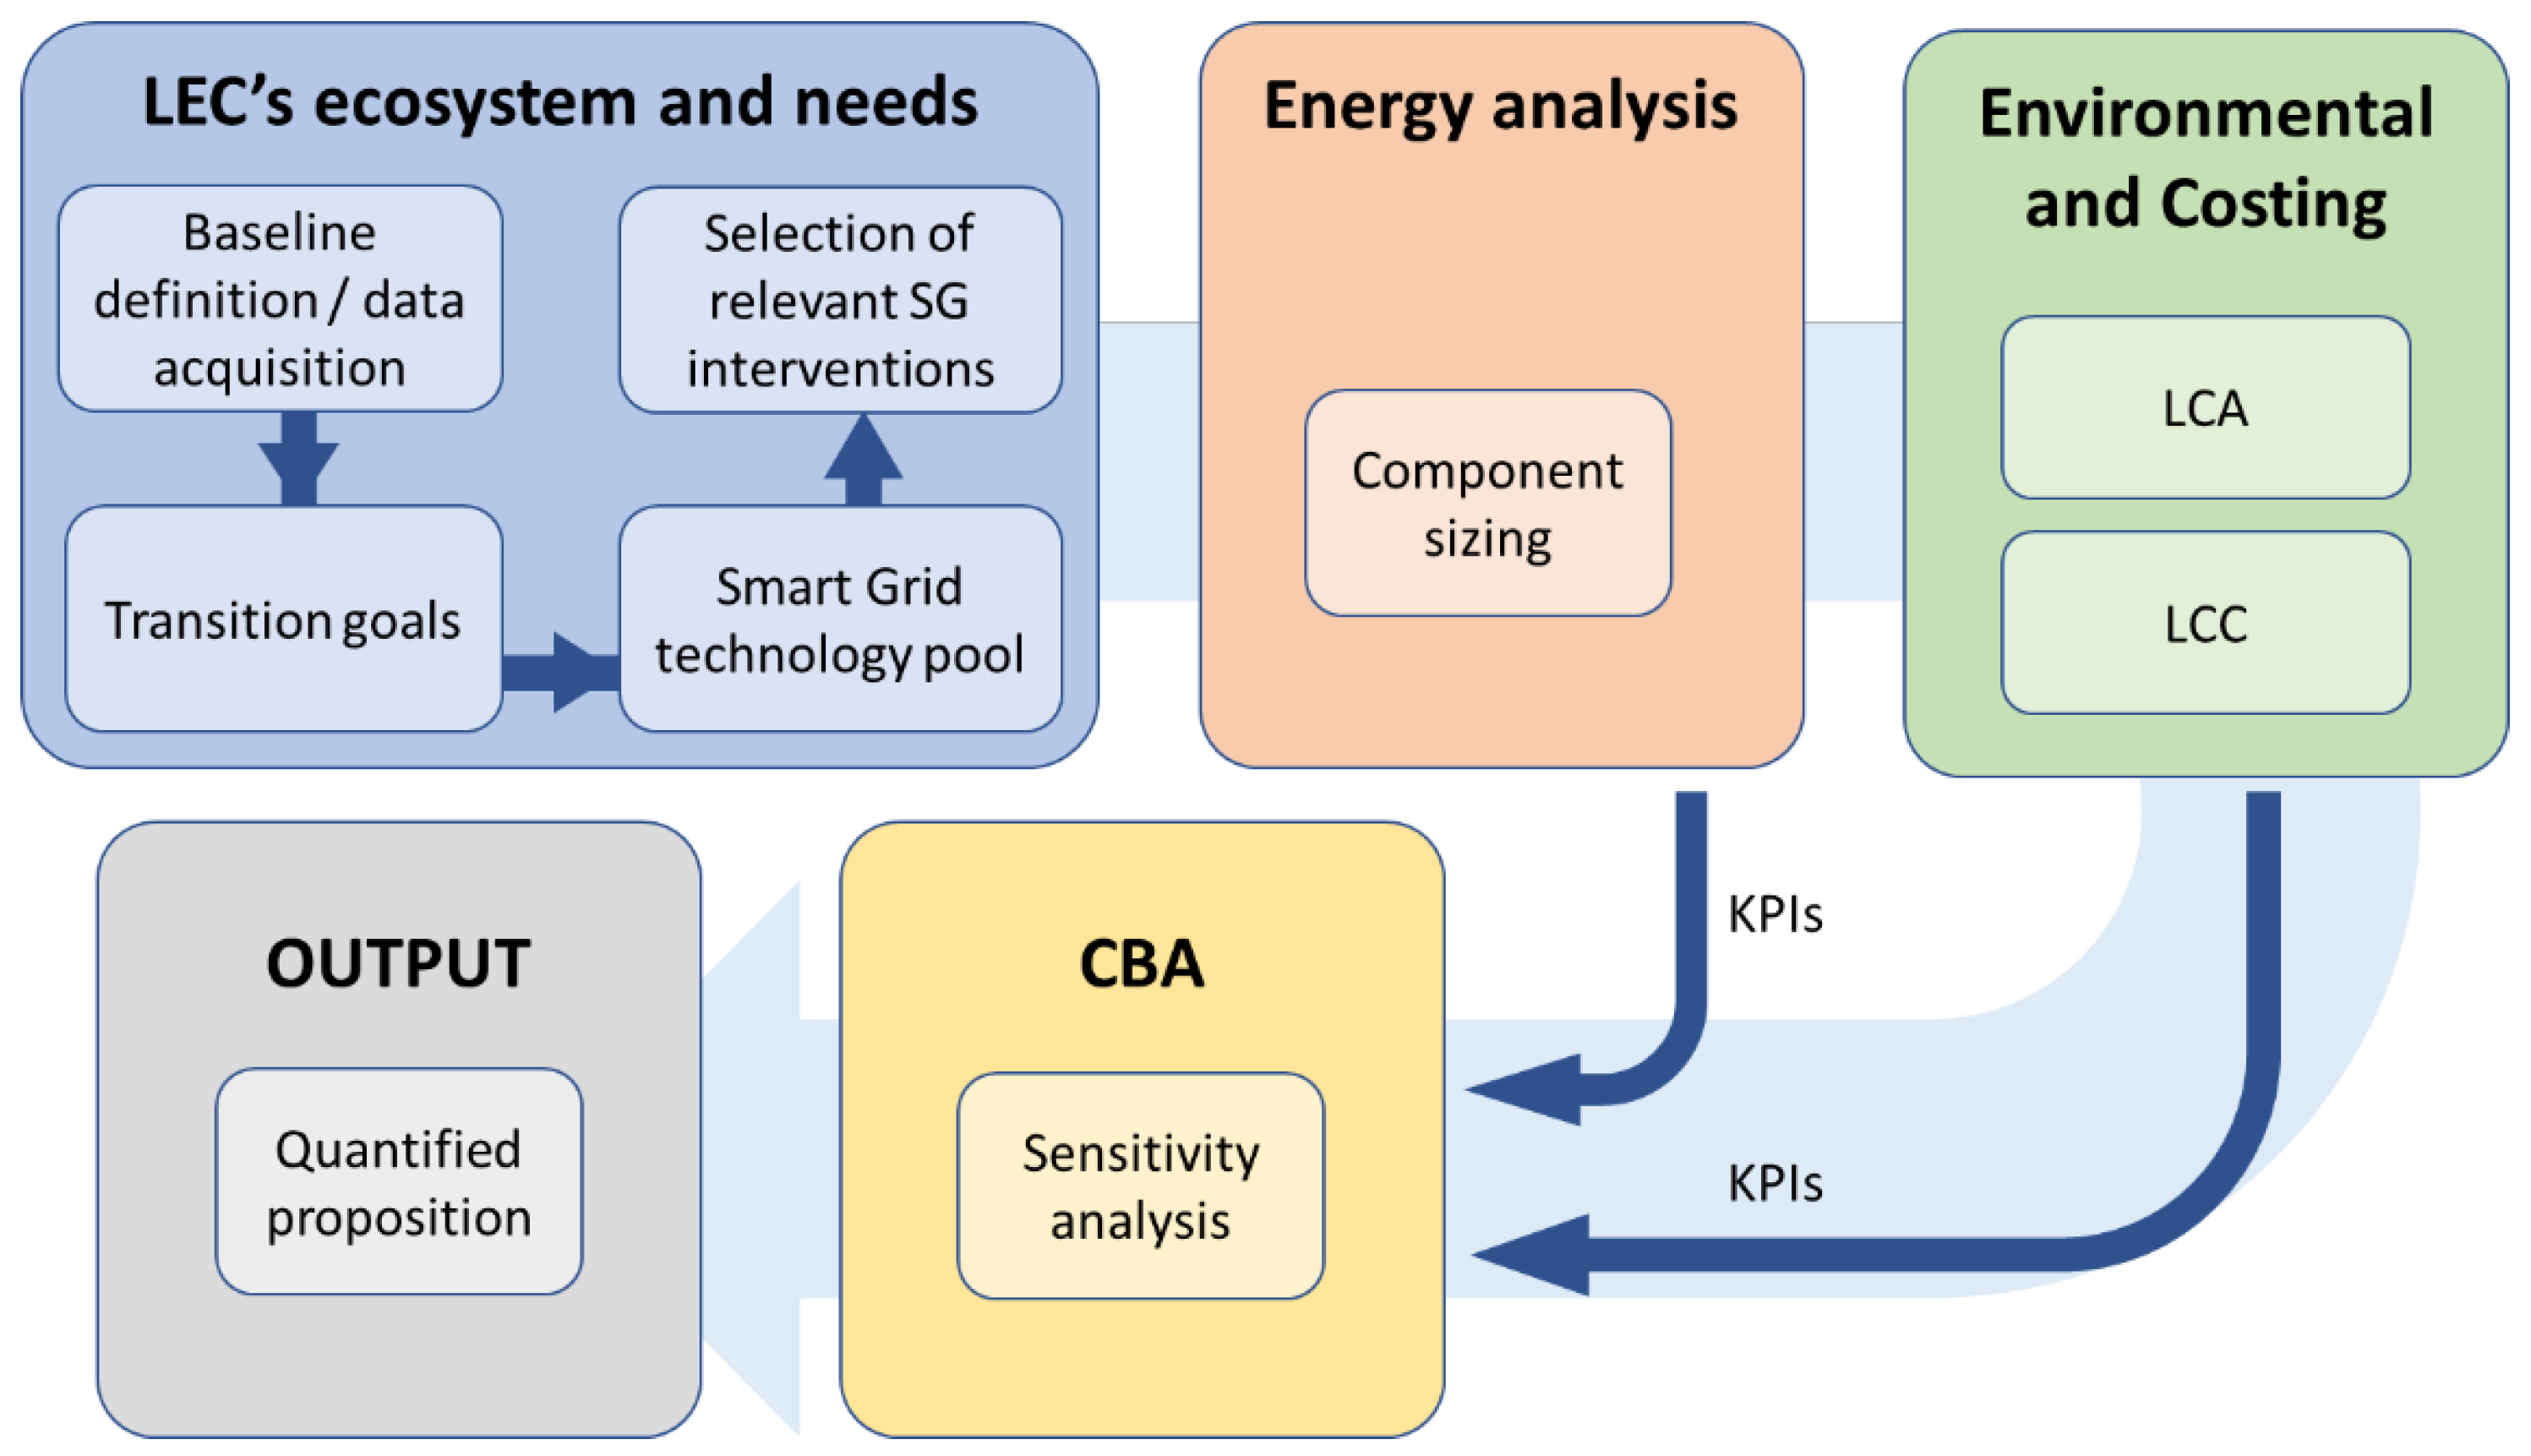
2. Materials and Methods
2.1. Energy Analysis
2.2. Environmental and Costing Analysis
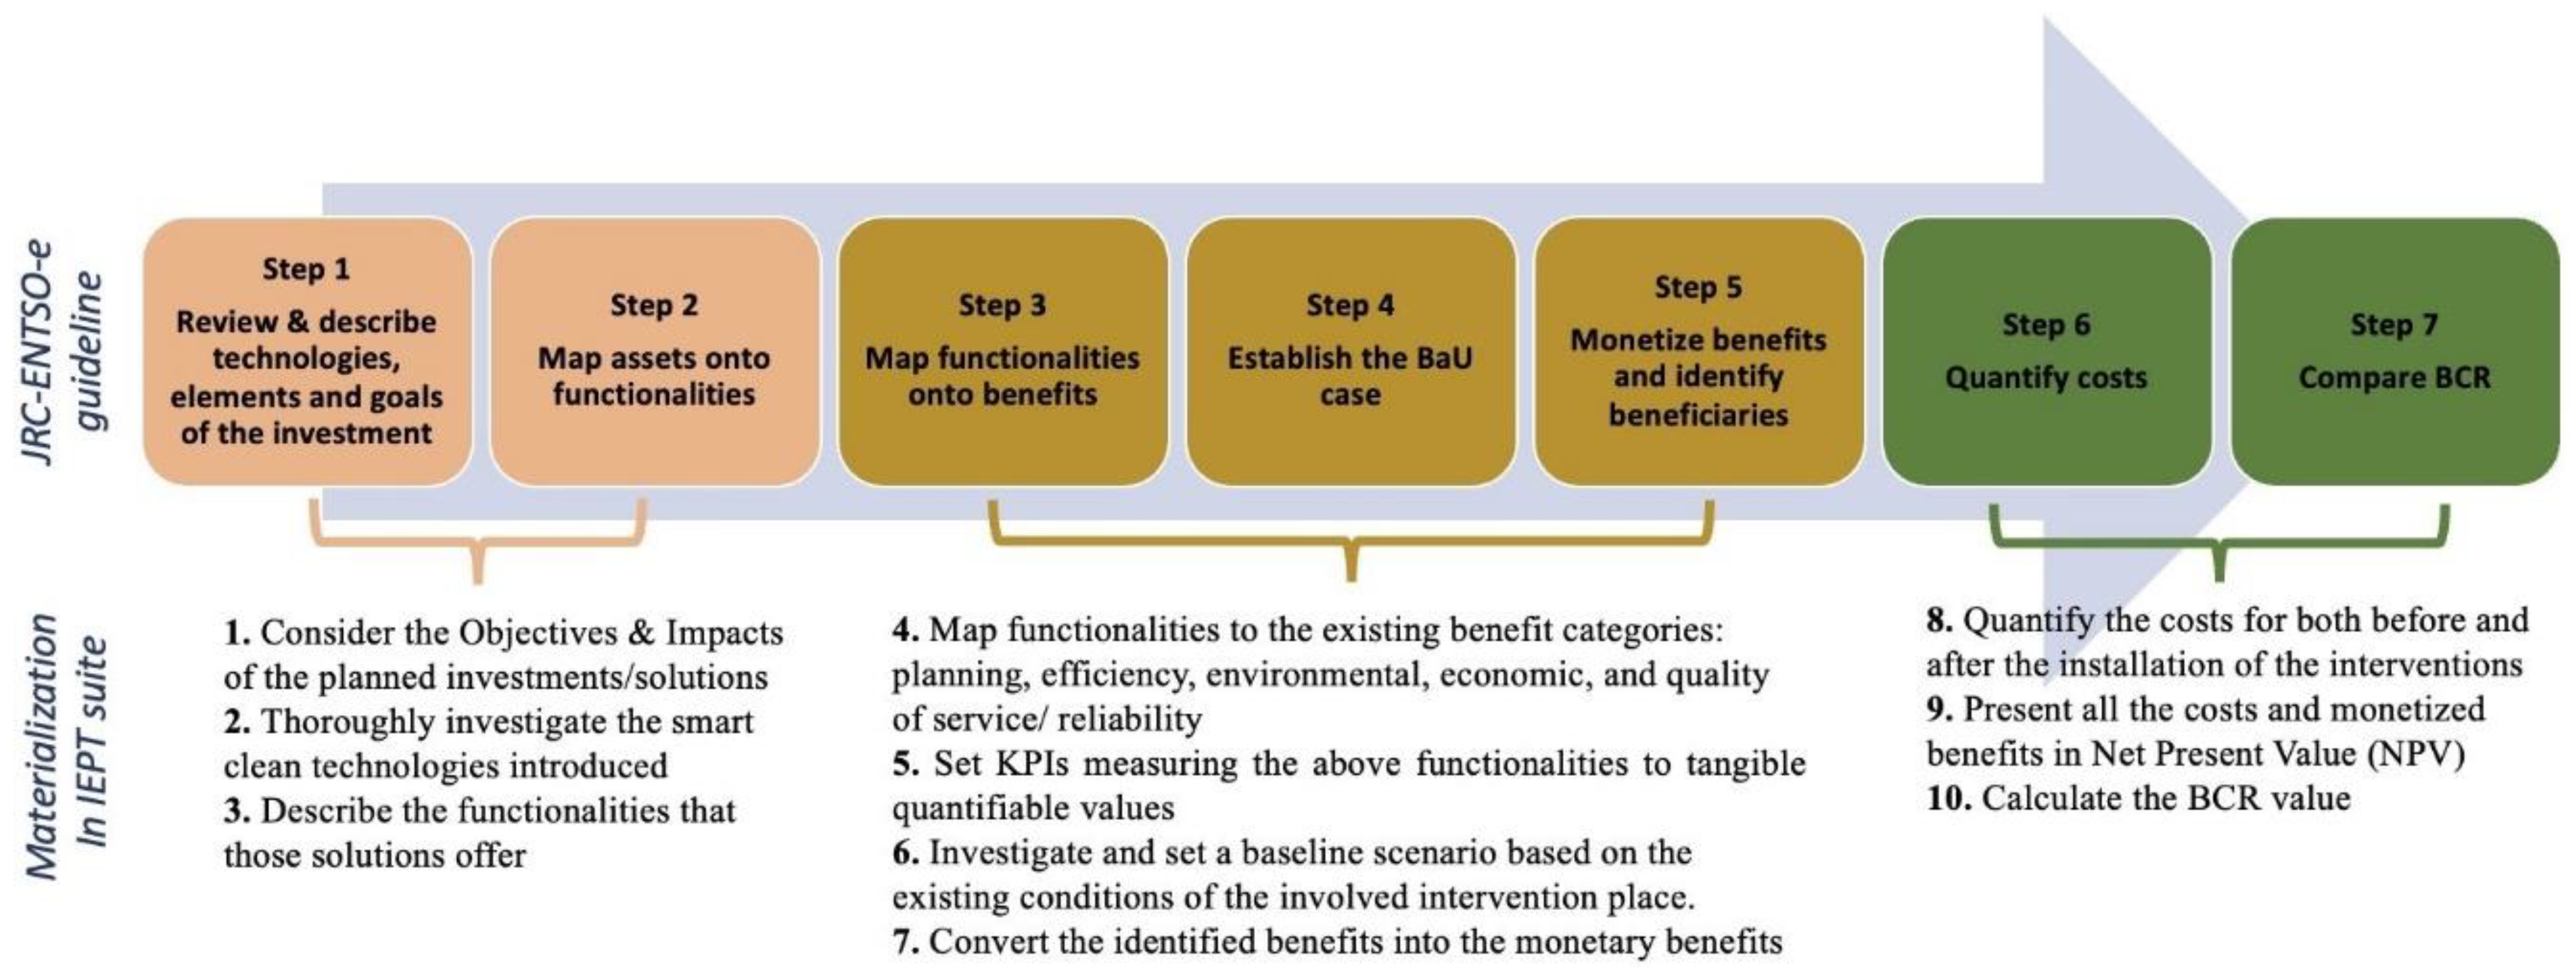
2.3. Cost–Benefit Analysis
3. Implementation
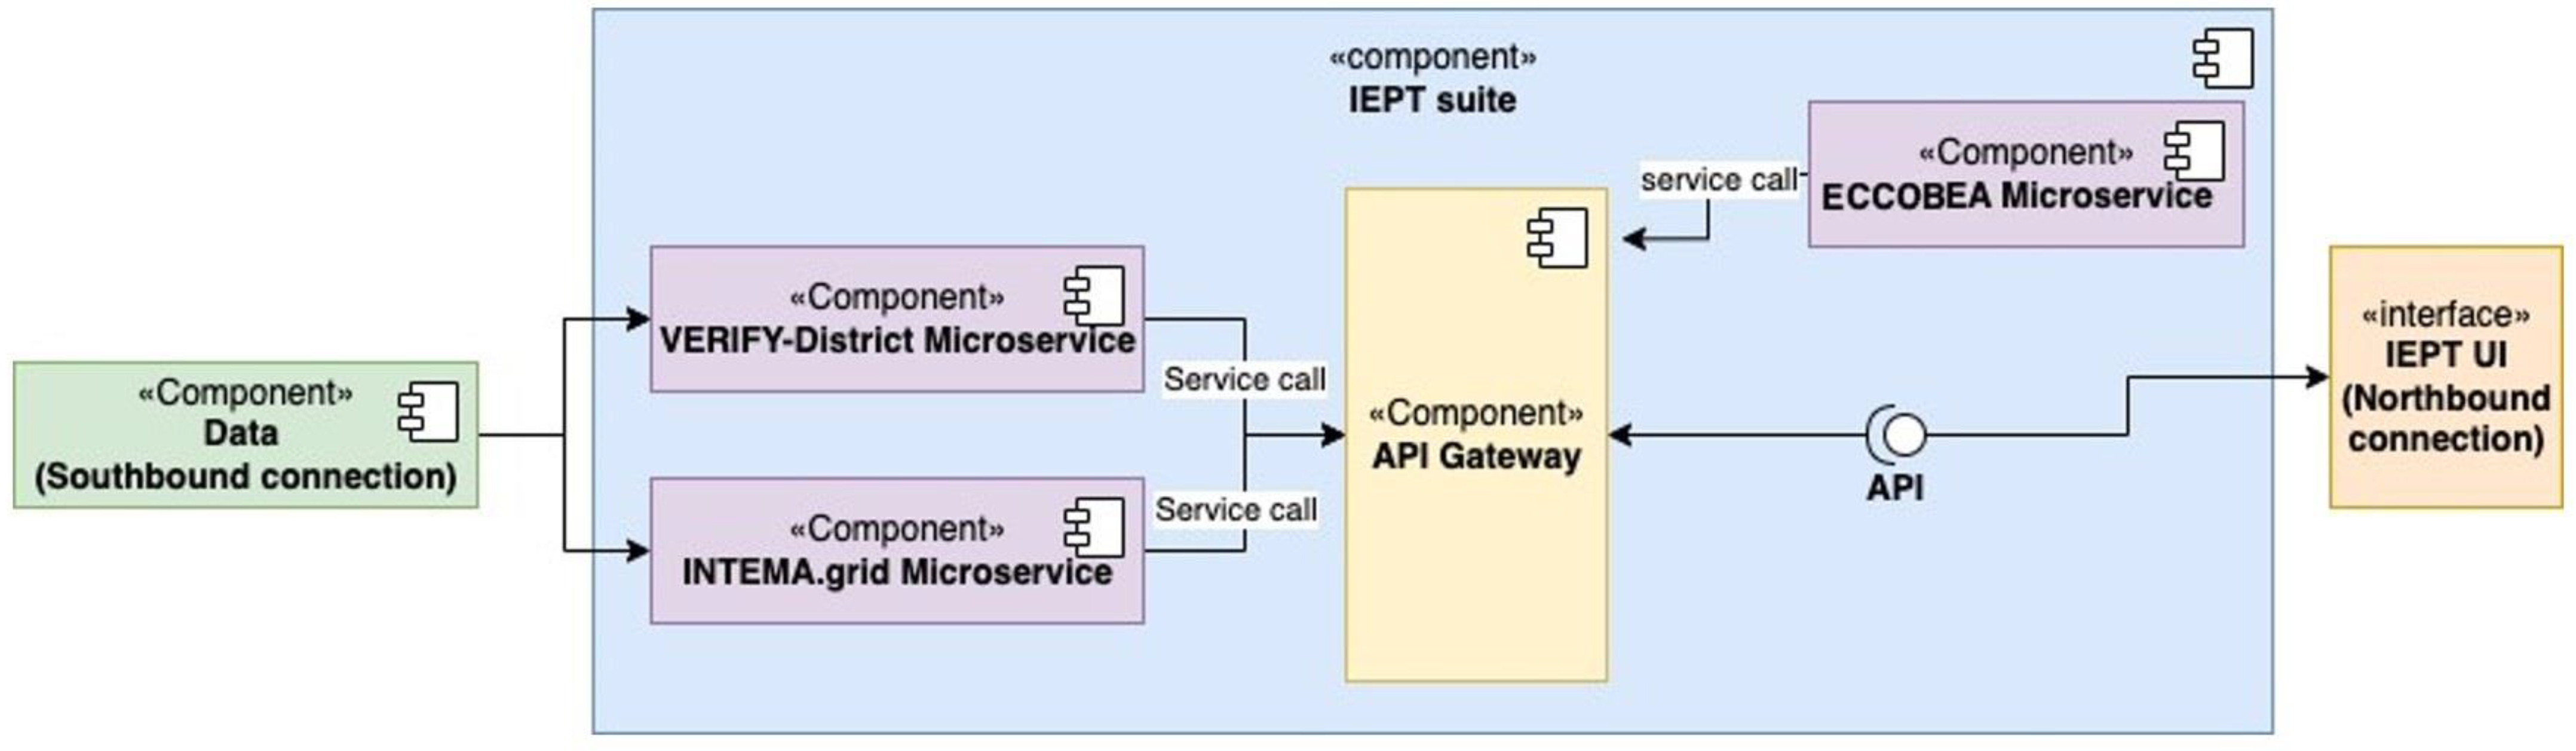
3.1. Architecture
- Integration of the intrinsic components developed by different providers;
- Access to data from the different data providers of a particular test case;
- Access to analysis data from the different components and data flow coordination among them;
- Provision of fine-grained analytics and metrics to the in volved stakeholders.
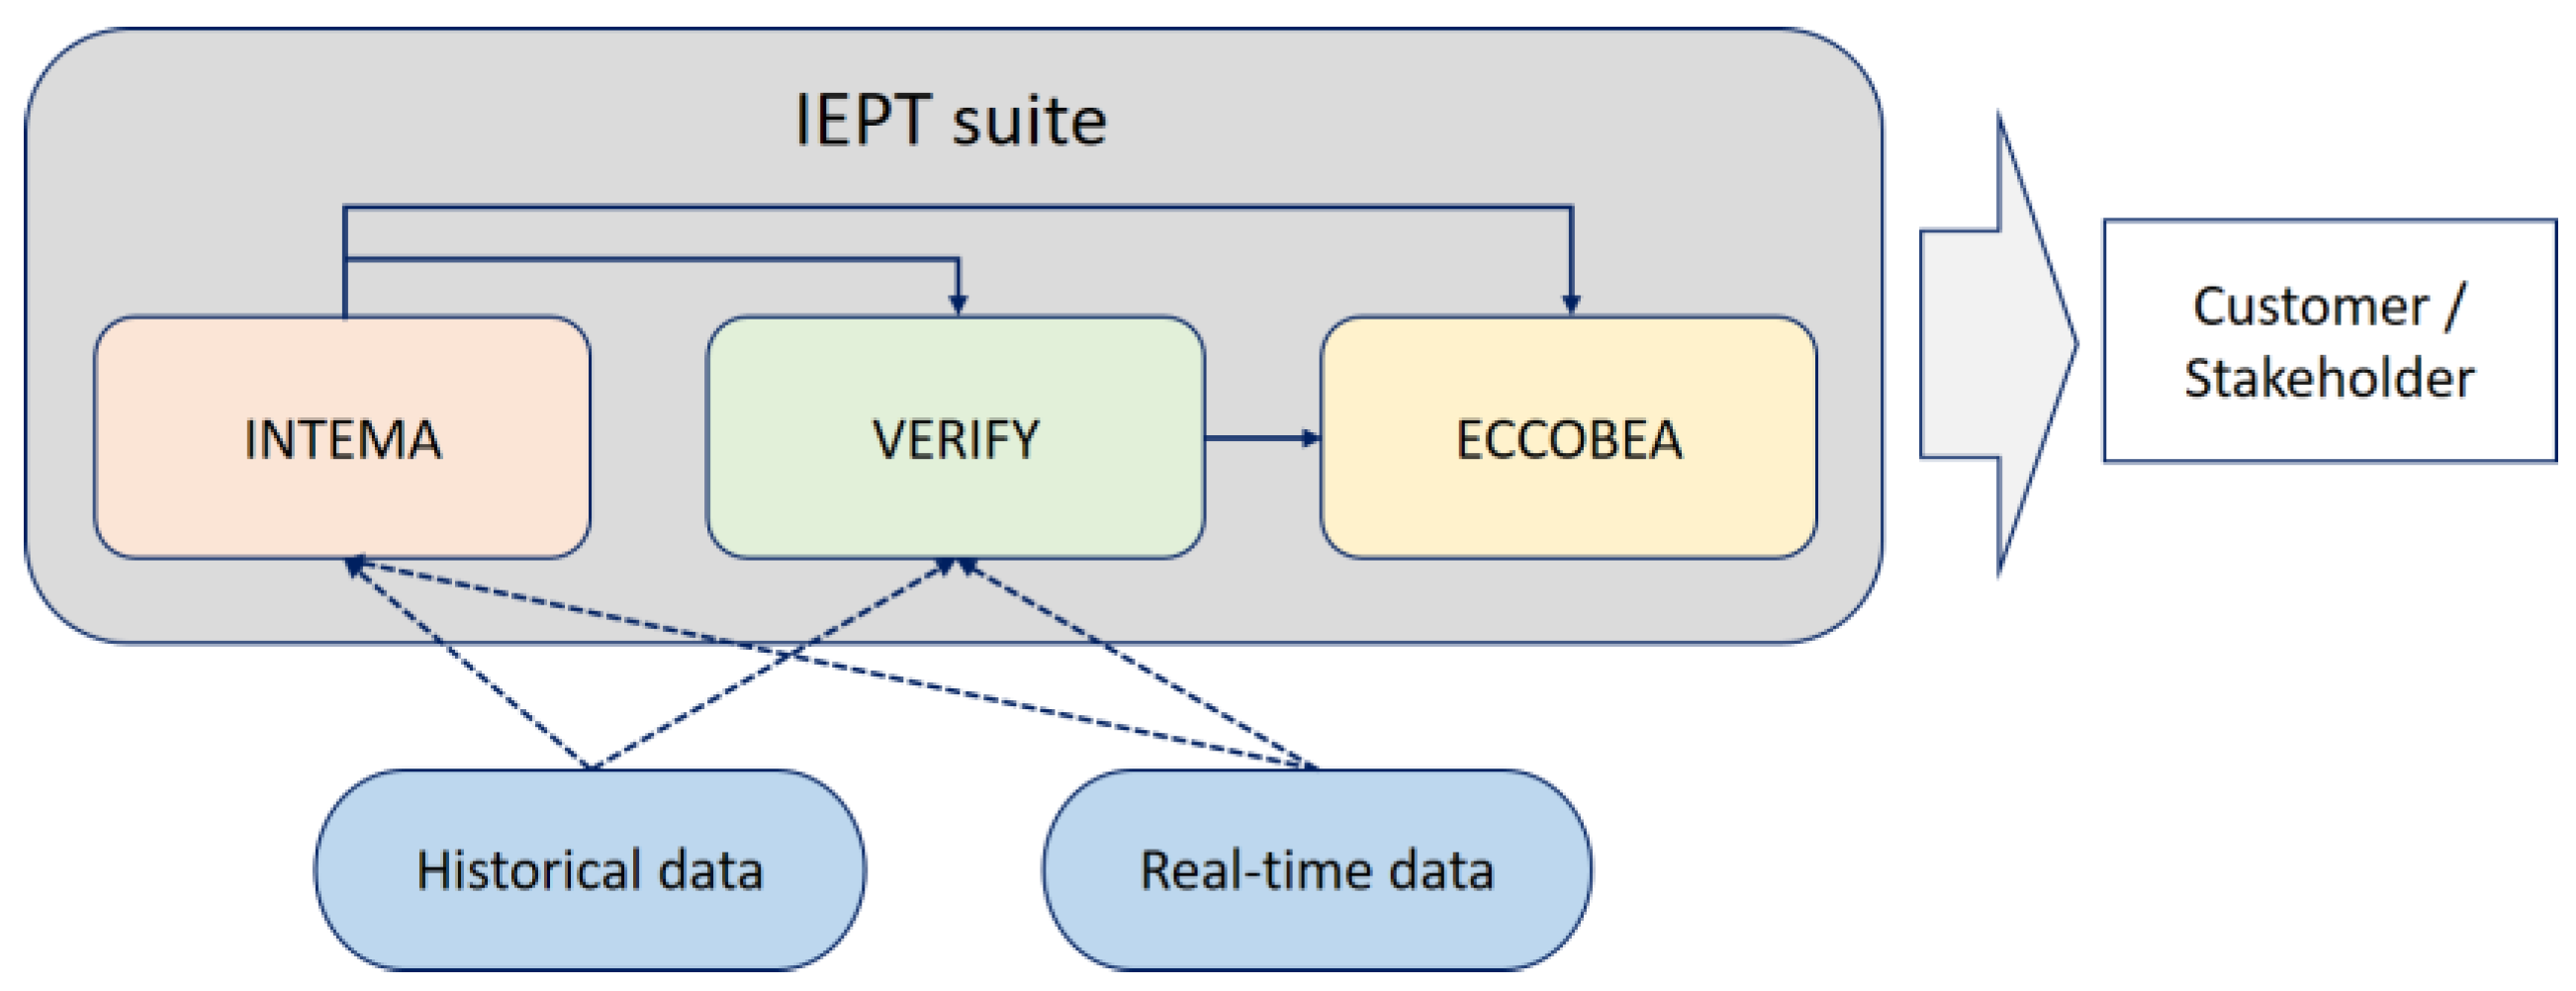
3.2. Components
3.2.1. Energy Analysis: INTEMA
3.2.2. Environmental and Costs: VERIFY
3.2.3. Investment Viability: ECCOBEA
4. Case Study
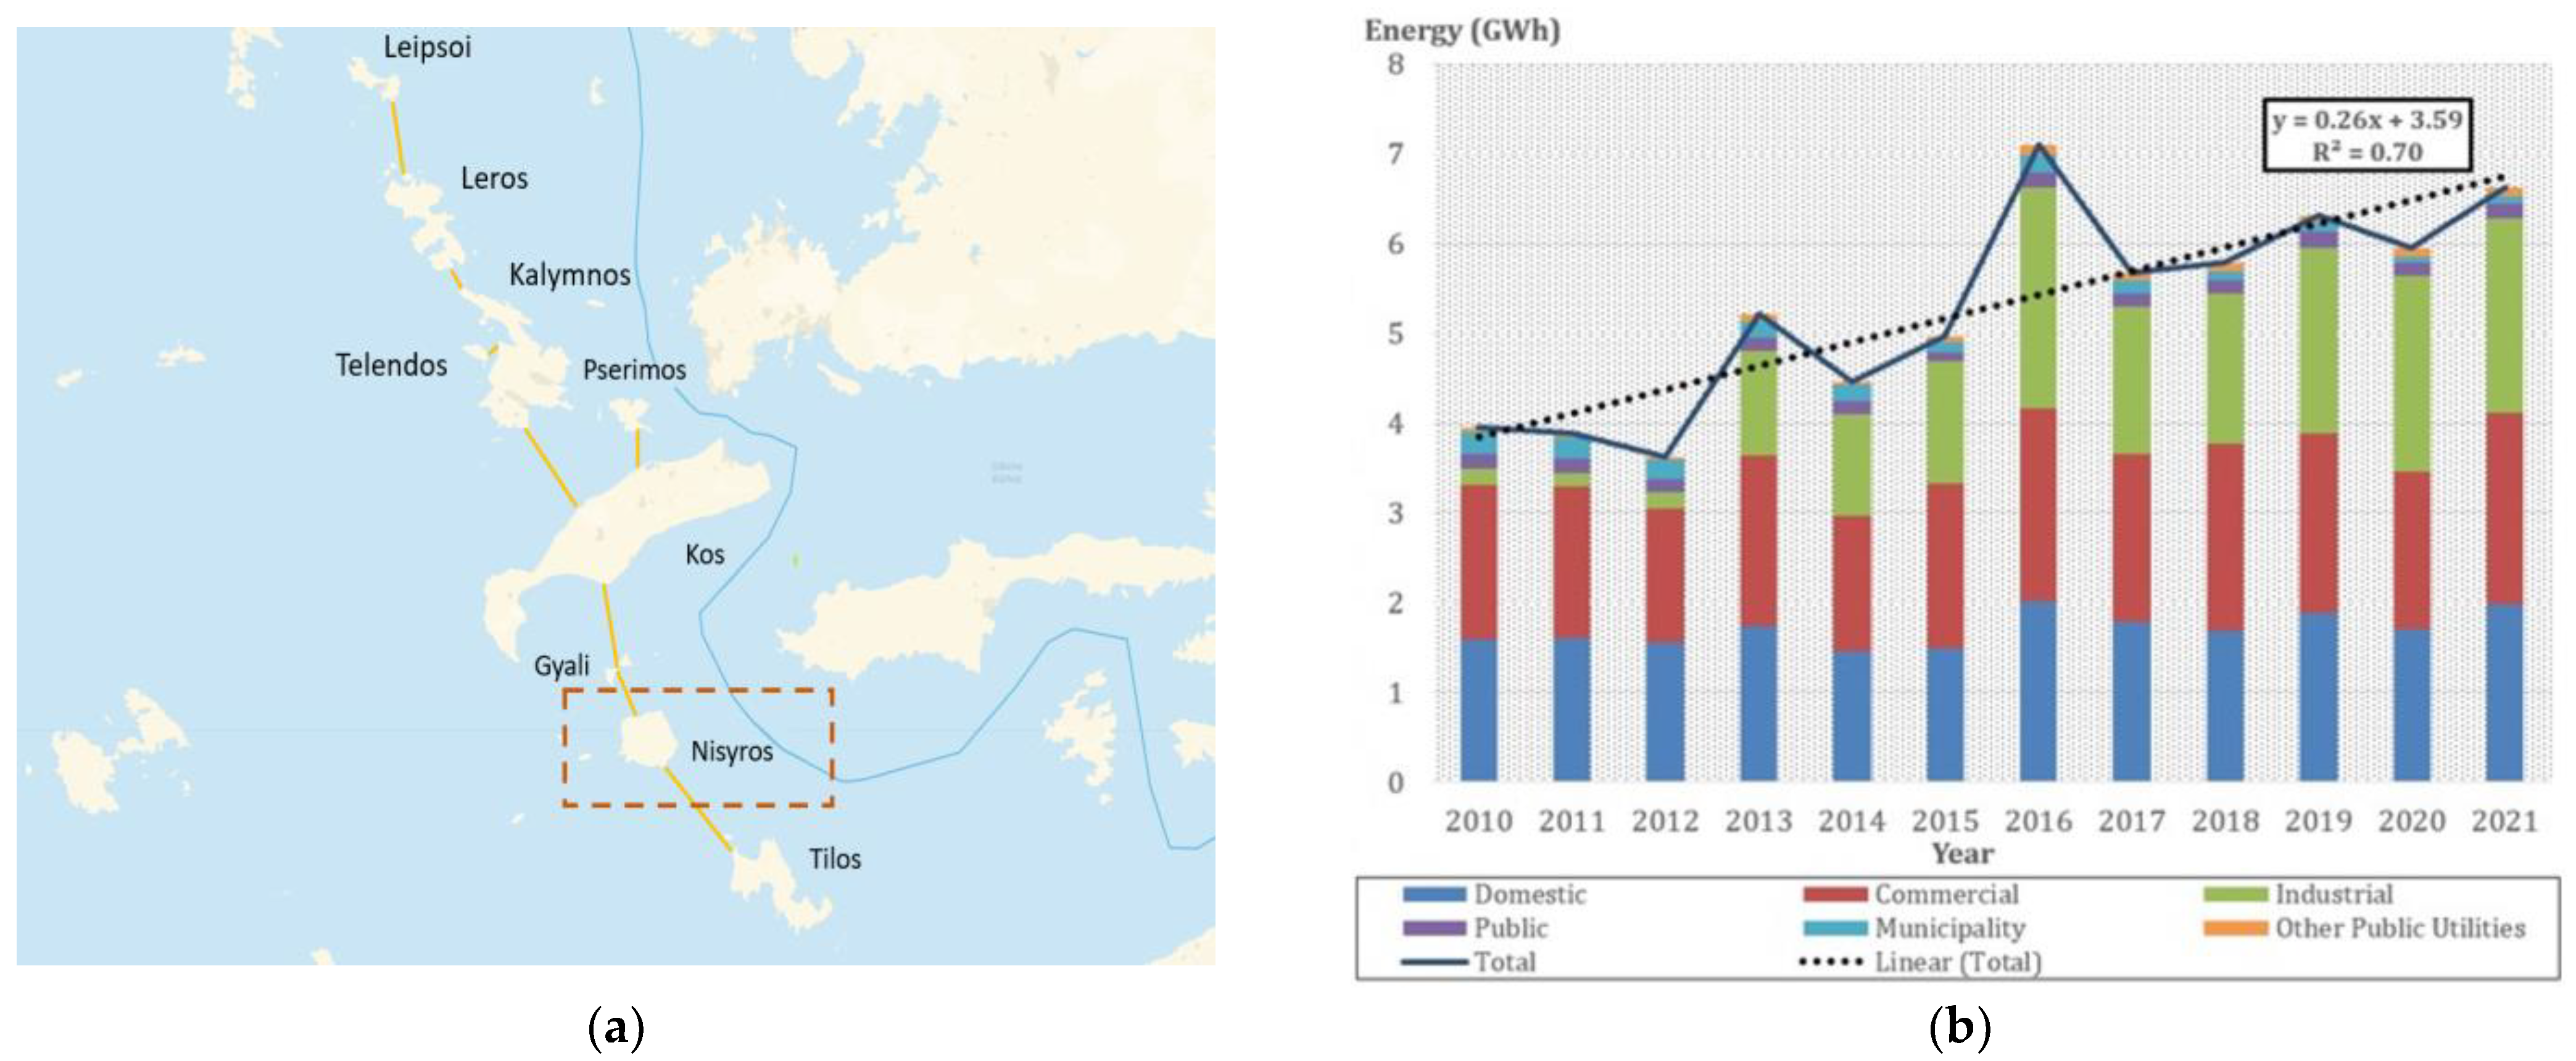
4.1. Nisyros Island Reference Scenario
4.2. Technology Interventions Selection and Energy Targets
5. Results and Discussion
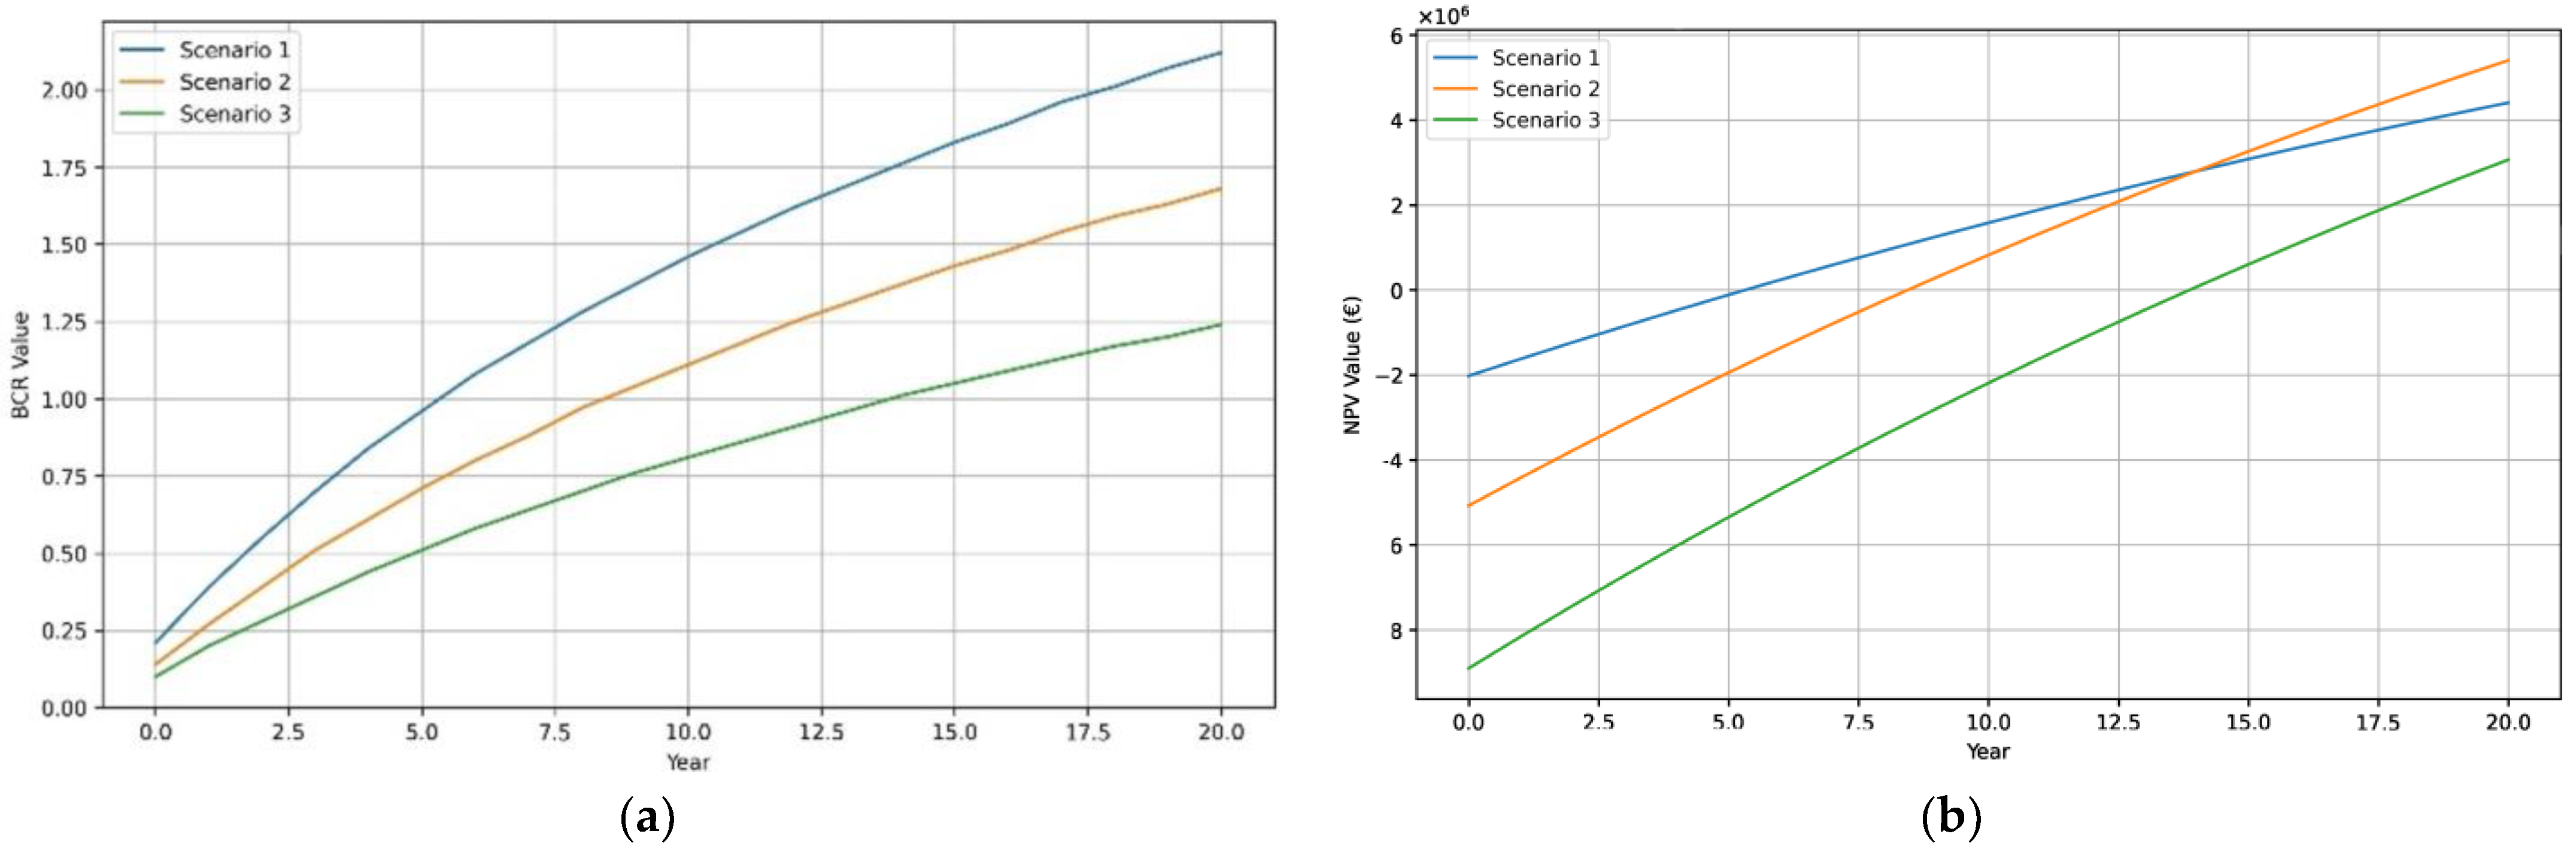
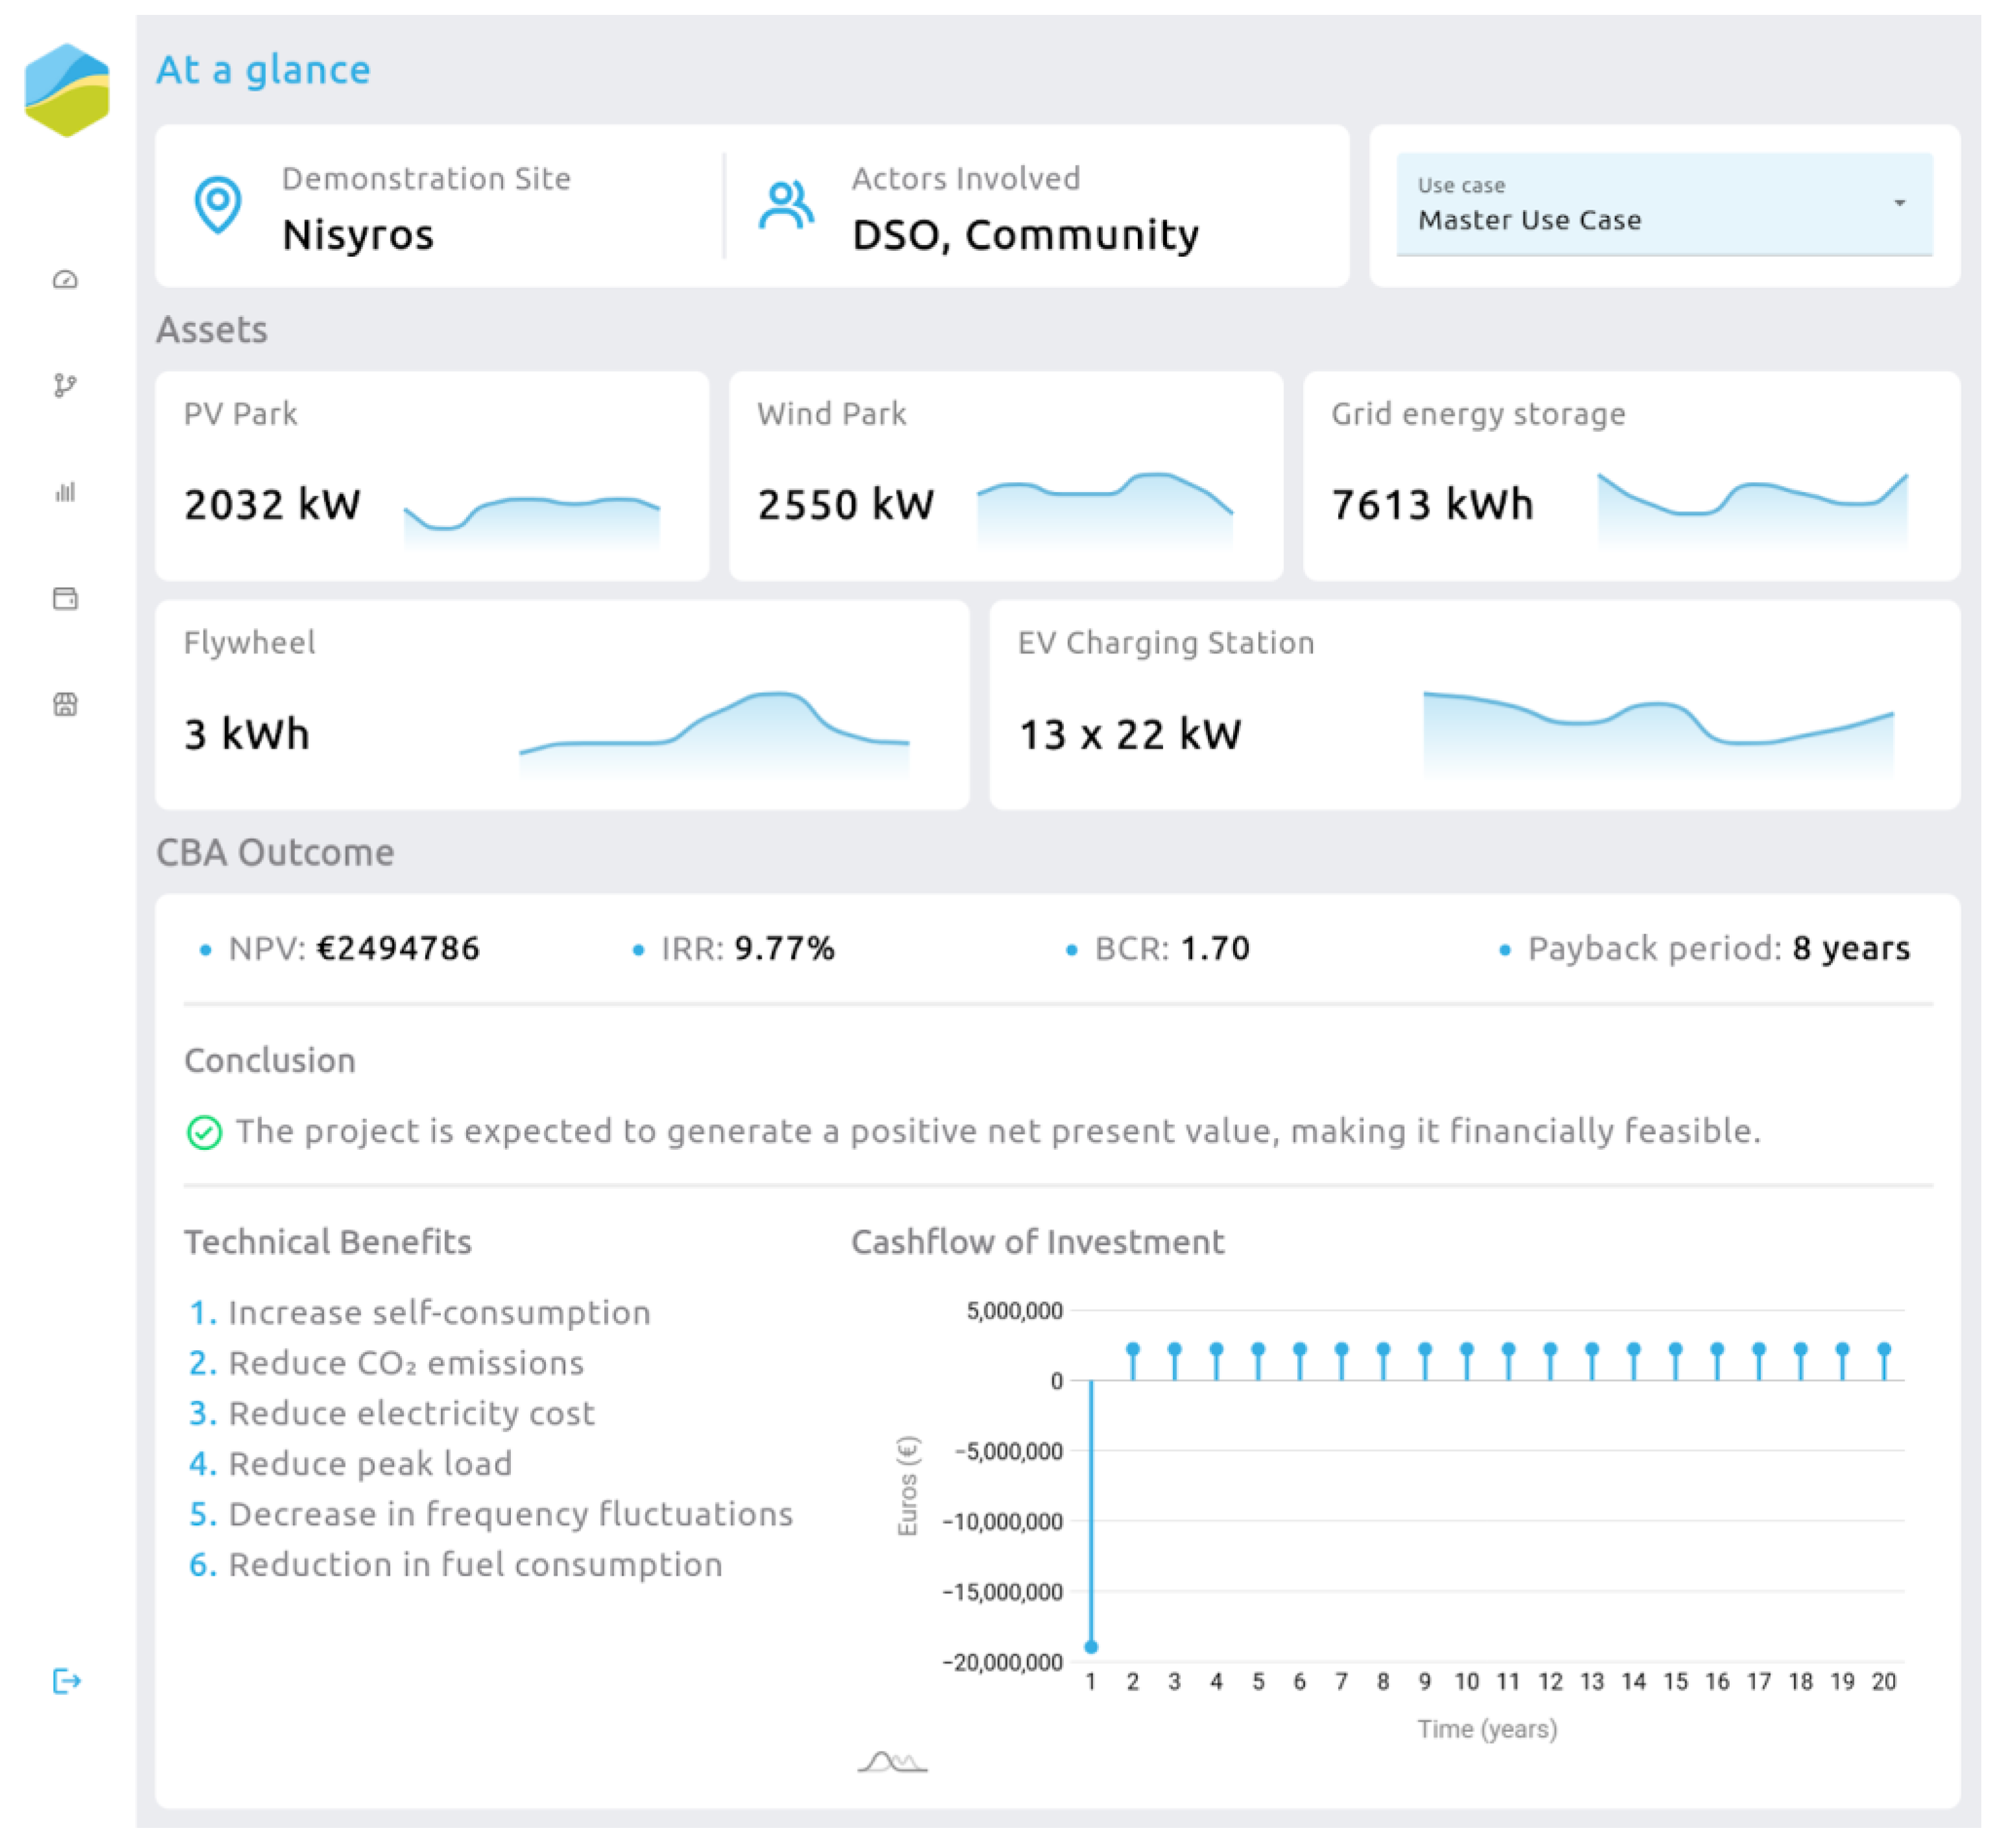
5.1. IEPT Results
- Simulations: Annual power flow simulations were conducted with an hourly resolution.
- Oil-fired power plant: It is assumed that the oil-fired plant on Kos island is the sole responsible for Nisyros’ energy transmission. However, only the percentile of the emissions that correspond to the amount of energy that Nisyros absorbs is considered in the calculations (1 kWh production from an oil-fired power plant is assumed to correspond to approximately 0.65 kgCO2/kWh [42,43]). The price of produced electricity is assumed to be 0.15 EUR/kW [44].
- Grid: In the baseline scenario, the load is covered by a mix of RES and oil-fired power plants from the neighboring interconnected islands. There are three transformers of 500 kVA serving the island of Nisyros. Each transformer is 15 years old, with a remaining service life of 10 years under current operating conditions.
- EVs: The vehicle-required energy is assumed to be the same for EVs and conventional vehicles, and the relevant power is produced from an oil-fired power plant.
- Since the local RES production increases, the losses caused by the energy imported from the transmission grid decrease.
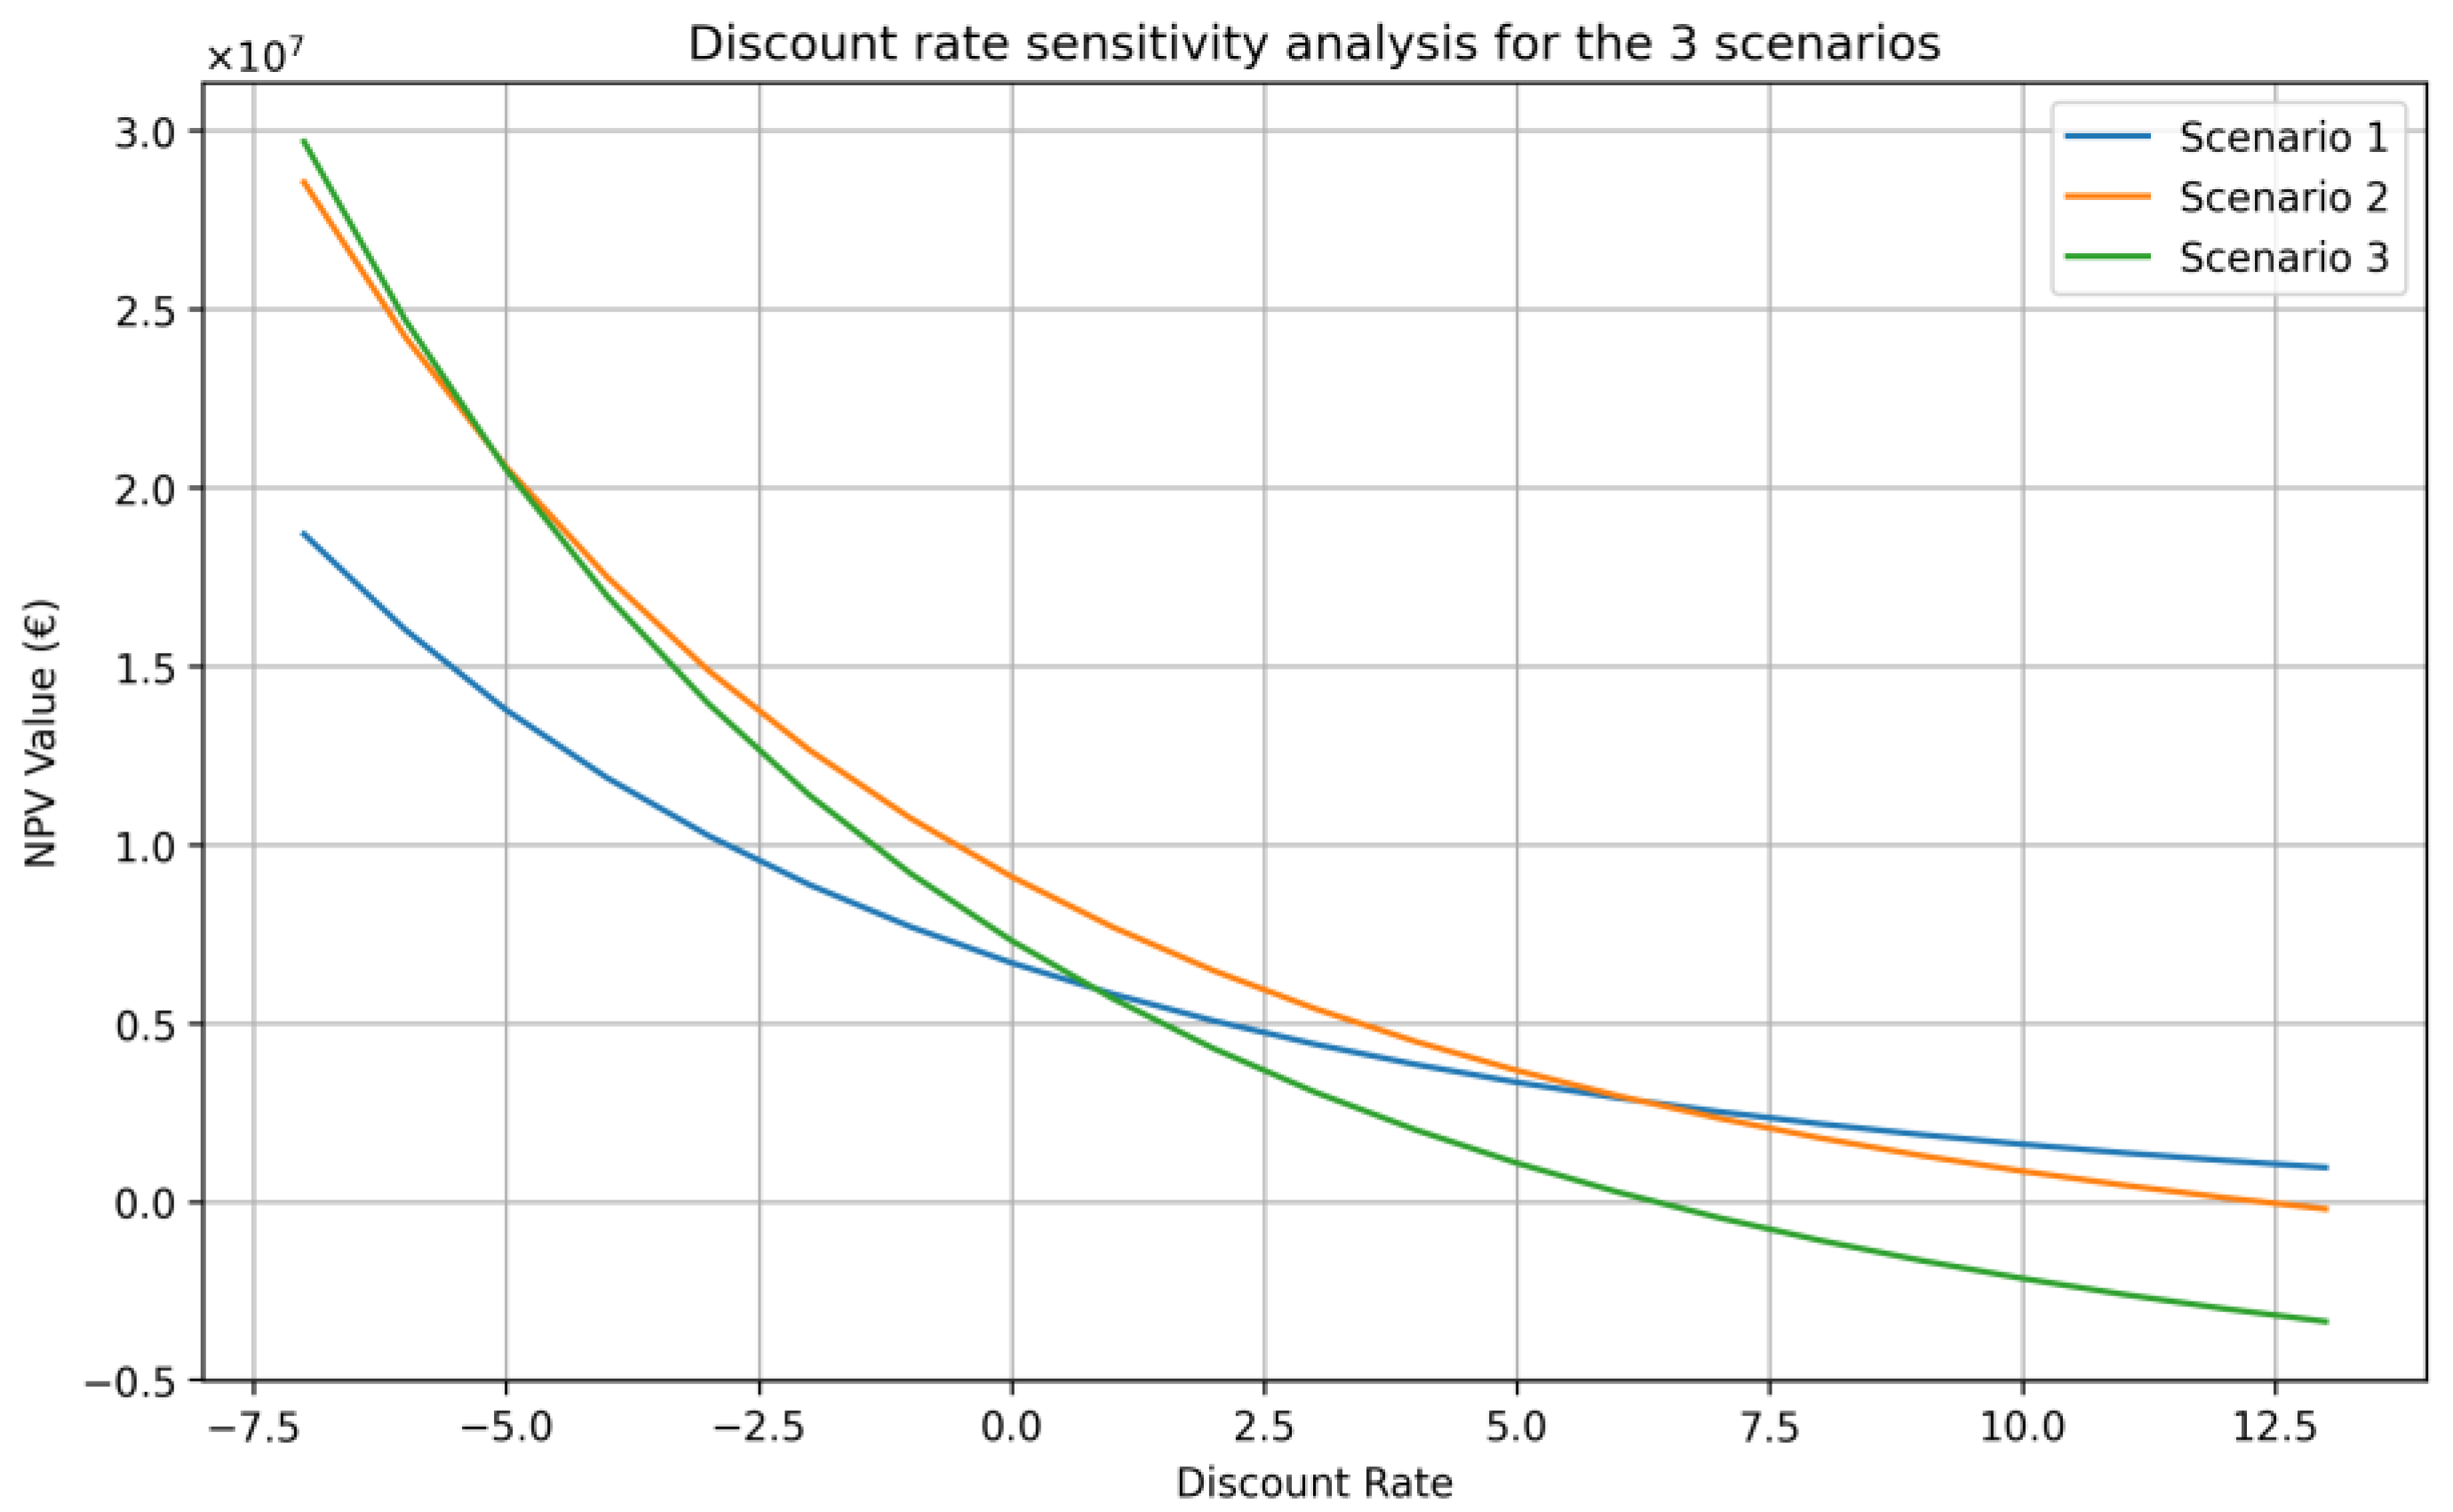
5.2. Sensitivity Analysis
6. Conclusions
Author Contributions
Funding
Data Availability Statement
Conflicts of Interest
References
- European Union Proposal for a Directive of the European Parliament and of the Council on Common Rules for the Internal Market in Electricity. 2019. Available online: https://eur-lex.europa.eu/legal-content/EN/TXT/?uri=CELEX%3A52016PC0864R%2801%29 (accessed on 3 July 2023).
- Liu, T.; Tan, X.; Sun, B.; Wu, Y.; Guan, X.; Tsang, D.H.K. Energy Management of Cooperative Microgrids with P2P Energy Sharing in Distribution Networks. In Proceedings of the 2015 IEEE International Conference on Smart Grid Communications (SmartGridComm), Miami, FL, USA, 2–5 November 2015; pp. 410–415. [Google Scholar]
- Otamendi-Irizar, I.; Grijalba, O.; Arias, A.; Pennese, C.; Hernández, R. How Can Local Energy Communities Promote Sustainable Development in European Cities? Energy Res. Soc. Sci. 2022, 84, 102363. [Google Scholar] [CrossRef]
- Williams, B.; Gahagan, M.; Costin, K. Using Microgrids to Integrate Distributed Renewables into the Grid. In Proceedings of the 2010 IEEE PES Innovative Smart Grid Technologies Conference Europe (ISGT Europe), Gothenburg, Sweden, 11–13 October 2010; pp. 1–5. [Google Scholar]
- Succetti, F.; Rosato, A.; Araneo, R.; Di Lorenzo, G.; Panella, M. Challenges and Perspectives of Smart Grid Systems in Islands: A Real Case Study. Energies 2023, 16, 583. [Google Scholar] [CrossRef]
- Campbell, H.F.; Brown, R.P. Benefit-Cost Analysis: Financial and Economic Appraisal Using Spreadsheets; Cambridge University Press: Cambridge, UK, 2003. [Google Scholar]
- Wholey, J.S.; Hatry, H.P.; Newcomer, K.E. (Eds.) Handbook of Practical Program Evaluation; Wiley: Hoboken, NJ, USA, 2015. [Google Scholar]
- Yang, Q.; Lai, L.L.; Lai, C.S. Methodology for Cost Benefit Analysis of Smart Grid Used in Decision Support. In Proceedings of the 2013 International Conference on Machine Learning and Cybernetics, Tianjin, China, 14–17 July 2013; Volume 1, pp. 104–107. [Google Scholar]
- De Castro, L.; Dutra, J. Paying for the Smart Grid. Energy Econ. 2013, 40, S74–S84. [Google Scholar] [CrossRef]
- Bouffard, F. The Challenge with Building a Business Case for Smart Grids. In Proceedings of the IEEE PES General Meeting, Minneapolis, MN, USA, 25–29 July 2010; pp. 1–3. [Google Scholar]
- Song, Y.; Li, J. Analysis of the Life Cycle Cost and Intelligent Investment Benefit of Smart Substation. In Proceedings of the IEEE PES Innovative Smart Grid Technologies, Tianjin, China, 21–24 May 2012; pp. 1–5. [Google Scholar]
- Ma, Z.; Jørgensen, B.N.; Prljaca, Z. Global Smart Grid Transferability: Insights from Europe, the US, and China. J. Energy Power Eng. 2015, 9, 1078–1092. [Google Scholar]
- May, K.; Sigrist, L.; Vingerhoets, P.; Morch, A.; Verboven, P.; Rouco, L. Improving Scalability and Replicability of Smart Grid Projects. In Proceedings of the 23rd International Conference on Electricity Distribution CIRED, Lyon, France, 15–18 June 2015. [Google Scholar]
- May, K.; Vingerhoets, P.; Sigrist, L. Barriers Regarding Scalability and Replicability of Smart Grid Projects. In Proceedings of the 2015 12th International Conference on the European Energy Market (EEM), Lisbon, Portugal, 19–22 May 2015; pp. 1–5. [Google Scholar]
- Alaqeel, T.; Suryanarayanan, S. A Comprehensive Cost-Benefit Analysis of the Penetration of Smart Grid Technologies in the Saudi Arabian Electricity Infrastructure. Util. Policy 2019, 60, 100933. [Google Scholar] [CrossRef]
- Sidhu, A.S.; Pollitt, M.G.; Anaya, K.L. A Social Cost Benefit Analysis of Grid-Scale Electrical Energy Storage Projects: A Case Study. Appl. Energy 2018, 212, 881–894. [Google Scholar] [CrossRef]
- Behi, B.; Baniasadi, A.; Arefi, A.; Gorjy, A.; Jennings, P.; Pivrikas, A. Cost–Benefit Analysis of a Virtual Power Plant Including Solar PV, Flow Battery, Heat Pump, and Demand Management: A Western Australian Case Study. Energies 2020, 13, 2614. [Google Scholar] [CrossRef]
- Pratt, R.G.; Balducci, P.J.; Gerkensmeyer, C.; Katipamula, S.; Kintner-Meyer, M.C.; Sanquist, T.F.; Schneider, K.P.; Secrest, T.J. The Smart Grid: An Estimation of the Energy and CO2 Benefits; Pacific Northwest National Lab. (PNNL): Richland, WA, USA, 2010. [Google Scholar]
- Katic, N.; Marijanovic, V.; Stefani, I. Smart Grid Solutions in Distribution Networks Cost/Benefit Analysis. In Proceedings of the CICED 2010 Proceedings, Nanjing, China, 13–16 September 2010; pp. 1–6. [Google Scholar]
- Basso, G.; Gaud, N.; Gechter, F.; Hilaire, V.; Lauri, F. A Framework for Qualifying and Evaluating Smart Grids Approaches: Focus on Multi-Agent Technologies. Smart Grid Renew. Energy 2013, 4, 33933. [Google Scholar] [CrossRef]
- Pullins, S.; Westerman, J. San Diego Smart Grid Study. In SAIC Smart Grid Team Final Report; SAIC: Reston, VA, USA, 2006. [Google Scholar]
- McGranaghan, M.; Von Dollen, D.; Myrda, P.; Gunther, E. Utility Experience with Developing a Smart Grid Roadmap. In Proceedings of the 2008 IEEE Power and Energy Society General Meeting-Conversion and Delivery of Electrical Energy in the 21st Century, Pittsburgh, PA, USA, 20–24 July 2008; pp. 1–5. [Google Scholar]
- Leite, D.; Lamin, H.; De Albuquerque, J.; Camargo, I. Regulatory Impact Analysis of Smart Meters Implementation in Brazil. In Proceedings of the 2012 IEEE PES Innovative Smart Grid Technologies (ISGT), Washington, DC, USA, 16–20 January 2012; pp. 1–8. [Google Scholar]
- Torres, F.C.; Almenar, J.B.; Rugani, B. Photovoltaic-Green Roof Energy Communities Can Uphold the European Green Deal: Probabilistic Cost-Benefit Analyses Help Discern Economically Convenient Scenarios. J. Clean. Prod. 2023, 414, 137428. [Google Scholar] [CrossRef]
- Li, X.; Chalvatzis, K.J.; Stephanides, P. Innovative Energy Islands: Life-Cycle Cost-Benefit Analysis for Battery Energy Storage. Sustainability 2018, 10, 3371. [Google Scholar] [CrossRef]
- Gjorgievski, V.Z.; Cundeva, S.; Georghiou, G.E. Social Arrangements, Technical Designs and Impacts of Energy Communities: A Review. Renew. Energy 2021, 169, 1138–1156. [Google Scholar] [CrossRef]
- Apostolopoulos, V.; Mamounakis, I.; Seitaridis, A.; Tagkoulis, N.; Kourkoumpas, D.-S.; Iliadis, P.; Angelakoglou, K.; Nikolopoulos, N. An Integrated Life Cycle Assessment and Life Cycle Costing Approach towards Sustainable Building Renovation via a Dynamic Online Tool. Appl. Energy 2023, 334, 120710. [Google Scholar] [CrossRef]
- European Commission. EU Countries’ Long-Term Strategies to Meet Their Paris Agreement Commitments and the Energy Union Objectives. Available online: https://ec.europa.eu/info/energy-climate-change-environment/implementation-eu-countries/energy-and-climate-governance-and-reporting/national-long-term-strategies_en (accessed on 3 July 2023).
- Giordano, V.; Onyeji, I.; Fulli, G.; Jimenez, M.S.; Filiou, C. Guidelines for Conducting a Cost-Benefit Analysis of Smart Grid Projects; Reference Report by the Joint Research Center of the European Commission; Publications Office of the European Union: Luxembourg, 2012. [Google Scholar]
- ENTSO-E 2nd ENTSO-E Guideline for Cost Benefit Analysis of Grid Development Projects. 2018. Available online: https://eepublicdownloads.entsoe.eu/clean-documents/tyndp-documents/Cost%20Benefit%20Analysis/2018-10-11-tyndp-cba-20.pdf (accessed on 3 July 2023).
- IANOS—IntegrAted SolutioNs for DecarbOnisation and Smartification of Islands. Available online: https://ianos.eu/ (accessed on 6 February 2023).
- Rozanski, N.; Woods, E. Software Systems Architecture: Working with Stakeholders Using Viewpoints and Perspectives; Addison-Wesley: Boston, MA, USA, 2011. [Google Scholar]
- ISO/IEC/IEEE 42010:2011; Systems and Software Engineering–Architecture Description; ERevision ISOIEC 42010 2007 IEEE Std 1471-2000. International Organization for Standardization: Geneva, Switzerland, 2011; pp. 1–46.
- Pahl, C.; Jamshidi, P. Microservices: A Systematic Mapping Study. In Proceedings of the 6th International Conference on Cloud Computing and Services Science (CLOSER 2016), Rome, Italy, 23–25 April 2016; Volume 1, pp. 137–146. [Google Scholar]
- Docker. Accelerated, Containerized Application Development. 2023. Available online: https://www.docker.com/ (accessed on 3 July 2023).
- Seitaridis, A.; Mamounakis, I.; Tagkoulis, N.; Iliadis, P.; Bellos, E.; Papalexis, C.; Sougakis, V.; Nikolopoulos, N. An Innovative Software Platform for Efficient Energy, Environmental and Cost Planning in Buildings Retrofitting. In Artificial Intelligence Applications and Innovations. AIAI 2022 IFIP WG 12.5 International Workshops; Maglogiannis, I., Iliadis, L., Macintyre, J., Cortez, P., Eds.; IFIP Advances in Information and Communication Technology; Springer International Publishing: Cham, Switzerland, 2022; Volume 652, pp. 217–228. ISBN 978-3-031-08340-2. [Google Scholar]
- Lund, H.; Thellufsen, J.Z.; Østergaard, P.A.; Sorknæs, P.; Skov, I.R.; Mathiesen, B.V. EnergyPLAN—Advanced Analysis of Smart Energy Systems. Smart Energy 2021, 1, 100007. [Google Scholar] [CrossRef]
- Emodi, N.V.; Emodi, C.C.; Murthy, G.P.; Emodi, A.S.A. Energy Policy for Low Carbon Development in Nigeria: A LEAP Model Application. Renew. Sustain. Energy Rev. 2017, 68, 247–261. [Google Scholar] [CrossRef]
- Dominković, D.; Stark, G.; Hodge, B.-M.; Pedersen, A. Integrated Energy Planning with a High Share of Variable Renewable Energy Sources for a Caribbean Island. Energies 2018, 11, 2193. [Google Scholar] [CrossRef]
- Fritzson, P.; Bunus, P. Modelica—A General Object-Oriented Language for Continuous and Discrete-Event System Modeling and Simulation. In Proceedings of the Proceedings 35th Annual Simulation Symposium, SS 2002, San Deigo, CA, USA, 14–18 April 2002; pp. 365–380. [Google Scholar]
- SimaPro. Available online: https://simapro.com/ (accessed on 21 August 2023).
- Sphera—GaBi. Available online: https://sphera.com/life-cycle-assessment-lca-software/ (accessed on 24 August 2023).
- OpenLCA. Available online: https://www.openlca.org/ (accessed on 24 August 2023).
- ETool. Available online: https://etool.app/ (accessed on 23 August 2023).
- JRC Photovoltaic Geographical Information System (PVGIS)—European Commission. Available online: https://re.jrc.ec.europa.eu/pvg_tools/en/#TMY (accessed on 7 October 2022).
- Andresen, A.; Kurtz, L.C.; Hondula, D.; Meerow, S.; Gall, M. Understanding the Social Impacts of Power Outages in North America: A Systematic Review. Environ. Res. Lett. 2023, 18, 053004. [Google Scholar] [CrossRef]
- D9.3 Fellow Islands Replication and Scalability Plan; IANOS: Thessaloniki, Greece, 2023.
- Global EV Outlook 2018. Available online: https://www.iea.org/reports/global-ev-outlook-2018 (accessed on 16 February 2023).
- Ricke, K.; Drouet, L.; Caldeira, K.; Tavoni, M. Country-Level Social Cost of Carbon. Nat. Clim. Chang. 2018, 8, 895–900. [Google Scholar] [CrossRef]
- Roth, A.; Brückmann, R.; Jimeno, M.; Dukan, M.; Kitzing, L.; Breitschopf, B.; Alexander-Haw, A.; Blanco, A.L.A. Renewable Energy Financing Conditions in Europe: Survey and Impact Analysis; Aures: Paris, France, 2021. [Google Scholar]
- Hermelink, A.H.; de Jager, D. Evaluating Our Future-The Crucial Role of Discount Rates in European Commission Energy System Modelling; The European Council for an Energy Efficient Economy & Ecofys: Stockholm, Sweden, 2015. [Google Scholar]


| KPIs | Description |
|---|---|
| Increased self-consumption Reduced peak load | Energy demands covered by local generation increase |
| Increased self-consumption Reduced peak load | Peak to mean ratio (PMR) load reduction |
| Decrease frequency fluctuation | Integral of difference between power generation and load time-series reduction |
| KPIs | General Formula |
|---|---|
| Lifecycle fuel costs (kEUR) | |
| Lifecycle income (kEUR) | |
| Lifecycle O&M costs (kEUR) | |
| Lifetime capital costs (kEUR) | |
| Lifecycle cost of (produced) energy (EUR/kWh) | |
| Lifetime primary energy (MWh) | where,
|
| Lifetime CO2 emissions (tons CO2) | |
| Annual renewable generation (GWh) | |
| Annual conventional generation (GWh) |
| Technology | Scenario 1 | Scenario 2 | Scenario 3 |
|---|---|---|---|
| 50% Local Self-Consumption | 80% Local Self-Consumption | 95% Local Self-Consumption | |
| PV plant | 50% | 80% | 95% |
| Wind park | 602 kW | 1030 kW | 2032 kW |
| Grid battery | 850 kW | 1700 kW | 2550 kW |
| EV chargers | 10 × 22 kW | 10 × 22 kW | 10 × 22 kW |
| Local Green Energy Production | Ensuring Efficiency in Day-to-Day Grid Operation | Better Market Functioning | Increasing Consumer’s Prosperity | Ensuring Green Transportation | |
|---|---|---|---|---|---|
| Increased self-consumption | X | X | |||
| Reduced CO2 emissions | X | ||||
| Reduced electricity costs | X | X | |||
| Reduced peak load | X | ||||
| Reduced transportation costs | X | ||||
| Improved air quality in the community | X | X | |||
| Reduced transmission losses | X | ||||
| Deferred capacity investments | X | ||||
| Increased social benefits in the local community | X | X |
| Benefit | Metric | Self-Consumption Scenario | ||
|---|---|---|---|---|
| 50% | 80% | 95% | ||
| Increased self-consumption | The increase in Nisyros’ self-consumption due to the installation of a wind park and PV. | 3345 MWh (PV 12.9% Wind 36.3%) | 5415 MWh (PV 16.5% Wind 63.2%) | 6462 MWh (PV 16% Wind 79%) |
| Reduced CO2 emissions | The difference between the reduction in operational CO2 emissions due to the production of energy from RES and the emissions emitted during the production phase of the newly installed component infrastructure. | 3050 tCO2 | 4185 tCO2 | 5025 tCO2 |
| Reduced electricity emissions | Reduction in electricity costs for the municipality of Nisyros and its citizens due to an increase in self-consumption due to RES. | 3345 MWh × 150 EUR /MWh = 501,750 EUR | 5415 MWh × 150 EUR /MWh = 812,250 EUR | 6462 MWh × 150 EUR /MWh = 969,000 EUR |
| Reduced peak load | Peak to mean ratio (PMR) load reduction | 0% | −2.20% | −3.12% |
| Reduced transportation costs | Reduction in transportation costs for the municipality of Nisyros due to the replacement of diesel vehicles with EVs. | 12,970.9 EUR | 15,548.7 EUR | 16,851.8 EUR |
| Improved air quality in community | Reduction in CO2 emissions in the municipality of Nisyros due to the replacement of diesel vehicles with EVs | 10.3 tCO2 | 21.5 tCO2 | 27.1 tCO2 |
| Reduced transmission losses | Reduction in transmission losses on the underwater transmission cable coming from the thermal stations of Kos and Kalymnos. | −19.24% | −53.70% | −86.19% |
| Increased self-consumption | The increase in Nisyros’ self-consumption due to the installation of a wind park and PV. | 3345 MWh (PV 12.9% Wind 36.3%) | 5415 MWh (PV 16.5% Wind 63.2%) | 6462 MWh (PV 16% Wind 79%) |
| Reduced CO2 emissions | The difference between the reduction in operational CO2 emissions due to the production of energy from RES and the emissions emitted during the production phase of the newly installed component infrastructure. | 3050 tCO2 | 4185 tCO2 | 5025 tCO2 |
| Benefit | Direct or Indirect Monetary Gains | Self-Consumption Scenario | ||
|---|---|---|---|---|
| 50% | 80% | 95% | ||
| Reduced CO2 emissions | Contribution of the municipality to reducing the country’s total carbon emission by linking it to the social cost of carbon (SCC). SCC for Greece is calculated as the five scenarios average of [49], combining the socio-economic, climate, and impact data—that is, the marginal damages from CO2 emissions—for an average of the possible scenarios for sustainable development using exogenous and endogenous discounting factors. | 3060.3 tCO2 × 0.56 EUR /tCO2 = 1713.758 EUR | 4206.5 tCO2 × 0.56 EUR /tCO2 = 2355.64 EUR | 5052.1 tCO2 × 0.56 EUR /tCO2 = 2829.176 EUR |
Disclaimer/Publisher’s Note: The statements, opinions and data contained in all publications are solely those of the individual author(s) and contributor(s) and not of MDPI and/or the editor(s). MDPI and/or the editor(s) disclaim responsibility for any injury to people or property resulting from any ideas, methods, instructions or products referred to in the content. |
© 2023 by the authors. Licensee MDPI, Basel, Switzerland. This article is an open access article distributed under the terms and conditions of the Creative Commons Attribution (CC BY) license (https://creativecommons.org/licenses/by/4.0/).
Share and Cite
Papadopoulos, C.; Bachoumis, A.; Skopetou, N.; Mylonas, C.; Tagkoulis, N.; Iliadis, P.; Mamounakis, I.; Nikolopoulos, N. Integrated Methodology for Community-Oriented Energy Investments: Architecture, Implementation, and Assessment for the Case of Nisyros Island. Energies 2023, 16, 6775. https://doi.org/10.3390/en16196775
Papadopoulos C, Bachoumis A, Skopetou N, Mylonas C, Tagkoulis N, Iliadis P, Mamounakis I, Nikolopoulos N. Integrated Methodology for Community-Oriented Energy Investments: Architecture, Implementation, and Assessment for the Case of Nisyros Island. Energies. 2023; 16(19):6775. https://doi.org/10.3390/en16196775
Chicago/Turabian StylePapadopoulos, Charalampos, Athanasios Bachoumis, Niki Skopetou, Costas Mylonas, Nikolaos Tagkoulis, Petros Iliadis, Ioannis Mamounakis, and Nikolaos Nikolopoulos. 2023. "Integrated Methodology for Community-Oriented Energy Investments: Architecture, Implementation, and Assessment for the Case of Nisyros Island" Energies 16, no. 19: 6775. https://doi.org/10.3390/en16196775
APA StylePapadopoulos, C., Bachoumis, A., Skopetou, N., Mylonas, C., Tagkoulis, N., Iliadis, P., Mamounakis, I., & Nikolopoulos, N. (2023). Integrated Methodology for Community-Oriented Energy Investments: Architecture, Implementation, and Assessment for the Case of Nisyros Island. Energies, 16(19), 6775. https://doi.org/10.3390/en16196775