Abstract
The demand for green hydrogen is increasing, as it is estimated to reduce ten percent of total global green-house-gas emissions from fossil fuel. The solid oxide electrolysis cell (SOEC) is an electrochemical energy-conversion device (EECD) that produces green hydrogen via steam electrolysis. It is preferred to other EECDs for clean hydrogen production owing to its high efficiency, robust kinetics, and lack of precious-metal requirements for cell construction. Herein, we report a Multiphysics model describing the transport phenomena in the SOEC. The governing equations used in the model include a thorough description of the electrode kinetics and of the behavior of the three electrode–electrolyte interfaces in the cell. For the first time, the effect of the scandium-doped zirconia (SCGZ), yttrium-stabilized zirconia (YSZ), and gadolinium-doped ceria (GDC) electrolytes was modeled at different temperatures and pressures. By linking the convection and diffusion equations with the Butler–Volmer at shorter scales, a true representation of the cell operation was simulated. Our models show a R2 value of over 0.996 in predicting the cell-polarization curves and electrochemical properties at the given operating conditions. The impedance of the SCGZ was 0.0240 Ohm.cm2. This value was two- and four-fold lower than the values of the YSZ and GDC, respectively. Furthermore, our theoretical findings of both the polarization data and the impedance were in good agreement with the experimental data.
1. Introduction
Global energy demands and the need to reduce reliance on fossil fuels have led to a search for an alternative source of energy that is clean, sustainable, reliable, and accessible globally [1]. Green hydrogen is emerging as an option that satisfies all these requirements. It is produced through the electrolysis of water using electricity produced from renewable sources of energy. Hydrogen produced globally through electrolysis is projected to rise to 14 MT by 2030 (a 55% increase from 2021) [2]. The solid oxide electrolysis cell (SOEC) is a promising technology that is being developed as an electrochemical energy-conversion device (EECD) for H2 production. These SOECs are utilized for large-scale electrolysis operations instead of other EECDs, such as proton-exchange-membrane electrolysis cells, alkaline electrolysis, etc., due to thee fast kinetics of their electrolysis reactions. Additionally, SOECs have a high efficiency, of over 75%, and no precious metals, like platinum, are required for their construction. They also provide flexibility of operation in various feeds, such as CO2. The operation of SOECs in fuel-cell mode can be used to power electricity grids, whereas this option for reversible operations is not present in other EECDs. The cell consists of a ceramic electrolyte sandwiched between porous cathode and anode layers, which acts as catalyst for electrolysis reactions. The assembly is enclosed between interconnections, which provides a flow channel for the supply of feed and the exit of the products, as shown in Figure 1a, which also illustrates the overall cell reaction and operation. The cell utilizes high-temperature steam, which is supplied through the manifold electrodes to the flow channel. The steam diffuses into the cathode as depicted in Figure 2a, and it is reduced to hydrogen gas and oxide ions. The hydrogen diffuses back through the electrode and into the gas channel, and the oxide ions are conducted through the electrolyte into the anode, as illustrated in Figure 2b. At the anode, the oxide ions react to form oxygen gas. The oxygen gas is taken out of the cell through a carrier gas, as depicted in Figure 2c.
Figure 1.
(a) Components of SOEC. (b) SOEC’s working principle.
Figure 2.
(a) Diffusion of steam into cathode. (b) Hydrogen-evolution reaction in cathode t and oxide-ion conduction. (c) Oxygen-evolution reaction in anode.
Multiphysics modeling is a key approach to understanding the macroscopic functioning of the SOEC. It takes account of multiple physical phenomena occurring within cells, such as mass transfer, fluid dynamics, electrochemical reaction kinetics, etc. The incorporation of these phenomena into a single model helps to provide a better understanding of the interdependence of these phenomena and to accurately predict cell performance. This approach is critical for optimizing the design of the cell and the operating conditions. Many studies of SOECs have been performed to assess the temperature distribution, Nernst potential distribution, current-density distribution, hydrogen-concentration distribution across electrolytes, triple-phase boundary (TPB) [3], overpotential [4], area-specific resistance (ASR) [5], impact of the flow configuration [6], and effect of delamination [7,8] using 0D and 1D equations. The details of the cell design, the experimental findings, and the empirical model’s results are listed in Table 1.
Table 1.
Review of literature available on multiphysics modeling of a SOEC.
The performance of the SOEC components is characterized using cell-polarization data and impedance data [3,4]. The polarization curve gives the relationship between the current density applied and the potential difference measured across the cell, and it can provide a fundamental understanding of the overall losses measured across range of the applied current. The polarization curve is divided into three regions based on the types of loss experienced in particular regions. The low-current region (0–0.2 A-cm−2) is primarily dominated by activation losses. Activation loss occurs due to the demand for higher potential to overcome the activation-energy barrier of the reaction. The intermediate current region (0.3–1 A-cm−2) suffers from primarily ohmic losses. Ohmic losses are caused by the electrical and ionic resistance in the cell components. The high-current region (over 1 A-cm−2) is dominated by mass-transport losses. Mass-transport losses result from slow mass-transfer rates of species from and to electrodes.
Impedance plots, such as Bode and Nyquist plots, help to understanding fundamental aspects of cell kinetics and transport phenomenon [9]. Additionally, impedance plots help to characterize the contribution of each type of loss (activation, ohmic, and mass-transport), which is not possible in a polarization curve, thus aiding greatly in material characterization and diagnosing failure modes. Jensen et al. [9] modelled impedance spectra in SOEC using equivalent circuit fitting to study the impact of the degradation of cells on cell performance. No multiphysics models of the role of transport phenomena of SOEC in simulating impedance were found in the literature. However, such a model was reported by Yixiang Shi et al. [10] for a solid oxide fuel cell (SOFC). They reported a model to simulate the transient impedance response of a SOFC by coupling the electrochemical equations with the convection, reaction, and diffusion terms in the mass-balance equation.
The authors of the available research on modeling report their results in terms of polarization data. There is an inadequate amount of research that reports models of both polarization and impedance data for evaluating and characterizing SOEC performance. No research has been published on utilizing polarization and impedance modelling to benchmark the performances of the materials used in the SOEC components. Therefore, the objectives of the present work are as follows:
- To develop a theoretical model to assess polarization and impedance for three different SOECs based on the following criteria: the model shall evaluate the performances of three electrolyte materials, namely yttrium-stabilized zirconia (YSZ), gadolinium-doped ceria (GDC), and scandium-, cerium-, and gadolinium-doped zirconia (SCGZ).
- To ensure that the model reveals how operating conditions such as temperature and pressure affect the performance of cell.
For the first time, the effects of temperature and pressure on three electrolytes, SCGZ, YSZ, and GDC, is theoretically modeled and validated for an operating cell.
2. Materials and Methods
2.1. Multiphysics Modeling
Simplified block diagram of the model workflow used in the present study is provided in Figure 3.
Figure 3.
Model-workflow diagram.
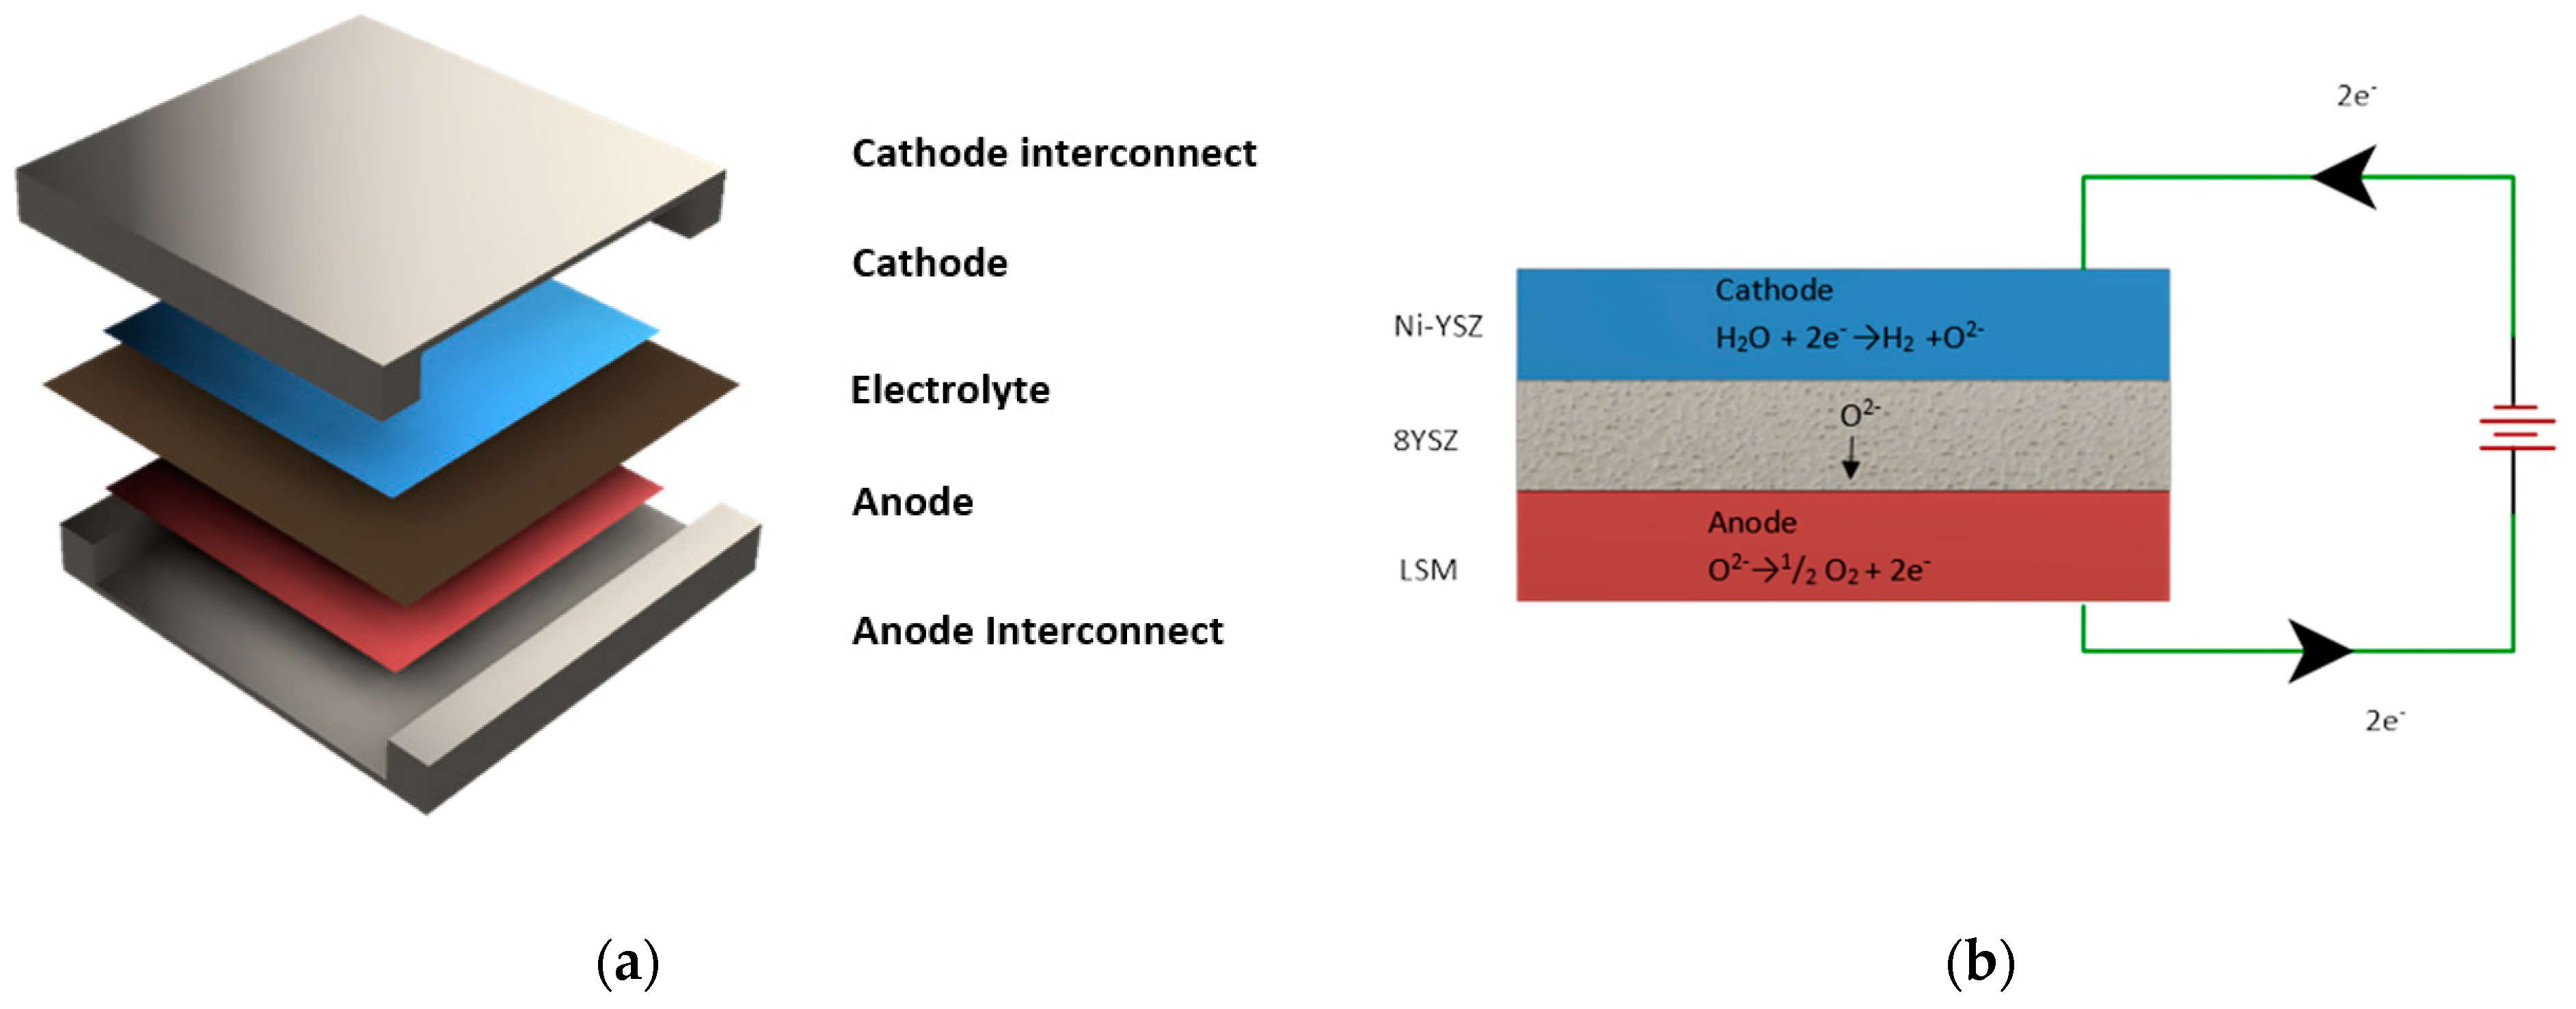
2.1.1. Model Description
Model dimensionality of a finite element model refers to the spatial dimensions of the geometry in the model. Models with lower dimensionality allow incorporation of more complex physics at the expense of spatial fidelity [11]. A zero-dimensional model can help in understanding interdependence of system variables, such as cell potential, current density, temperature, pressure, and gas-flow rate, thus helping in determining kinetic and net ohmic losses [12]. A one-dimensional model can help in accounting for physical phenomena across lines in cells. A 1-D approach is used either to model electrochemical reactions and gas-species transport across the thicknesses of cell layers (flow channels, electrodes, and electrolytes) [13] or to model feed depletion across gas channels. Internal boundary conditions are defined at interfaces to distinguish processes at each layer. A two-dimension model uses the 1-D model’s dimension and an additional direction (either across or along the channel). A 2-D model can provide insights into impact of flow configuration and distribution of species and temperature across a plane [14]. However, the present work requires an understanding of distribution of electric potentials and species concentrations in three-dimensional space. Thus, a 3D geometry was used to model the kinetics and the transport phenomena. The following equations were selected for the model”
- (i)
- Continuity equation.
- (ii)
- Momentum-conservation equation (Brinkman equation—modified Navier–Stokes).
- (iii)
- Species conservation (mass balance).
- (iv)
- Charge balance and electrochemical kinetics (Butler–Volmer equation and Nernst equation).
These equations were solved at a steady state for obtaining polarization data and in variable frequency domain in order to obtain impedance data through a commercial finite-element-method solver (COMSOL 5.6). The application files and user manual provided for SOEC modeling were used as template [15,16]. The FEM utilizes numerical methods to solve the governing partial differential equation of the system. In FEM, the geometrical domain is discretized into smaller parts, called finite elements. The discretization is achieved by construction of a mesh. The solution is approximated within each element using a set of basis functions. The resulting system of equations is solved using numerical methods to obtain the solution for the entire system. The model is valid under following assumptions:
- (1)
- The kinetics and the mass transfer occurring the cell are in steady state.
- (2)
- Model is operated only in low- and intermediate-current regions and, thus, the mass-transport loss is assumed be negligible and ignored.
- (3)
- The gas species involved in the reaction follows ideal gas law.
- (4)
- The species are assumed to follow Newton’s law of viscosity.
- (5)
- All flows are assumed to be laminar due to the low velocity of gas species.
2.1.2. Governing Equations
The model couples the transport equations in the flow channel and electrode with the electrochemical equations to obtain polarization and impedance data. The equations used for the model are discussed in this section.
- Transport in Gas Channel
Mass continuity for gas-flow channel is given by
where is the density of the fluid in kg.cm−3 and is the velocity of the fluid in m.s−1.
Momentum conservation for the gas mixture in the channel is given by
where is the pressure in Pa, is the dynamic viscosity in Pa.s, represents an identity matrix, and Tr represents a trace operation.
Species conservation in the channel is given by
where is the mass fraction of species i, is the diffusive mass flux of species in mol.m−2.s−1, and is the mass source or sink in mol.m−3.s−1 for species i.
Diffusive mass flux is given by
where is the diffusion coefficient of component i in m2.s and is the diffusion’s driving force in m−1.
The diffusion’s driving force is given by
where is the mole fraction of component k and is the pressure gradient measured across.
- Transport in Electrode
Mass continuity for the electrodes is given by
where is the porosity of the electrode and is the mass source term.
Momentum conservation for the gas mixture in the electrodes is given by
where is the permeability of the porous medium in m2 and is used to account for influence of other forces, like gravity, in N.
Species conservation in the electrode is given by
- Electrochemical Equations and Charge Balance
The Nernst equation is given by
where is the equilibrium potential in V, is the standard potential in V, R is the universal gas constant in J.mol−1.K−1, T is the temperature in K, n is the number of electrons in the reaction, F is the Faraday constant in C.mol−1, is the partial pressure of species i in Pa, is the reference pressure of component i, and is the stoichiometric coefficient of species i in the reaction.
The Butler–Volmer equation for the anode and cathode is given by
The exchange-current density is given by
The cell overpotential is given by
where is the current density in A.m−2, is the exchange-current density A.m−2, and are the forward and backward charge-transfer coefficients, respectively, and is the activation overpotential in V. The is the reference exchange-current density in A.m−2, at a given temperature and is the pressure dependence of species i. The and are the electrode and electrolyte potential in V, respectively.
The charge balance in the electrode and electrolyte is given by
where and and are the electrode and electrolyte conductivities in S.m−1, respectively, and are the electrode and electrolyte potential in V, respectively, and is the volumetric current density consumed by the electrochemical reactions in A.m−3.
- Impedance Equations
The current supplied to the cell during impedance modeling contains a stationary component and a frequency-domain perturbation, and it is given by
where is the overall current supplied in A.m−2, is the stationary component of the current, is the magnitude of the perturbation current, is imaginary number iota, is the angular frequency in Hz, is the frequency in Hz, and t is the time period in sec.
The potential response measured is given by
where is the overall voltage response from the cell in V, voltage response to the stationary component of the current in V, i.e., the DC component, is the magnitude of voltage response to the perturbation current, and is the phase difference in degrees between current and voltage. The impedance is given by
where is the magnitude of impedance in Ohm.m2, is the real component in impedance, and is the imaginary component in impedance.
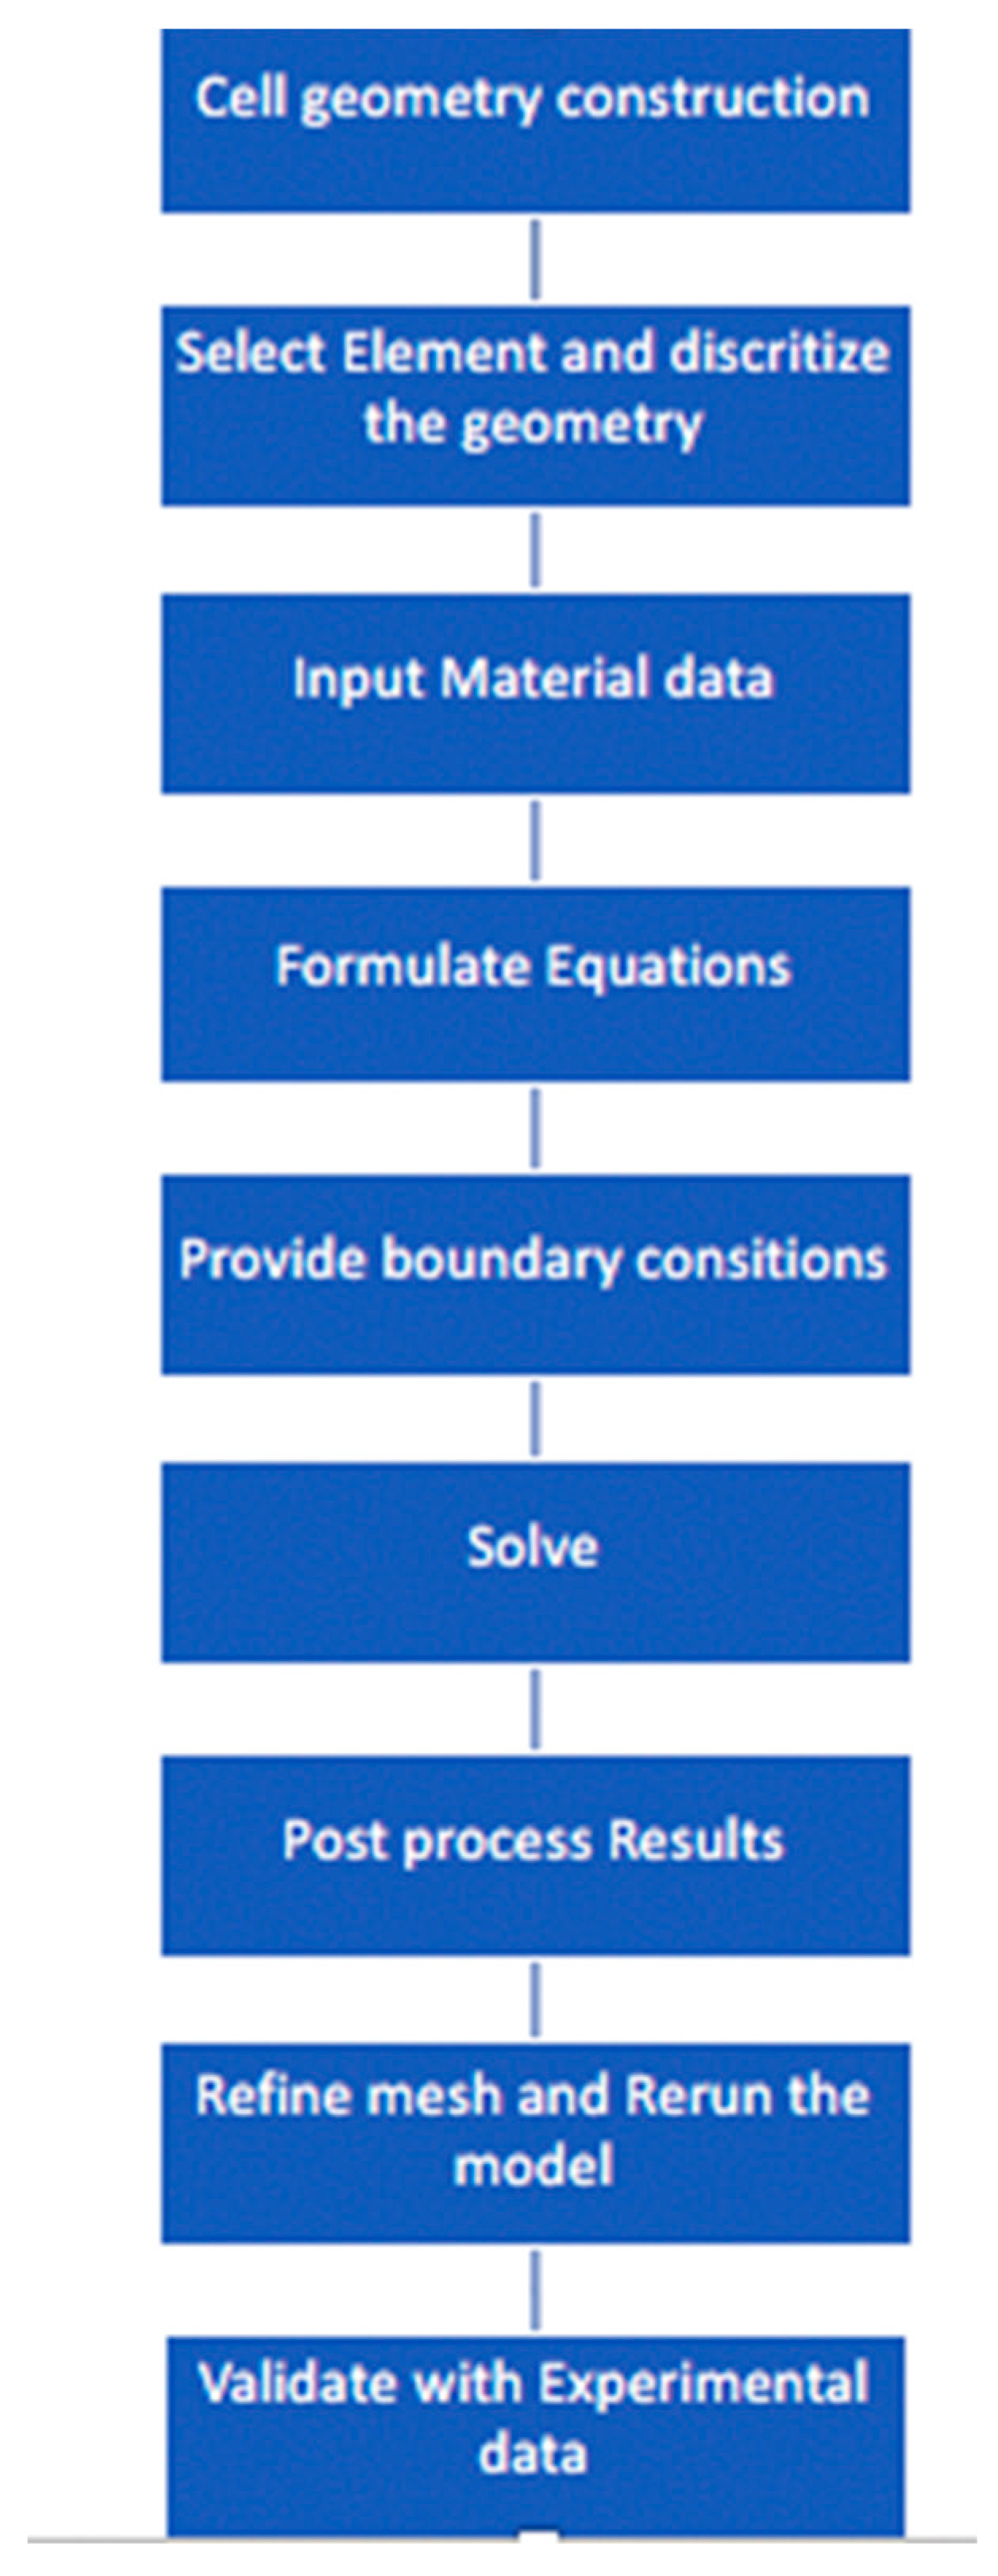
2.1.3. Numerical Details
The proposed model is of a simplified planar SOEC with anode, electrolyte, and cathode with a steam-flow channel. The geometry is discretized using the default meshing tool available in COMSOL 5.6. The material properties, such as electrical and ionic conductivities, were sourced from [17]. The experimental work of Temluxame et al. [18] was adapted to define operating conditions for the model (flow rates, composition, temperature, and pressure). The cell dimensions and operating conditions used in the model are reported in Table 2. Electrochemical parameters for the cathode and anode, such as reference exchange-current density, charge-transfer coefficients, and pressure dependence and porosity of the electrode and electrolyte were fitted to validate the experimental polarization results (i-V curve) from [18]. The material properties of the components and the fitted electrochemical parameters are reported in Table 3. The impedance was calculated for the frequency range of 1 Hz to 107 Hz for a perturbation amplitude of 0.005 A.m−2 at a stationary current of 1 A.cm−2
Table 2.
Dimensions and operating condition of the cells.
Table 3.
Material properties and electrochemical parameters for the model.
2.1.4. Validation Criteria
The model’s validation was performed using polarization data and the coefficient of determination, or R2 value, was utilized to evaluate the validity of the model against experimental data. The R2 value was used as the criterion for measuring the fit, as it provided a standardized metric to evaluate the efficacy of the model (values ranged from 0 to 1), whereas other common criteria, such as MSE, MAE, and RMSE, are dependent on the scale of the response variable, thus making the interpretation complex. A high R2 value implies the good fit of the model.
For a dataset with n datapoints,
where is the coefficient of determination, is the observed value, is the calculated value, and is the mean of all the observed values.
3. Results and Discussion
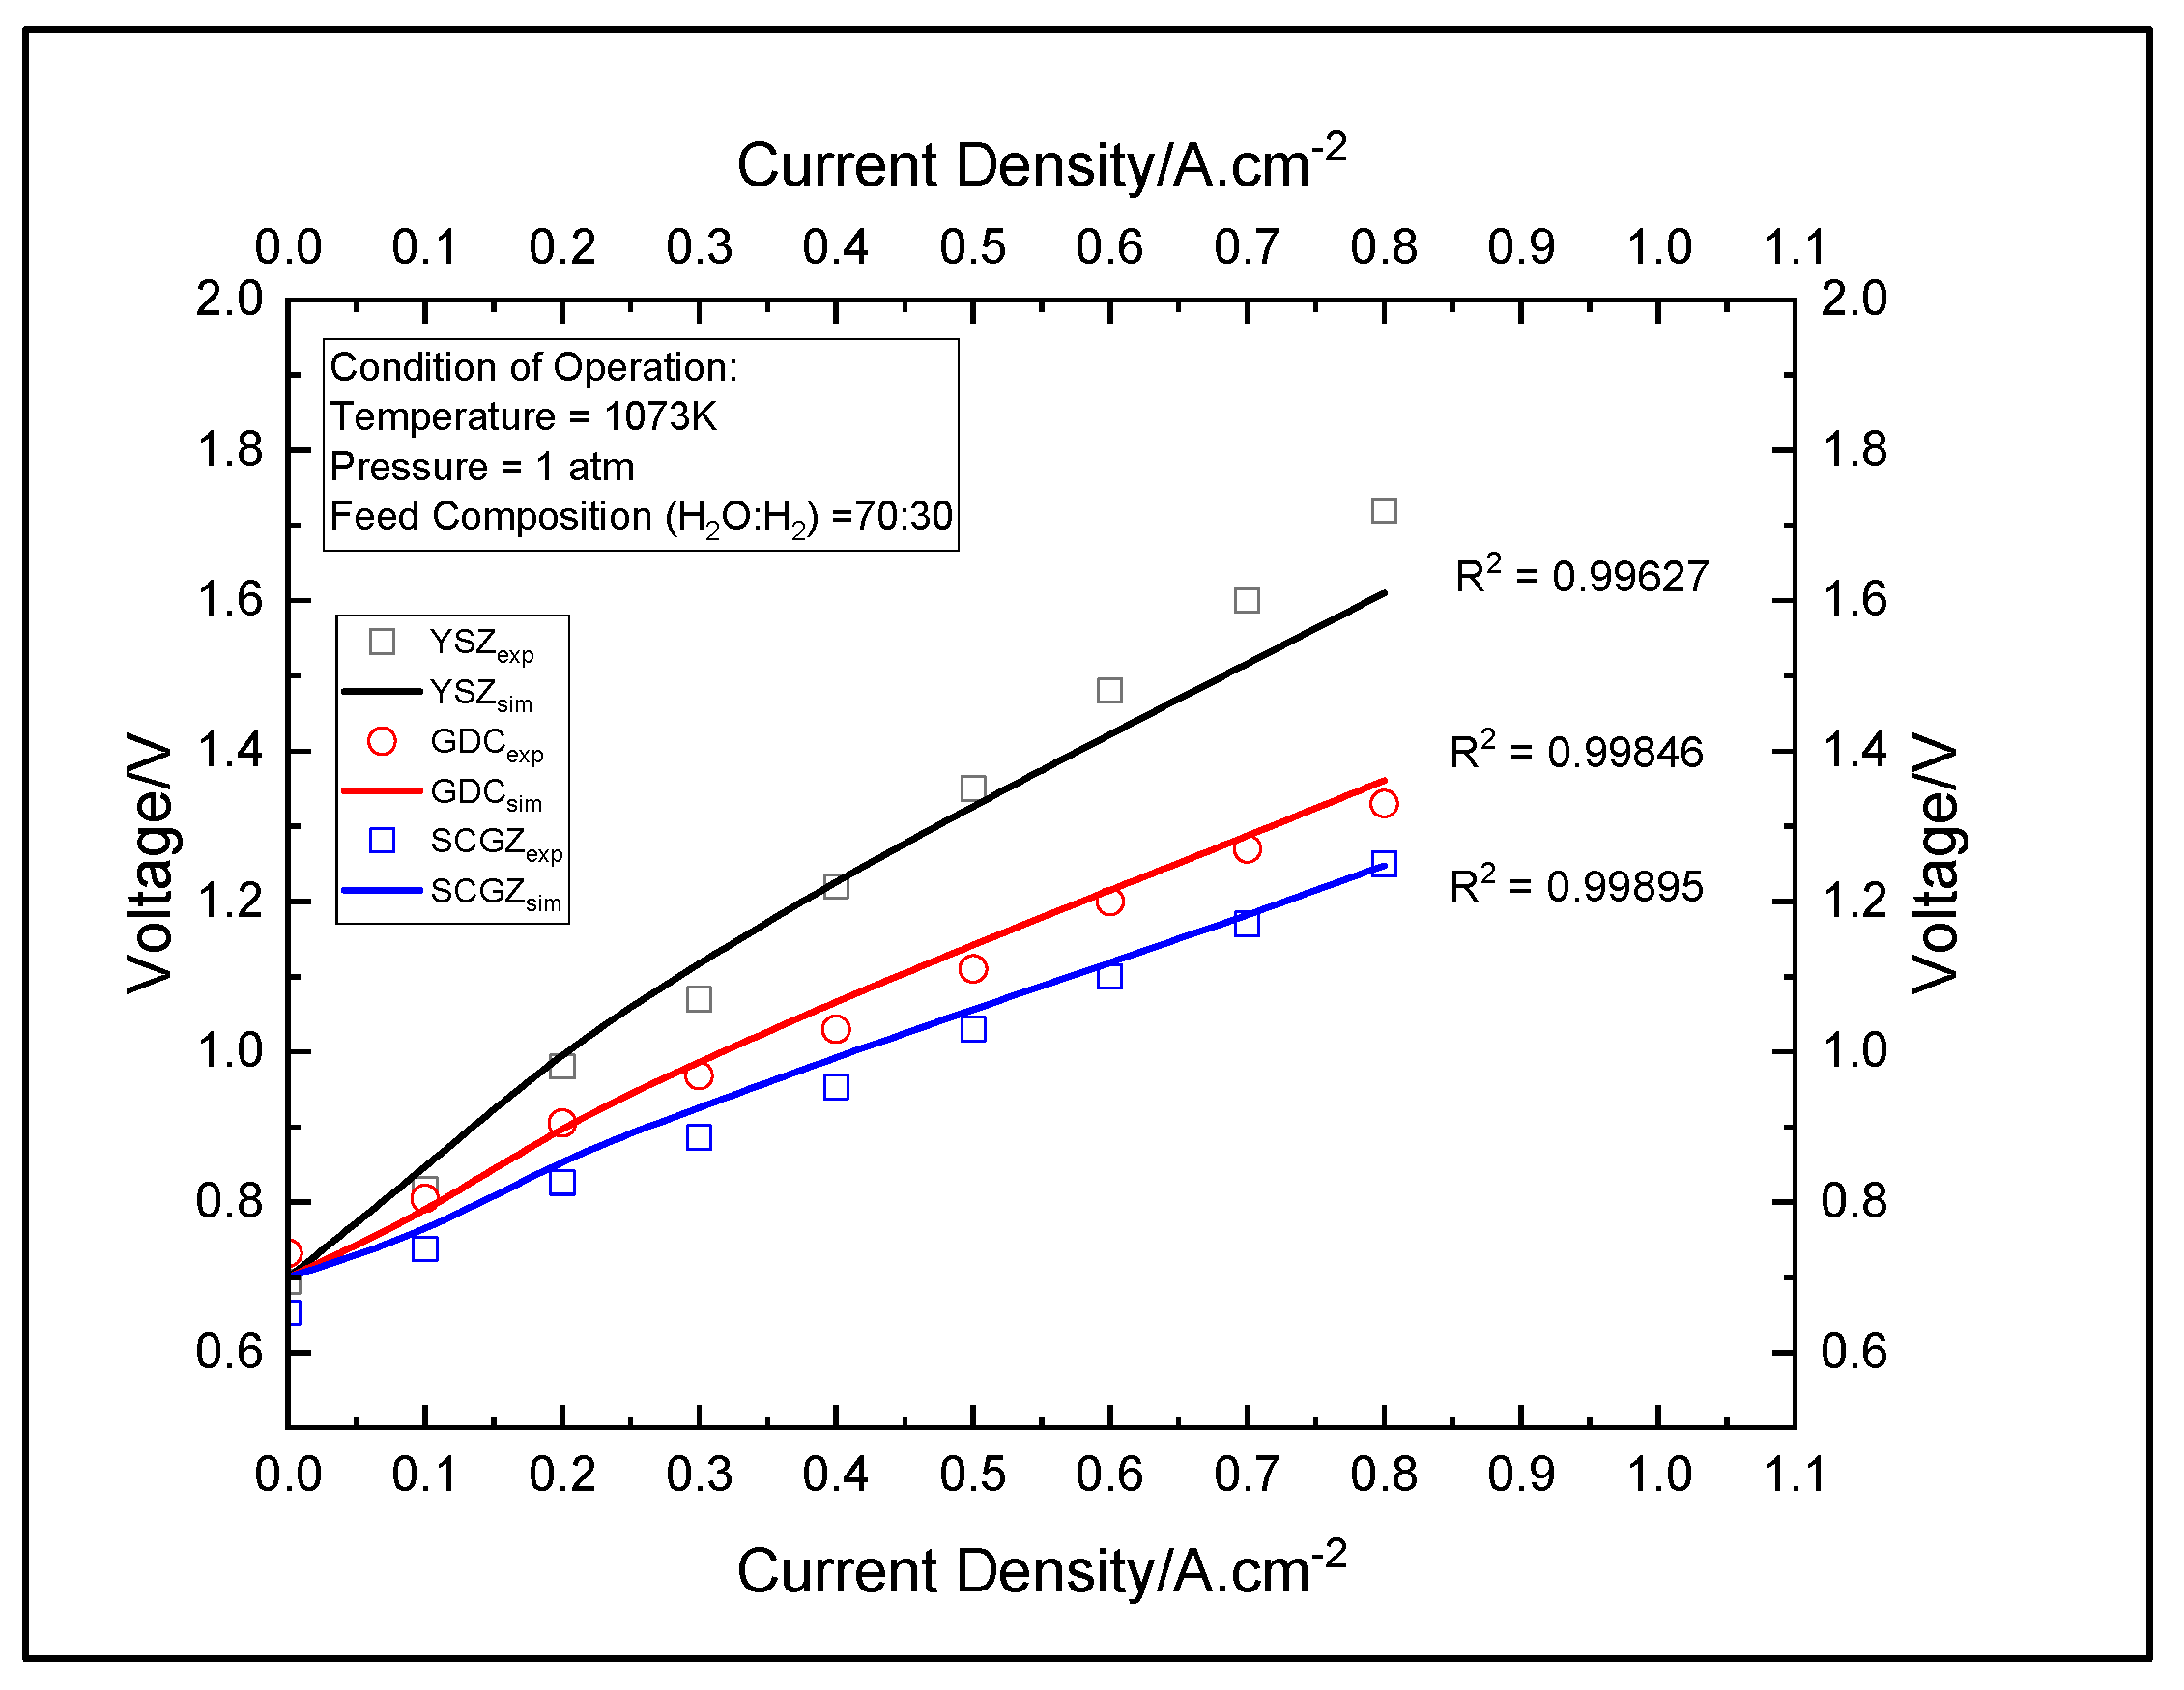
3.1. Validity of the Model
The validity of the polarization and the impedance model were confirmed using the polarization data reported in Figure 3. The model evaluated the performance of the cell for three electrolytes, namely YSZ, GDC, and SCGZ, at a temperature of 1073 K, 1 atm of pressure, and a steam:hydrogen ratio of 70:30. The results were then compared with the experimental data. The R2 values for the models of the cells with YSZ, GDC, and SCGZ as the electrolytes were found to be 0.99627, 0.99848, and 0.99895, respectively, thus demonstrating that the model provided an excellent fit with the experimental data. Mass-transport losses are very low in SOECs due to their high-temperature operations.
3.2. Comparison of the Electrolytes
The polarization plot and Nyquist plot in Figure 4 and Figure 5, respectively, were used to determine the best-performing electrolyte. The SCGZ demonstrated the best performance of the three electrolytes, as it had the lowest losses recorded for the entire range of operating current, as shown by the polarization curve, and it had the lowest polarization resistance, of 0.0240 Ohm.cm2; the YSZ and GDC had polarization resistances of 0.0885 Ohm.cm2 and 0.0428 Ohm.cm2 respectively. By taking YSZ as the benchmark, we can report that GDC has 51.63% less polarization resistance and SCGZ has 72.88% less polarization resistance at 1073 K. The reduction in the ohmic losses and resistance can be attributed to the fact that the SCGZ had higher ionic conductivity at the given temperatures than the YSZ and GDC. The variance in conductivities was due to the structural differences between the three electrolytes. The zirconia- and ceria-based electrolytes formed a fluorite structure (MO2), in which the tetravalent cations (Zr4+, Ce4+) assumed a face-centered cubic arrangement and the oxide ions occupied the tetrahedral interstitial sites [19]. The structure leaves a large number of octahedral interstitial voids to allow the conduction of oxide ions. Zirconia can only form fluorites at temperatures above 2370 °C [20]; thus, it requires dopants like Y3+ or Sc3+ to be stabilized into a fluorite structure at lower temperatures. Although ceria does not require dopants to stabilize it into a fluorite structure at low temperatures, it is usually doped with rare-earth sesquioxides, like gadolinium sesquioxide or samarium sesquioxide, to improve conductivity, as ceria displays extensive solid solutions with these sesquioxides.
Figure 4.
Polarization curve for establishing.
Figure 5.
Impedance curves for YSZ-, GDC-, and SCGZ--based validity of the model.
The present work recognizes ionic conductivity of the material as the most critical factor affecting the performances of electrolytes. The SCGZ was identified as the best electrolyte out of the three electrolytes studied due to its high ionic conductivity. However, in practical applications, more criteria, such as electrical conductivity, durability, mechanical strength, and cost are also evaluated. The most commonly used electrolyte for solid oxide cells is YSZ (8% yttria doping), but with attempts to shift to lower operating temperatures (600–800 °C), other zirconia- and ceria-based electrolytes with dopants, like scandia and gadolinia are being are being explored. In particular, ScSZ (10% scandia doping) has received wide attention due to its high conductivity in the 600–800 °C range [21]. However, ScSZ shows significant degradation in long operations at high temperatures (1000 °C for 1000 h). The co-doping of ScSZ with CeO2 (10 mol%Sc2O3−1%CeO2) has been adapted to counter ageing and improve stability and conductivity. In addition to conductivity and stability, SCGZ also demonstrates high mechanical strength and toughness, which are desirable properties for an electrolyte. These factors make SCGZ a promising material for adaption into commercial SOECs.
3.3. Effects of Operating Conditions on Cell Performance
The impact of operating conditions such as temperature and pressure has been studied using polarization and impedance data. For an operating condition to positively affect cell performance, it needs to lower the losses computed in the polarization curve and to reduce the resistances computed in the Nyquist plot.
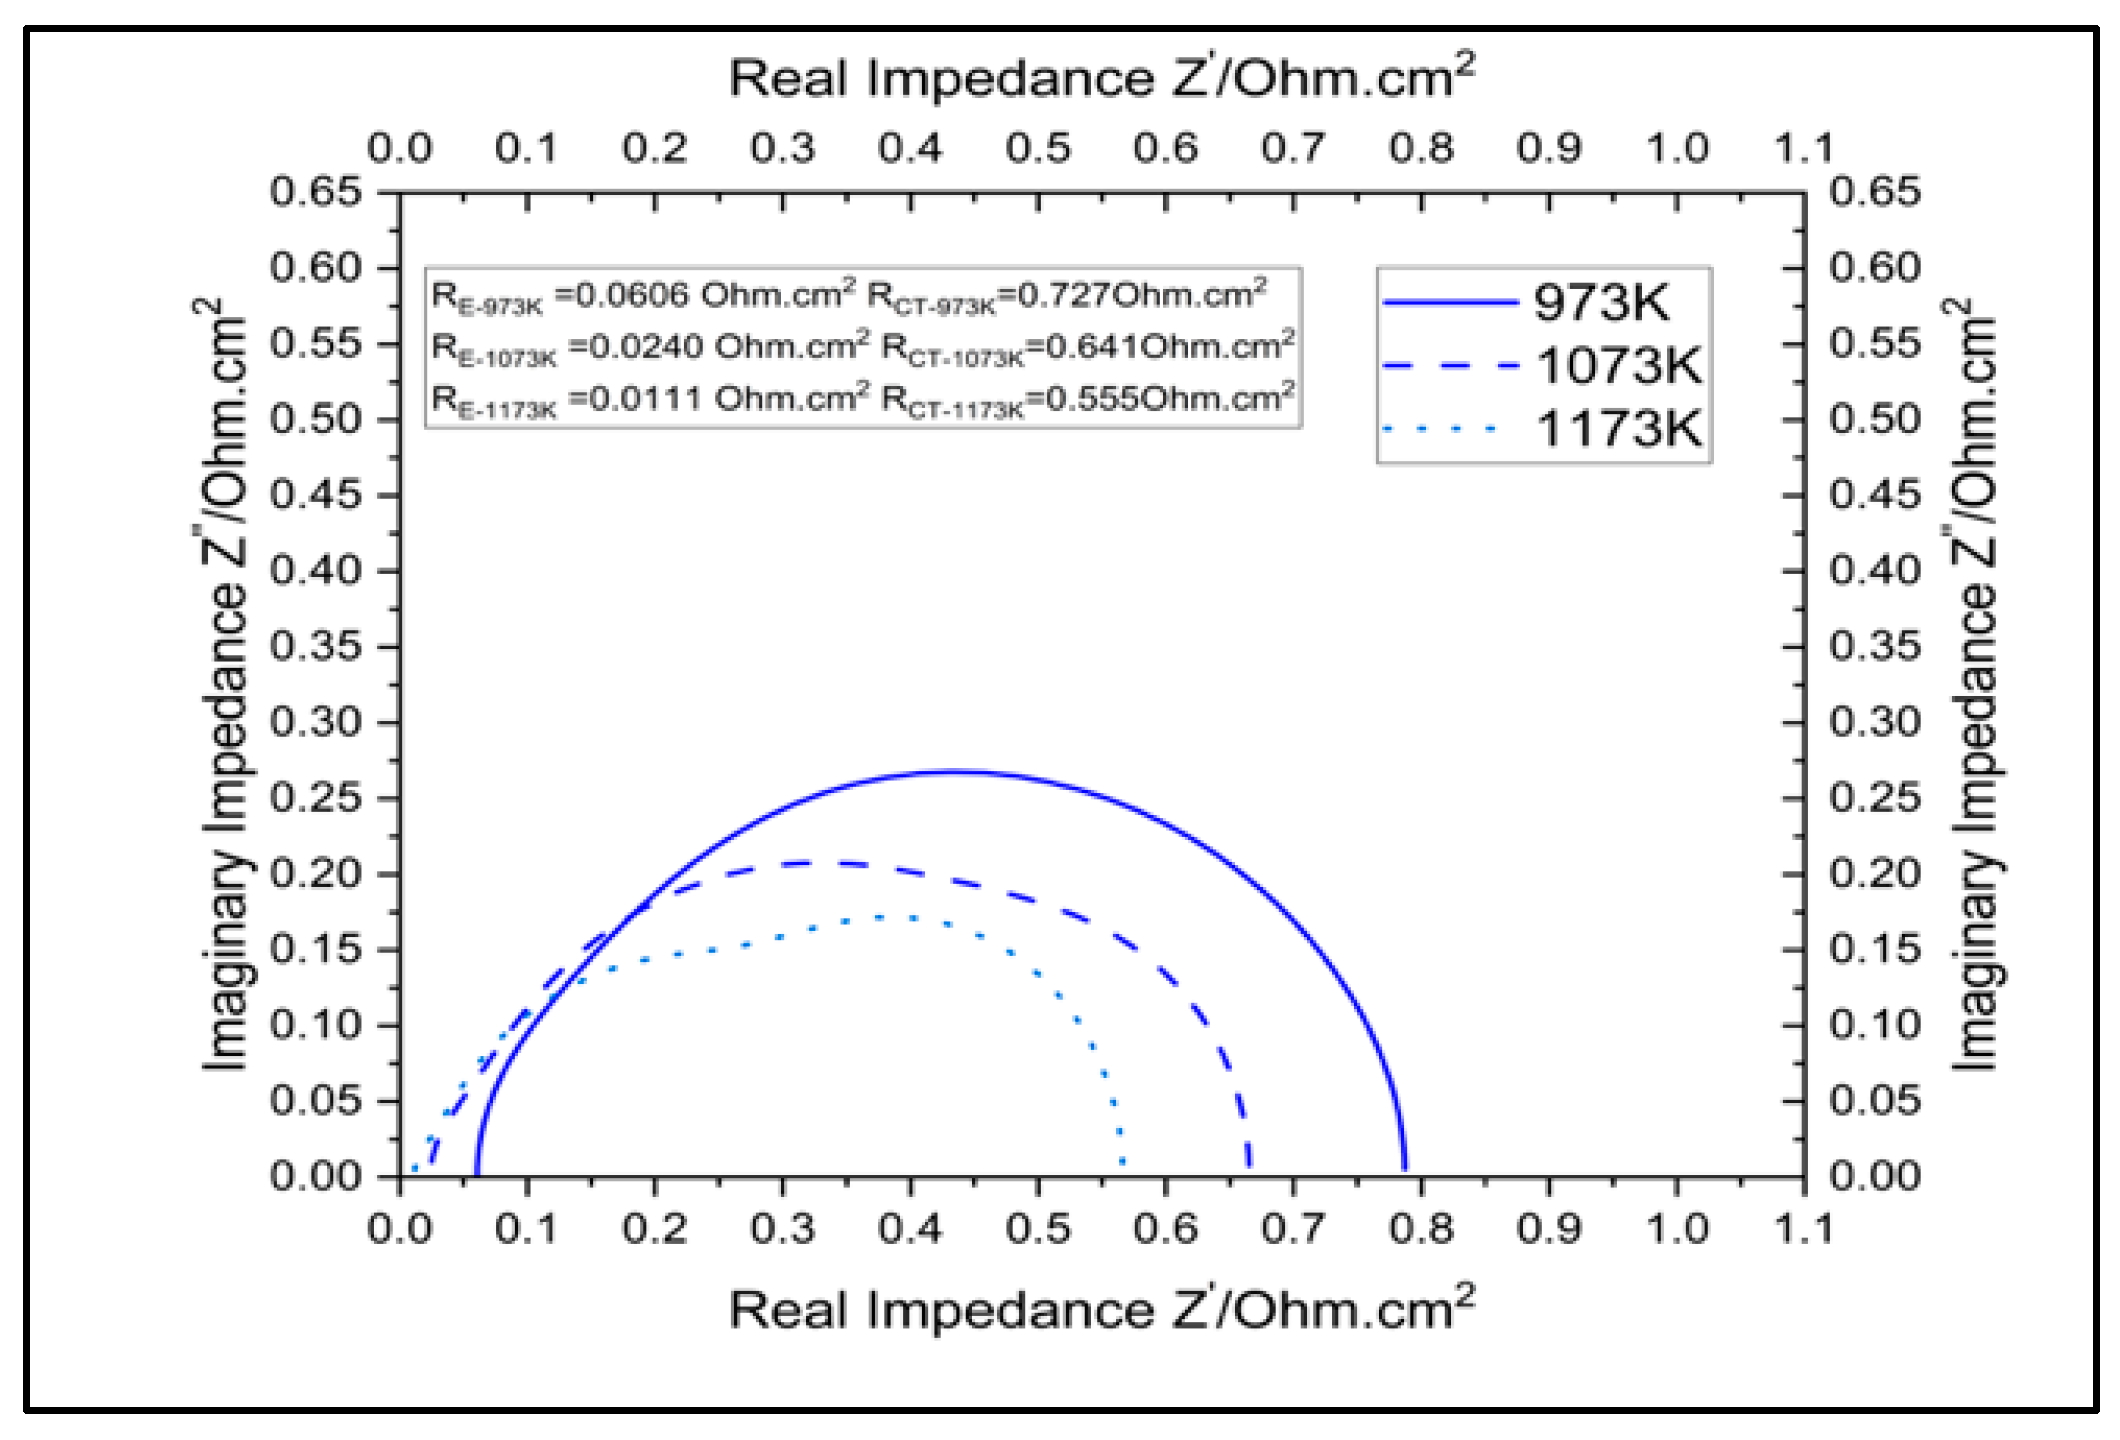
3.3.1. Impact of Temperature on Cell Performance
Figure 6 and Figure 7 report the polarization and impedance of a cell with SCGZ as the electrolyte at 973 K, 1073 K, and 1173 K. By using 0.1 A.cm−2 and 0.6 A.cm−2 as reference points for the activation and ohmic regions in the polarization curves and taking a voltage simulated at 973 K as the baseline, reductions in potential of 5.2% and 10.2% at 1073 K and of 7.6% and 16.29% at 1173 K were observed for the activation and ohmic reference points, respectively. The impedances simulated at the specified temperature are reported in Table 4. Taking operation at 973 K as the baseline, drops in polarization and charge-transfer resistance of 60.39% and 11.89%, respectively, at 1073 K, and reductions of 81.68% and 23.65%, respectively, at 1173 K, were observed.
Figure 6.
Impact of temperature on polarization of the cell.
Figure 7.
Impact of temperature on impedance of the cell.
Table 4.
Impedance computed at various operating conditions.
The reductions in the activation and ohmic losses and in the resistance were due to the improved kinetics and conductivity in the cell. The increase in temperature led to an increase in the Tafel slope, which in turn led to an increase in kinetic losses. However, the increase in temperature exponentially increased the exchange-current density, which compensated for the Tafel-slope increase and significantly reduced the kinetic and ohmic losses computed in the cell [22]. In addition, operation at higher temperatures also increase the conductivities of all the cell components, leading to reductions in contact losses and resistance. The impact of high-temperature operations on the long-term stability of the cell is not addressed in the present model. Longer exposures to high temperatures cause thee sintering of the microstructure in electrodes, which leads to the agglomeration of the fine-grained particles in electrodes (hydrogen electrodes in particular). This agglomeration leads to the loss of active sites in electrodes, which decreases cell performance. Rises in the operating temperature increase the rate of this degradation mechanism [23,24,25,26,27]. Thus, it can be inferred that higher-temperature operations improve cell performance, as identified in the model. However, for longer operations, the operating temperature needs to be optimized to balance the performance and the long-time durability of the cell.
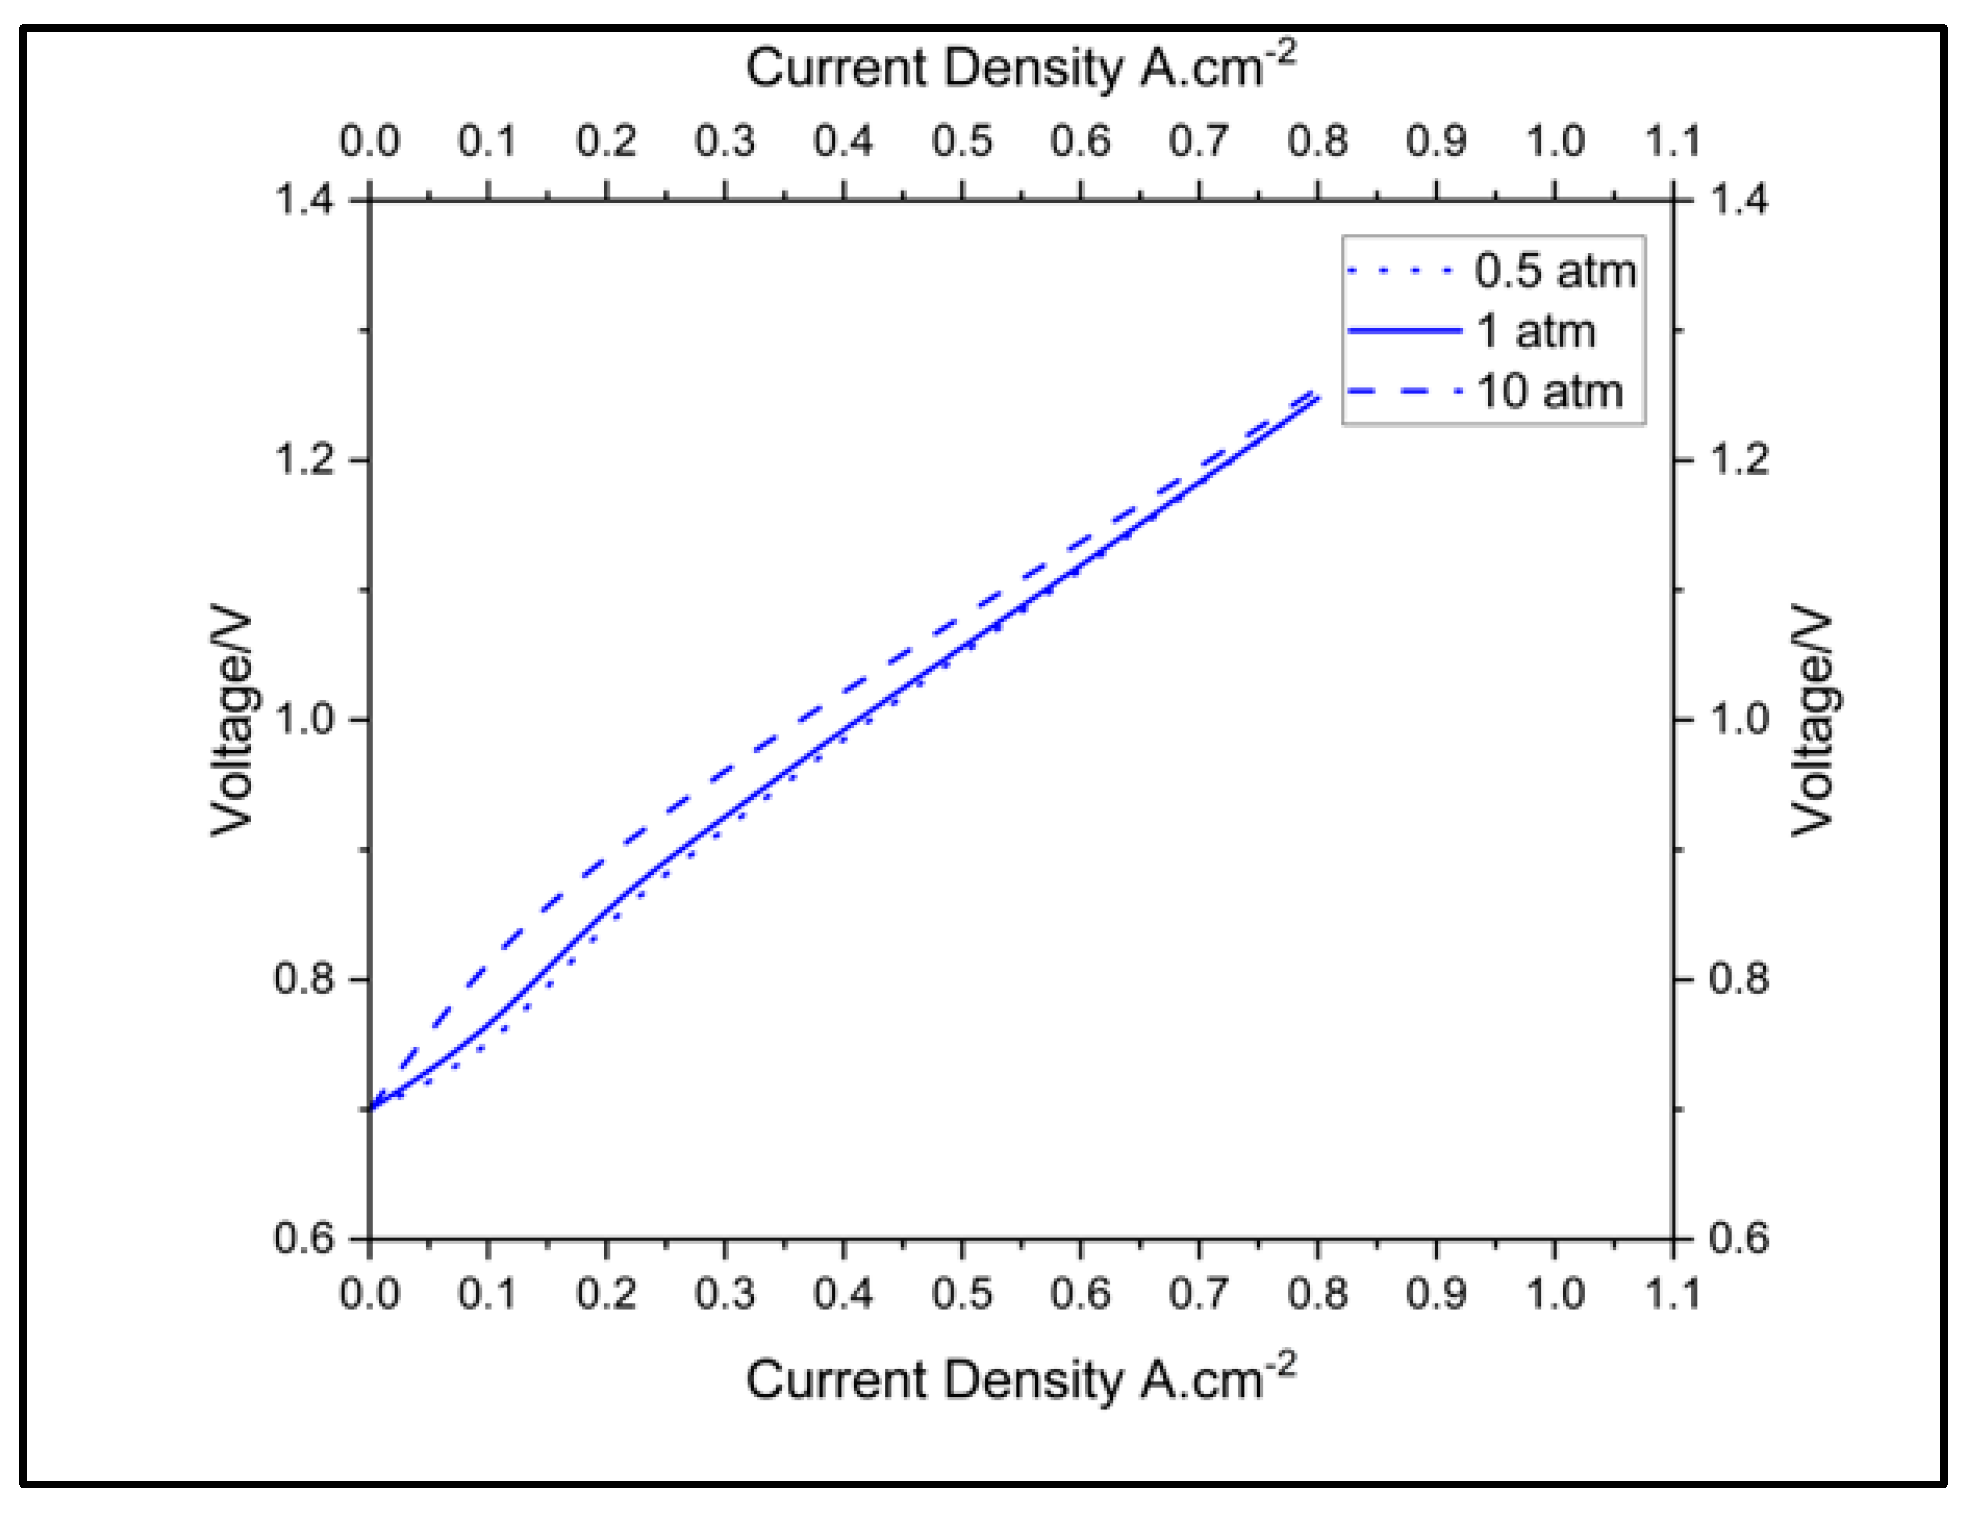
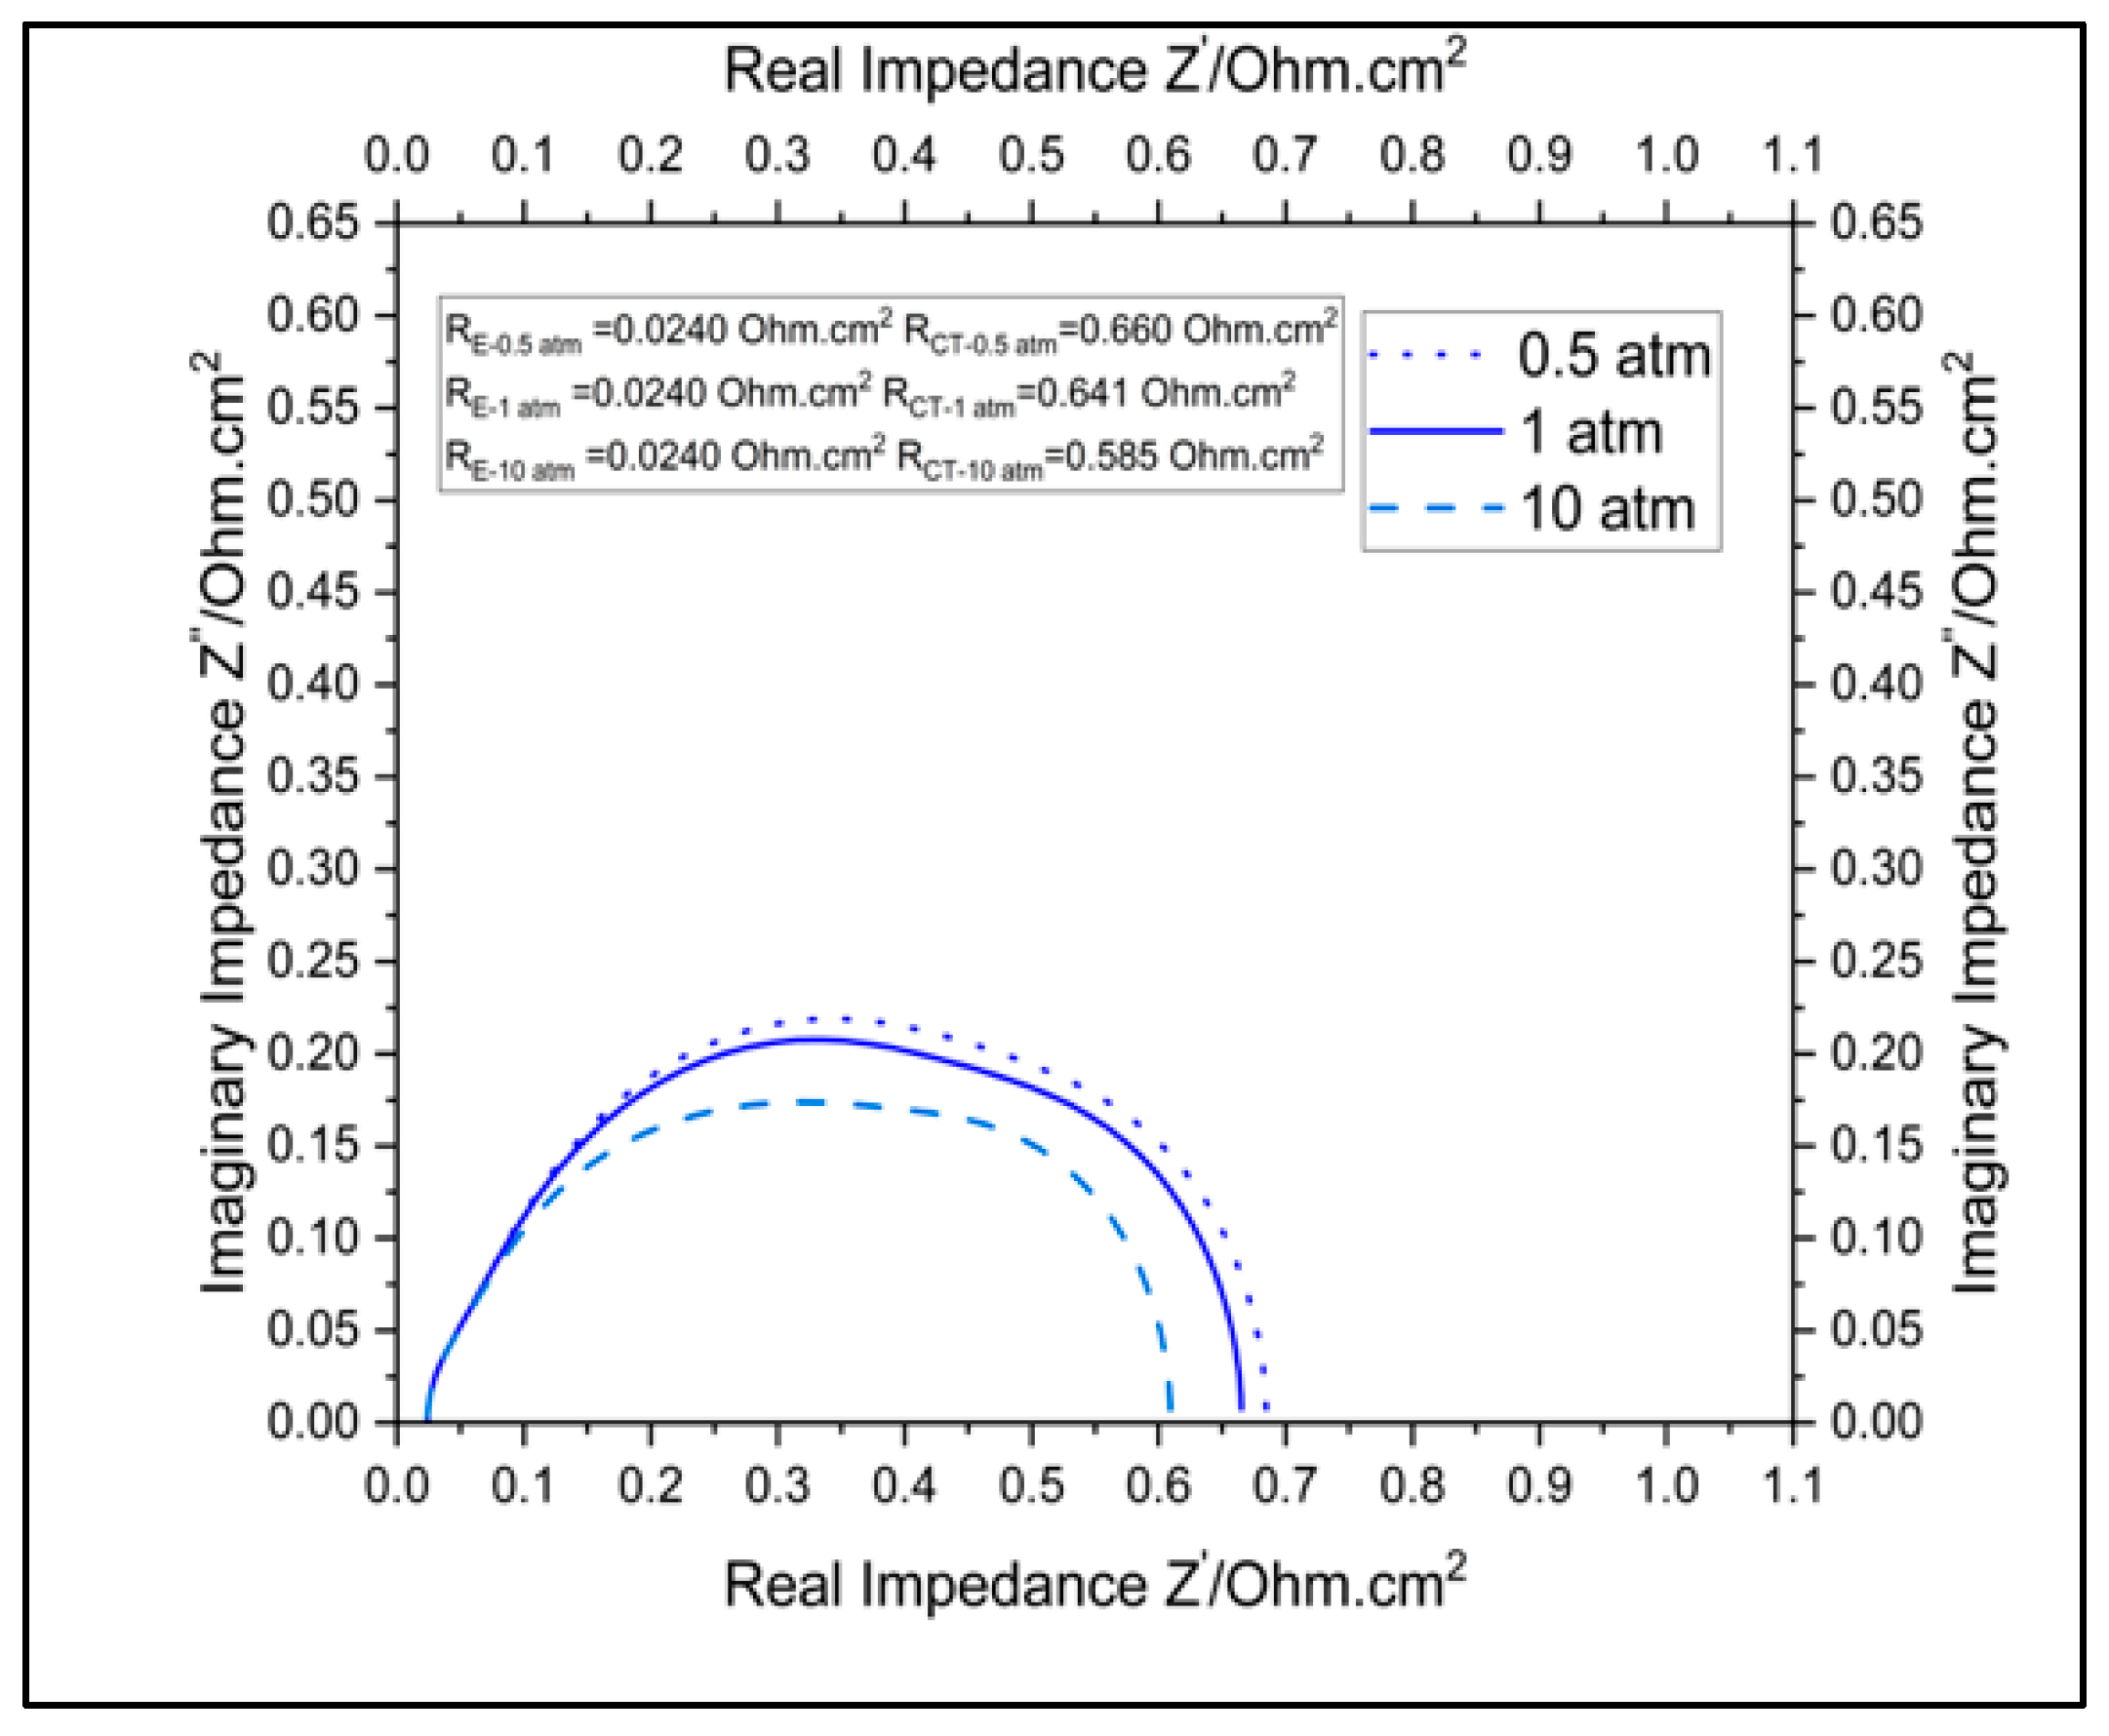
3.3.2. Impact of Pressure on Cell Performance
The plots in Figure 8 and Figure 9 show the effects of pressure on the polarization and impedance of a cell in the SCGZ case at 0.5, 1, and 10 atm. When taking 0.1 A.cm−2 as a reference in the activation region, the cell voltages modeled for the three pressures (values) were 0.751 V, 0.765 V, and 0.812 V, respectively. When taking 0.5 atm as the baseline, increases in potential of 1.8% at 1 atm and 8.12% at 10 atm were identified. These increases in cell potential can be attributed to increases in the Nernst potential, particularly in the anode. However, in the ohmic region, the differences in voltage for the three pressures seemed to diminish. The impedances for the three pressures are reported in Table 4. It was identified that increases in pressure reduced the charge transfer resistance. At 1 atm of pressure, there was a 2.94% reduction and at 10 atm of pressure, there was a 11.39% reduction in charge-transfer resistance compared to the baseline operation at 0.5 atm. However, the pressure did not have an observable impact on the polarization resistance of the cell. The improvement in charge-transfer resistance with increases can be attributed to the impact of the pressure on the exchange-current density. Exchange-current density is proportional to surface concentration, which is in turn directly proportional to pressure [22]. The increase in the exchange-current density improved the current density in the cell and lowered the charge-transfer resistance at the bias current, for which the impedance was computed from both the model and the experiments. There was no observable impact of the pressure on the ohmic region or on the polarization resistance, as pressure does not have an impact on intrinsic properties like the conductivity of cell materials.
Figure 8.
Impact of pressure on polarization of the cell.
Figure 9.
Impact of pressure on impedance of the cell.
4. Conclusions
The present work reported the use of a finite-element model to assess the performances of YSZ-, GDC-, and SCGZ-based SOECs. The performances of the cells were evaluated using modeled polarization and impedance data at three different temperatures and pressures. All the modeled datasets were validated with experimental data for the electrolytes. The R2 values for the models of the cells with YSZ, GDC, and SCGZ as the electrolytes were found to be 0.99627, 0.99848, and 0.99895, respectively. Higher ionic conductivity in the electrolyte reduces both polarization and charge-transfer resistances significantly, leading to better performance. It was observed that the SCGZ provided the best performance of the three electrolytes studied. The SCGZ had the lowest polarization resistance computed, of 0.0240 Ohm.cm2; by comparison, the YSZ and GDC had polarization resistances of 0.0885 Ohm.cm2 and 0.0428 Ohm.cm2 respectively. An increment of 200 K over the baseline operation of 973 K was found to reduce the voltage simulated in the activation and ohmic regions by 7.6% and 16.29%, respectively. At 1173 K, the polarization and charge-transfer resistance simulated were also found to decrease, by 81.68% and 23.65%, respectively, compared to the baseline operation. An elevated operation pressure (10 atm) compared to the baseline operating pressure (0.5 atm) was found to increase the voltage measured in the activation region by 8.12%, but this difference in voltage diminished in the ohmic region of the polarization curve. At 10 atm, the simulated charge-transfer resistance was found to decrease by 11.39% compared to the operation at 0.5 atm. However, the elevated pressure did not have an observable impact on the polarization resistance of the cell. By contrast, the SCGZ-based SOEC operated at 1173 K at 10 atm.
Author Contributions
Methodology, S.S., S.R.D., D.S. and J.T.; Software, S.R.D.; Validation, R.K.C.; Formal analysis, D.S.; Investigation, A.K.; Data curation, R.K.C.; Supervision, J.T. All authors have read and agreed to the published version of the manuscript.
Funding
This research received no external funding.
Data Availability Statement
Data cannot be shared due to privacy restriction.
Conflicts of Interest
The authors declare no conflict of interest.
Nomenclature
| SOEC | Solid oxide electrolysis cell |
| EECD | Electrochemical energy-conversion device |
| SCGZ | Scandium-doped zirconia (SCGZ) |
| YSZ | Yttrium-stabilized zirconia |
| GDC | Gadolinium-doped ceria |
| CeO2 | Cerium oxide |
| CO2 | Carbondioxide |
| TPB | Triple-phase boundary |
| ASR | Area-specific resistance |
| FEM | Finite-element method |
| SOFC | Solid oxide fuel cell |
References
- IEA. World Energy Outlook 2022; License: CC BY 4.0; IEA: Paris, France, 2022. [Google Scholar]
- IEA. Global Hydrogen Review 2022; License: CC BY 4.0; IEA: Paris, France, 2022. [Google Scholar]
- Hawkes, G.L.; O’Brien, J.E.; Stoots, C.M.; Herring, J.S.; Shahnam, M. Computational fluid dynamics model of a planar solid-oxide electrolysis cell for hydrogen production from nuclear energy. Nucl. Technol. 2004, 158, 132–144. [Google Scholar] [CrossRef]
- Grondin, D.; Deseure, J.; Brisse, A.; Zahid, M.; Ozil, P. Simulation of a high temperature electrolyzer. J. Appl. Electrochem. 2010, 40, 933–941. [Google Scholar] [CrossRef]
- Yildiz, B.; Smith, J.; Sofu, T. Thermal-Fluid and Electrochemical Modeling and Performance Study of a Planar Solid Oxide Electrolysis Cell: Analysis on SOEC Resistances, Size, and Inlet Flow Conditions; No. ANL-06/52; Argonne National Lab. (ANL): Argonne, IL, USA, 2008. [Google Scholar]
- Xu, Z.; Zhang, X.; Li, G.; Xiao, G.; Wang, J.Q. Comparative performance investigation of different gas flow configurations for a planar solid oxide electrolyzer cell. Int. J. Hydrogen Energy 2017, 42, 10785–10801. [Google Scholar] [CrossRef]
- Navasa, M.; Yuan, J.; Sundén, B. Computational fluid dynamics approach for performance evaluation of a solid oxide electrolysis cell for hydrogen production. Appl. Energy 2015, 137, 867–876. [Google Scholar] [CrossRef]
- Jin, X.; Xue, X. Computational fluid dynamics analysis of solid oxide electrolysis cells with delaminations. Int. J. Hydrogen Energy 2010, 35, 7321–7328. [Google Scholar] [CrossRef]
- Jensen, S.H.; Hauch, A.; Knibbe, R.; Jacobsen, T.; Mogensen, M. Modeling degradation in SOEC impedance spectra. J. Electrochem. Soc. 2013, 160, F244. [Google Scholar] [CrossRef]
- Shi, Y.; Cai, N.; Li, C.; Bao, C.; Croiset, E.; Qian, J.; Hu, Q.; Wang, S. Simulation of electrochemical impedance spectra of solid oxide fuel cells using transient physical models. J. Electrochem. Soc. 2008, 155, B270. [Google Scholar] [CrossRef]
- Weber, A.Z.; Borup, R.L.; Darling, R.M.; Das, P.K.; Dursch, T.J.; Gu, W.; Harvey, D.; Kusoglu, A.; Litster, S.; Mench, M.M.; et al. A critical review of modeling transport phenomena in polymer-electrolyte fuel cells. J. Electrochem. Soc. 2014, 161, F1254. [Google Scholar] [CrossRef]
- Bianchi, F.R.; Baldinelli, A.; Barelli, L.; Cinti, G.; Audasso, E.; Bosio, B. Multiscale modeling for reversible solid oxide cell operation. Energies 2020, 13, 5058. [Google Scholar] [CrossRef]
- Ni, M. Modeling of a solid oxide electrolysis cell for carbon dioxide electrolysis. Chem. Eng. J. 2010, 164, 246–254. [Google Scholar] [CrossRef]
- Ni, M. 2D thermal modeling of a solid oxide electrolyzer cell (SOEC) for syngas production by H2O/CO2 co-electrolysis. Int. J. Hydrogen Energy 2012, 37, 6389–6399. [Google Scholar] [CrossRef]
- COMSOL Multiphysics® v. 5.6. Fuel cell and Electrolyser Module User’s Guide; COMSOL: Burlington, MA, USA, 2020; pp. 75–84.
- COMSOL Multiphysics® v. 5.6. Solid Oxide Electrolyzer Using Thermodynamics; Application ID: 74001; COMSOL: Burlington, MA, USA, 2020.
- Xu, H.; Ni, M. High-temperature electrolysis and co-electrolysis. In Power to Fuel; Academic Press: Cambridge, MA, USA, 2021; pp. 51–73. [Google Scholar]
- Temluxame, P.; Puengjinda, P.; Peng-Ont, S.; Ngampuengpis, W.; Sirimungkalakul, N.; Jiwanuruk, T.; Sornchamni, T.; Kim-Lohsoontorn, P. Comparison of ceria and zirconia based electrolytes for solid oxide electrolysis cells. Int. J. Hydrogen Energy 2020, 46, 24568–24580. [Google Scholar] [CrossRef]
- Kendall, K.; Kendall, M. High-Temperature Solid Oxide Fuel Cells for the 21st Century: Fundamentals, Design and Applications; Elsevier: Amsterdam, The Netherlands, 2015. [Google Scholar]
- Yashima, M.; Masato, K.; Masahiro, Y. Metastable-stable phase diagrams in the zirconia-containing systems utilized in solid-oxide fuel cell application. Solid State Ion. 1996, 86, 1131–1149. [Google Scholar] [CrossRef]
- Ruh, R.; Garrett, H.J.; Domagala, R.F.; Patel, V.A. The system zirconia scandia. J. Am. Ceram. Soc. 1977, 60, 399–403. [Google Scholar] [CrossRef]
- Barbir, F. PEM Fuel Cells: Theory and Practice; Academic Press: Cambridge, MA, USA, 2012. [Google Scholar]
- Kulikovsky, A.A.; Berg, P. Positioning of a reference electrode in a PEM fuel cell. J. Electrochem. Soc. 2015, 162, F843. [Google Scholar] [CrossRef]
- Finklea, H.; Chen, X.; Gerdes, K.; Pakalapati, S.; Celik, I. Analysis of SOFCs using reference electrodes. J. Electrochem. Soc. 2013, 160, F1055. [Google Scholar] [CrossRef]
- Cimenti, M.; Co, A.C.; Birss, V.I.; Hill, J.M. Distortions in Electrochemical Impedance Spectroscopy Measurements Using 3 Electrode Methods in SOFC. I. Effect of Cell Geometry. Fuel Cells 2007, 7, 364–376. [Google Scholar] [CrossRef]
- Cimenti, M.; Co, A.C.; Birss, V.I.; Hill, J.M. Distortions in Electrochemical Impedance Spectroscopy Measurements Using 3 Electrode Methods in SOFC. II. Effect of Electrode Activity and Relaxation Times. Fuel Cells 2007, 7, 377–391. [Google Scholar]
- Tran, A.-T.; Huet, F.; Ngo, K.; Rousseau, P. Artefacts in electrochemical impedance measurement in electrolytic solutions due to the reference electrode. Electrochim. Acta 2011, 56, 8034–8039. [Google Scholar] [CrossRef]
Disclaimer/Publisher’s Note: The statements, opinions and data contained in all publications are solely those of the individual author(s) and contributor(s) and not of MDPI and/or the editor(s). MDPI and/or the editor(s) disclaim responsibility for any injury to people or property resulting from any ideas, methods, instructions or products referred to in the content. |
© 2023 by the authors. Licensee MDPI, Basel, Switzerland. This article is an open access article distributed under the terms and conditions of the Creative Commons Attribution (CC BY) license (https://creativecommons.org/licenses/by/4.0/).