1. Introduction
Based on latest research findings and the recent IPCC 6th Assessment Report, there is an urgent need for decarbonizing the global economy and reducing the emissions of anthropogenic greenhouse gases (GHGs) [
1,
2] that have devastating impacts on the environment, ecosystems, climate, and human health [
3,
4,
5]. The Paris Agreement, which is adopted by 195 countries in an effort to combat the growing threat of climate change [
6,
7,
8,
9], has set the global goal of limiting the rise of global average temperature to well below 2 °C above pre-industrial levels, aiming to limit the increase to 1.5 °C. This goal requires rapid and deep decarbonization processes of the global economy, including a shift towards renewable technologies, energy efficiency improvements as well as the expansion of carbon capture and storage (CCS) technologies.
The transition to a low-carbon economy, to an economic system that aims to minimize greenhouse gas emissions, involves the reduction of fossil fuel use across sectors, significant changes to current global energy systems, transportation systems, and land use practices [
10], as well as many other changes related to our lifestyles (behavioral changes), energy efficiency, and consumption patterns [
11,
12]. As a crucial part of the decarbonization routes, i.e., the various pathways and strategies employed to reduce carbon dioxide and other greenhouse gas emissions, energy efficiency targets have been widely used by policymakers to reduce energy consumption patterns and consumers’ energy bills and create job opportunities while reducing GHG emissions [
13]. National governments aiming to combat climate change have implemented various climate policies to accelerate the transition to low-carbon energy systems. An example of these policies is carbon pricing, a measure that has been adopted by numerous countries and regions including the European Union, Canada, and China [
14]. A wide range of modeling tools have been developed to examine the decarbonization pathways and assess the impacts of different policy scenarios on GHG emissions, fuel mix, technology uptake, and system costs. Integrated assessment models (IAMs), for example, can simulate the interactions between the economy, energy, and climate systems and evaluate the effectiveness of different mitigation policies to inform policy decisions.
In recent years, numerous studies have employed diverse modeling approaches to examine potential decarbonization pathways at both global and national levels to understand their impacts under different technology and policy choices. These studies consistently support the notion that energy system decarbonization is not only plausible but technically feasible. However, they also underscore the need for substantial investments in low-carbon technologies and infrastructure as well as ambitious and rapid climate action. To shed light on the intricacies of energy system decarbonization, several studies have examined the output of multiple energy system models. For instance, a comprehensive analysis presented in [
15] scrutinizes the output of six energy system models focusing on global energy mix and emission trajectories. Another study [
16] evaluated three distinct models and showed that the projected decarbonization costs are largely influenced by the assumptions made on the technology costs and on technology deployment rates. Other studies have focused on the potential role of specific technologies and policies. One study [
17] examined the potential role for carbon capture and storage (CCS) technologies in reducing the emissions of the power sector while several others [
18,
19,
20] explored the potential for renewable energy expansion to achieve the goals set by the Paris Agreement. The impacts of decarbonization extend beyond the energy sector. For example, a study [
21] assessed the employment effects associated with Germany’s energy transition, while another [
22] analyzed the potential repercussions of decarbonization on global energy prices and trade. Additionally, research efforts have been dedicated to exploring the diverse climate policy architectures, i.e., the range of measures, regulations, and actions implemented by governments and international organizations to mitigate climate change and its impacts, aiming to foster cooperation among countries [
23], as well as investigating the potential co-benefits of emission reduction for air quality and public health [
24].
Overall, the literature on global energy system projections, viz, all uses of energy for power, transportation, heating, cooling, and industrial processes and decarbonization scenarios, was found to be diverse and complex, reflecting the multi-dimensional situation of the energy transition. Even though significant progress has been made in understanding the decarbonization pathways, there are still significant gaps that persist and demand attention. The focus of existing literature on specific regions or sectors leaves a gap in comprehensively addressing the global perspective. Therefore, it is imperative to fill this gap and develop a holistic understanding of the global energy landscape to effectively tackle climate change challenges. A key limitation identified in existing models used to investigate emission reduction pathways is the reliance on simplified exogenous assumptions regarding technological innovation [
25,
26], behavioral change [
27], and political acceptance or willingness [
28,
29,
30,
31]. These limitations underscore the need for more sophisticated modeling approaches that consider the dynamic and complex nature of these factors. Moreover, previous research focused on the application of carbon pricing as the only policy measure, while in the real world several policy instruments are used to reduce emissions, including both market-based (e.g., emissions trading systems) or regulatory instruments (e.g., phase-out obligations, efficiency or
standards, etc.). To effectively achieve the goals of the Paris Agreement, it is important to close the aforementioned gaps and develop more thorough, integrated models. These models should account for the intricate interrelationships between different sectors and leverage potential synergies between market- and regulatory-based policy measures. By doing so, a more accurate representation of the low-carbon transition can be achieved, enabling policymakers to make informed decisions and design effective strategies.
Global decarbonization scenarios have emerged as pivotal tools in assessing the possible pathways towards achieving the ambitious targets outlined in the Paris Agreement. These scenarios are typically developed using integrated assessment models (IAMs) to project a range of possible future energy uses and GHG emissions under different policy assumptions. Furthermore, these scenarios incorporate crucial factors such as technological progress, socio-economic developments, and demographic changes. However, there is a need to bridge the existing gap in global decarbonization scenarios by conducting a comprehensive analysis using multiple models to highlight the differences (variations or discrepancies that can arise when different models are employed) and enhance our understanding of achieving a sustainable future on a global scale.
To facilitate the development of effective climate policies and energy efficiency targets, it is important to have a thorough understanding of how these policies can potentially impact the global energy mix and the future trajectory of key sectors such as the building sector. IAMs have been developed to help policymakers and stakeholders explore the potential effects of different policy scenarios on the energy system, the environment, and the economy [
27,
32]. Decarbonization as a global issue requires the coordinated effort from all countries as a collaborative process between different stakeholders, academia, and NGOs to develop scenarios and provide a consistent framework for assessing their impacts on different sustainability indicators and GHG emissions.
This study, to address the above research gaps, such as the limited research focus on specific regions or sectors, the limited modeling approaches, and the reliance on simplified exogenous assumptions, employs two well-established and scientifically robust integrated assessment models (IAMs), namely PROMETHEUS and TIAM-ECN.
PROMETHEUS and TIAM-ECN are established models that have been widely used in the field of climate and energy policy analysis. PROMETHEUS has been developed to effectively analyze energy and climate policy scenarios while TIAM-ECN is well known for its ability to assess energy system development and costs.
Moreover, the study assesses the models under a wide range of exogenous assumptions. The utilization of these models benefits our research as it allows for a comprehensive analysis of climate policies effects on emissions, energy system development, and costs.
The comparison of the results of the two IAMs provides a more reliable analysis of the potential impacts under different policy assumptions and validates the findings. Several global scenarios were designed to investigate the impact of ambitious climate policies and other drivers (e.g., evolution of technology costs and global energy prices) on the global energy mix and technology uptake, particularly in the future development of the building sector. The scenario design, the selection of input data, and determination of output indicators are based on consultation with stakeholders, extensive literature research, and the expertise of the modeling teams involved in this study.
This study contributes to the scientific literature on global energy scenario studies, by analyzing the effects of varying assumptions for main model drivers (e.g., carbon prices, technology costs, global energy prices), in the context of stringent decarbonization policies towards achieving the Paris Agreement goals. By linking the research outcomes to real-world policy implications, the paper provides practical insights and actionable recommendations, enhancing its relevance and applicability in the current policy landscape. This paper adds to the current literature by advancing our understanding of global energy system modeling, providing insights into the potential impacts of different scenarios, advocating for a comprehensive approach to decarbonization, and offering policy recommendations based on robust analysis. It contributes to the ongoing dialogue on sustainable energy transitions and aids in the formulation of evidence-based policies to address climate change effectively. Our research builds upon a previously peer-reviewed article [
33] where we examined the implications of pushing for energy efficiency and how this affect the global energy transition, especially when ambitious efficiency standards, regulations, and improvements are combined with high carbon pricing.
The structure of this paper is as follows:
Section 2 describes the models used in this research and the scenario design. In
Section 3, we present the model results for the analyzed scenarios. Finally,
Section 4 discusses the main research findings, and
Section 5 provides policy recommendations and suggests further expansion steps for this study.
2. Methodology
This paper presents a quantitative analysis for future energy–climate developments at the global level, aiming to demonstrate the results of global energy and integrated assessment modeling tools and explore avenues for their improvement. In this direction, we utilize the PROMETHEUS and the TIAM-ECN models, aiming to investigate how novel insights can inform, shape, and improve the IAM analysis. Our research builds upon a previously peer-reviewed article [
33] where we examined the implications of pushing for energy efficiency and how this affects the global energy transition, especially when ambitious efficiency standards, regulations, and improvements are combined with high carbon pricing.
The use of IAMs enables a comprehensive analysis of the energy system transition and its multifaceted implications for various aspects of our society. The current study has been performed through a series of scenarios that represent different assumptions about the future development of the energy system.
The scenarios have been evaluated based on several key indicators that depict the evolution of the energy and economic system. These indicators include total energy consumption for all major economic sectors, power generation mix by technology, carbon price, additional system costs and investment, and global and regional emissions. These indicators are used to assess the impact of the different scenarios on the energy system and provide valuable insights into the potential trajectories of global decarbonization.
In this research, data were collected from various sources to ensure comprehensive analysis. The World Energy Statistics database from Enerdata (enerdata.net, accessed on 6 June 2023), the OECD database (data.oecd.org, accessed on 6 June 2023), and the International Energy Agency (IEA) website (
https://www.iea.org/, accessed on 6 June 2023) were the primary databases consulted. These sources were selected for their extensive coverage and reliability in providing energy-related information. To ensure up-to-date and relevant data, a thorough search was conducted within a specific timeframe.
In addition to the databases, relevant literature was also consulted in the field. This included scientific articles, reports, and publications from reputable sources. The literature review complemented the database analysis by providing valuable insights, context, and additional data points that were not directly available in the databases.
2.1. Models
PROMETHEUS and TIAM-ECN are two well-known IAMs that have been extensively used for climate policy analysis. The global energy system model PROMETHEUS captures the relationships between global and regional CO
2 emissions, technology deployment, energy costs, and demand and supply of energy [
34]. The model can explore alternative socioeconomic, policy, and technology scenarios for the development of the global energy system [
35]. In PROMETHEUS, the world is divided into ten regions, including the major emitters, the EU, China, the US, and India. PROMETHEUS represents the main end-use sectors, including transport, industries, and buildings. Energy supply and energy transformation, such as power generation, refineries, resource extraction, and hydrogen production, are modeled using a bottom-up approach based on explicit technologies and processes. The model has been recently used to analyze the impacts of specific mitigation measures such as CCS [
36], nationally determined contributions and low-emission strategies in major emitters [
37,
38], the transformation of the energy system to 1.5 °C [
39,
40], and the emission and energy system impacts of COVID-19 and recovery plans.
TIAM-ECN [
41] is a global integrated assessment model (IAM) built on the TIMES model generator. TIAM-ECN [
42] is a bottom-up linear optimization model that determines the cost-optimal regional energy mix within exogenous constraints. Its input database consists of several hundred processes for energy production and consumption, covering sectors such as resource extraction, fuel production, electricity generation, transportation, residential and commercial buildings, and industry. It divides the global energy system into 36 regions. TIAM-ECN has been used to create long-term scenario projections at global [
43] and regional levels [
44] for sectors such as transportation and electricity generation, technology classes such as CCS [
45] and off-/mini-grid power production, and for climate change [
46] and technology diffusion.
Both PROMETHEUS and TIAM-ECN can be used to explore the impacts of energy and environmental policies at national and global levels on the sectoral energy mix, emissions, energy investment, and costs. These IAMs can simulate the effects of various policy instruments, including price signals, policies promoting the use of renewable energy and energy efficiency, technology standards, and phase-out policies. They are well equipped to quantify the medium- and long-term effects of ambitious energy efficiency policies in the context of the Paris Agreement goals.
2.2. Scenario Design
To explore the behavior of IAMs comprehensively under various assumptions for key model drivers, we employed a series of diagnostic scenarios. These diagnostic scenarios have a global coverage and cover the period 2020 to 2050, similar to [
47]. This approach allows us to evaluate the models’ responses to exogenous shocks (variation in key input parameters) and provides valuable insights into the sensitivity and reliability of the models’ outcomes. Moving beyond previous similar studies, we explore not only the impact of changes in carbon prices but also the implications of changes in technology costs and energy prices, providing a more comprehensive overview of the behavior of energy–economy models.
In this study, the assumptions of the main socio-economic drivers, population, and GDP growth are harmonized in both models to provide a consistent and robust framework for model comparison. We used the well-accepted projections of the shared socio-economic pathways (SSPs) [
48] but short-term GDP assumptions are modified to account for the effects of the COVID-19 pandemic and recovery following the latest published economic data by the International Monetary Fund and the methodology described in Dafnomilis et al. [
49]. In the global scenarios, we follow the climate control targets which are in line with the Paris Agreement goals for limiting the global temperature increase to “well below 2 °C”. The target of 1.5 °C is also heavily discussed, which requires the transition to net zero energy systems by mid-century. The effects of enhanced energy efficiency under stringent global climate targets are explored in [
35]. In the current study, we focus on a series of “diagnostic” scenarios to test and evaluate the IAMs’ behavior under changing exogenous assumptions for some key drivers (e.g., carbon prices, technology costs, global energy prices). This has become standard practice in IAM-based studies analyzing transformational pathways [
50]. The diagnostic scenarios run between 2020 and 2050 and have a global geographic scope.
In
Table 1, the main scenario features are presented. The BASE scenario corresponds to the implementation of current (approved and already implemented) national policies. This scenario establishes a baseline to which the other scenarios can be compared, having 2020 values as reference points. The CP300-Lin and CP70-GR5 scenarios explore the effects of enforcing a global carbon price (uniform across regions and sectors) that grows linearly and exponentially, respectively, from 2025 onwards. The growth rates of carbon price modeled in these two scenarios have been chosen to be in line with several IAM studies that explore carbon price trajectories compatible with a 2 °C Paris Agreement target.
Specific variations within the BASE and the CP300 scenarios are also investigated. The BASE-LCHP scenario examines the implications of a significant decline of heat pumps’ costs which are the most important option to electrify heating in buildings. The reductions in heat pumps’ costs are set at 10% in 2025, 25% in 2030, and 50% from 2040 onwards, compared to the BASE levels. The CP300-LCHP scenario introduces the same reductions in the costs of heat pumps as the BASE-LCHP scenario but within the context of the CP300-Lin scenario. The effects of increased global energy prices in the BASE-Highprice and CP300-Highprice scenarios are also analyzed. These scenarios assume a 50% increase in global energy prices from the BASE or CP300 levels, respectively, starting in 2025 followed by a 30% increase from 2030 onwards.
2.3. Diagnostic Indicators
In this section, we employ a series of diagnostic indicators—developed in [
51]—to characterize the sensitivity and the behavior of our two IAMs under changing scenario assumptions.
2.3.1. Relative Abatement Index
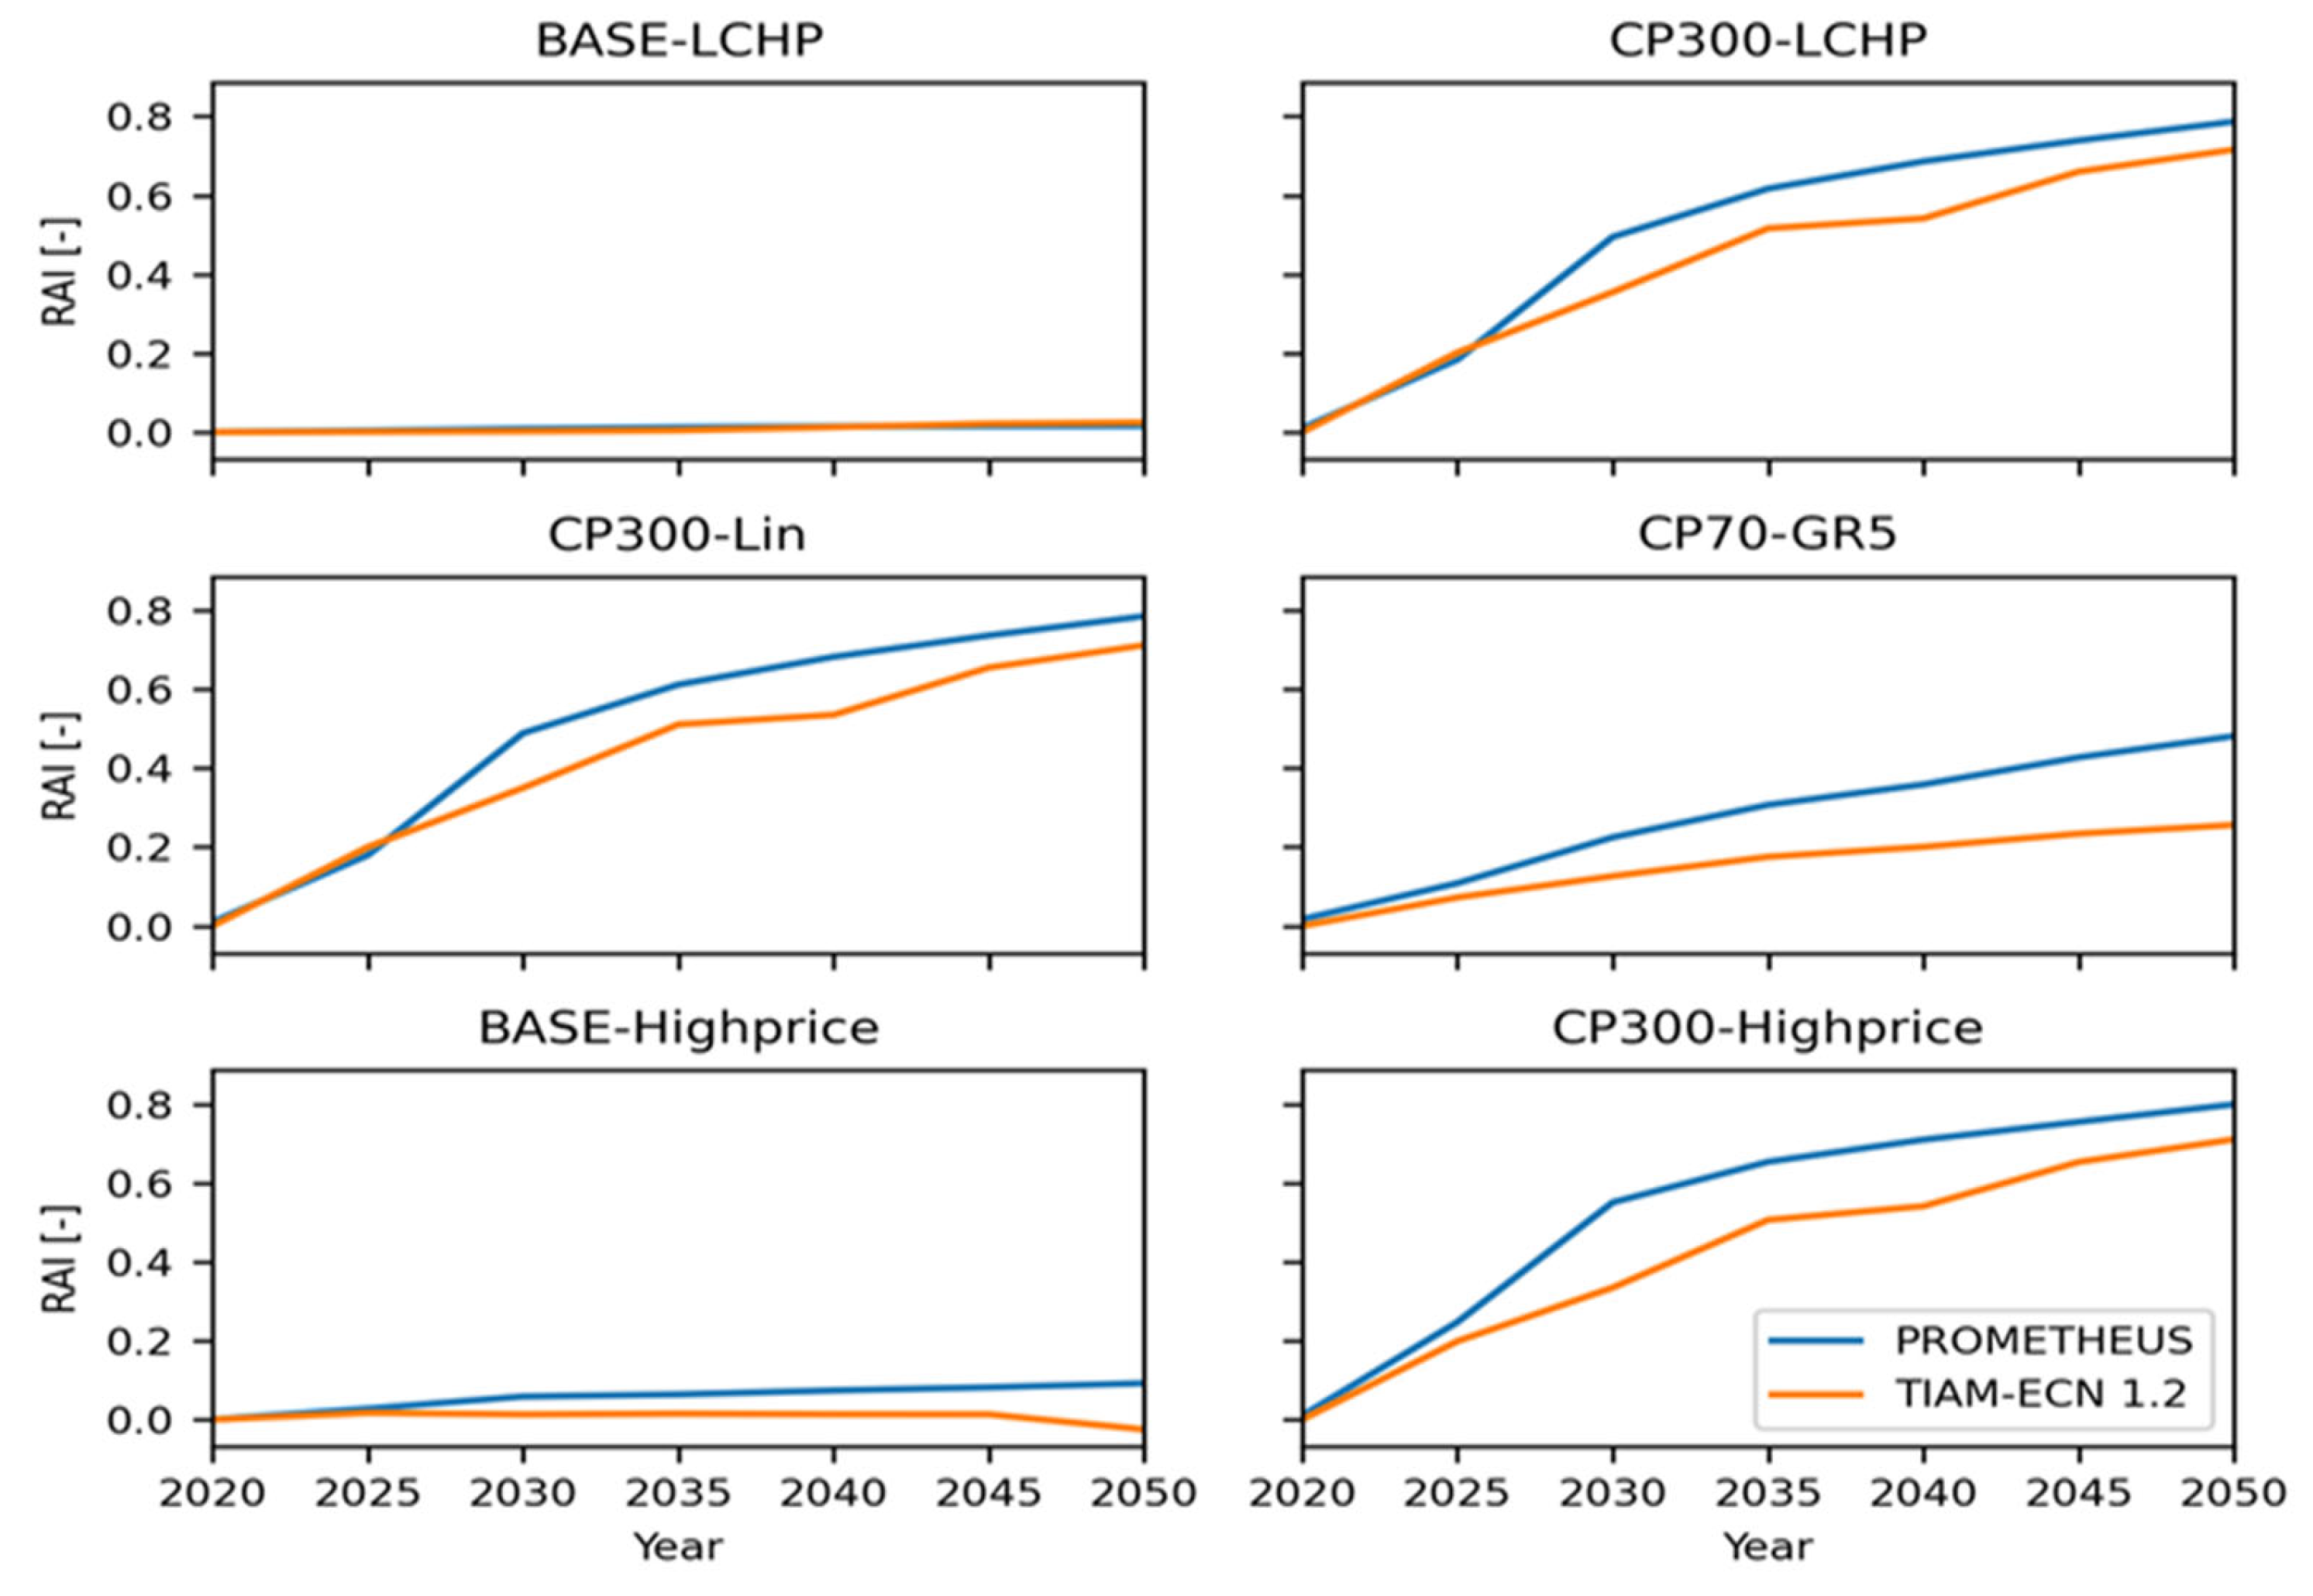
Figure 1 presents modeling projections of the relative abatement index (RAI) in the various scenarios. The RAI expresses the relative
emission reduction in a specific scenario with respect to BASE. The index is calculated according to the following formula, where y is the projection year and SCEN indicates the specific scenario under consideration:
In the variants of the BASE scenario, overall emission reductions are limited and this is why RAI is lower than 10%. In all the CP300 scenarios, the RAI increases over time, due to the increasing stringency of the mitigation effort and the increasing carbon price. The trends shown in the CP300 variants reveal that both models display relatively similar responses to carbon price, with PROMETHEUS being consistently more sensitive to this parameter than TIAM-ECN, indicating that larger emission reductions are achieved in PROMETHEUS than in TIAM-ECN when the same carbon price is applied.
2.3.2. Carbon Intensity and Energy Intensity
Carbon intensity (CI) expresses the total emissions per unit of final energy used in the system while the energy intensity (EI) measures final energy per unit of gross domestic product (GDP). In a decarbonized world, steadily decreasing CI trends are expected, as lower and zero-carbon technologies are being used to provide energy services, replacing those that rely on fossil fuels. Similarly, with increasing energy efficiency trends one expects to see a decoupling of energy use and GDP growth, resulting in a downward EI trajectory. The models display roughly constant CI in the BASE scenario variants and decreasing CI trajectories in the CP300 scenarios—consistent with the fact that the latter scenario family corresponds to large decarbonization efforts induced by high carbon pricing. The impact of the low cost of heat pumps (LCHP) and Highprice scenario assumptions is limited in all scenarios, indicating that the models are more sensitive to carbon pricing than heat pump costs and energy prices. Energy intensity displays a rather consistent downward trend in all scenarios for TIAM-ECN. In the PROMETHEUS projection, the EI decrease is more pronounced in the CP300 variants than in the BASE ones, indicating that in this model high carbon prices induce significant energy efficiency improvements in all demand sectors.
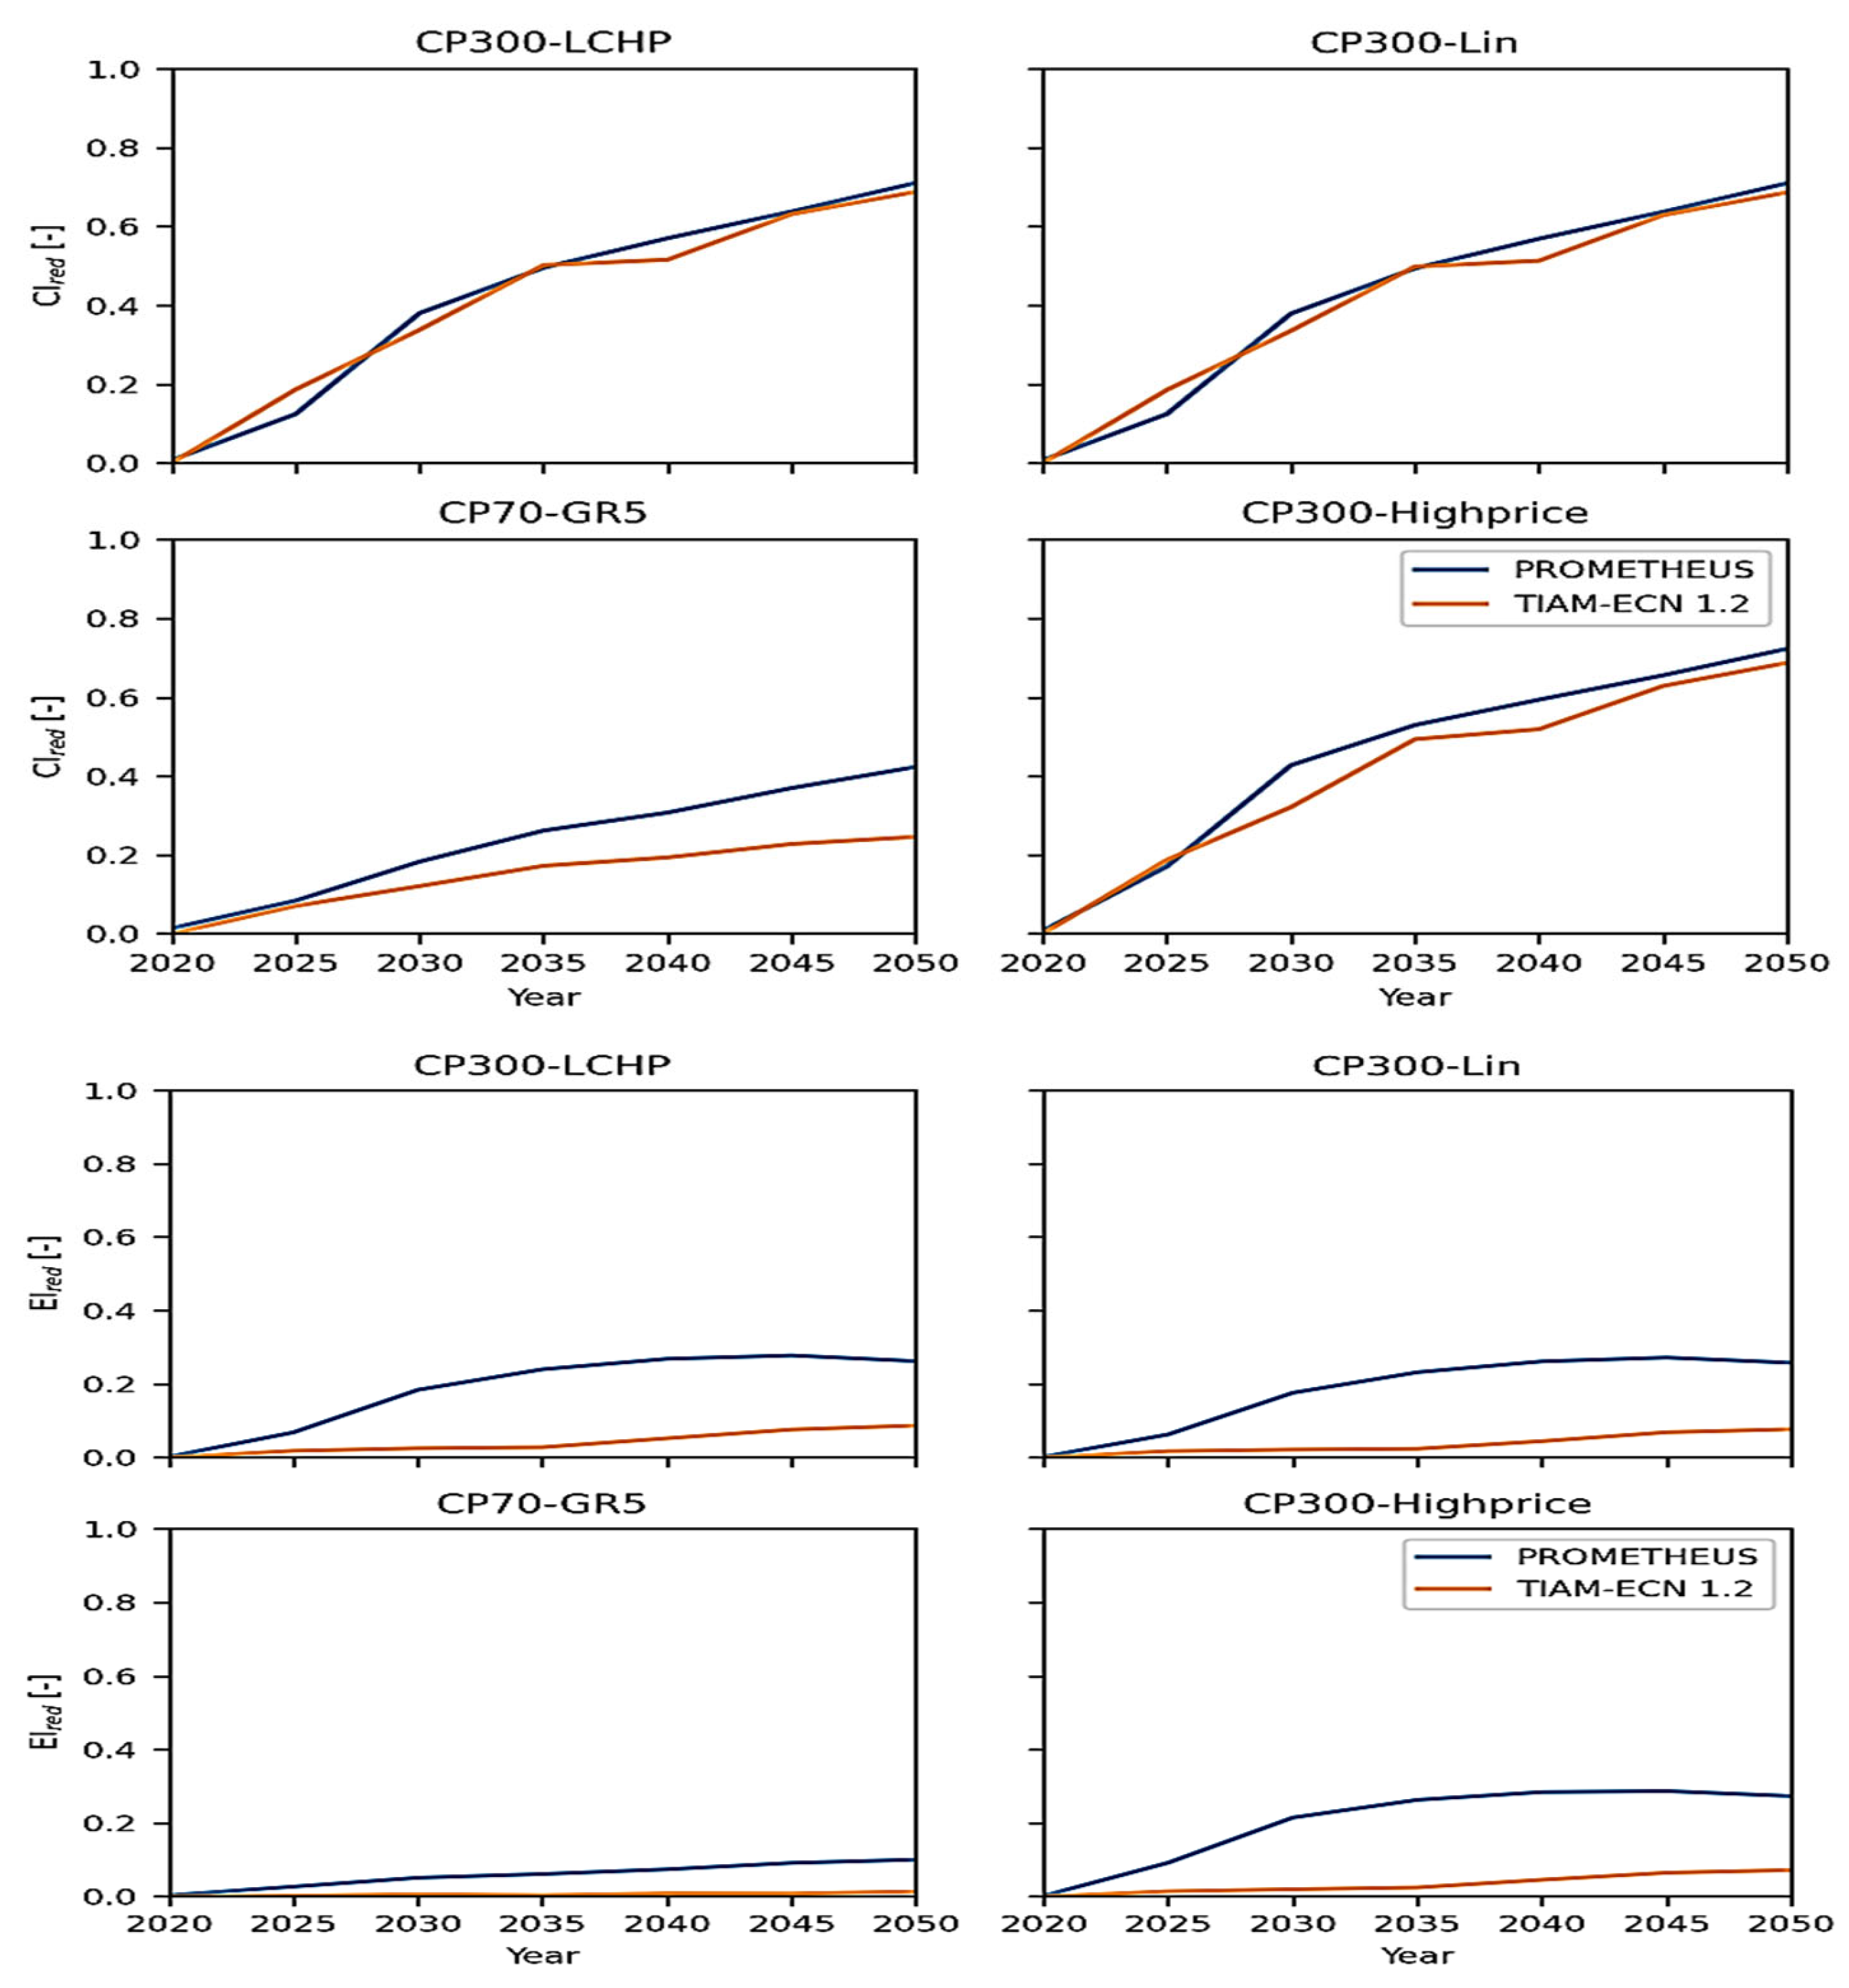
A reduction in CI and EI with respect to BASE in the climate control scenarios is illustrated in
Figure 2, where the overall trends for CI are very similar in the two models, with PROMETHEUS being slightly more sensitive to carbon price than TIAM-ECN. This difference becomes larger for EI, with PROMETHEUS reaching EI reductions that are more than three times larger than those in TIAM-ECN, as PROMETHEUS represents more energy efficiency options and measures [
51].
The emission reduction type (ERT) index is calculated for each year y and scenario SCEN as:
where CI
red and EI
red are the CI and EI reduction indexes, respectively. An ERT close to 1 indicates that the
abatement in the respective scenario is obtained mainly by the reduction of carbon intensity, thus based on supply-side decarbonization. When the ERT takes values close to zero, decarbonization is achieved primarily via energy efficiency enhancements on the demand side. Based on this, the ERT can be interpreted as the share of RAI attributed to energy supply (or demand) side measures.
3. Results
In this section, we present some key results from the global diagnostic scenarios, including projections for the global energy system obtained from PROMETHEUS and TIAM-ECN under the diagnostic scenario assumptions.
3.1. Global Emission Projections
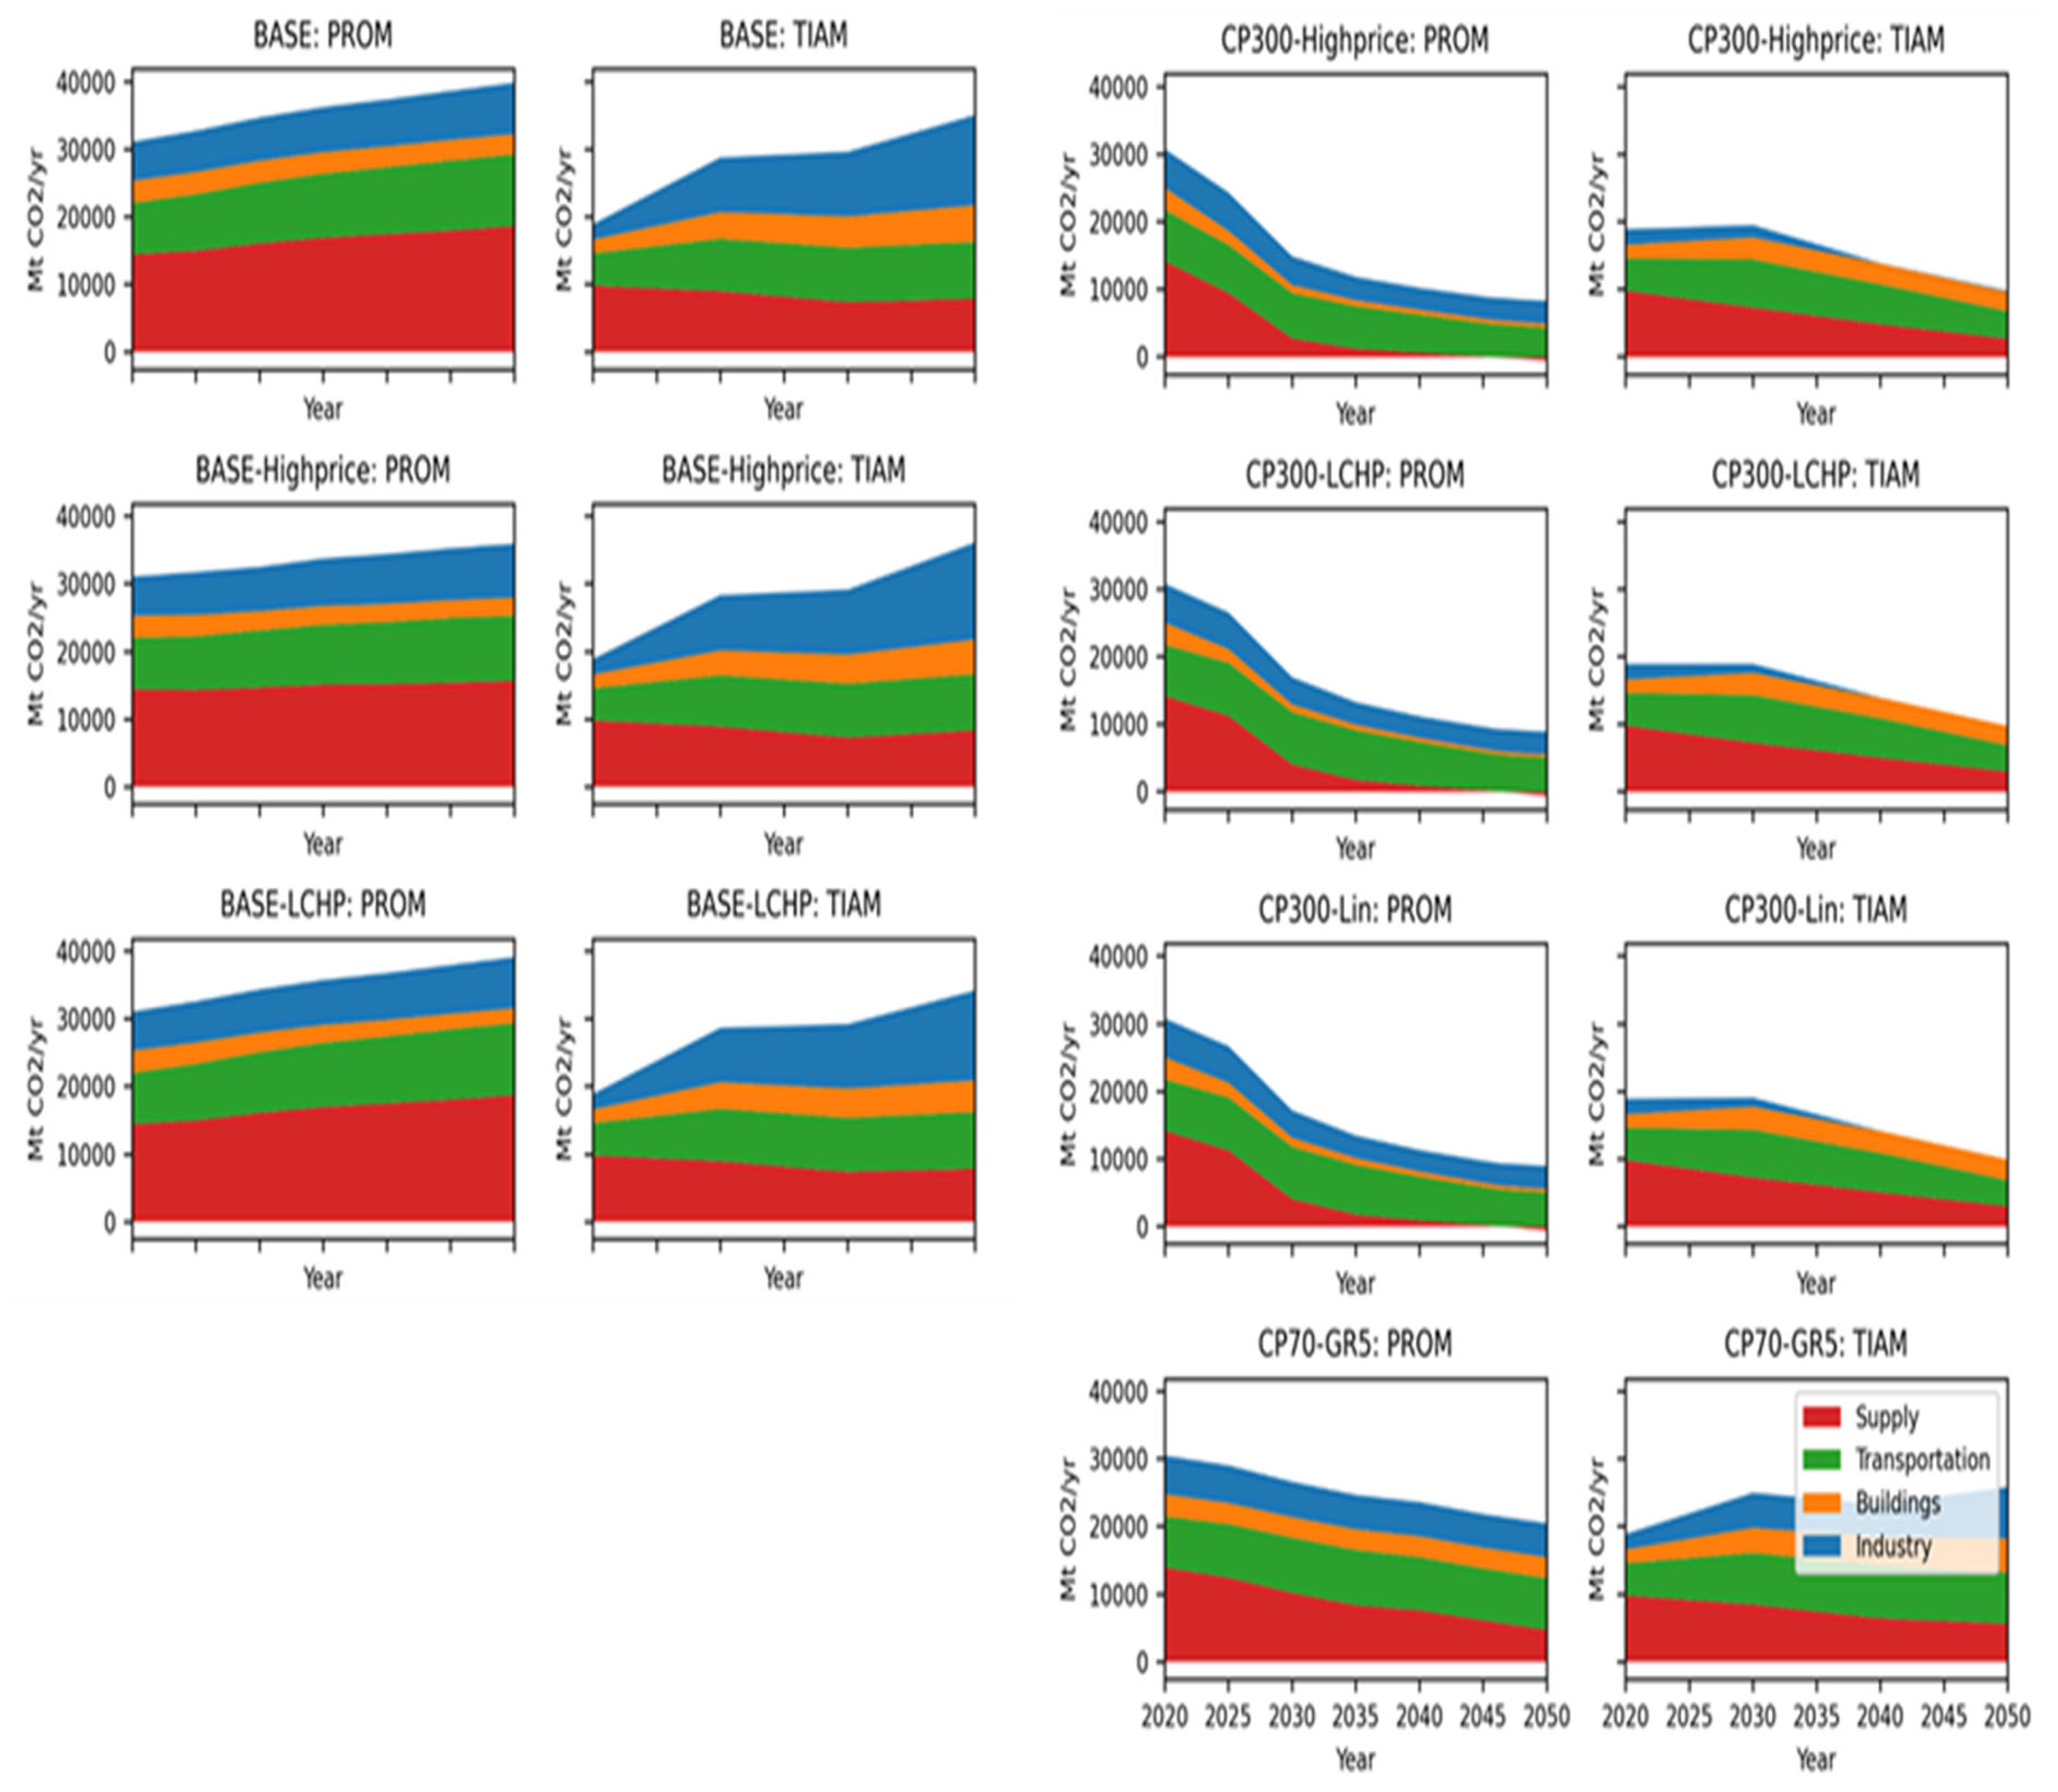
In
Figure 3, each panel corresponds to a specific combination of scenario and model showing the global CO
2 emission projections from the two models. Emissions are split into the main emitting sectors, including energy supply, and the three main demand sectors which are transportation, buildings (residential and commercial), and industry.
The BASE scenario variants in this study show similar trends, with global emissions gradually increasing and reaching nearly 40 Gt by 2050. However, there are notable differences between the TIAM-ECN and PROMETHEUS models. TIAM-ECN projects lower overall emissions from the energy supply and a higher contribution from the industry sector compared to PROMETHEUS, suggesting that TIAM-ECN anticipates a more significant shift away from carbon-intensive energy sources in the energy supply sector, while PROMETHEUS places more emphasis on decarbonization efforts in the industrial sector. In the CP300 scenario variants, both models demonstrate a significant reduction in emissions, reaching around 10 Gt per year by mid-century. In this scenario subset, the disparities between the models become more apparent. TIAM-ECN achieves complete decarbonization in the industry sector, while PROMETHEUS does not. Conversely, PROMETHEUS shows close-to-zero emissions in the energy supply and building sectors by 2050. These ranges in both model results imply that PROMETHEUS foresees a more rapid transition towards renewable energy sources compared to TIAM-ECN. Additionally, in the CP70-GR5 scenario, both models project a decrease in CO2 emissions from the energy supply due to increased adoption of renewable energy in electricity generation. Regarding the demand sectors, TIAM-ECN indicates a slight overall increase in CO2 emissions, indicating a greater challenge in lower emissions from demand sectors, while PROMETHEUS shows relatively constant emissions.
Figure 4 provides an overview of CO
2 emissions in various sectors for the year 2050, considering different scenarios (BASE and CP300) and model variants. In the BASE case, the Highprice variant exhibits the most significant variations in both models. In TIAM-ECN, higher energy prices lead to higher emissions from the energy supply, whereas PROMETHEUS demonstrates the opposite trend, where higher energy prices result in reduced energy consumption, supply, and associated CO
2 emissions. These different responses highlight the different sensitivities of the models not only to energy price changes but to CO
2 implications in the energy supply sector. In other sectors, the trends across variants are similar in both models. The CP300 case shows more diversity across scenario variants and models. TIAM-ECN consistently projects positive CO
2 emissions from the energy supply, while PROMETHEUS consistently predicts a small negative contribution from the energy supply in all CP300 variants due to the adoption of biomass with carbon capture and storage (BECCS) driven by the assumed rapid increase in carbon prices.
In the transport sector, under the assumption of higher energy prices, TIAM-ECN and PROMETHEUS present contrasting projections for emissions. TIAM-ECN projects higher emissions while PROMETHEUS projects lower emissions compared to the other scenario variants. Finally, the two models display opposite trends in projecting emissions from buildings and industry. Emissions from residential and commercial buildings decrease to about 500 MT /yr in 2050 according to PROMETHEUS due to increased electrification of heating uses, while in the TIAM-ECN projection they remain at a level of about 3 Gt /yr. The opposite trend is observed for industry, which is essentially fully decarbonized in all CP300 variants according to TIAM-ECN but stays at levels of about 3.5 Gt /yr in the PROMETHEUS projections, as it is considered a hard-to-decarbonize sector where carbon pricing alone cannot deliver deep emission reductions.
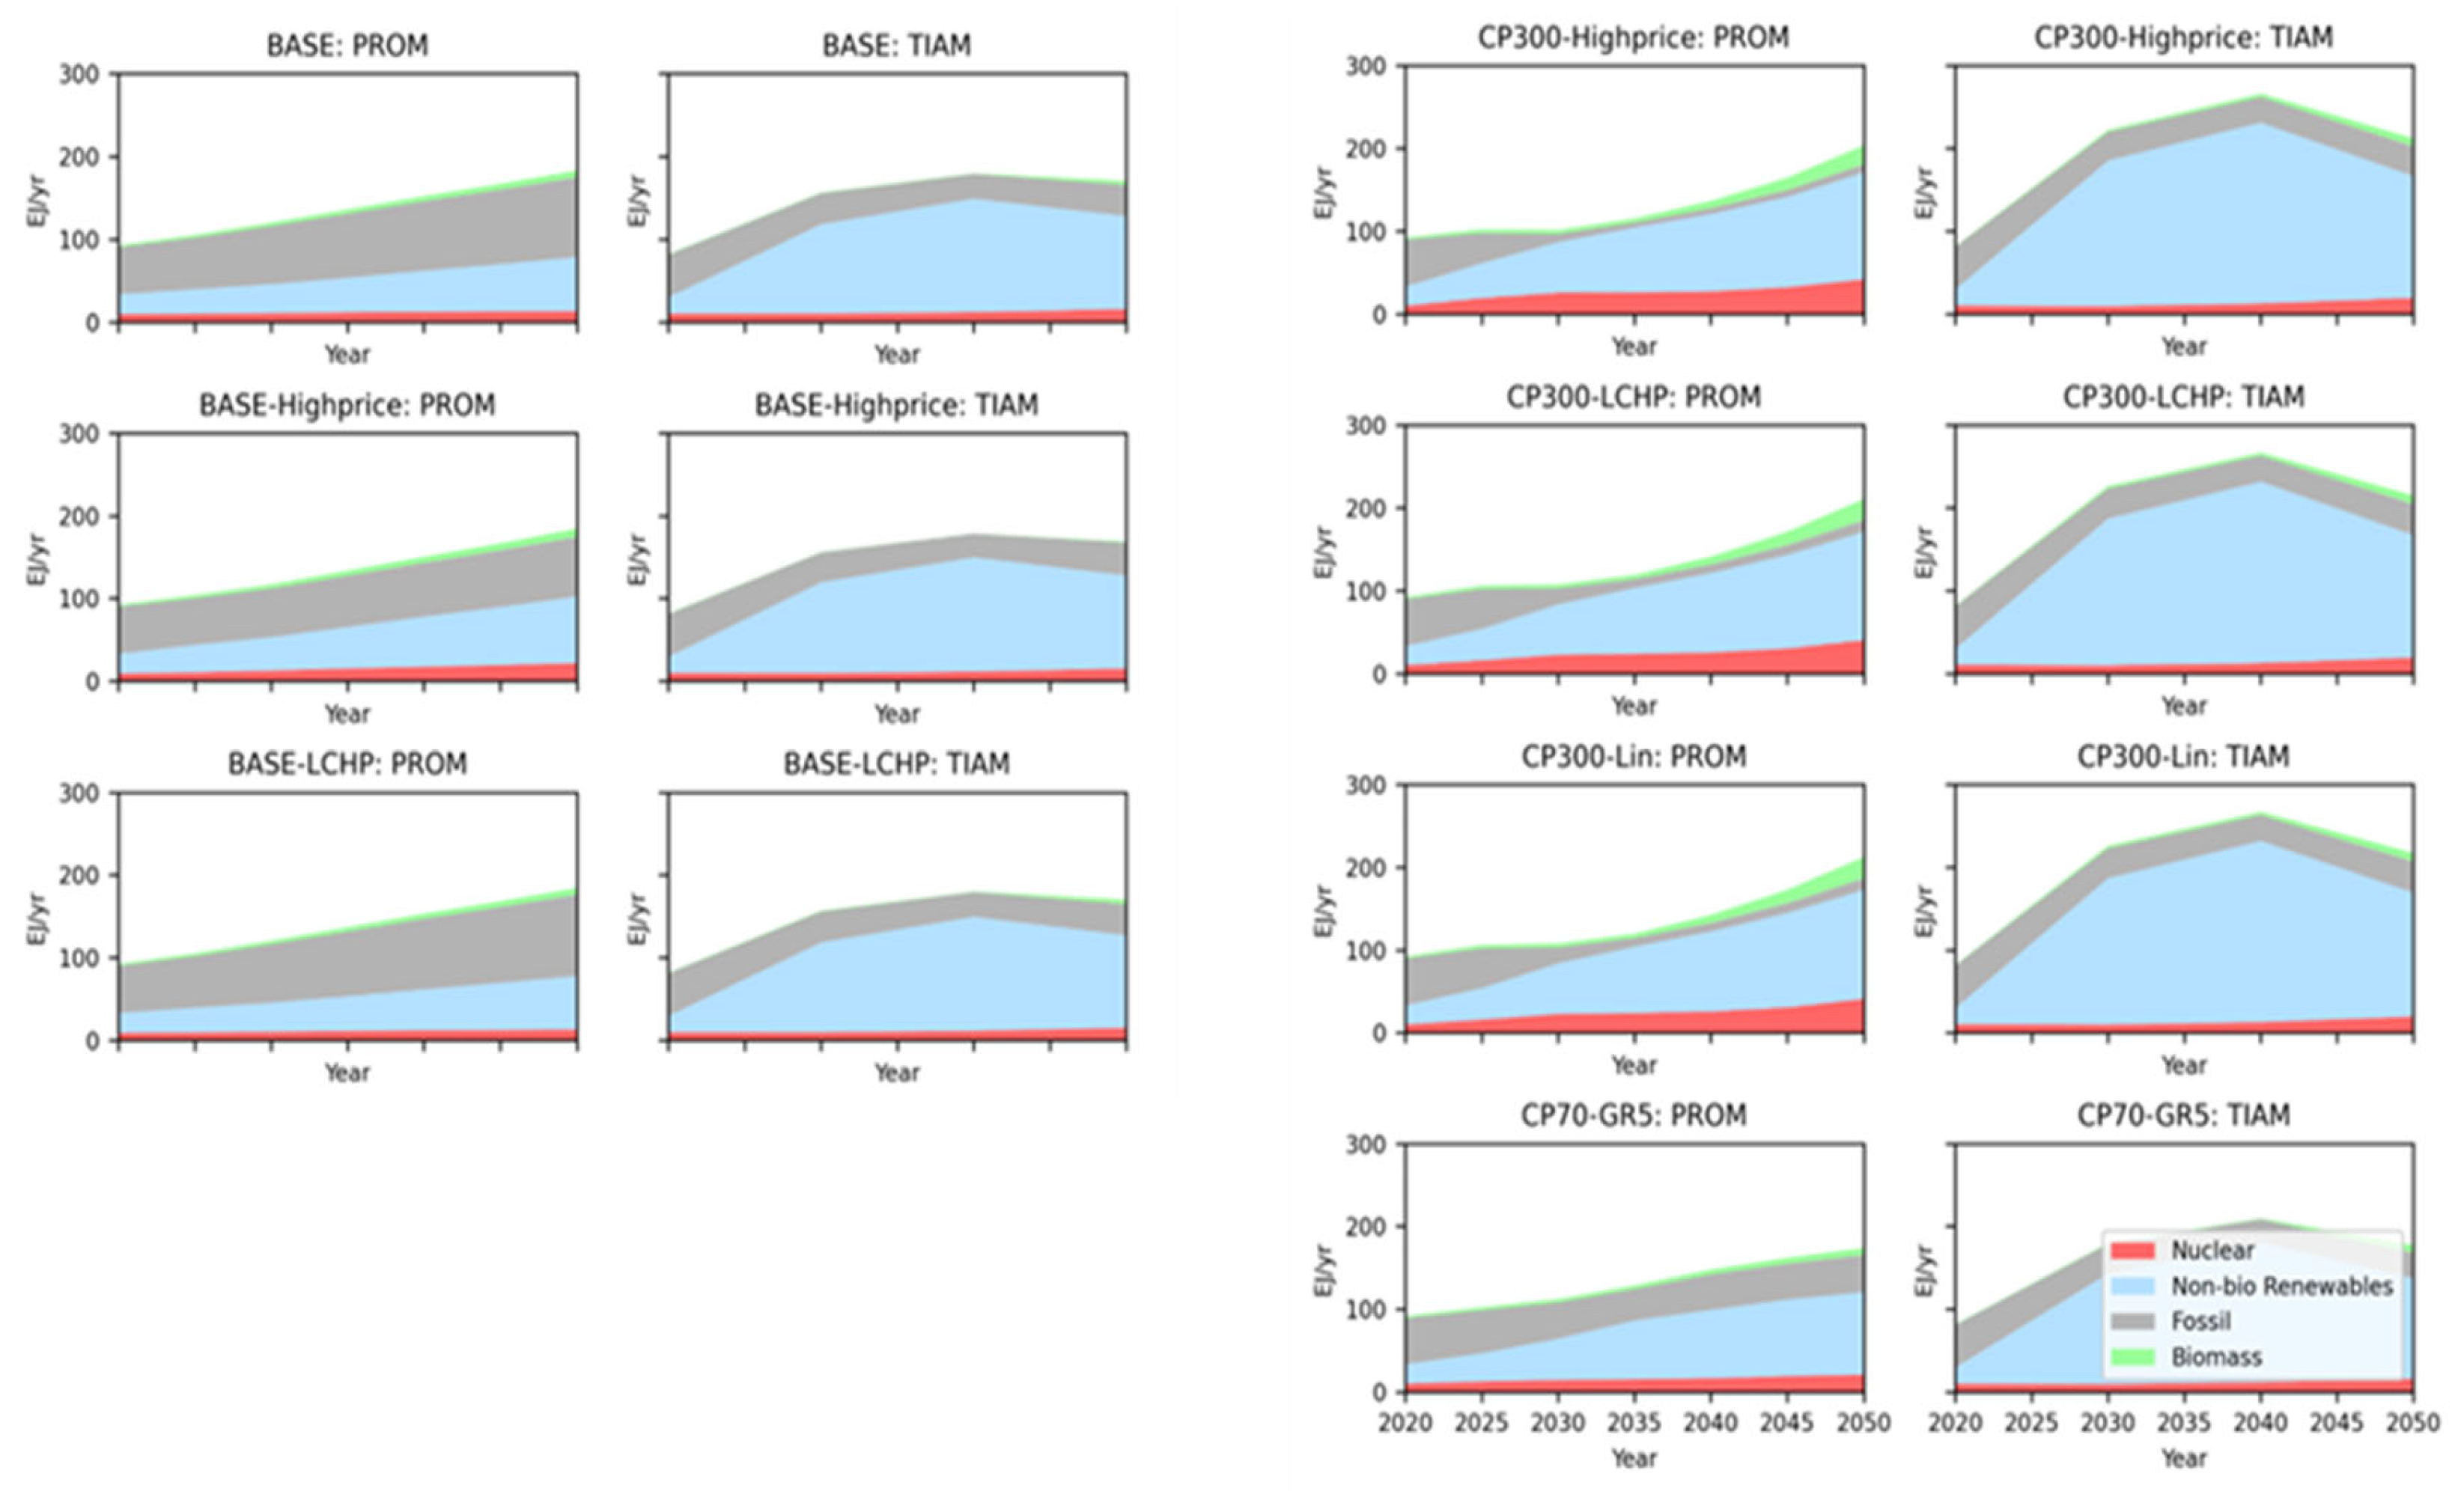
3.2. Global Energy Supply Mix
Moving to the power generation sector, several differences between the two models are observed in the BASE scenario. TIAM-ECN predicts that non-biomass renewables, such as wind and solar technologies, will dominate electricity production from 2030 onwards, suggesting a more aggressive and optimistic approach to the future adoption of clean energy sources. On the other hand, PROMETHEUS takes a more conservative approach, with a predominantly fossil-based energy mix until the middle of the century, which reflects a slower transition away from fossil fuels. However, in the CP300 variants (as shown in
Figure 5), PROMETHEUS undergoes a significant transformation by almost completely phasing out fossil-based generation in favor of solar, wind, and biomass technologies. The transformation presented in PROMETHEUS implies that a rapid transition towards cleaner energy sources is envisioned, driven by the higher carbon pricing implemented in these variants. Higher carbon prices influence PROMETHEUS and reinforce its responsiveness to carbon pricing policies which leads to significant shifts towards greener sources. In contrast, TIAM-ECN projects a minor role for bio-based technologies in the power sector and maintains a consistent contribution from fossil fuels throughout the modeling period, suggesting that the outlook of the power sector is more reliant on fossil fuels under higher carbon pricing scenarios. The CP70-GR5 scenario in PROMETHEUS shows steady growth in electricity generation similar to the BASE variants, but with a rapidly increasing share of non-biomass renewables in the mix which is again driven by higher carbon pricing. TIAM-ECN exhibits comparable trends to those observed in the CP300 variants for this scenario which shows a relative low sensitivity of model results to the specific carbon pricing levels.
Overall, we notice that PROMETHEUS exhibits a slower transition in the BASE scenario while TIAM-ECN seems to adopt a more optimistic behavior with an earlier dominance of non-biomass renewables. Under the higher carbon pricing scenarios (CP300 and CP70-GR5), PROMETHEUS projects a rapid shift towards cleaner energy sources while TIAM-ECN remains relatively reliant on fossil fuels.
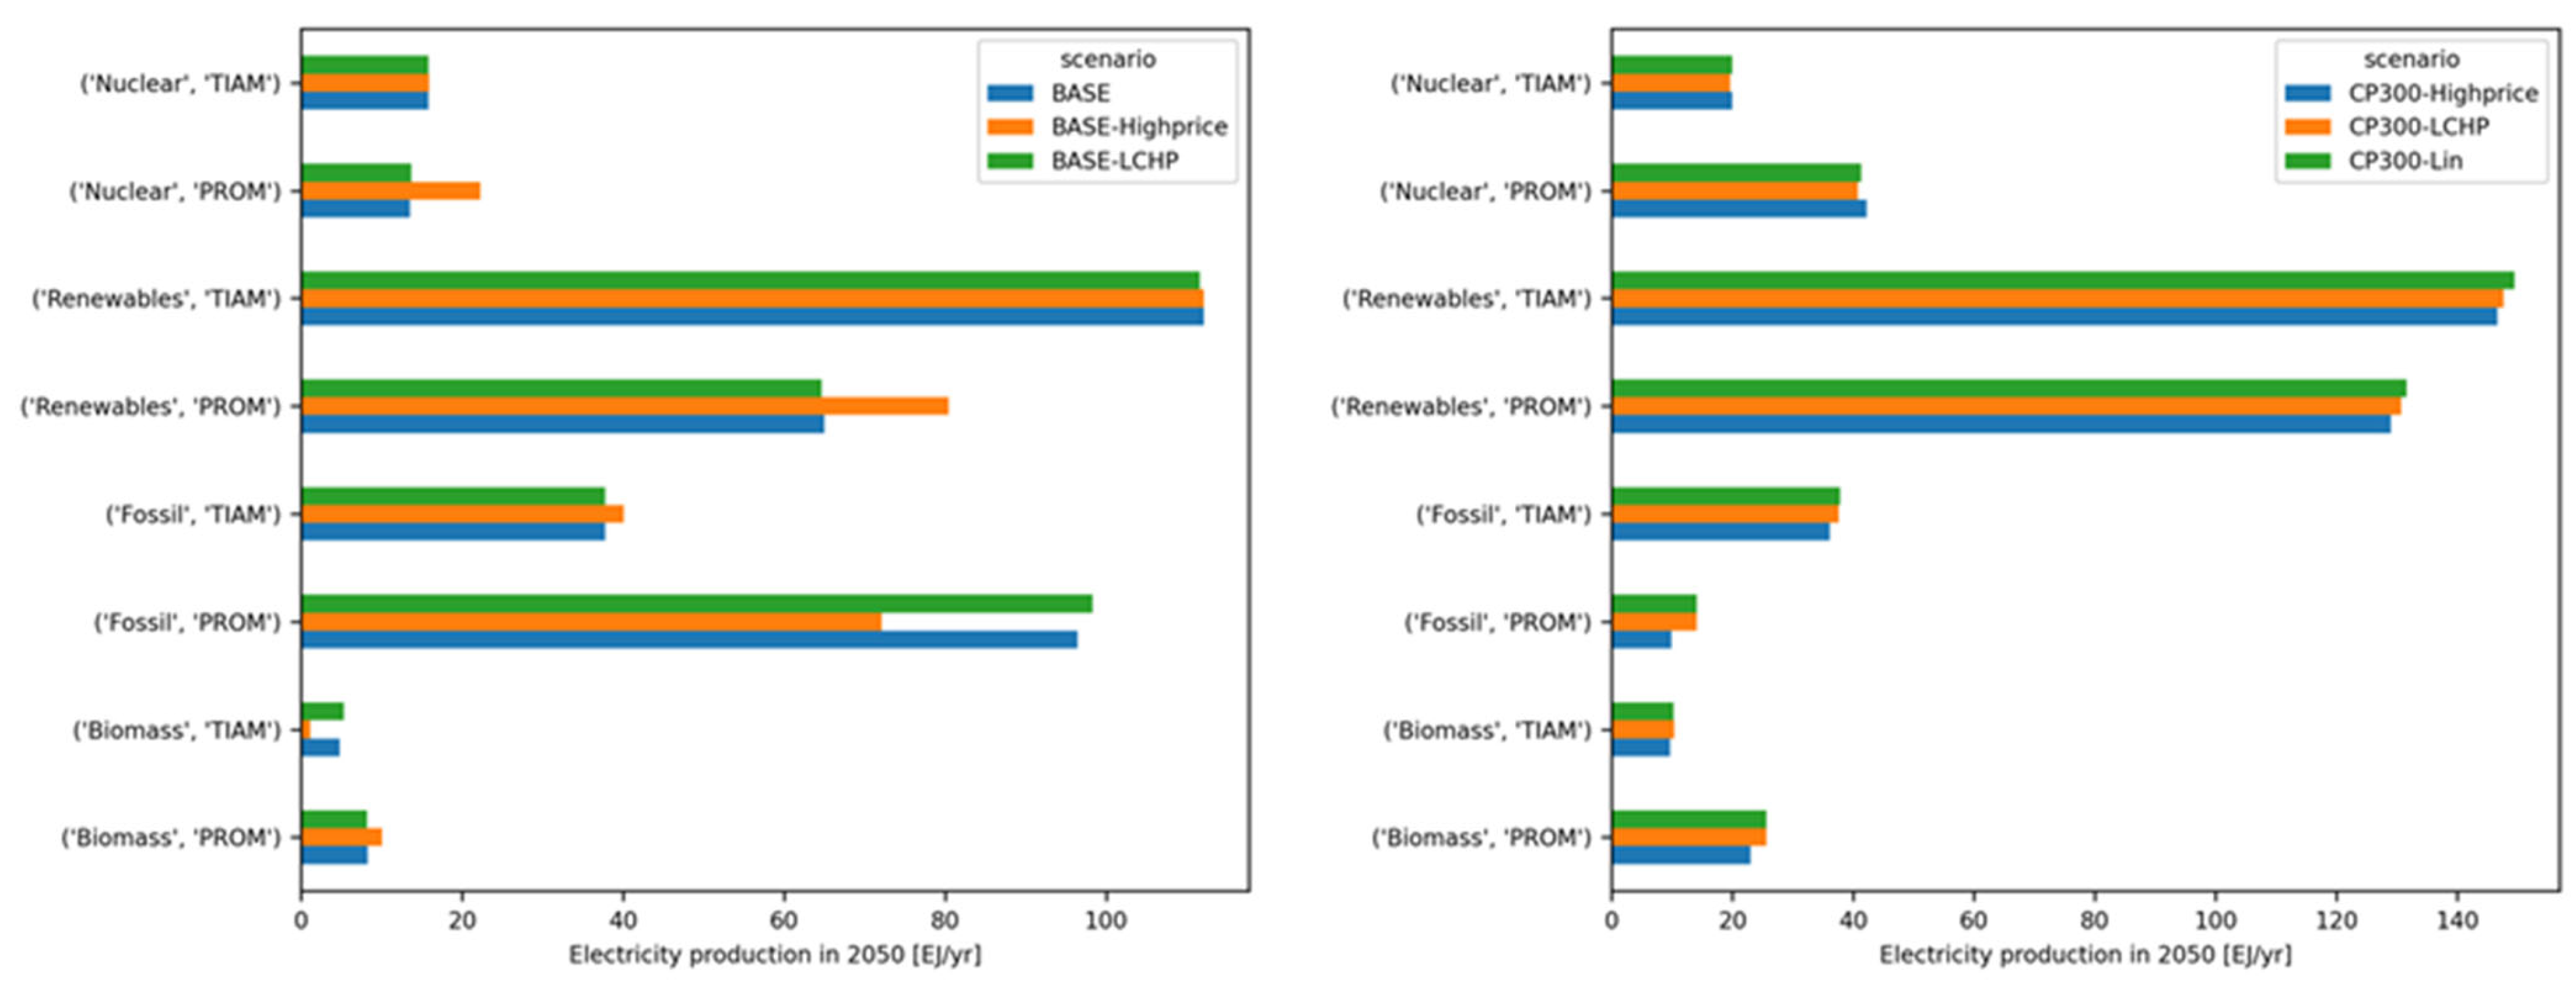
Figure 6 presents the power generation mix in the BASE and CP300 variants for 2050. For the BASE variants, the Highprice assumptions induce the largest variations in both models. The 2050 contributions from the various technology categories are also quite different in the two model projections, with the exception of nuclear and biomass-based processes which display (in BASE and LCHP variants) similar values. This highlights the divergent outlooks of the two models on electricity under current national policies and high energy prices. In the CP300 variants, the 2050 model-based projections are more harmonized and display consistent trends across scenario variants. It seems that under CP300 variants both models show a higher agreement level compared to the BASE variants.
The differences in electricity between the models and scenarios are more pronounced in the BASE variants where divergent projections are observed. The CP300 variants show a higher level of agreement between the two models which suggests that the carbon pricing policy has a consistent impact on the electricity model projections.
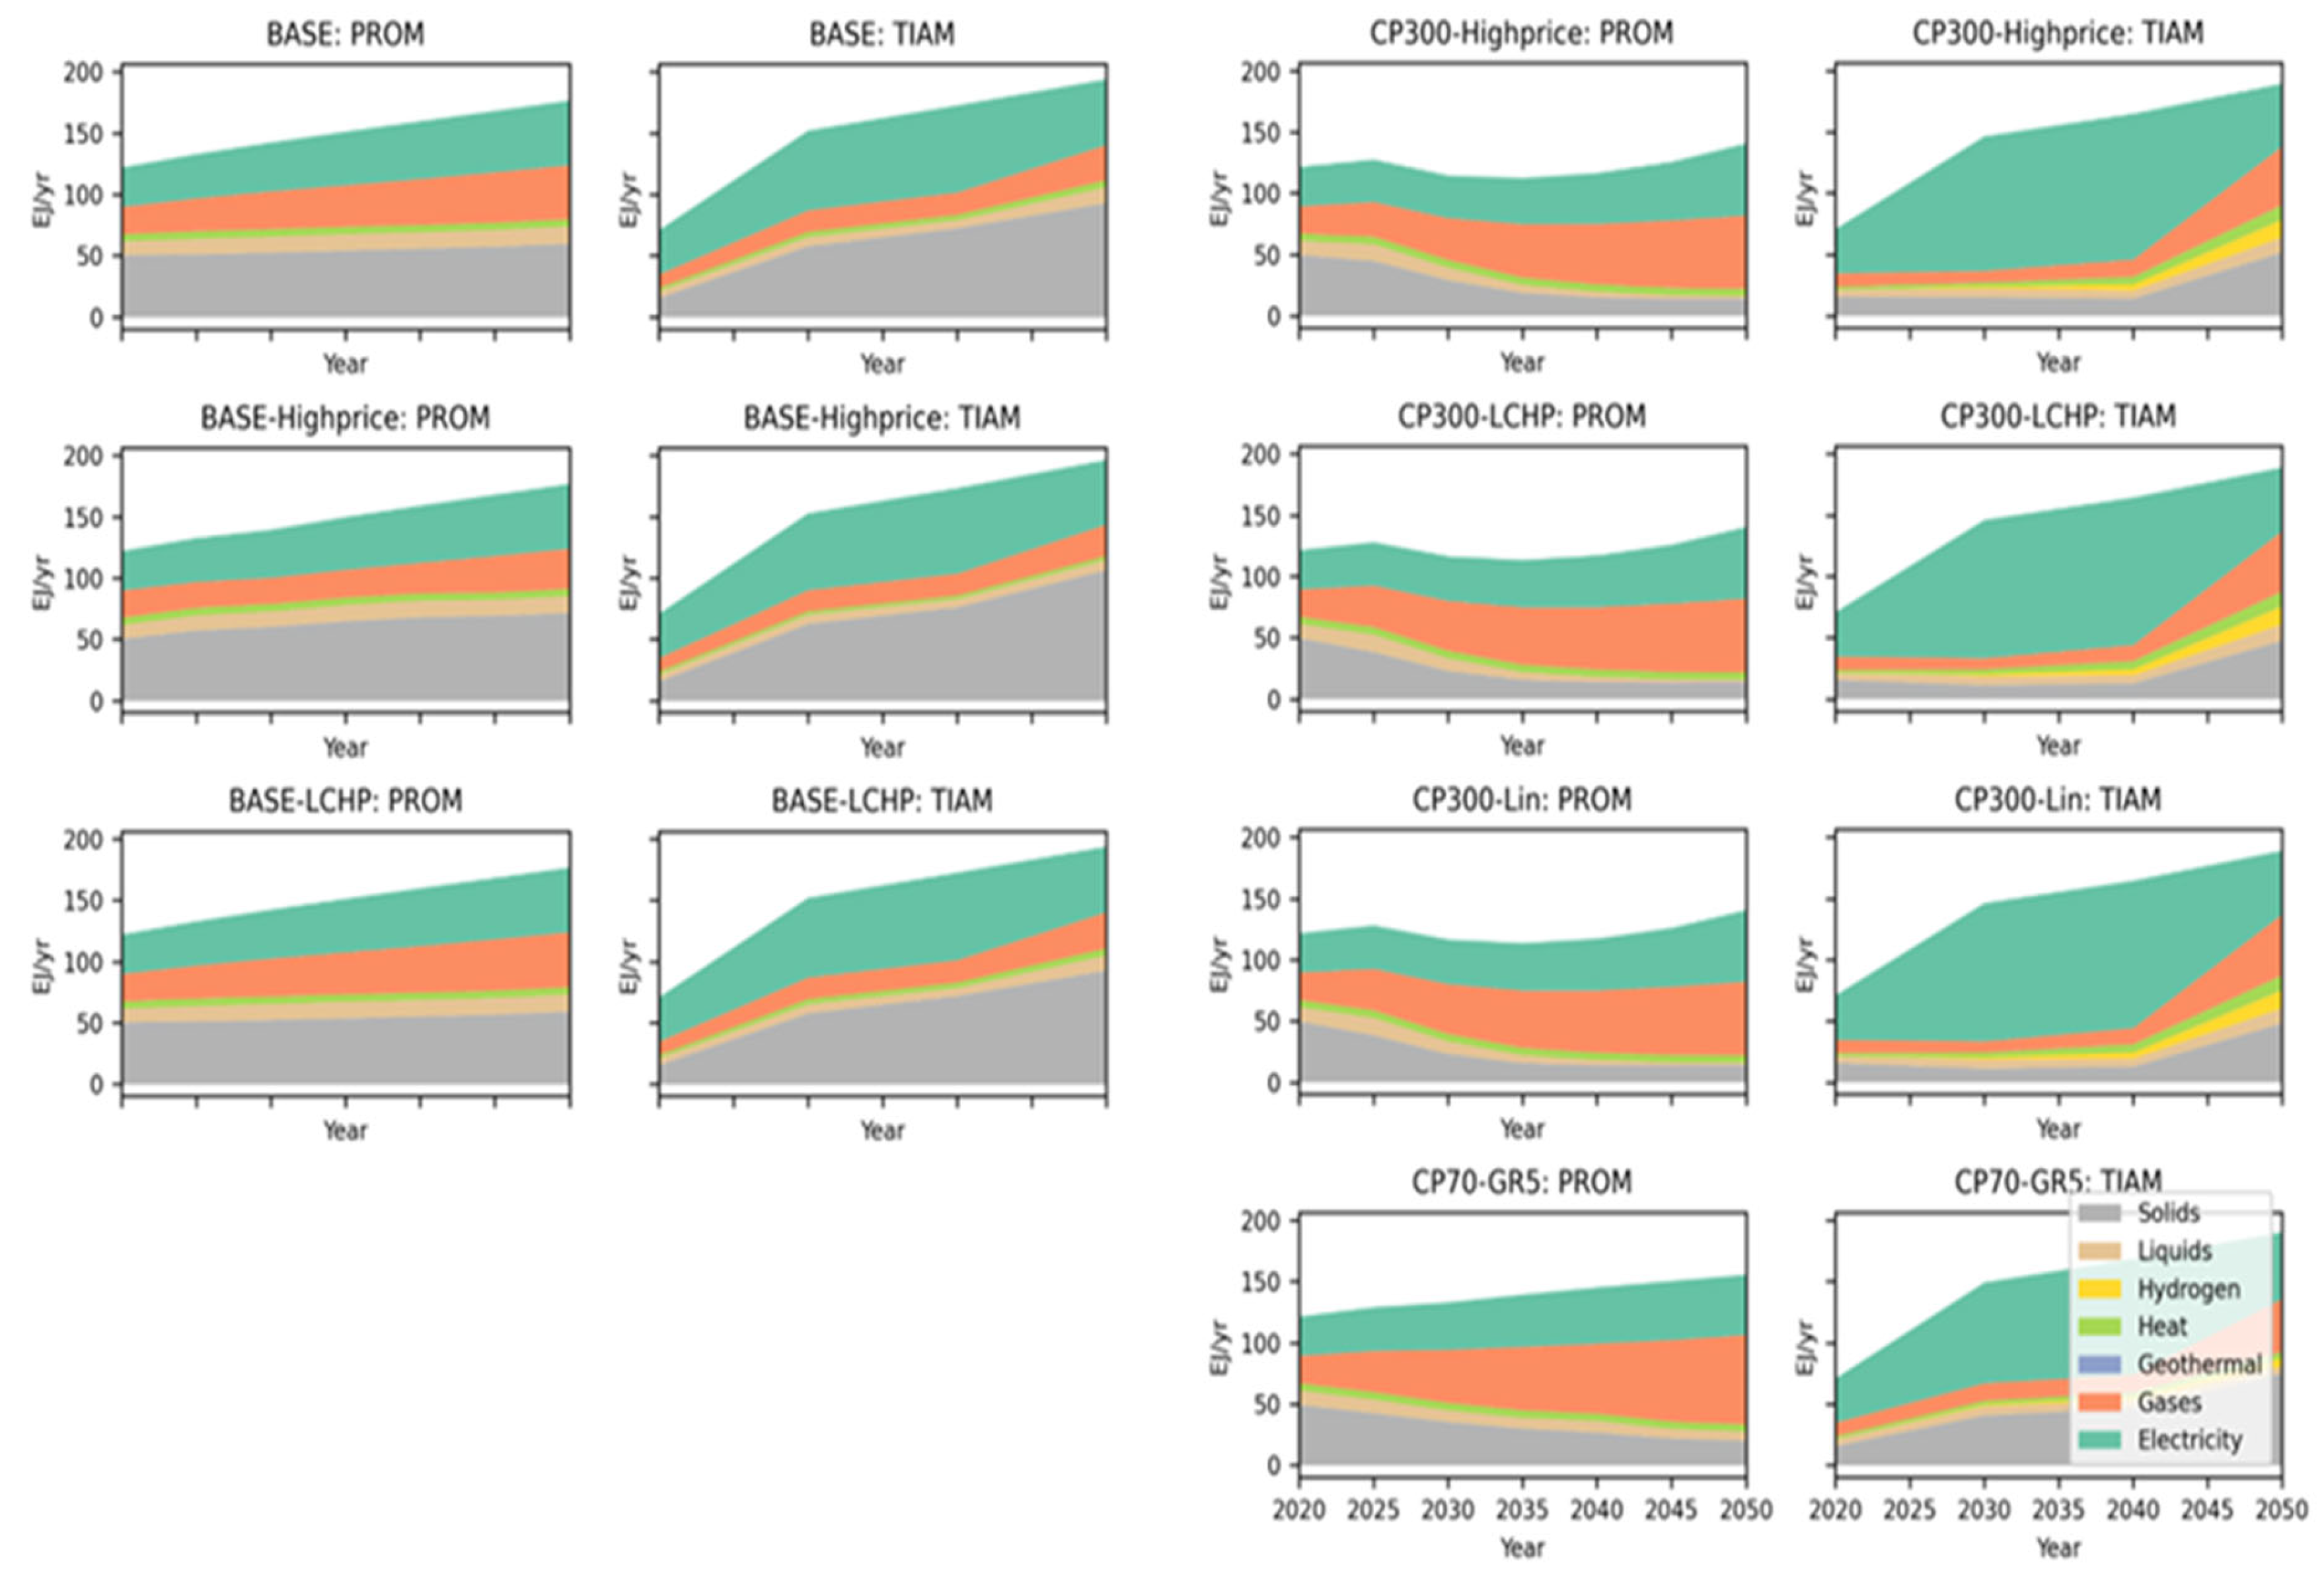
3.3. Global Energy Use in Buildings
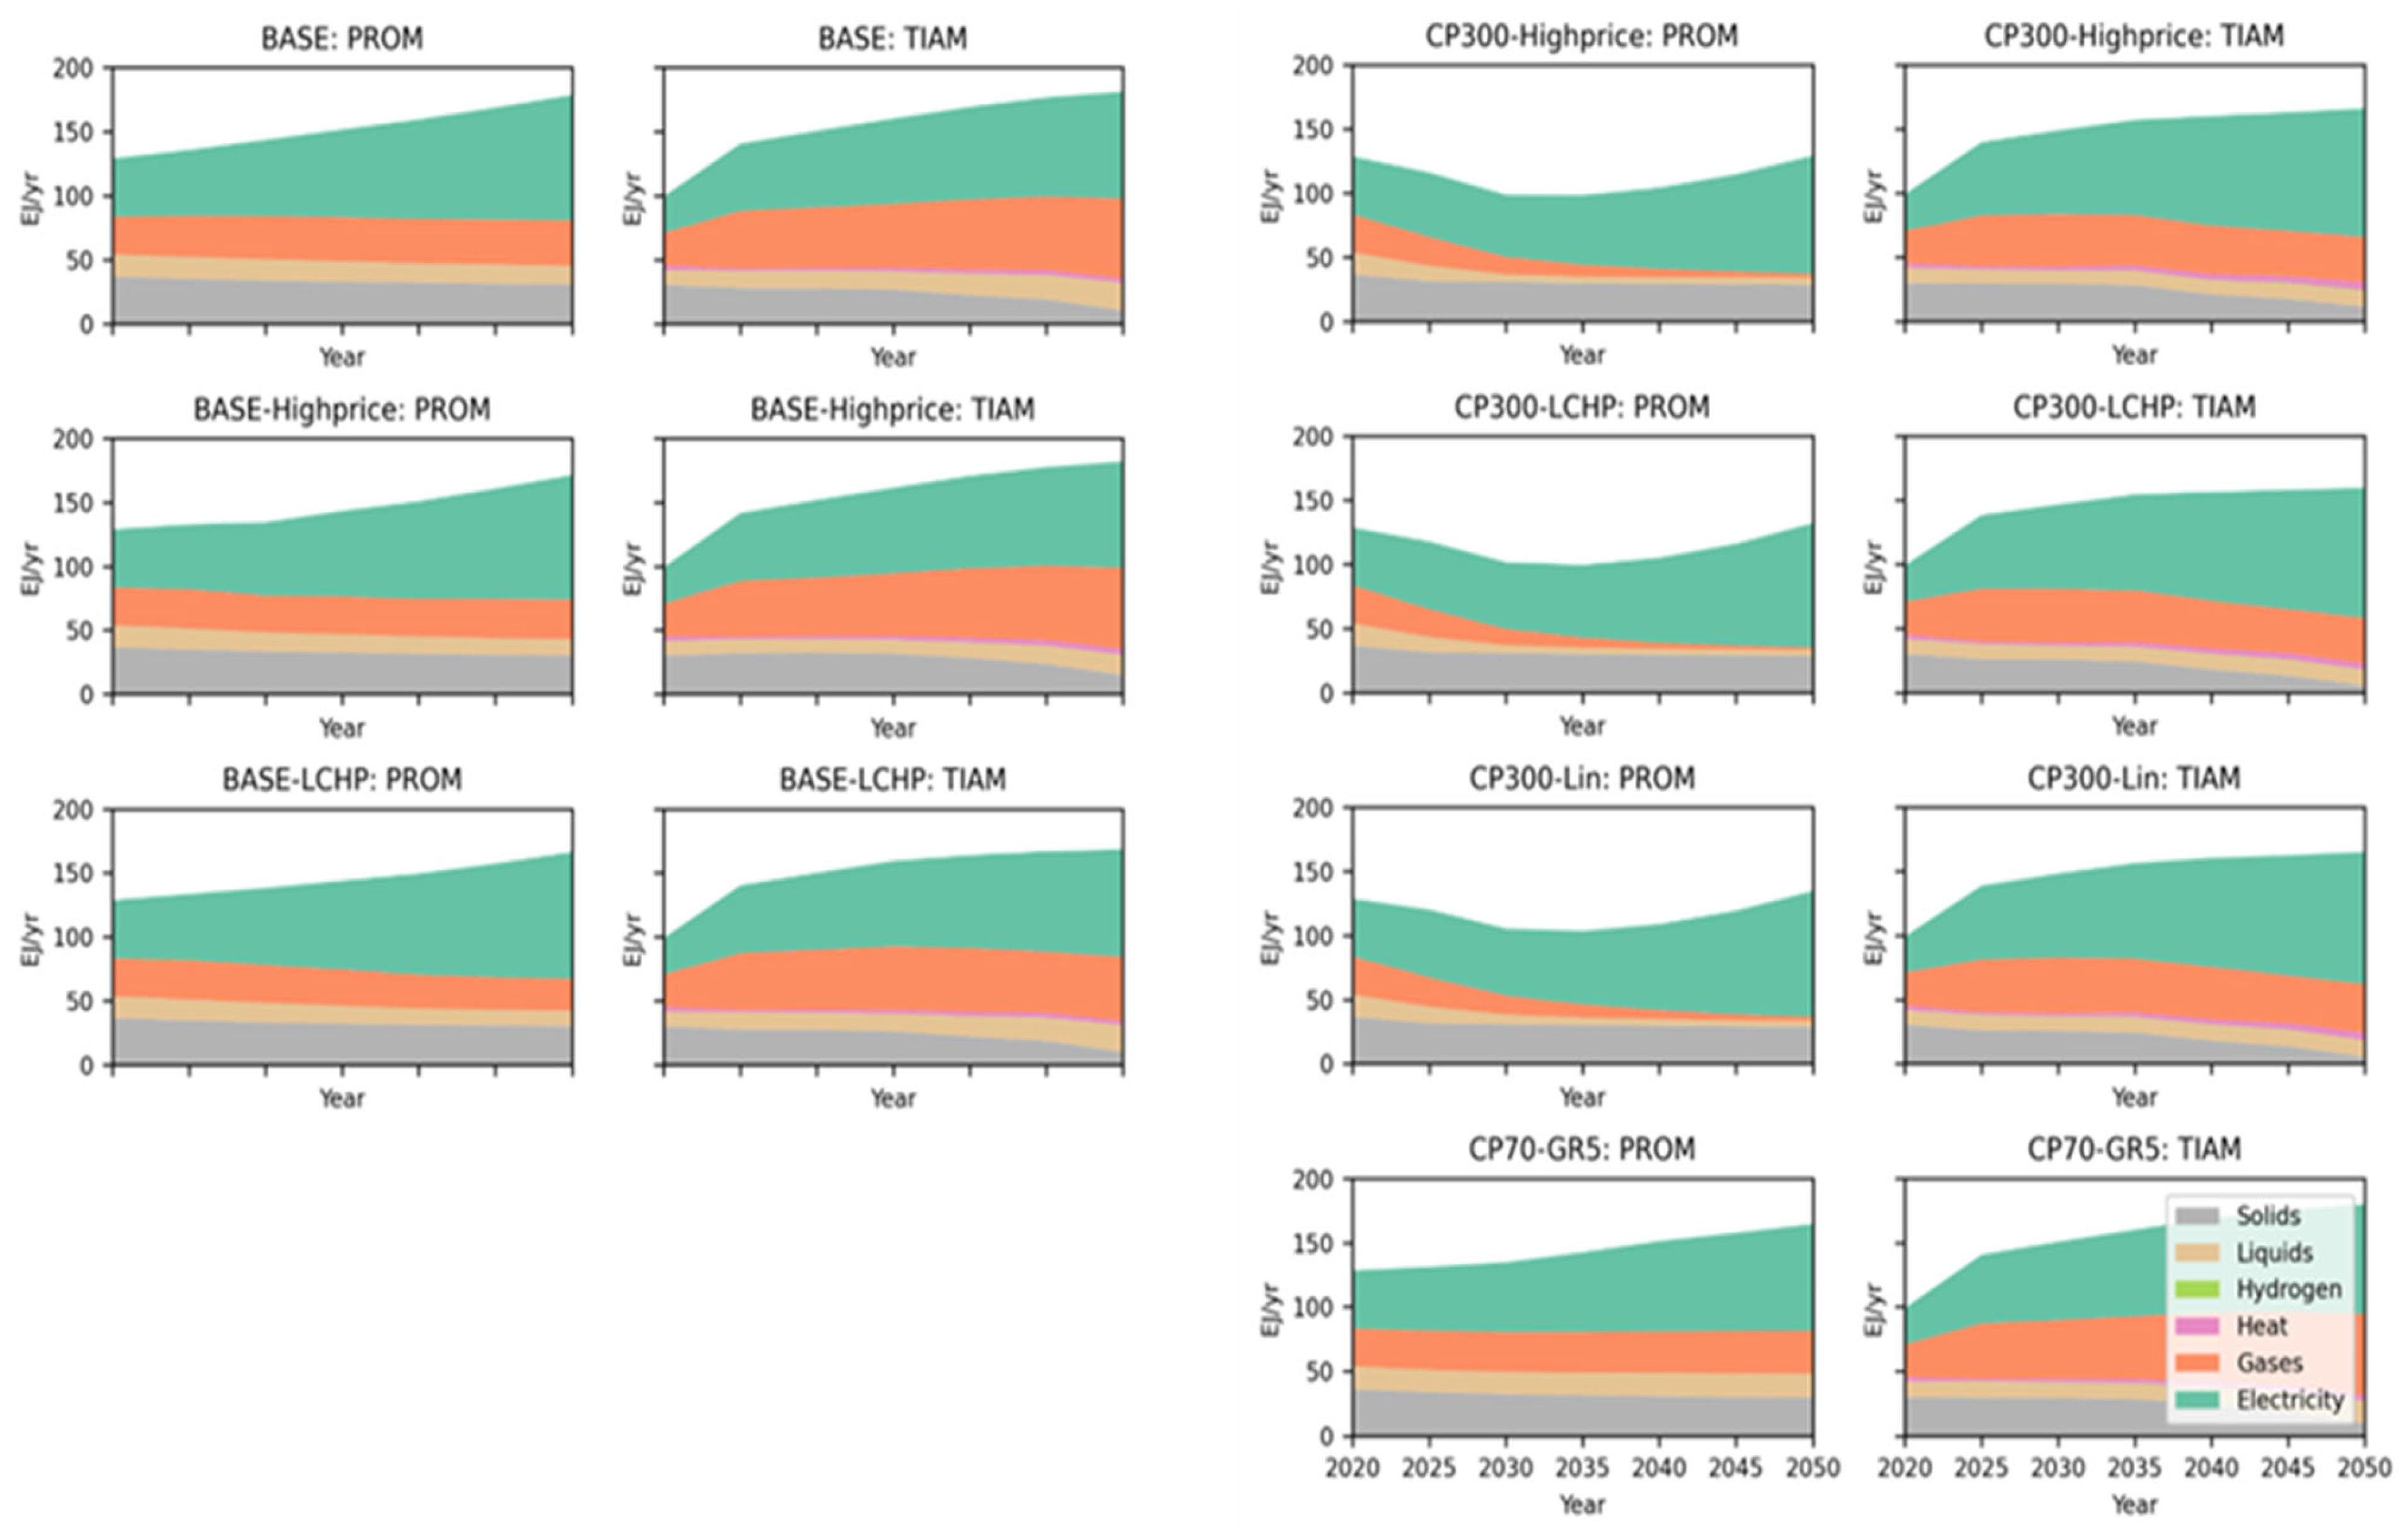
Figure 7 illustrates the projections for the energy mix in residential and commercial buildings. Both models show similar trends and contributions from different energy sources in all BASE variants. However, there are notable differences between the models regarding building electrification and the use of solid fuels.
In TIAM-ECN, building electrification experiences an initial boost before 2025, followed by a relatively slower growth rate, suggesting that TIAM-ECN projects a gradual adoption of electricity as the primary building energy source. In contrast, PROMETHEUS shows a consistent and constant growth rate for building electrification throughout the modeling period, implying that the model pursues a more aggressive transition to the electrification of building stocks. When it comes to the use of solid fuels in buildings, TIAM-ECN projects a nearly complete phase-out of solid fuels by mid-century. On the other hand, PROMETHEUS predicts a relatively constant use of biomass solids, primarily due to the continuous use of solid fuels.
In the CP300 variants, TIAM-ECN projections exhibit similar trends to the BASE variants, suggesting limited options for decarbonizing the buildings sector. Conversely, the CP300 variants in PROMETHEUS differ significantly from their BASE counterparts. PROMETHEUS incorporates more options and measures related to energy efficiency, resulting in a steady decrease in energy use in buildings until 2050. This is achieved through improvements in energy efficiency and increased building renovation, with the use of gaseous and liquid fuels being phased out. Starting from 2035, the dominant energy source for buildings is (green) electricity, driven by the increasing adoption of heat pumps for heating requirements.
As for the CP70-GR5 scenario, both models show similarities to the BASE variants, indicating comparable outcomes in terms of building energy use and composition. This suggests that the CP70-GR5 scenario does not significantly influence the model projections regarding the energy of the buildings.
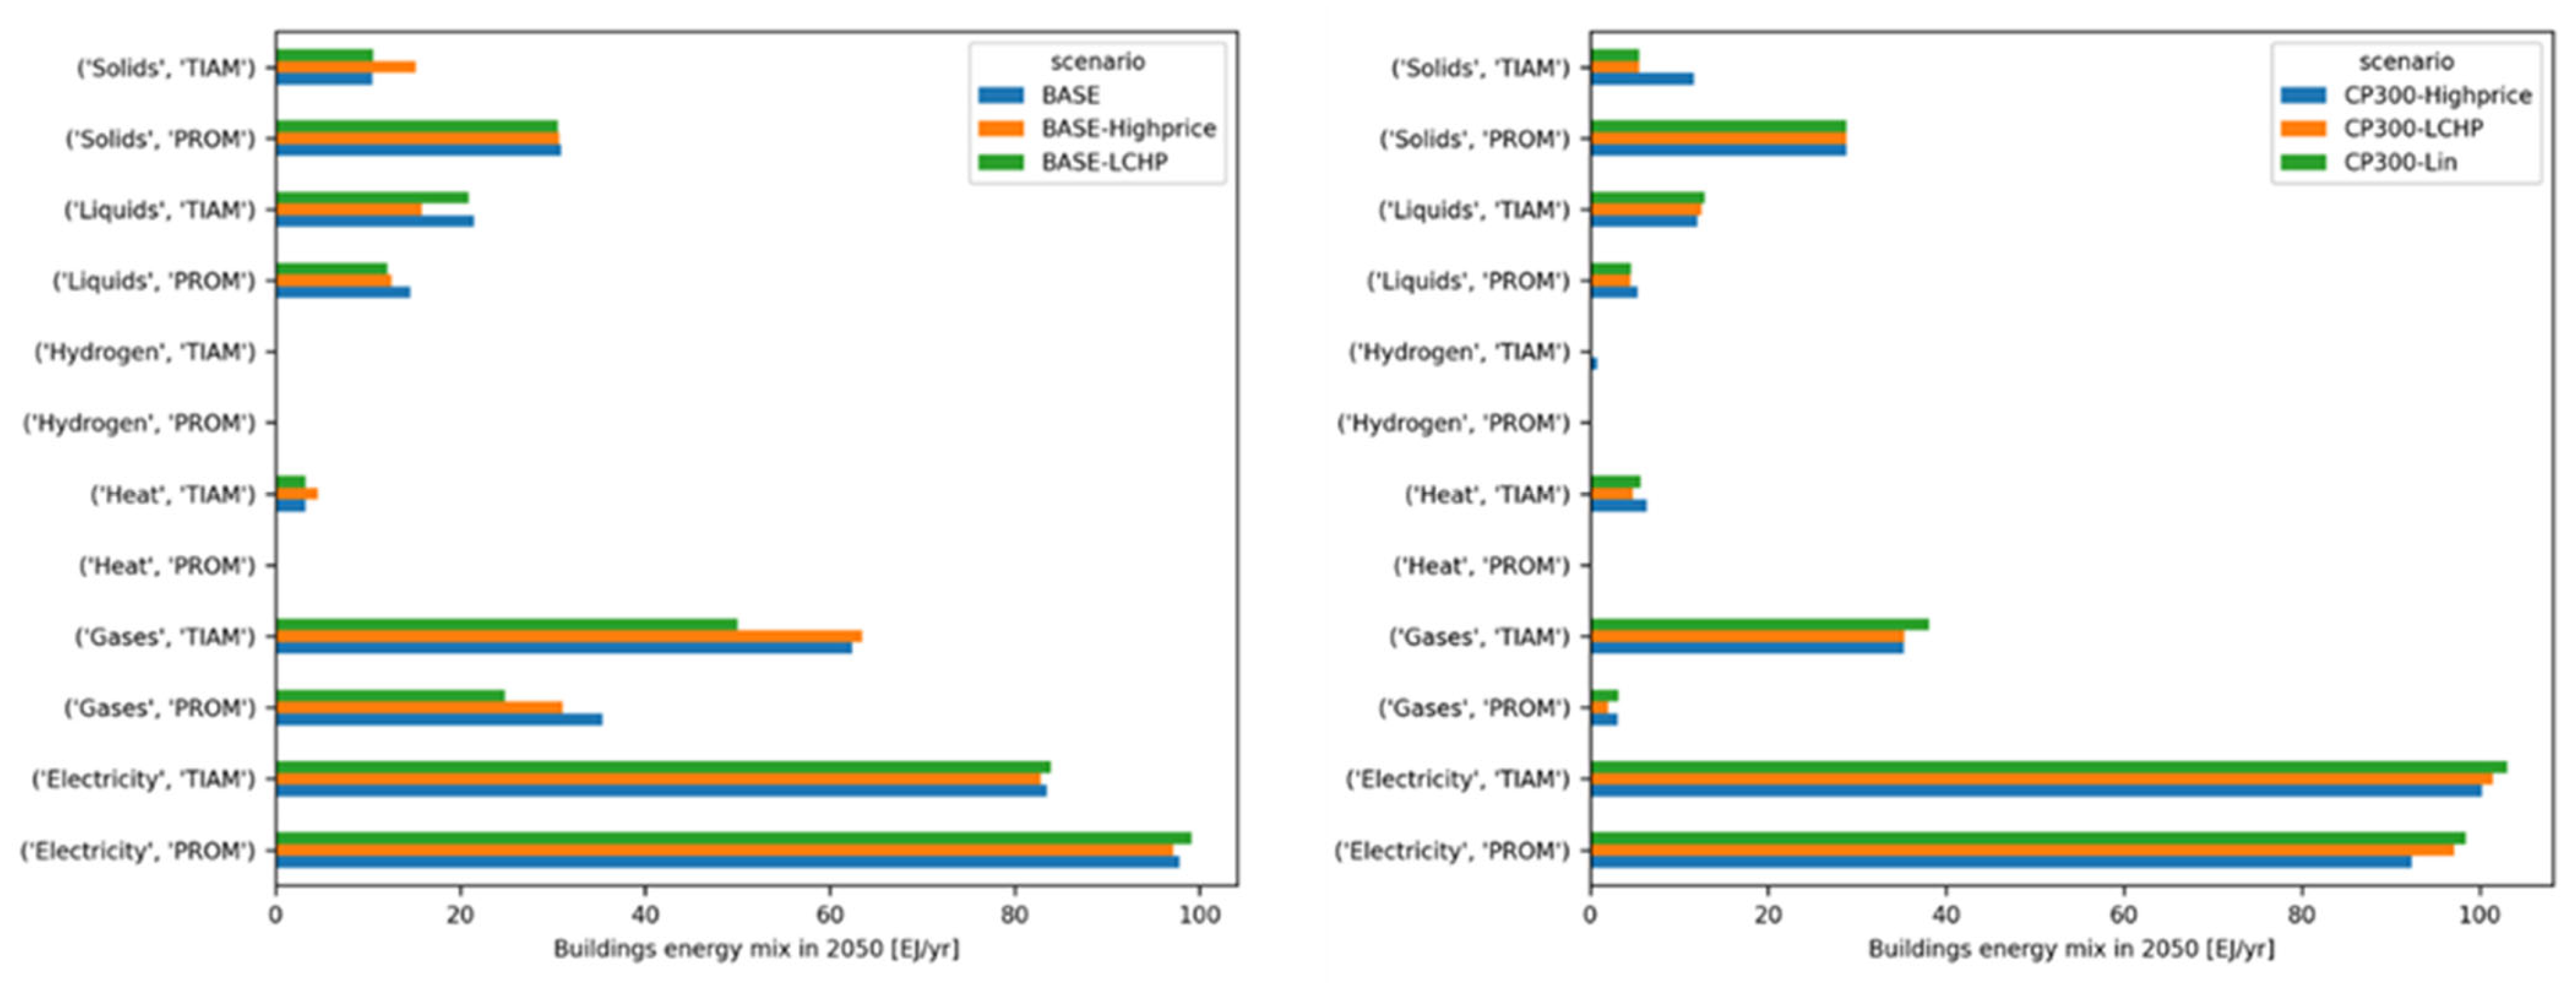
Figure 8 shows the energy mix in buildings for the variants of the BASE and the CP300 scenarios. The most prominent features are the near phase-out of natural gas in the CP300 variants for PROMETHEUS, the small role of hydrogen in the CP300-Highprice scenario for TIAM-ECN, and the contribution from district heat that is explicitly accounted for in TIAM-ECN while being absent in PROMETHEUS projections. The above results indicate that TIAM-ECN recognizes the significance of district heating as an energy-efficient system for the buildings while PROMETHEUS does not incorporate these considerations. Furthermore, the decline in the use of natural gas in PROMETHEUS can be explained by the implementation of a CP300 policy which increases the cost of the usage of fossil fuels. In addition, both models show increasing electrification of energy used in buildings in the variants assuming lower costs for heat pumps, while increased energy prices reduce total energy consumption for buildings.
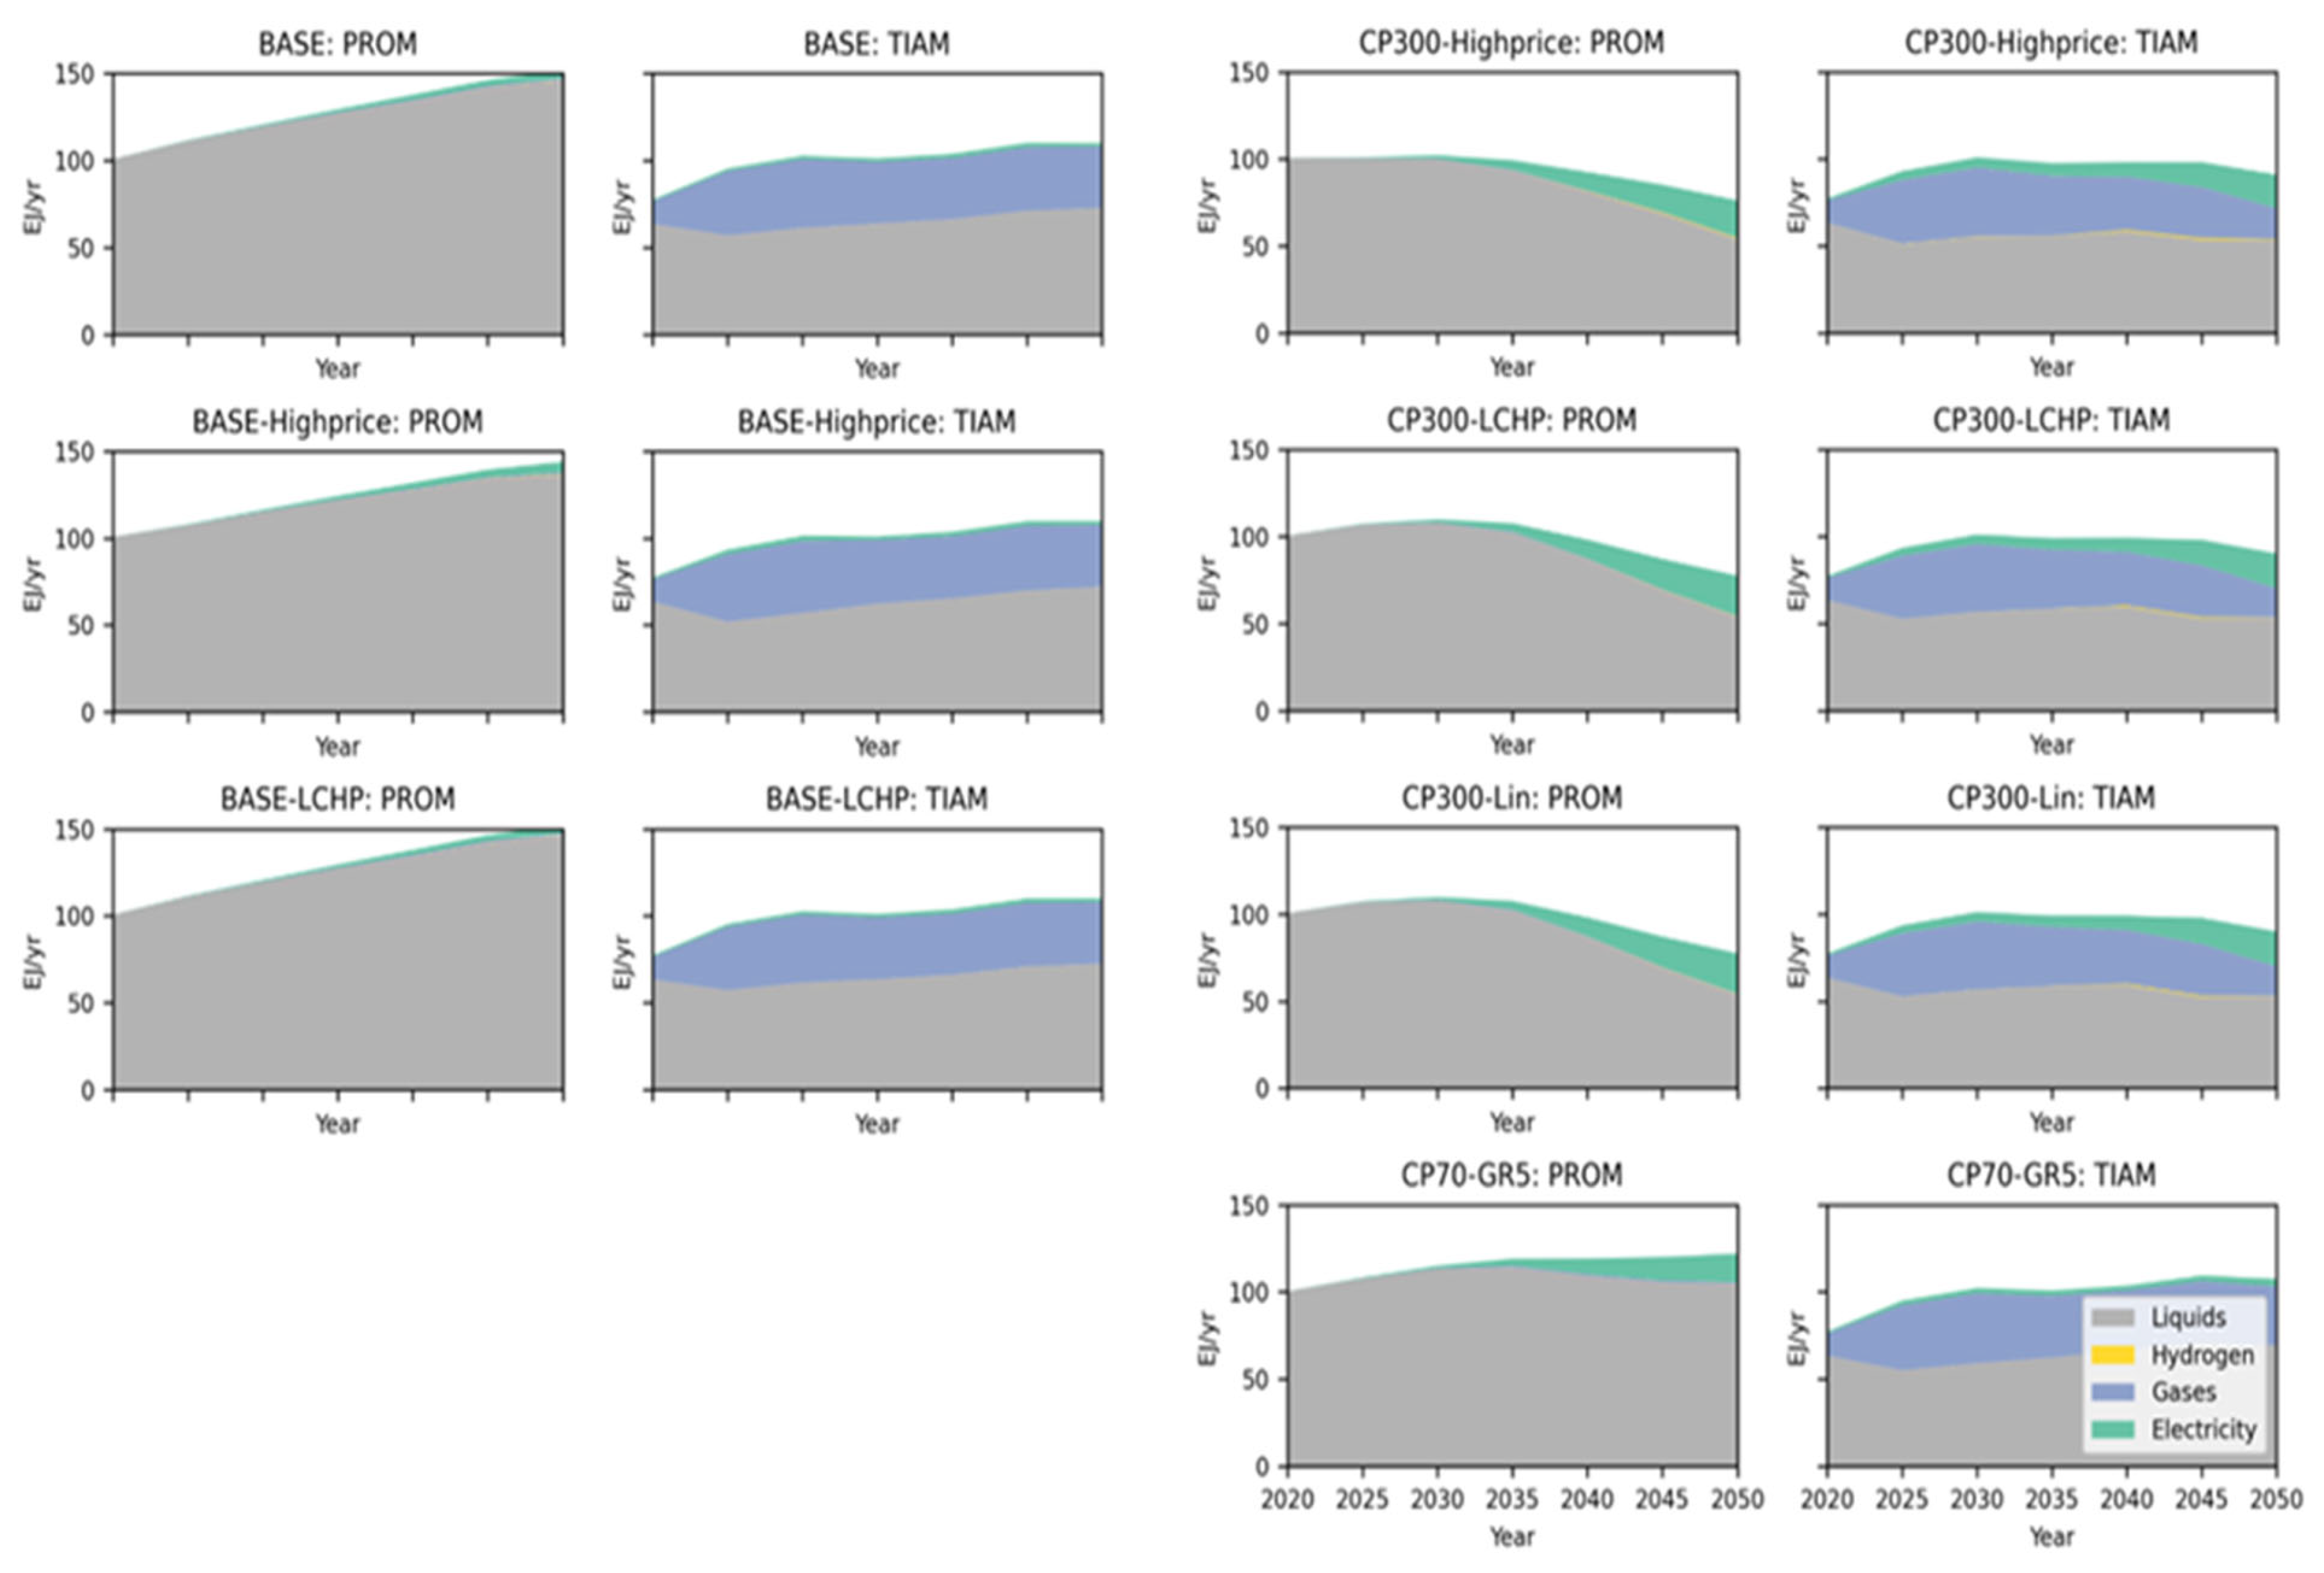
3.4. Global Energy Use in Transport
The model-based projections for the transport sector mix are presented in
Figure 9. In all scenarios and for both models, liquid fuels are projected to remain the main energy carrier in use until 2050, especially in the BASE scenarios. This common trend reflects that both models recognize the dominance of liquid fuels in the transport sector and the challenges that accompany the transition to alternative energy sources. TIAM-ECN projects a substantial role for gas-based transportation, while this is essentially negligible in PROMETHEUS. This disparity can be explained by the fact that PROMETHEUS does not prioritize gas-based transportation technologies to the same extent as TIAM-ECN. Both models project a slight downward trend in total transport energy use in the CP300 scenarios relative to BASE variants, with electricity steadily gaining a growing share over the other energy carriers. This indicates that the potential for electrification in the transport sector is a recognized potential from both models.
The trends under the CP300 scenario where electricity gains a growing share over other energy carriers reflect the models’ acknowledgement for this potential and align with the global efforts to promote electric vehicles and other electrified transportation solutions as a measure to reduce carbon emissions.
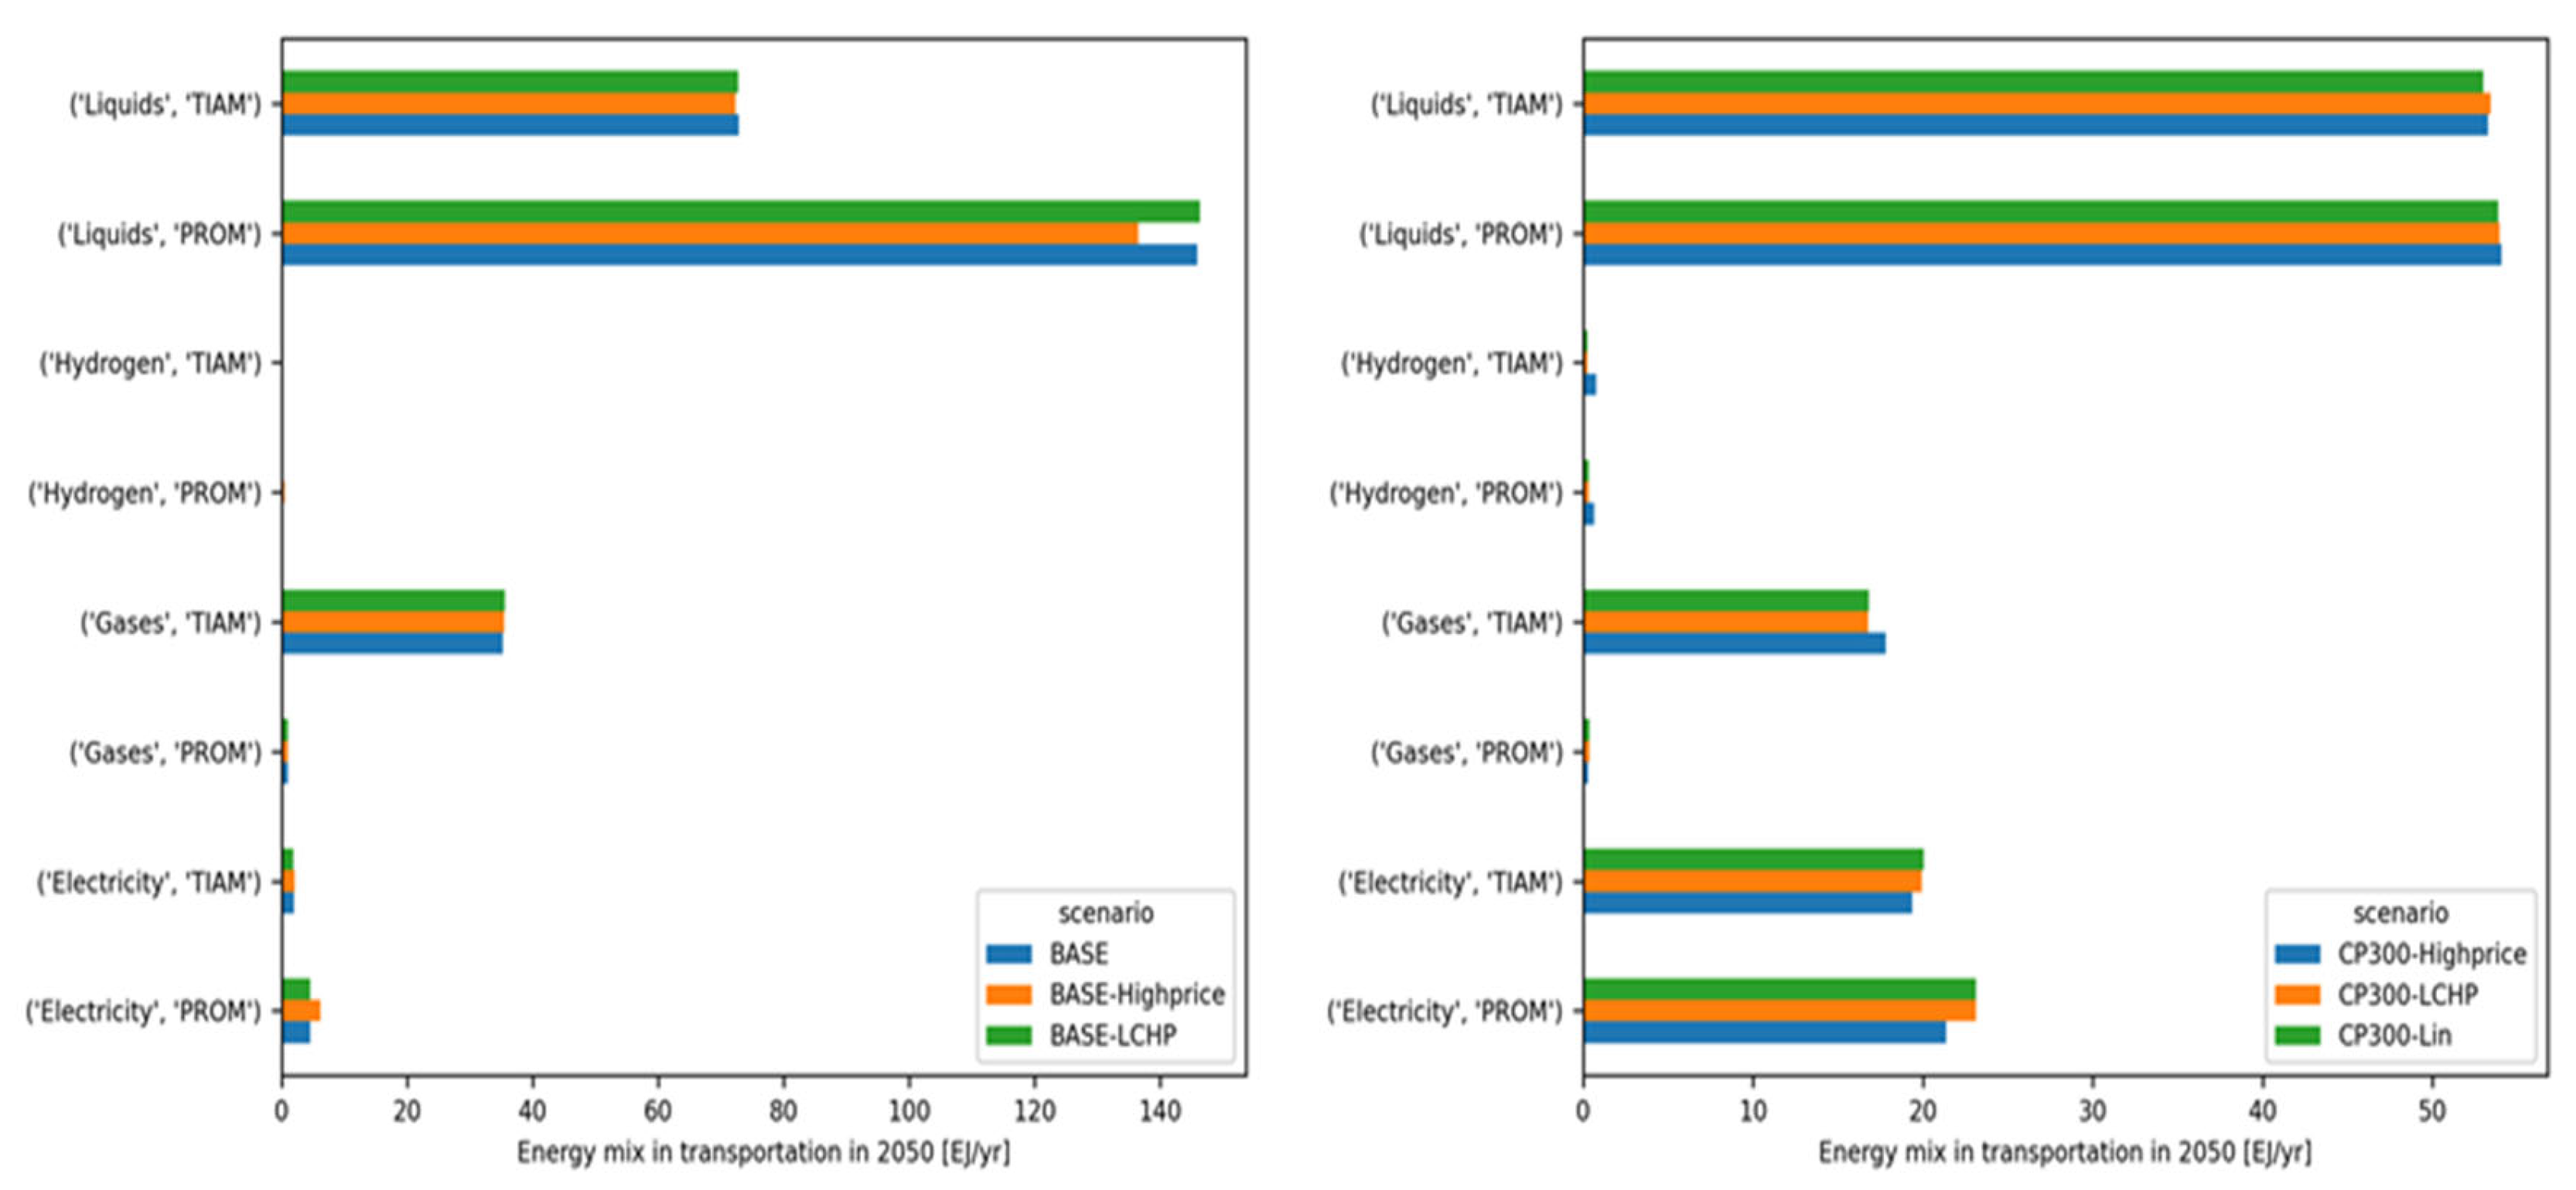
The energy mix in transportation in 2050 is shown in
Figure 10, indicating an overall consistency of model-based projections across scenarios. The main difference is related to the liquid fuel consumption in the BASE variants which is higher in PROMETHEUS than in TIAM-ECN. The share of gaseous fuels in the mix is nearly zero in all PROMETHEUS projections while in the TIAM-ECN model these fuels play a substantial role.
3.5. Industry Sector
The trends across BASE scenario variants for industry are similar in the two models (
Figure 11). An overall growth of industrial energy consumption is projected by both models, driven by increased industrial activity. In the case of the PROMETHEUS model, a steady increase is observed for all carriers (with industrial energy consumption dominated by electricity and gases), suggesting that electricity and gases have a crucial role in meeting industrial energy demand; while for the TIAM-ECN model, the growth is more scattered throughout the time horizon and is mainly due to solid fuels, which shows that the use of solids in meeting the energy needs of the industrial sector is greater. In the CP300 variants, PROMETHEUS projects firstly an overall decrease in energy consumption in industry (due to increasing energy efficiency) and then an increase mainly driven by gas and electricity, while liquid and solid fuels are nearly phased out by 2050. PROMETHEUS seems to identify both the increased energy efficiency and the shift to cleaner sources as major pathways in the attempt to decarbonize the industries. The trends in the CP300 scenarios are different in TIAM-ECN. For example, electricity—the dominant fuel until 2040—is largely replaced by gases, hydrogen, and solid fuels in the last decade of the century. The role of gases and hydrogen in the long term seems to be greater in TIAM-ECN which envisions a more diverse energy mix in the industries.
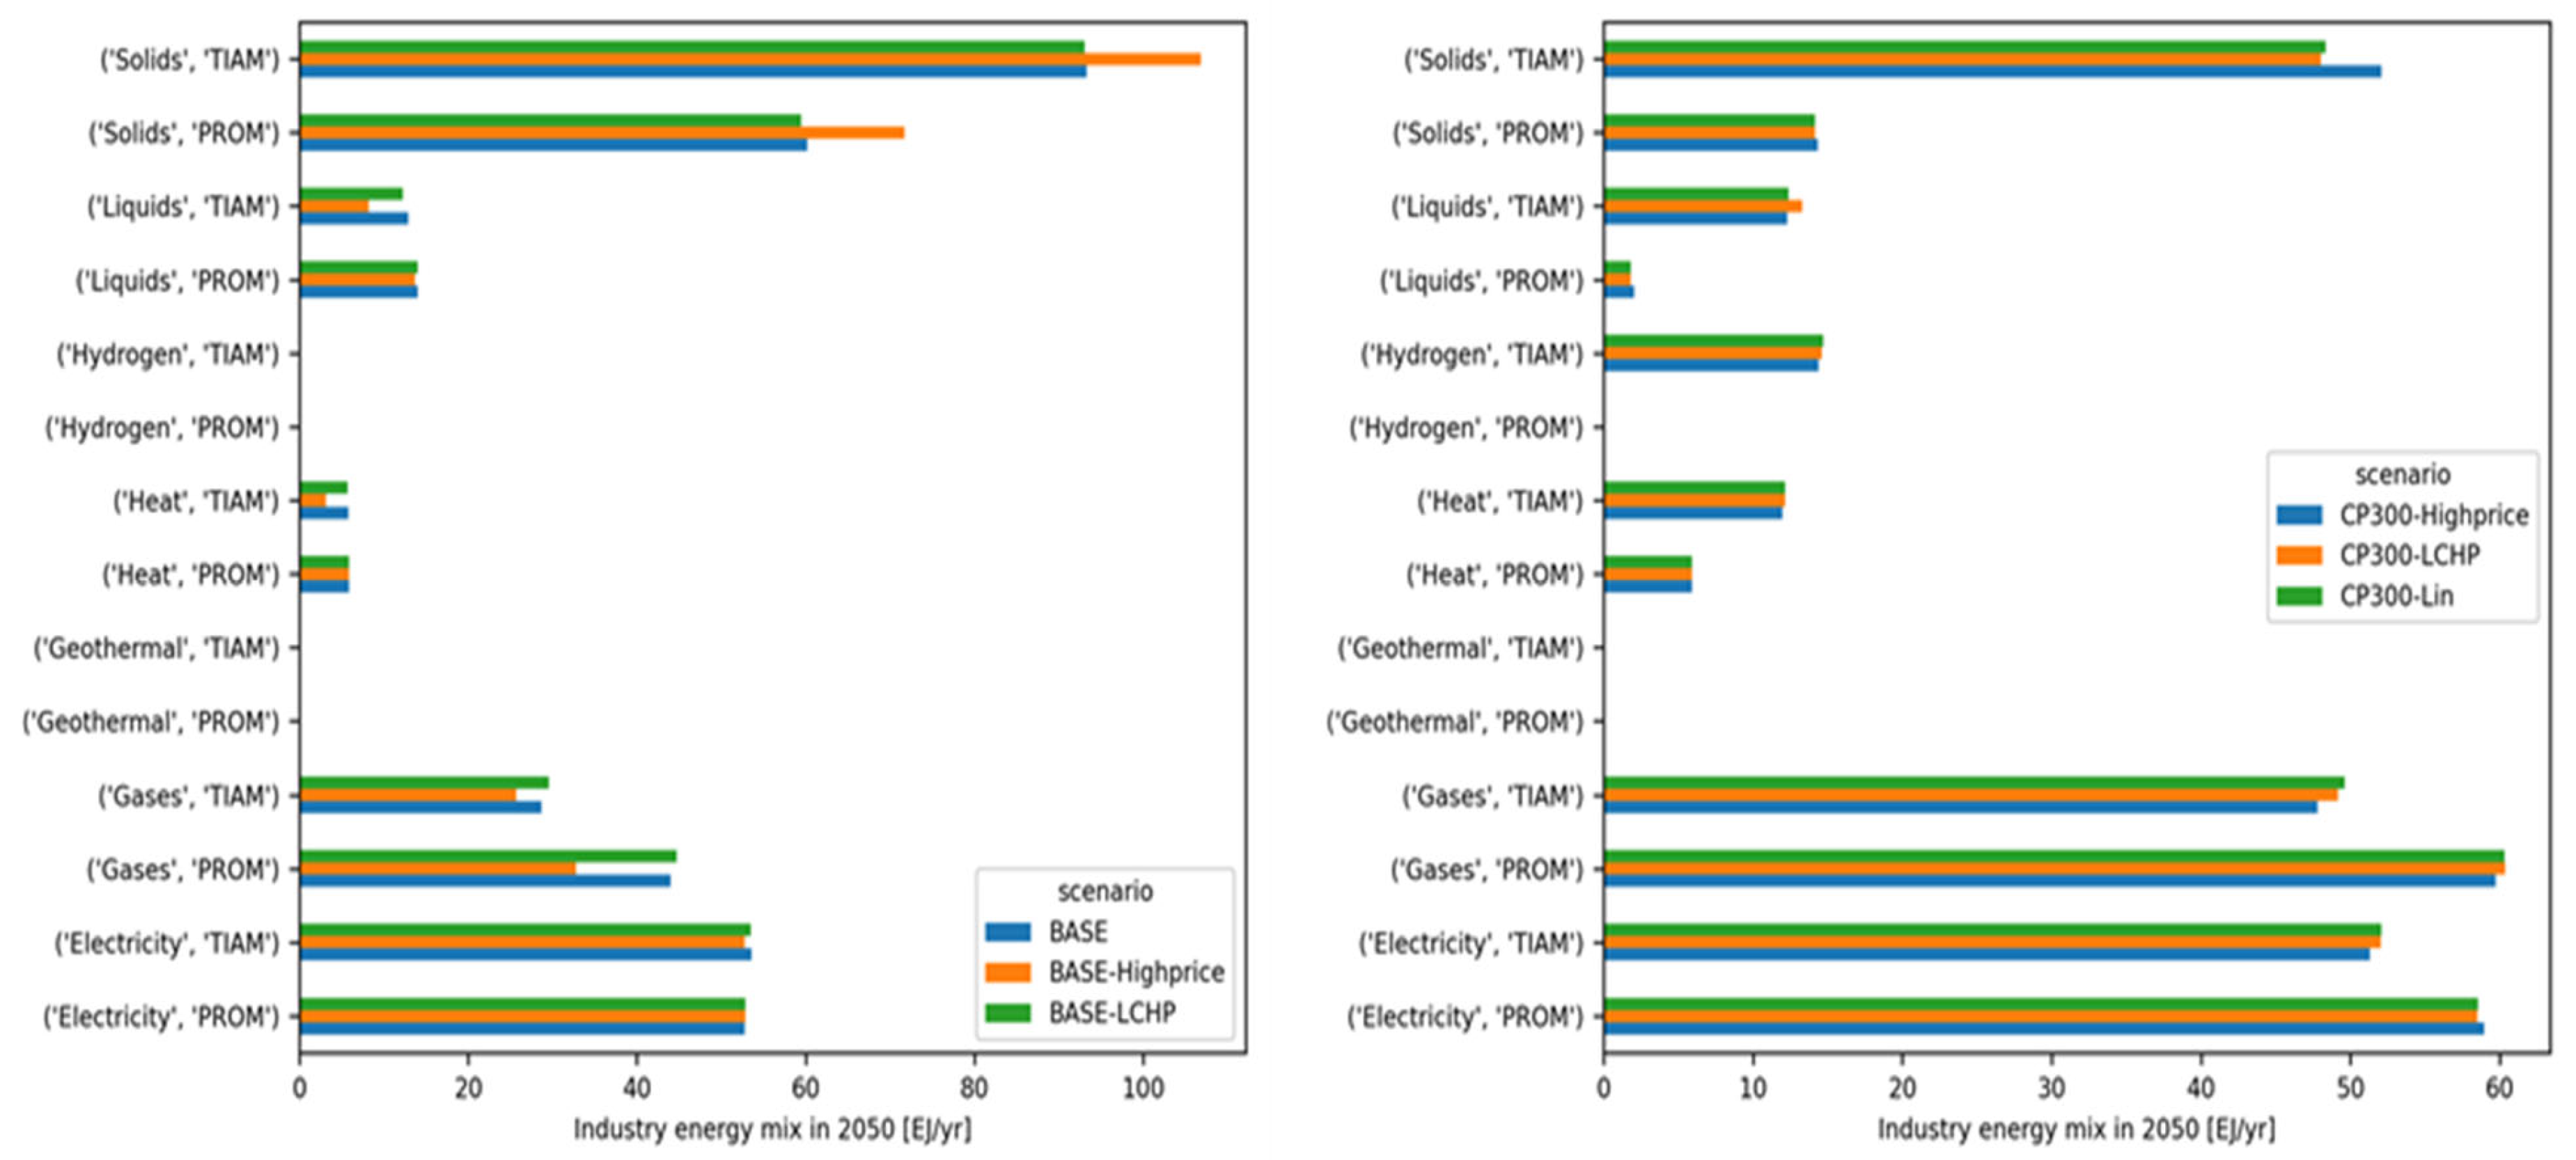
The contributions of various energy carriers to the industry mix in 2050 are shown in
Figure 12. In the BASE scenarios, the models display a consistent picture, with similar contributions from the different energy carriers and comparable trends across variants. In the CP300 variants, TIAM-ECN projects a much larger role for solids, liquids, hydrogen, and heat than the PROMETHEUS model (which considers increased electrification as the major option to decarbonize industries). TIAM-ECN, under the CP300 scenarios, identifies a more diverse range of paths to decarbonize industry, giving a greater emphasis on solids, liquids, hydrogen, and heat.
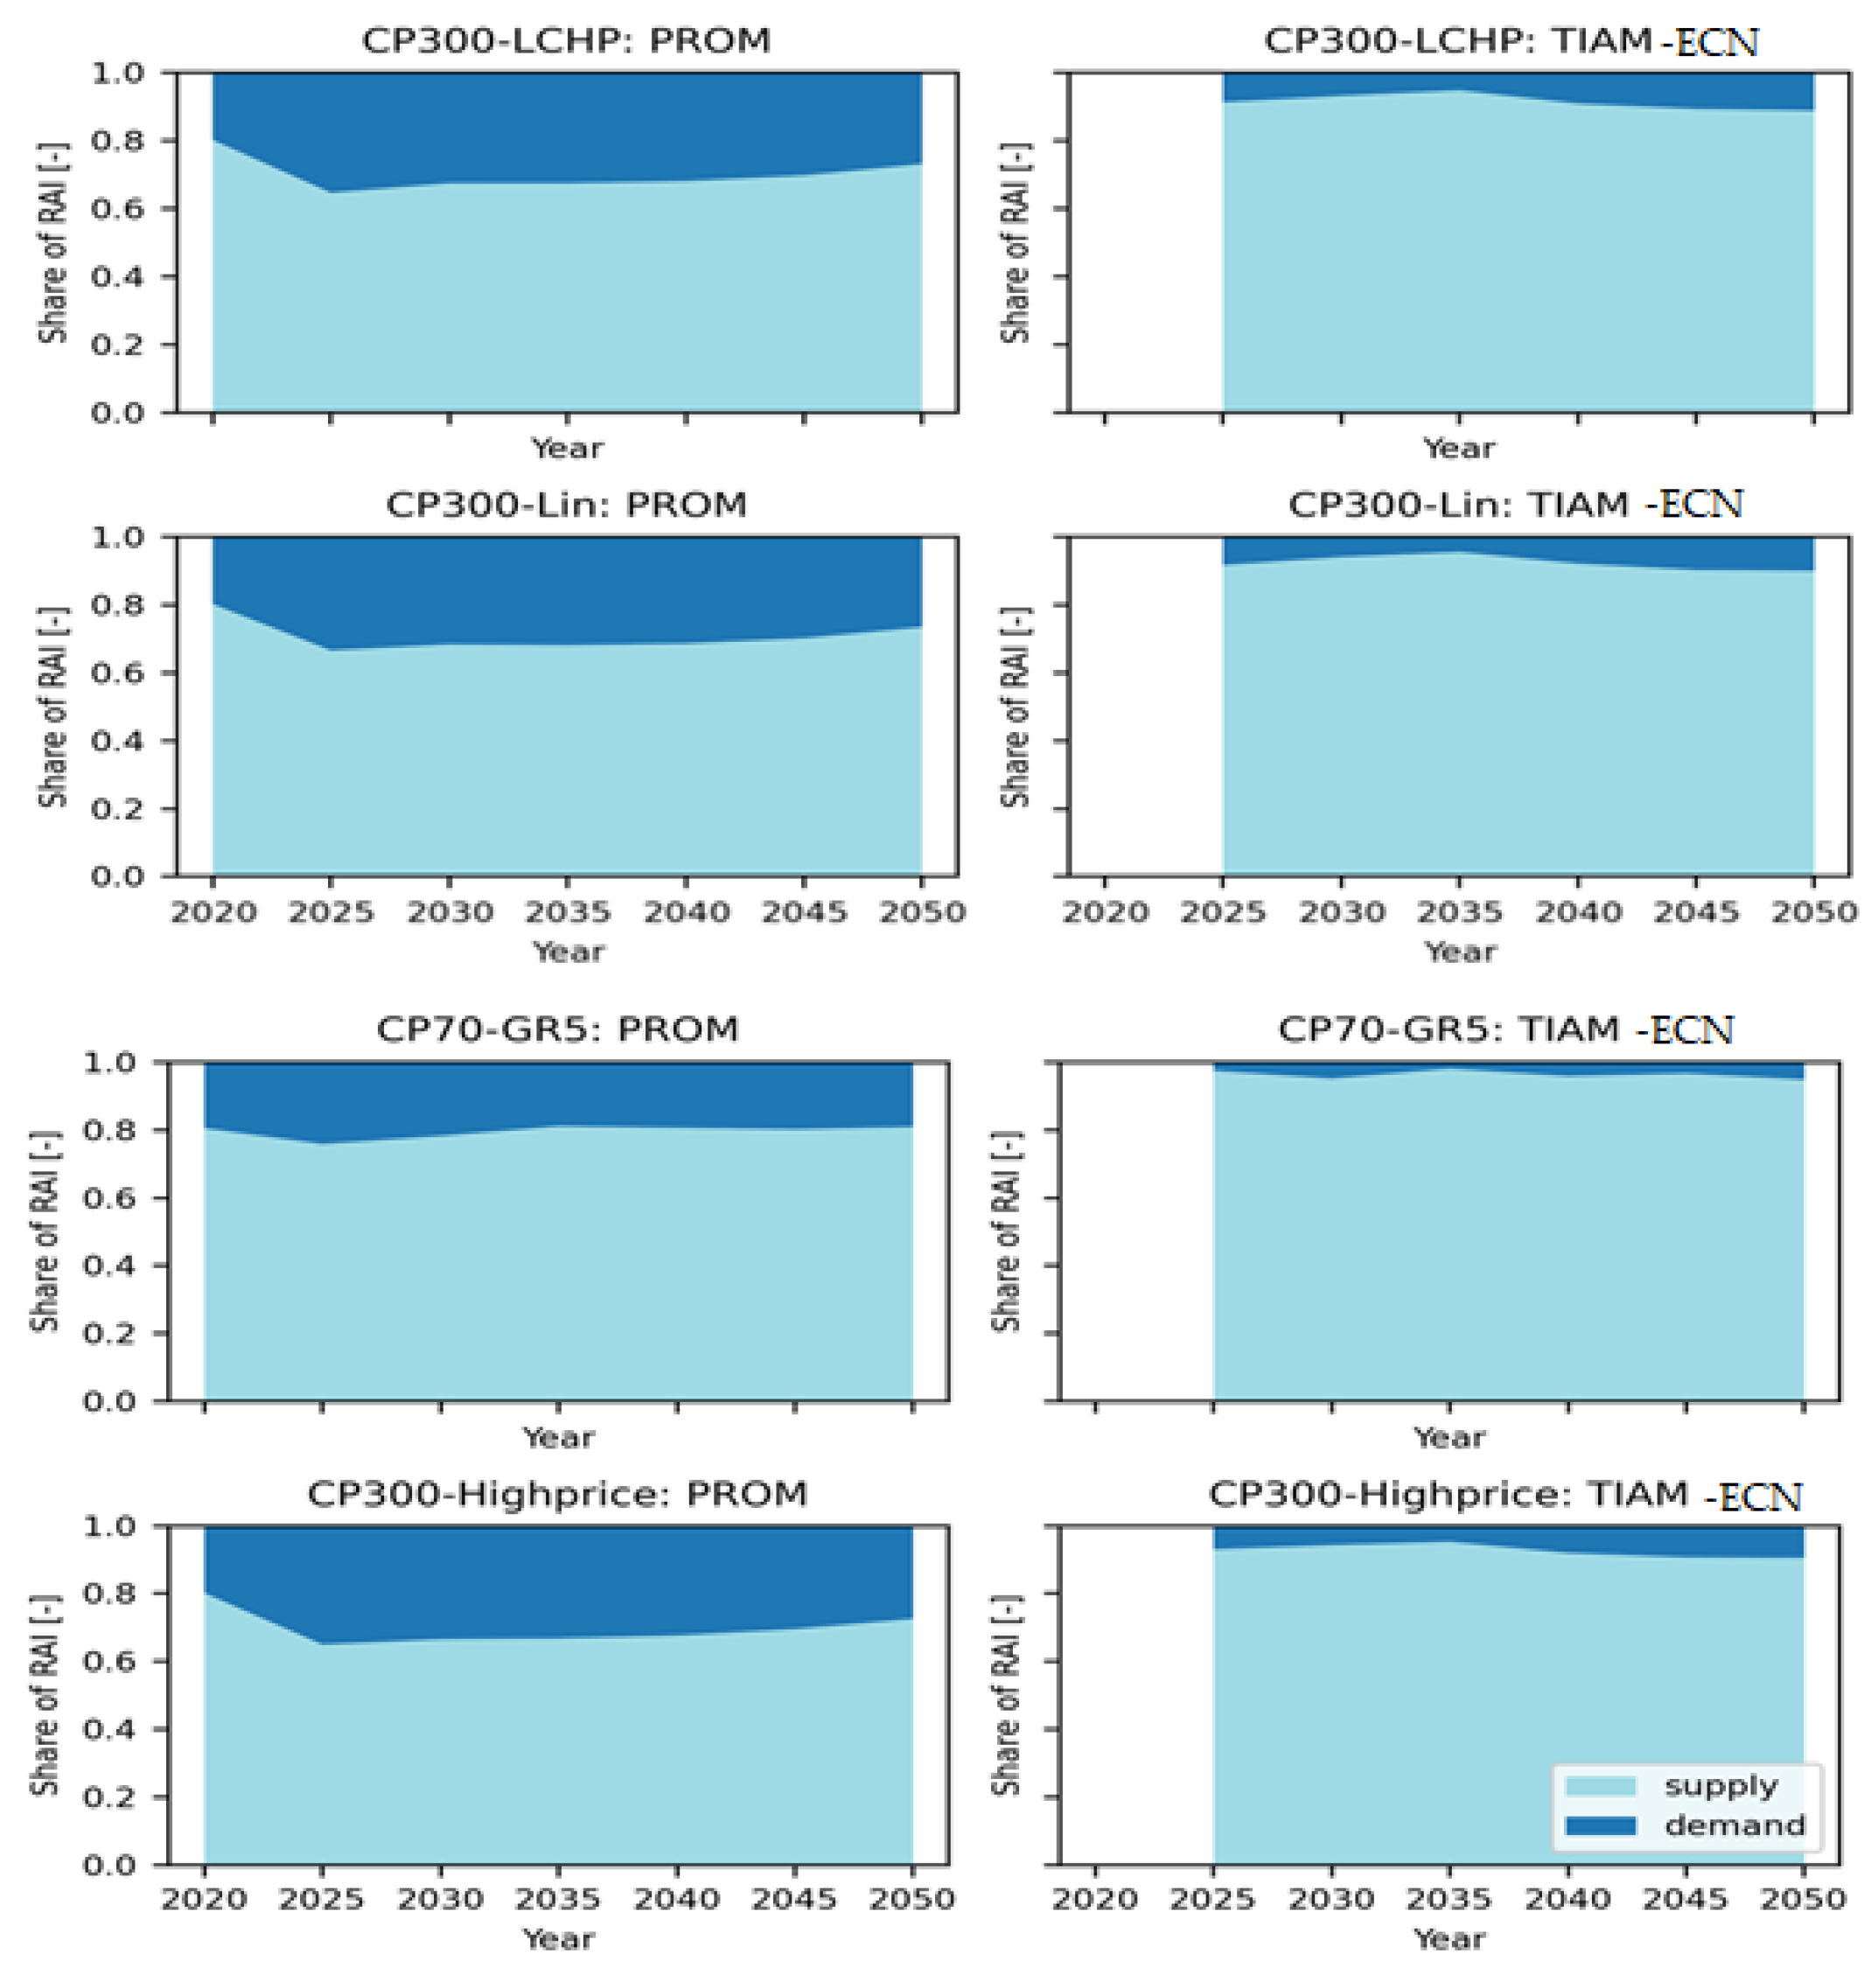
3.6. Supply and Demand Shares of Emission Abatement
Figure 13 shows the supply and demand shares of RAI according to the ERT index for all scenarios for each model individually. While the overall trends are (for each model) similar across scenarios,
Figure 13 shows that decarbonization in TIAM-ECN is predominantly achieved through supply-side changes (more than 90% of the emission reduction effort), while in PROMETHEUS demand-side changes (e.g., energy efficiency improvements in buildings, transport, and industry) also provide a substantial contribution to the emission reduction (ranging from 20% to 40%).
4. Discussion
In this paper, we presented our comprehensive research for global emissions projections using the two global IAMs, PROMETHEUS and TIAM-ECN, under different scenarios and variants. Our findings showed the decarbonization potential of different sectors and the models’ sensitivity to various changes in input drivers, like policy measures (carbon prices), technology costs, and global energy prices.
As for the carbon pricing and its impact on emission reduction, our findings align with previous research [
52] which investigated the impact of carbon pricing on emission reduction using different carbon price levels. This research found that higher carbon prices led to more substantial emission reductions, supporting the results of our study in the CP300 scenarios, where we also observed significant decarbonization efforts induced by high carbon pricing.
Furthermore, the role of renewable energy deployment in achieving decarbonization goals has also been examined. Our findings also correspond with another relevant study [
53] which explored scenarios with advanced grid management systems. Their findings demonstrated significant energy savings and remarkable reduction in
emissions, aligning with our results in the CP70-GR5 scenario which projected a decreasing
contribution from energy supply by increased deployment of renewable energy generation for electricity. The authors of [
54], which is focused on the decarbonization potential of different sectors, including industry, buildings, and transportation, indicated in their analysis that industry sectors face significant challenges in achieving deep decarbonization, while the building and transportation sectors offer more feasible pathways. This is consistent with our results, where TIAM-ECN projected a higher contribution from the industry sector compared to PROMETHEUS in terms of emissions, highlighting the varying decarbonization potential across sectors.
Overall, our study sheds light on the potential impacts of different scenarios on the global energy system and emissions, providing valuable insights for policymakers to formulate more effective strategies in addressing climate change. This study’s strengths lie in its comprehensive approach, utilization of robust IAMs, and evaluation of diagnostic indicators, which enhance the accuracy and reliability of future energy and integrated assessment modeling and assessments. However, it is important to acknowledge certain limitations, such as the reliance on assumptions and parameters within the models, which should be carefully evaluated and refined to improve the modeling approaches continuously.
The utilization of two robust IAMs, along with the evaluation of diagnostic indicators, enhances the accuracy and reliability of future energy and integrated assessment modeling and scenario assessment. These findings highlight the importance of adopting a comprehensive and integrated approach to decarbonization, considering both supply and demand measures while balancing economic, social, and environmental aspects. Furthermore, the study underscores the necessity of careful consideration and evaluation of assumptions and parameters in each model, contributing to the continuous improvement of modeling approaches in the field. Finally, using models with different structures and assumptions (reflecting different choices of modelers on how to best approach the analysis of mitigation pathways) is not a drawback, but a feature, of model comparisons, since it allows us to explore the associated range of uncertainties [
50]. However, it is important to recognize that the breadth of assumptions made by this set of models does not necessarily cover the entire range of possibilities.
5. Conclusions
This paper provides insights into the potential impacts of different scenarios on the global energy system and the related emissions, informing policymakers to develop more effective strategies to combat climate change. The study uses two established IAMs to assess the robustness of the results and to identify possible areas of uncertainty or sensitivity to different scenario assumptions. The presented findings can help to improve the accuracy and reliability of future energy and integrated assessment modeling and scenario assessments. Finally, the study used a set of diagnostic indicators to evaluate the performance of different models and to identify points for further optimization. Overall, the study, on the one hand, highlights the importance of taking a comprehensive and integrated approach towards decarbonization by considering both supply and demand measures while balancing the economic, social, and environmental aspects and, on the other hand, emphasizes the need for careful consideration and evaluation of the assumptions and parameters used in each model.
In this study, we used the TIAM-ECN and PROMETHEUS models to investigate the development of the global energy system mix and their sensitivity to several scenario assumptions. The analysis used several diagnostic indicators, including the relative abatement index (RAI), carbon intensity (CI), energy intensity (EI), and emission reduction type (ERT) index. The results showed that both IAMs display similar responses to carbon price with PROMETHEUS being more sensitive to this parameter than TIAM-ECN. Additionally, the models display roughly constant CI developments in the variants of the BASE scenario and decreasing CI trajectories in the CP300 scenarios, pointing out significant decarbonization efforts induced by high carbon pricing. The ERT index displayed that decarbonization in TIAM-ECN is mainly achieved through supply-side changes while demand-side changes are more pronounced in PROMETHEUS, which has an enhanced representation of energy efficiency options and measures in end-use sectors.
The BASE scenario variants showed similar trends with global emissions increasing steadily up to nearly 40 Gt CO2 in 2050. The TIAM-ECN model projected a lower level of emissions from energy supply and an increasingly higher contribution from industry compared to the PROMETHEUS model. Under the variants of the CP300 scenario, both models projected a strong emission decrease to around 10 Gt CO2 per year by the middle of the century. The industry sector decarbonizes completely in the TIAM-ECN model but not in the PROMETHEUS model, while in the building and energy supply sectors the opposite happens. Both models in the CP70-GR5 scenario projected a decreasing CO2 contribution from energy supply driven by the increased deployment of renewable energy generation for electricity. The TIAM-ECN model projected a slight increase in CO2 emissions in the demand sectors while these sectors are constant in PROMETHEUS. According to the power mix, projections showed that non-biomass renewables dominate the electricity production from 2030 onwards in the TIAM-ECN model while the PROMETHEUS model is more conservative and shows an energy mix that is still predominantly fossil fuel based until the middle of the century. Furthermore, in the CP300 variants, PROMETHEUS almost completely phases out fossil-based power generation in favor of biomass, solar, and wind technologies while the TIAM-ECN model in the same scenario variants projected only a minor role for bio-based technologies in the power sector and an essentially constant contribution from fossil fuels.
The study aims to contribute to a better understanding of the possible challenges and opportunities associated with the transition to a low-carbon energy system and provide valuable insights to inform the policy decisions on climate change mitigation efforts. Furthermore, the present study explores the possible trade-offs and effectiveness of alternative policy approaches to achieve decarbonization targets. Based on the presented analysis, several potential policy recommendations can be made to address the challenges faced by the global energy system. Firstly, governments should invest in low-carbon technologies such as renewable energy technologies and infrastructure coupled with the implementation of a carbon price that increases steadily over time. The promotion of energy efficiency improvements turns out to be critical in reducing energy demand and increasing the effectiveness of decarbonization efforts, while a shift towards low- and zero-carbon electricity generation can also lead to significant and low-cost CO2 emission reductions. Finally, the increasing share of renewable energy technologies such as wind, solar, and hydroelectric power in the energy system is an essential and cheap component of decarbonization efforts and should be pursued by policymakers globally. The results of our research highlight the need for a holistic approach to address the challenges faced by the global energy system which requires the combination of demand- and supply-side measures to achieve significant reductions in GHG emissions.
This study could be expanded to include more scenarios such as those that explore the impact of different policy measures or technological developments or variants exploring the impact of changing technology or policy assumptions. The current study employed two models, but it could be broadened by integrating additional models to provide a more comprehensive assessment of energy–climate developments. While the presented analysis uses a series of diagnostic indicators to evaluate the sensitivity of the IAMs to several scenario assumptions, additional indicators could be incorporated to provide a more detailed analysis.


 ,
, 


