
Increasing Reservoir Recovery Efficiency through Laboratory-Proven Hybrid Smart Water-Assisted Foam (SWAF) Flooding in Carbonate Reservoirs

 , ,
, ,  , and
, and
Abstract
:
1. Introduction
2. Methodology
2.1. Experimental Materials
2.1.1. Core Sample
2.1.2. Crude Oil
2.1.3. Brine Solution
Smart Water Preparation
2.1.4. Surfactant
2.1.5. Gas
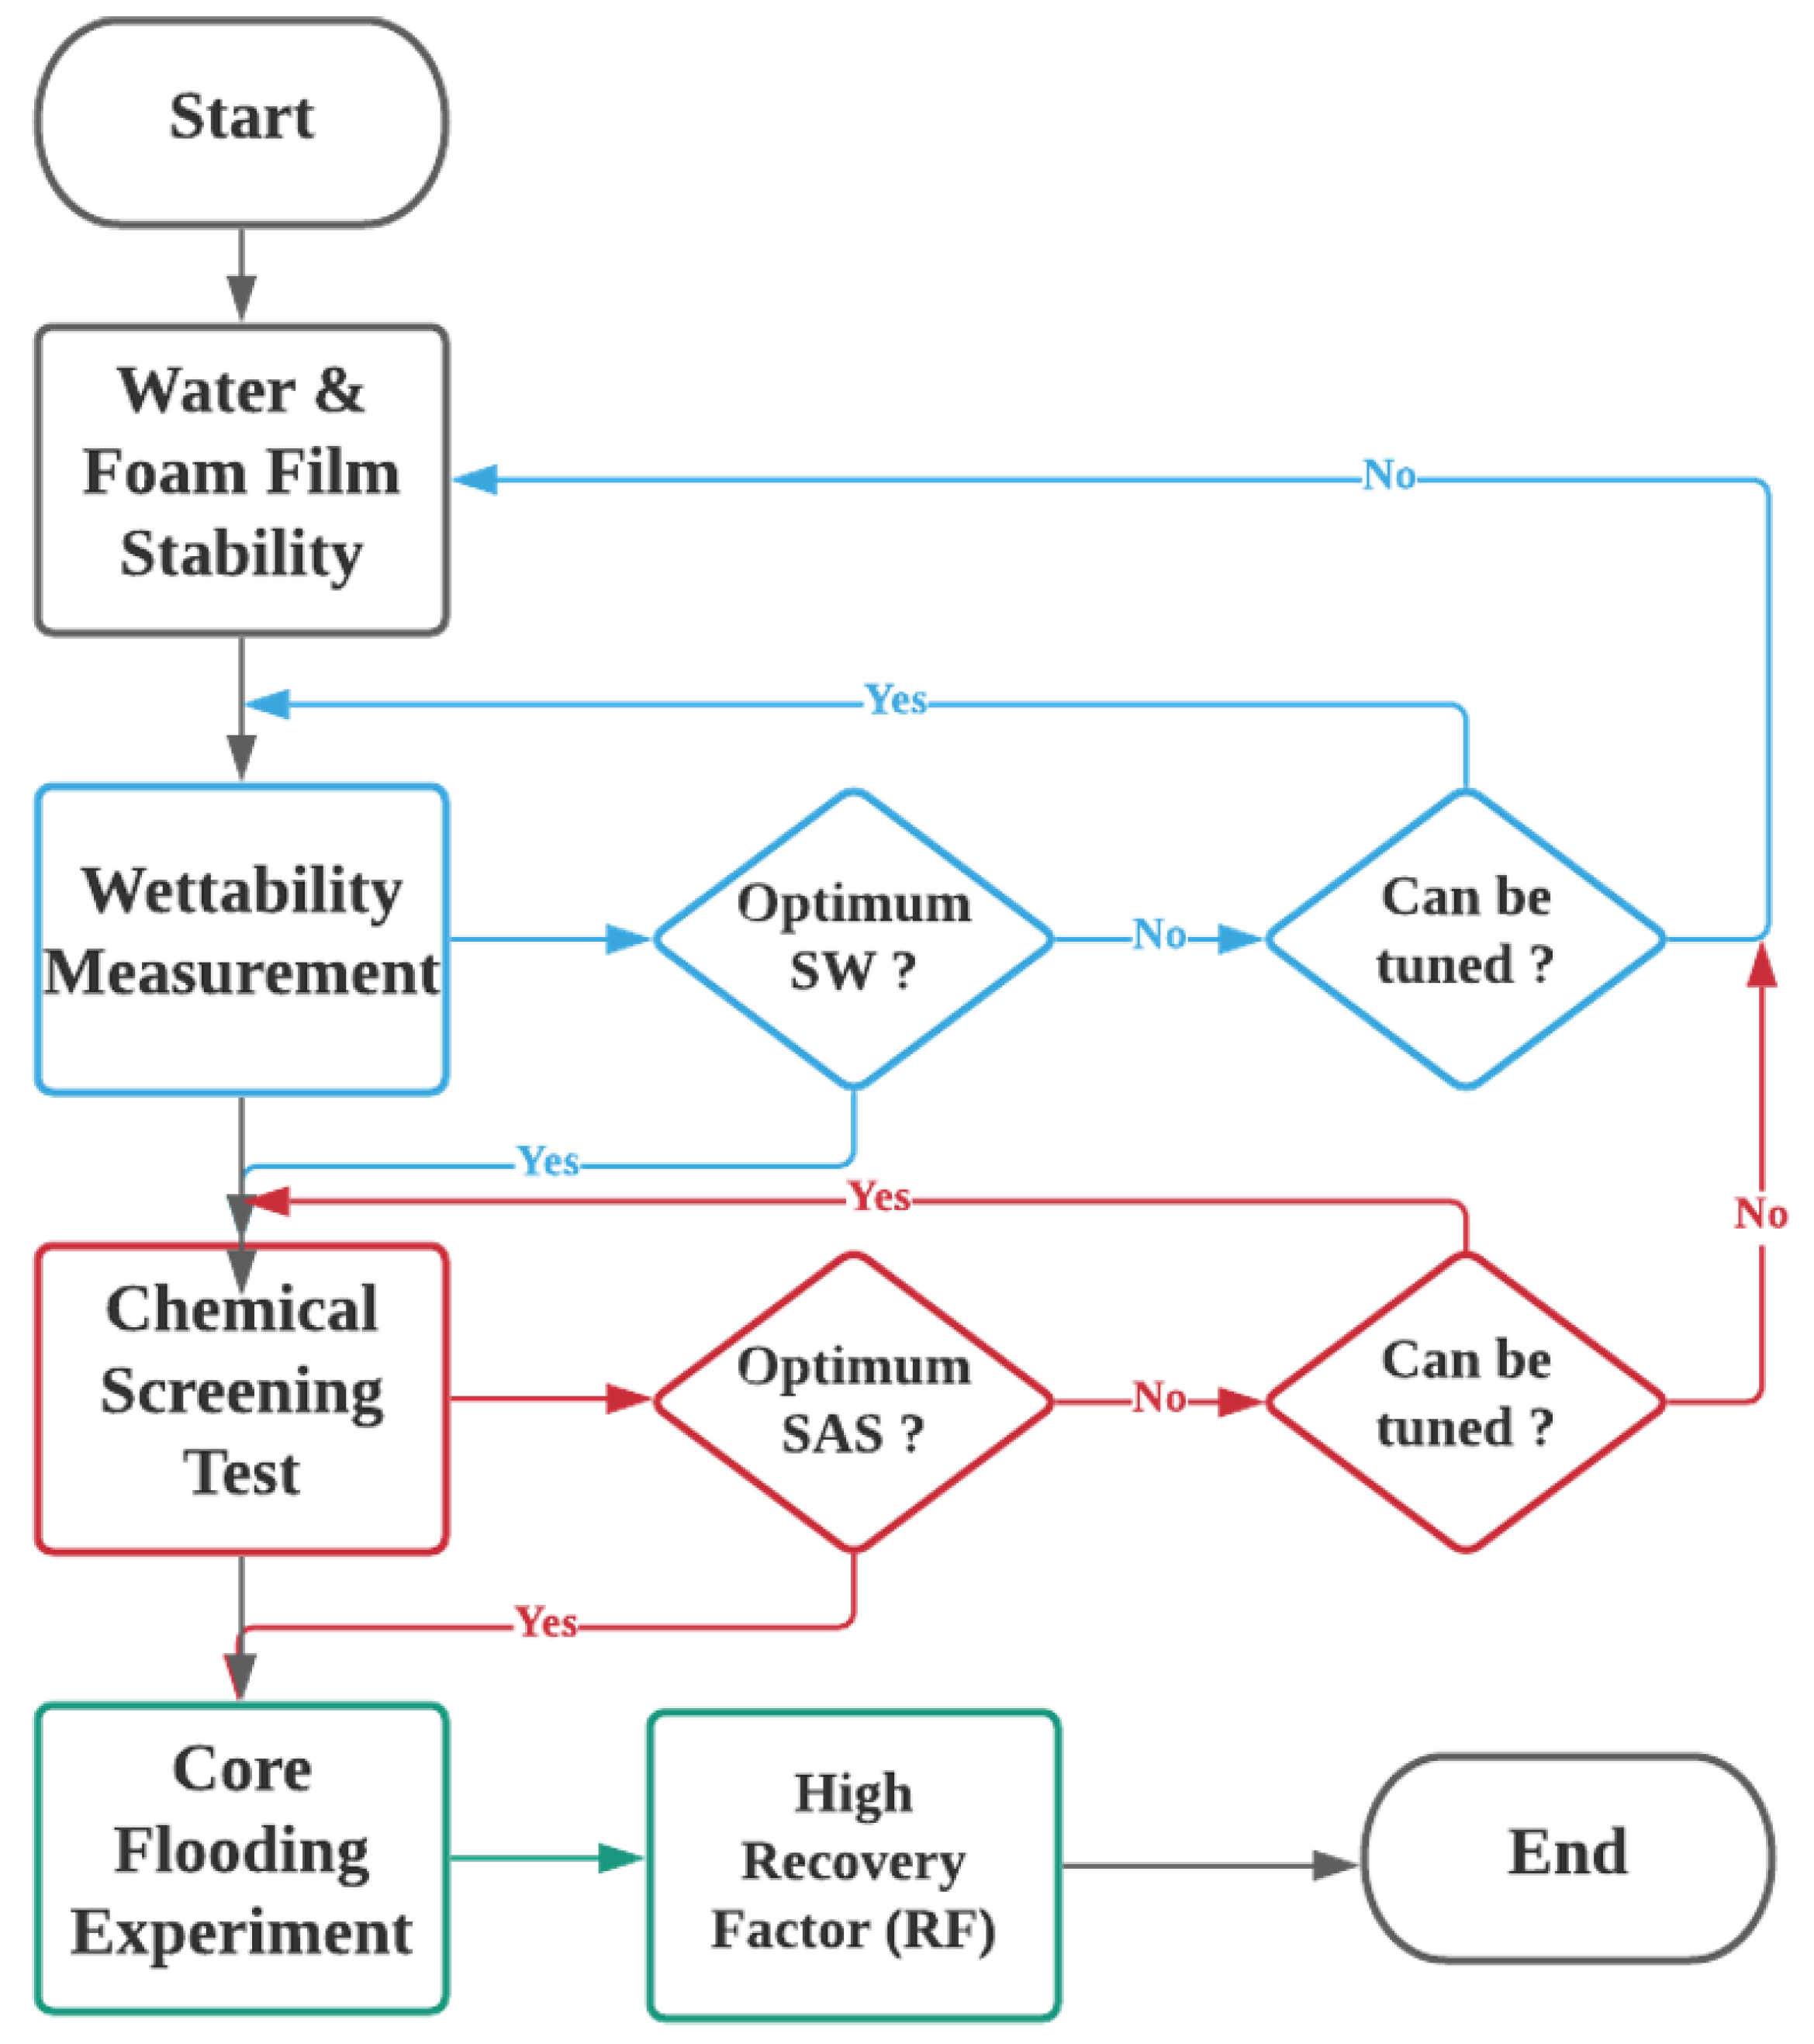
2.2. Experimental Procedure
- To identify SWAF’s optimum condition i.e., the best smart water (SW) that achieves the highest wettability modification by tuning the water chemistry (i.e., ion type, concentration, salinity).
- To generate SAS that will ultimately reduce the interfacial tension (IFT) and has high foam stability in presence of crude oil.
- To investigate the proposed hybrid technique in the dynamic mode in which different core flooding scenarios are employed towards the highest recovery factor.
2.2.1. Compatibility Test
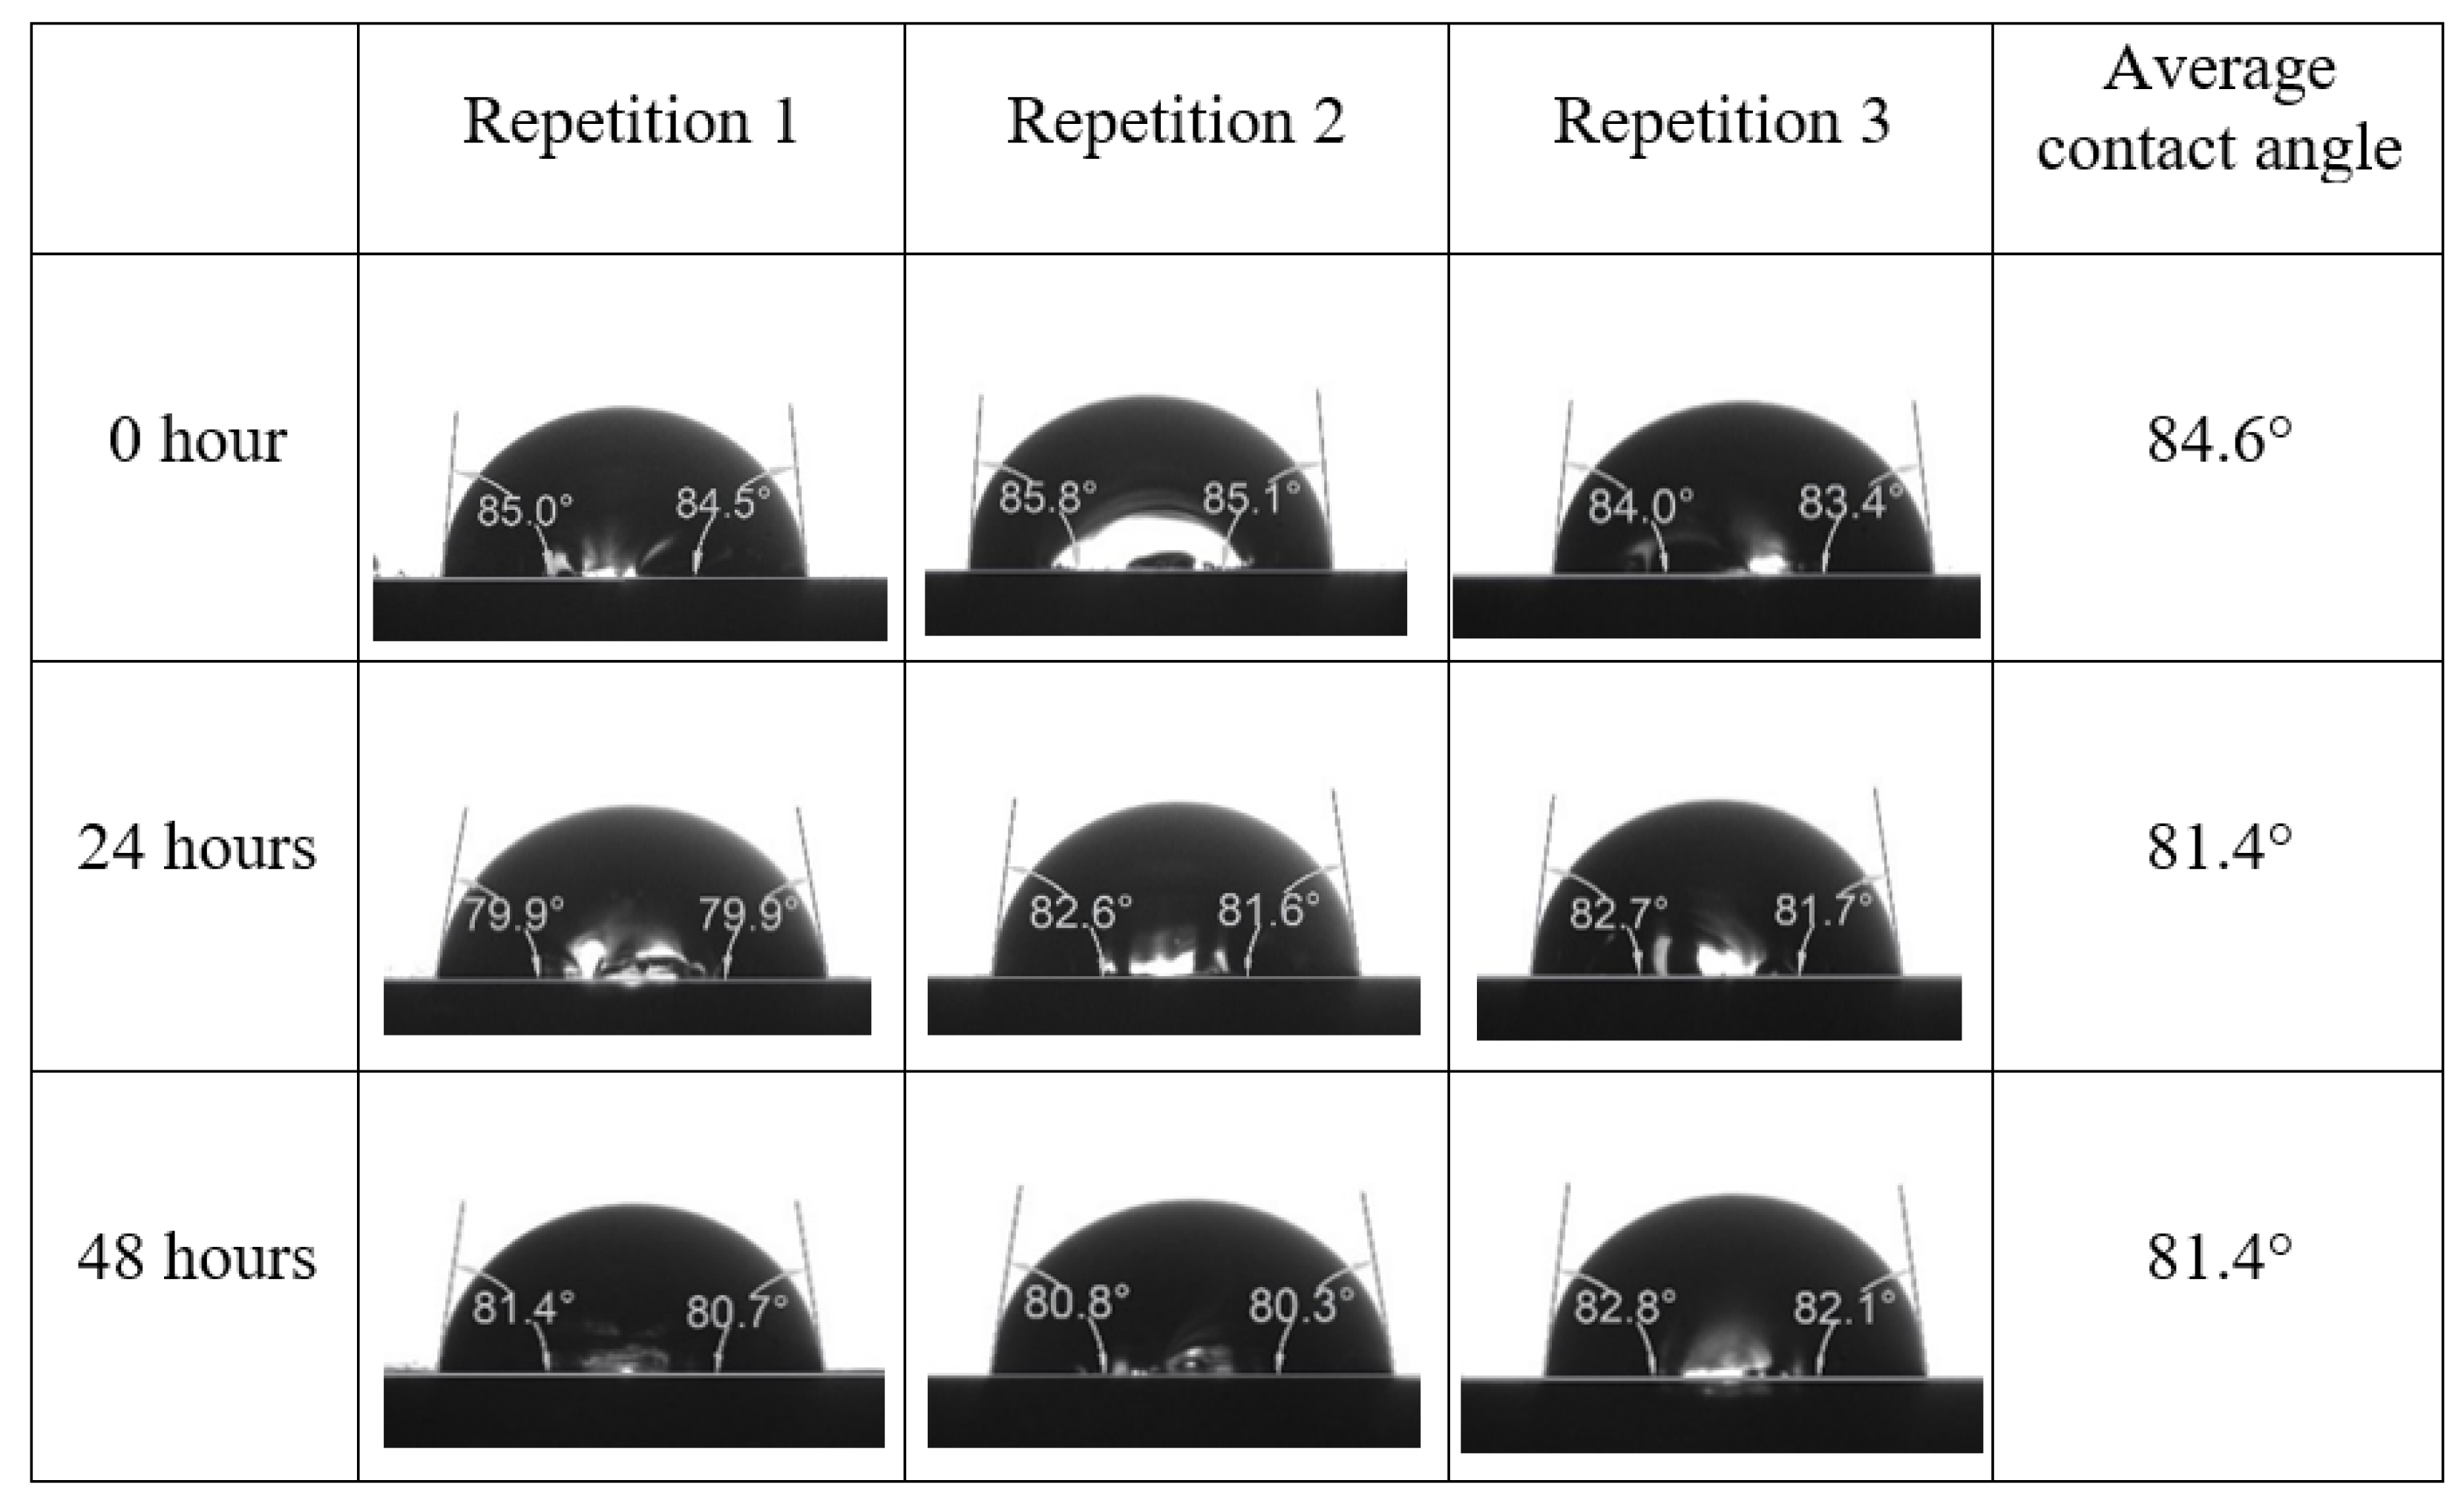
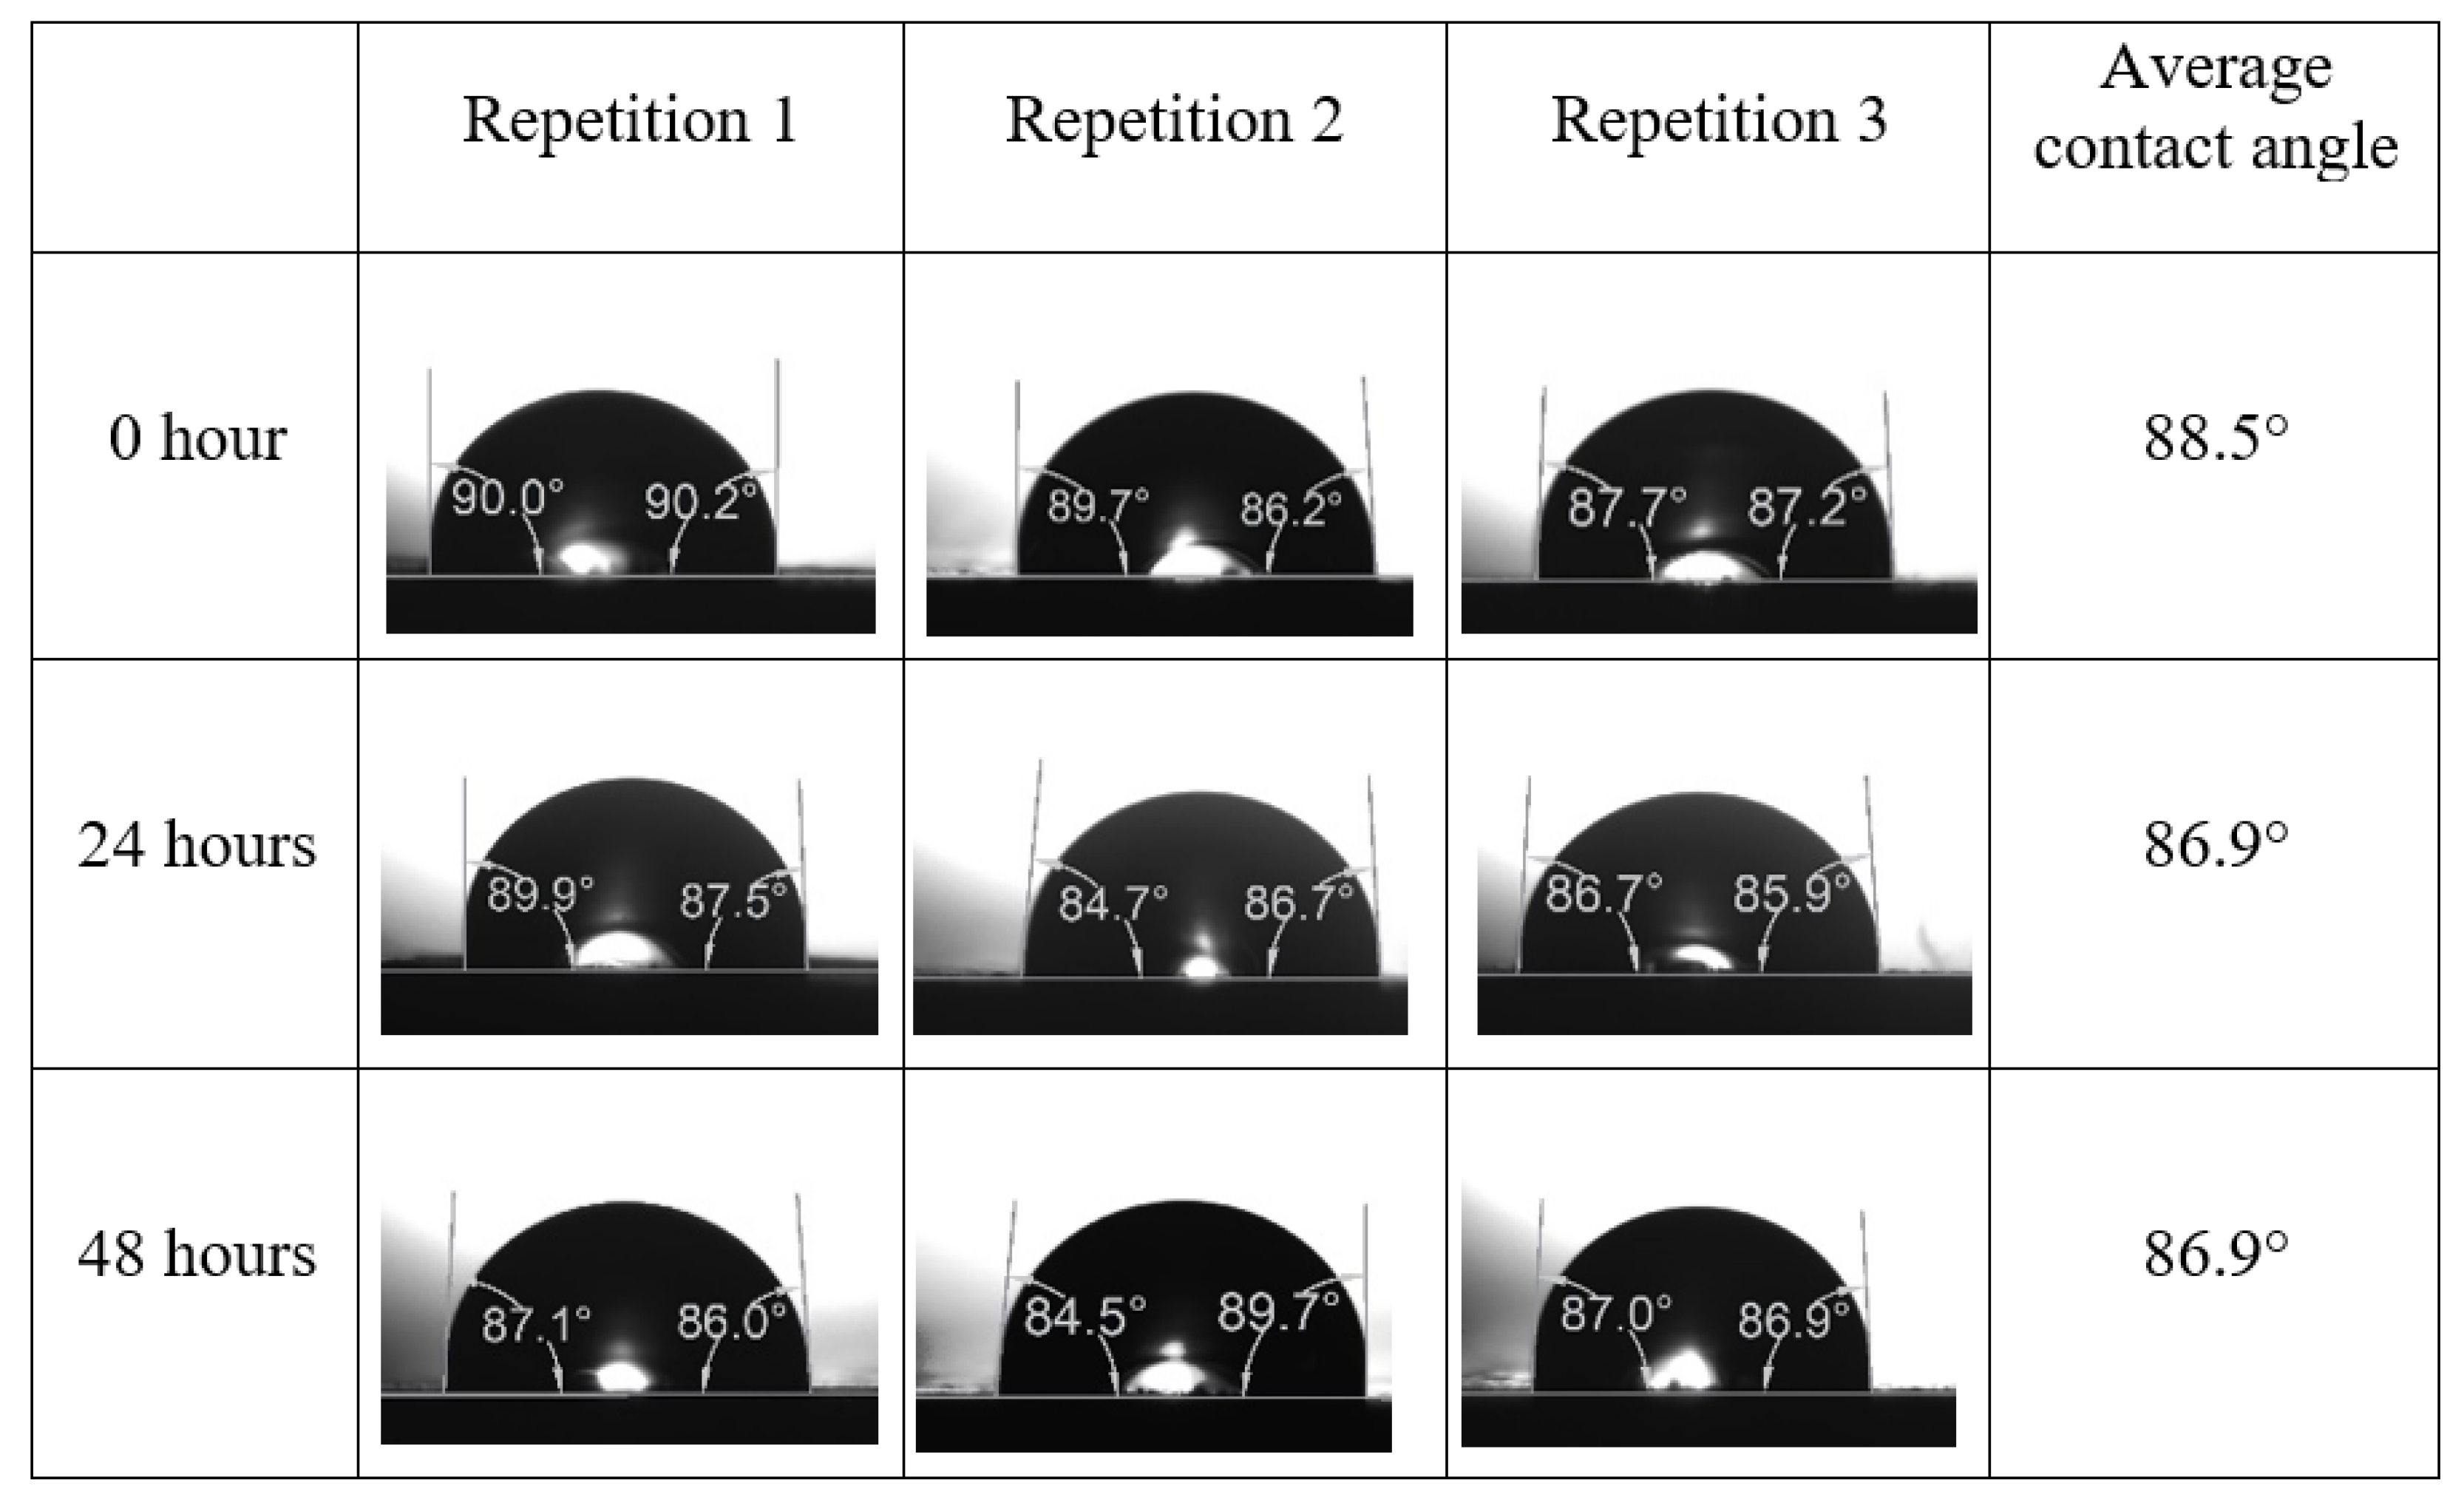
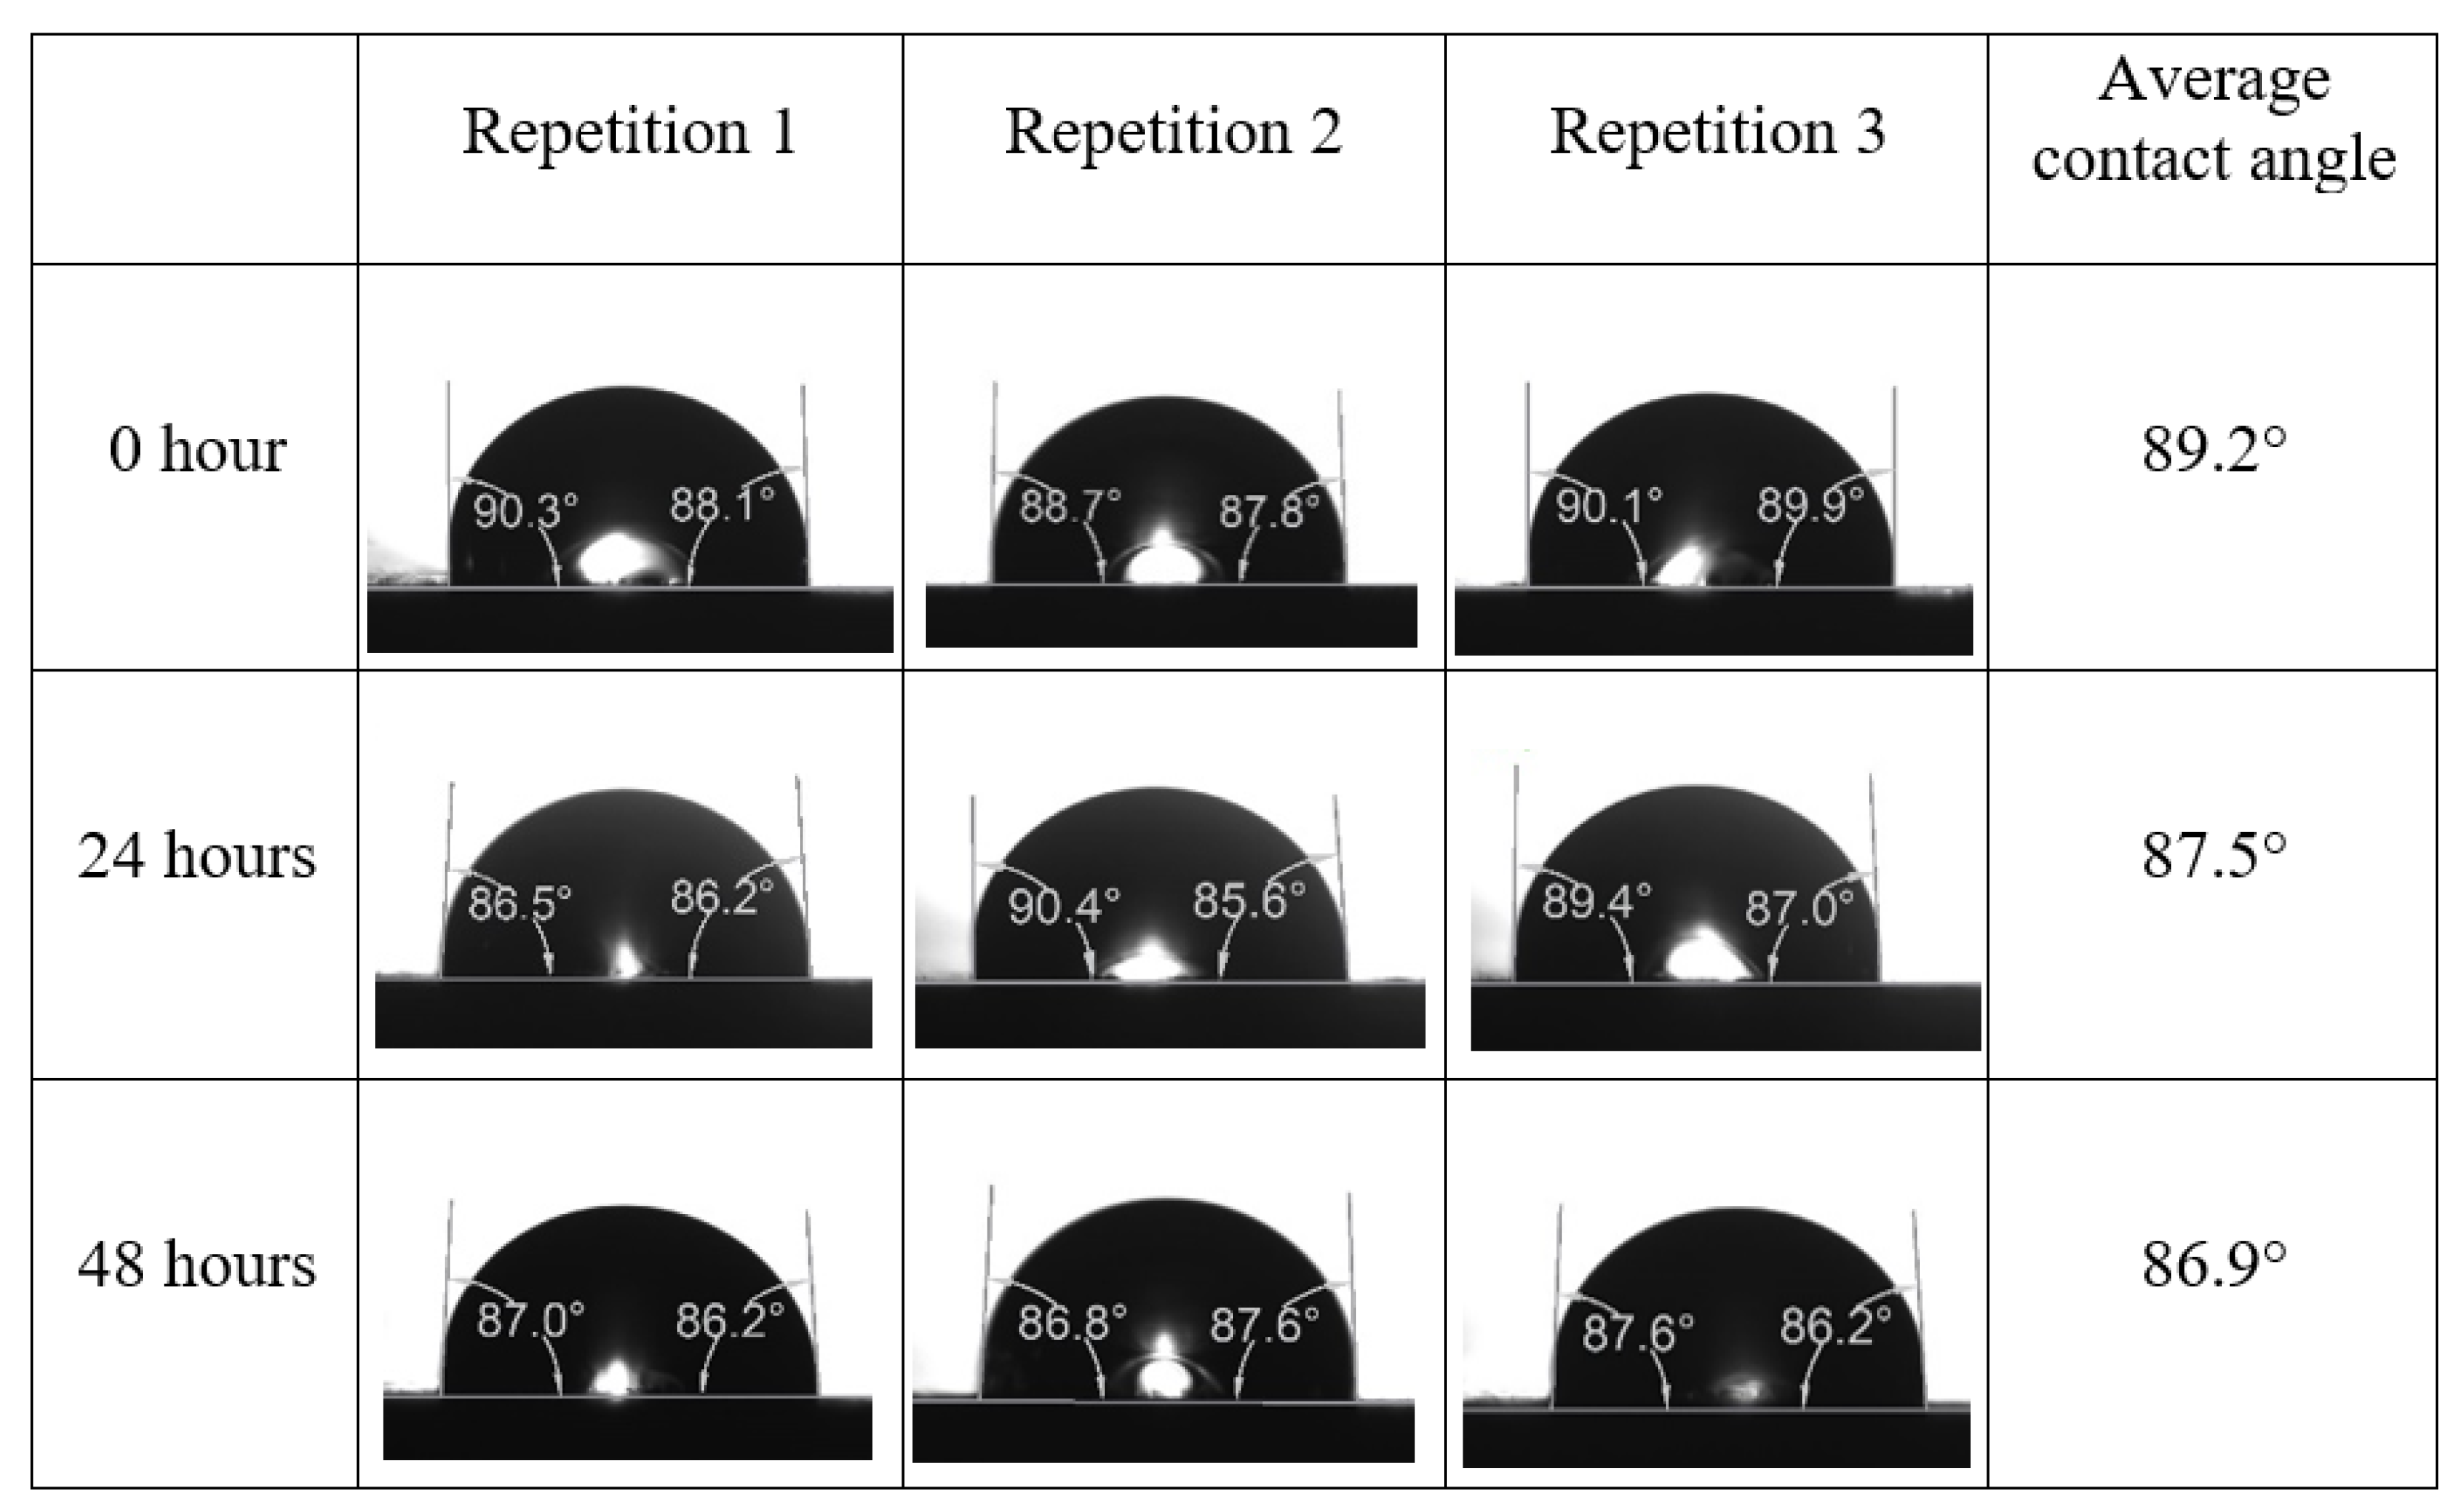
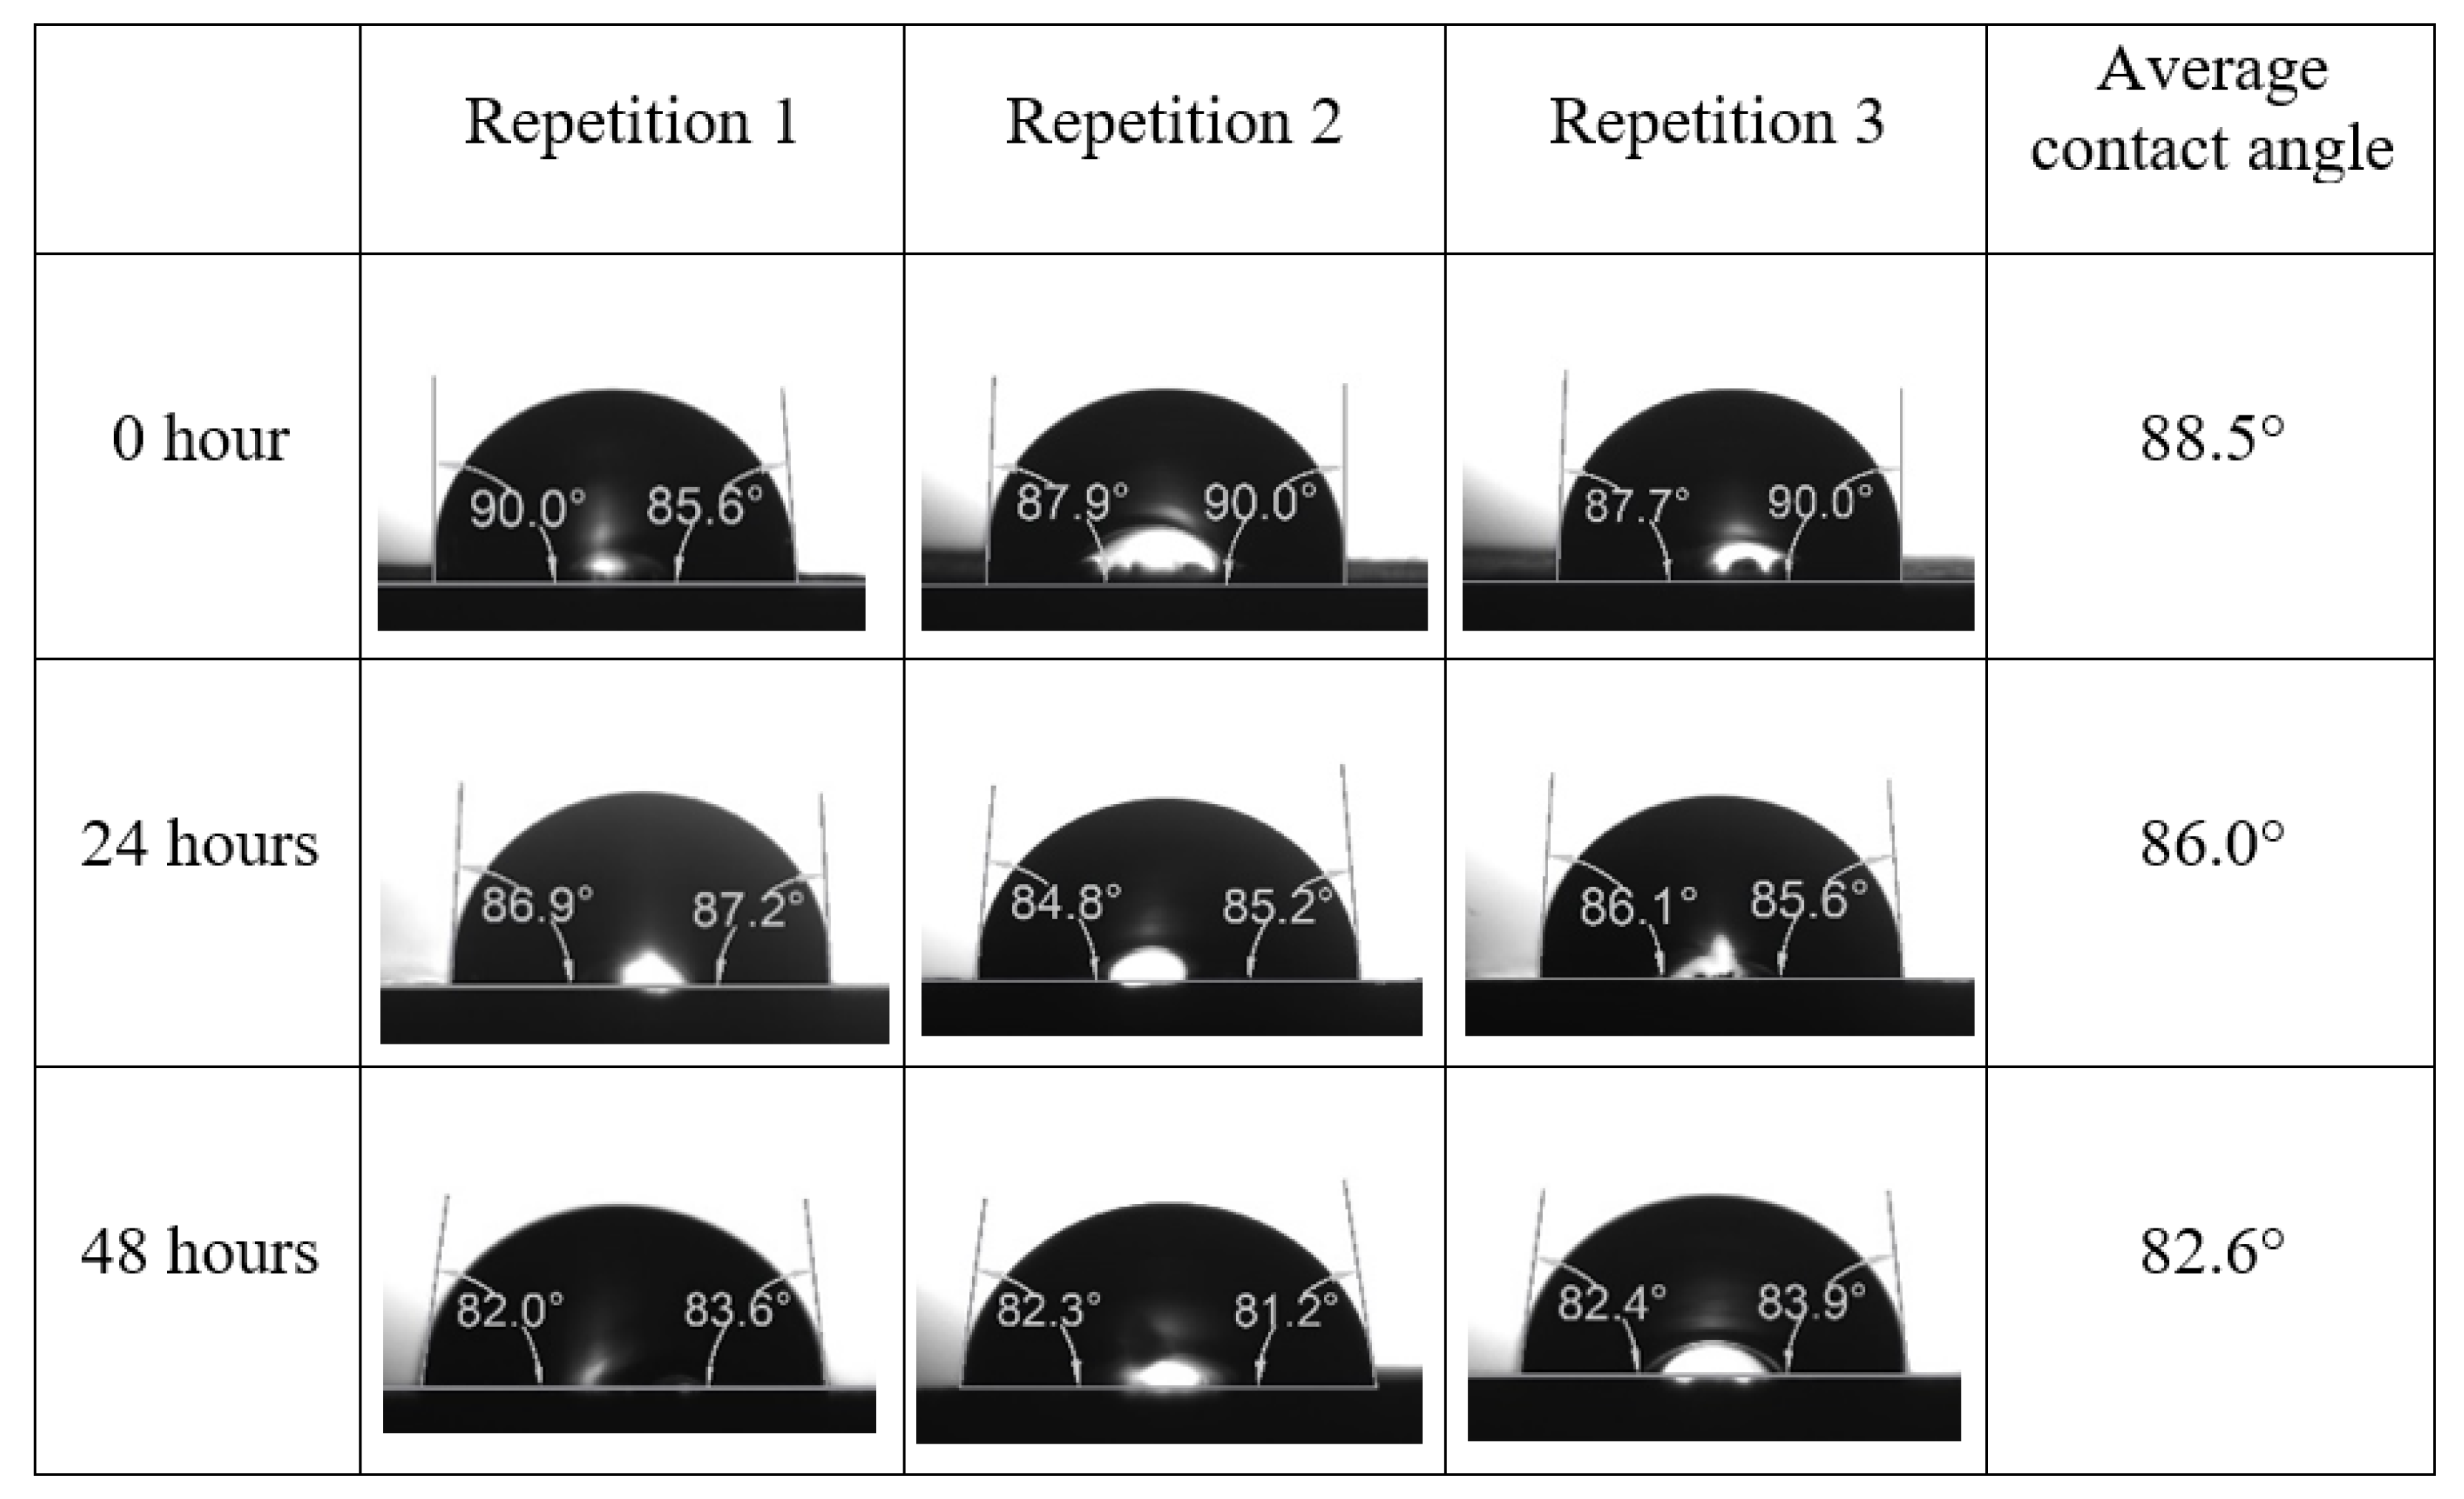
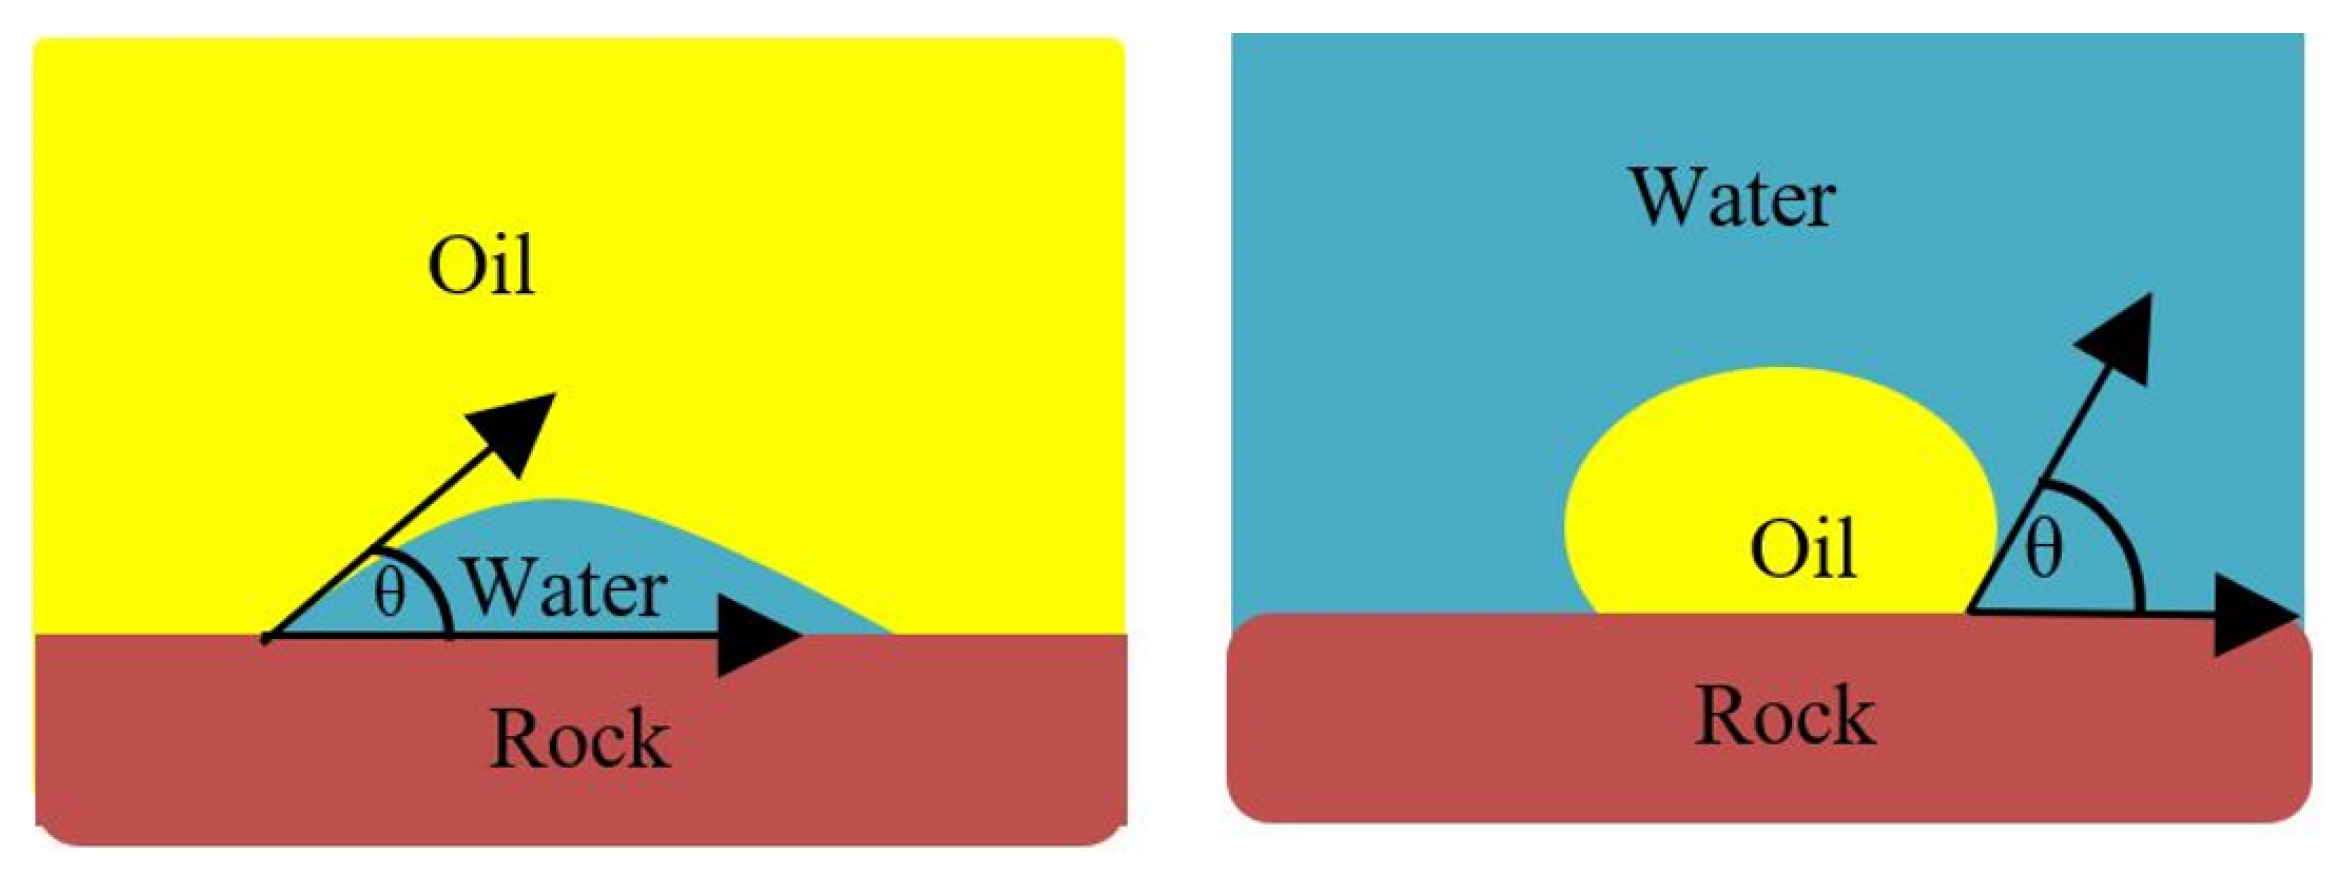
2.2.2. Wettability Measurement
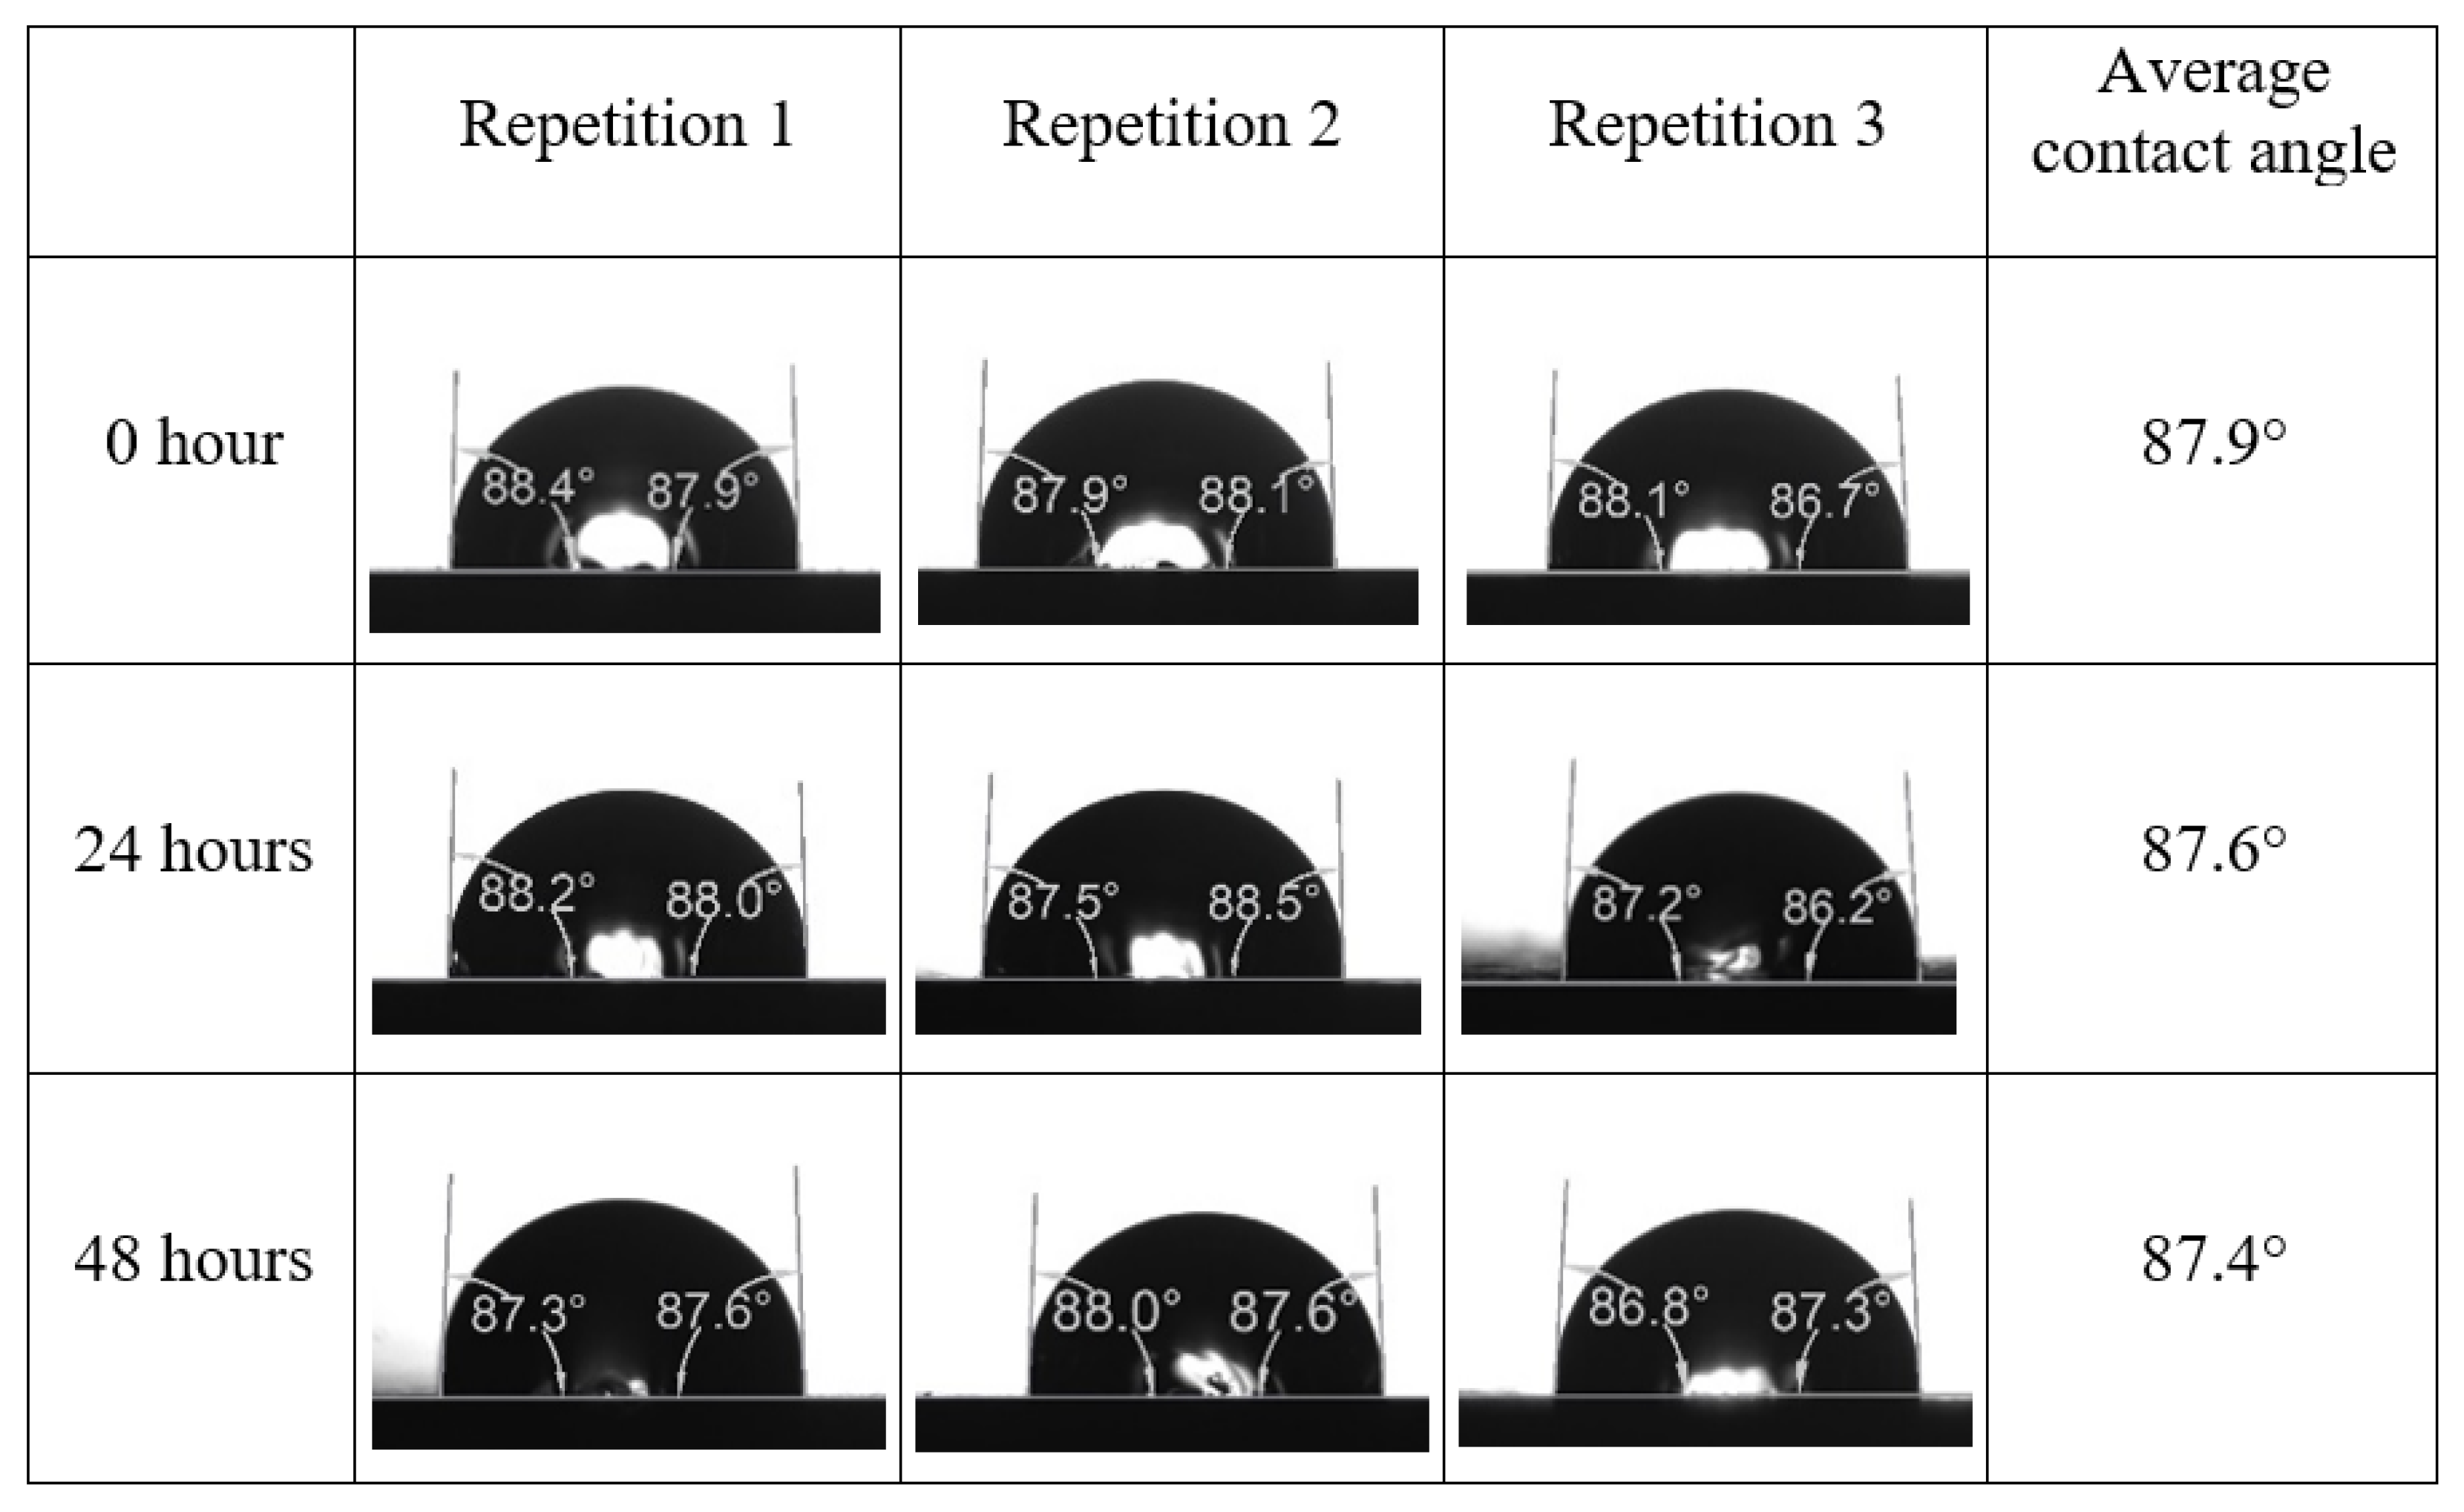
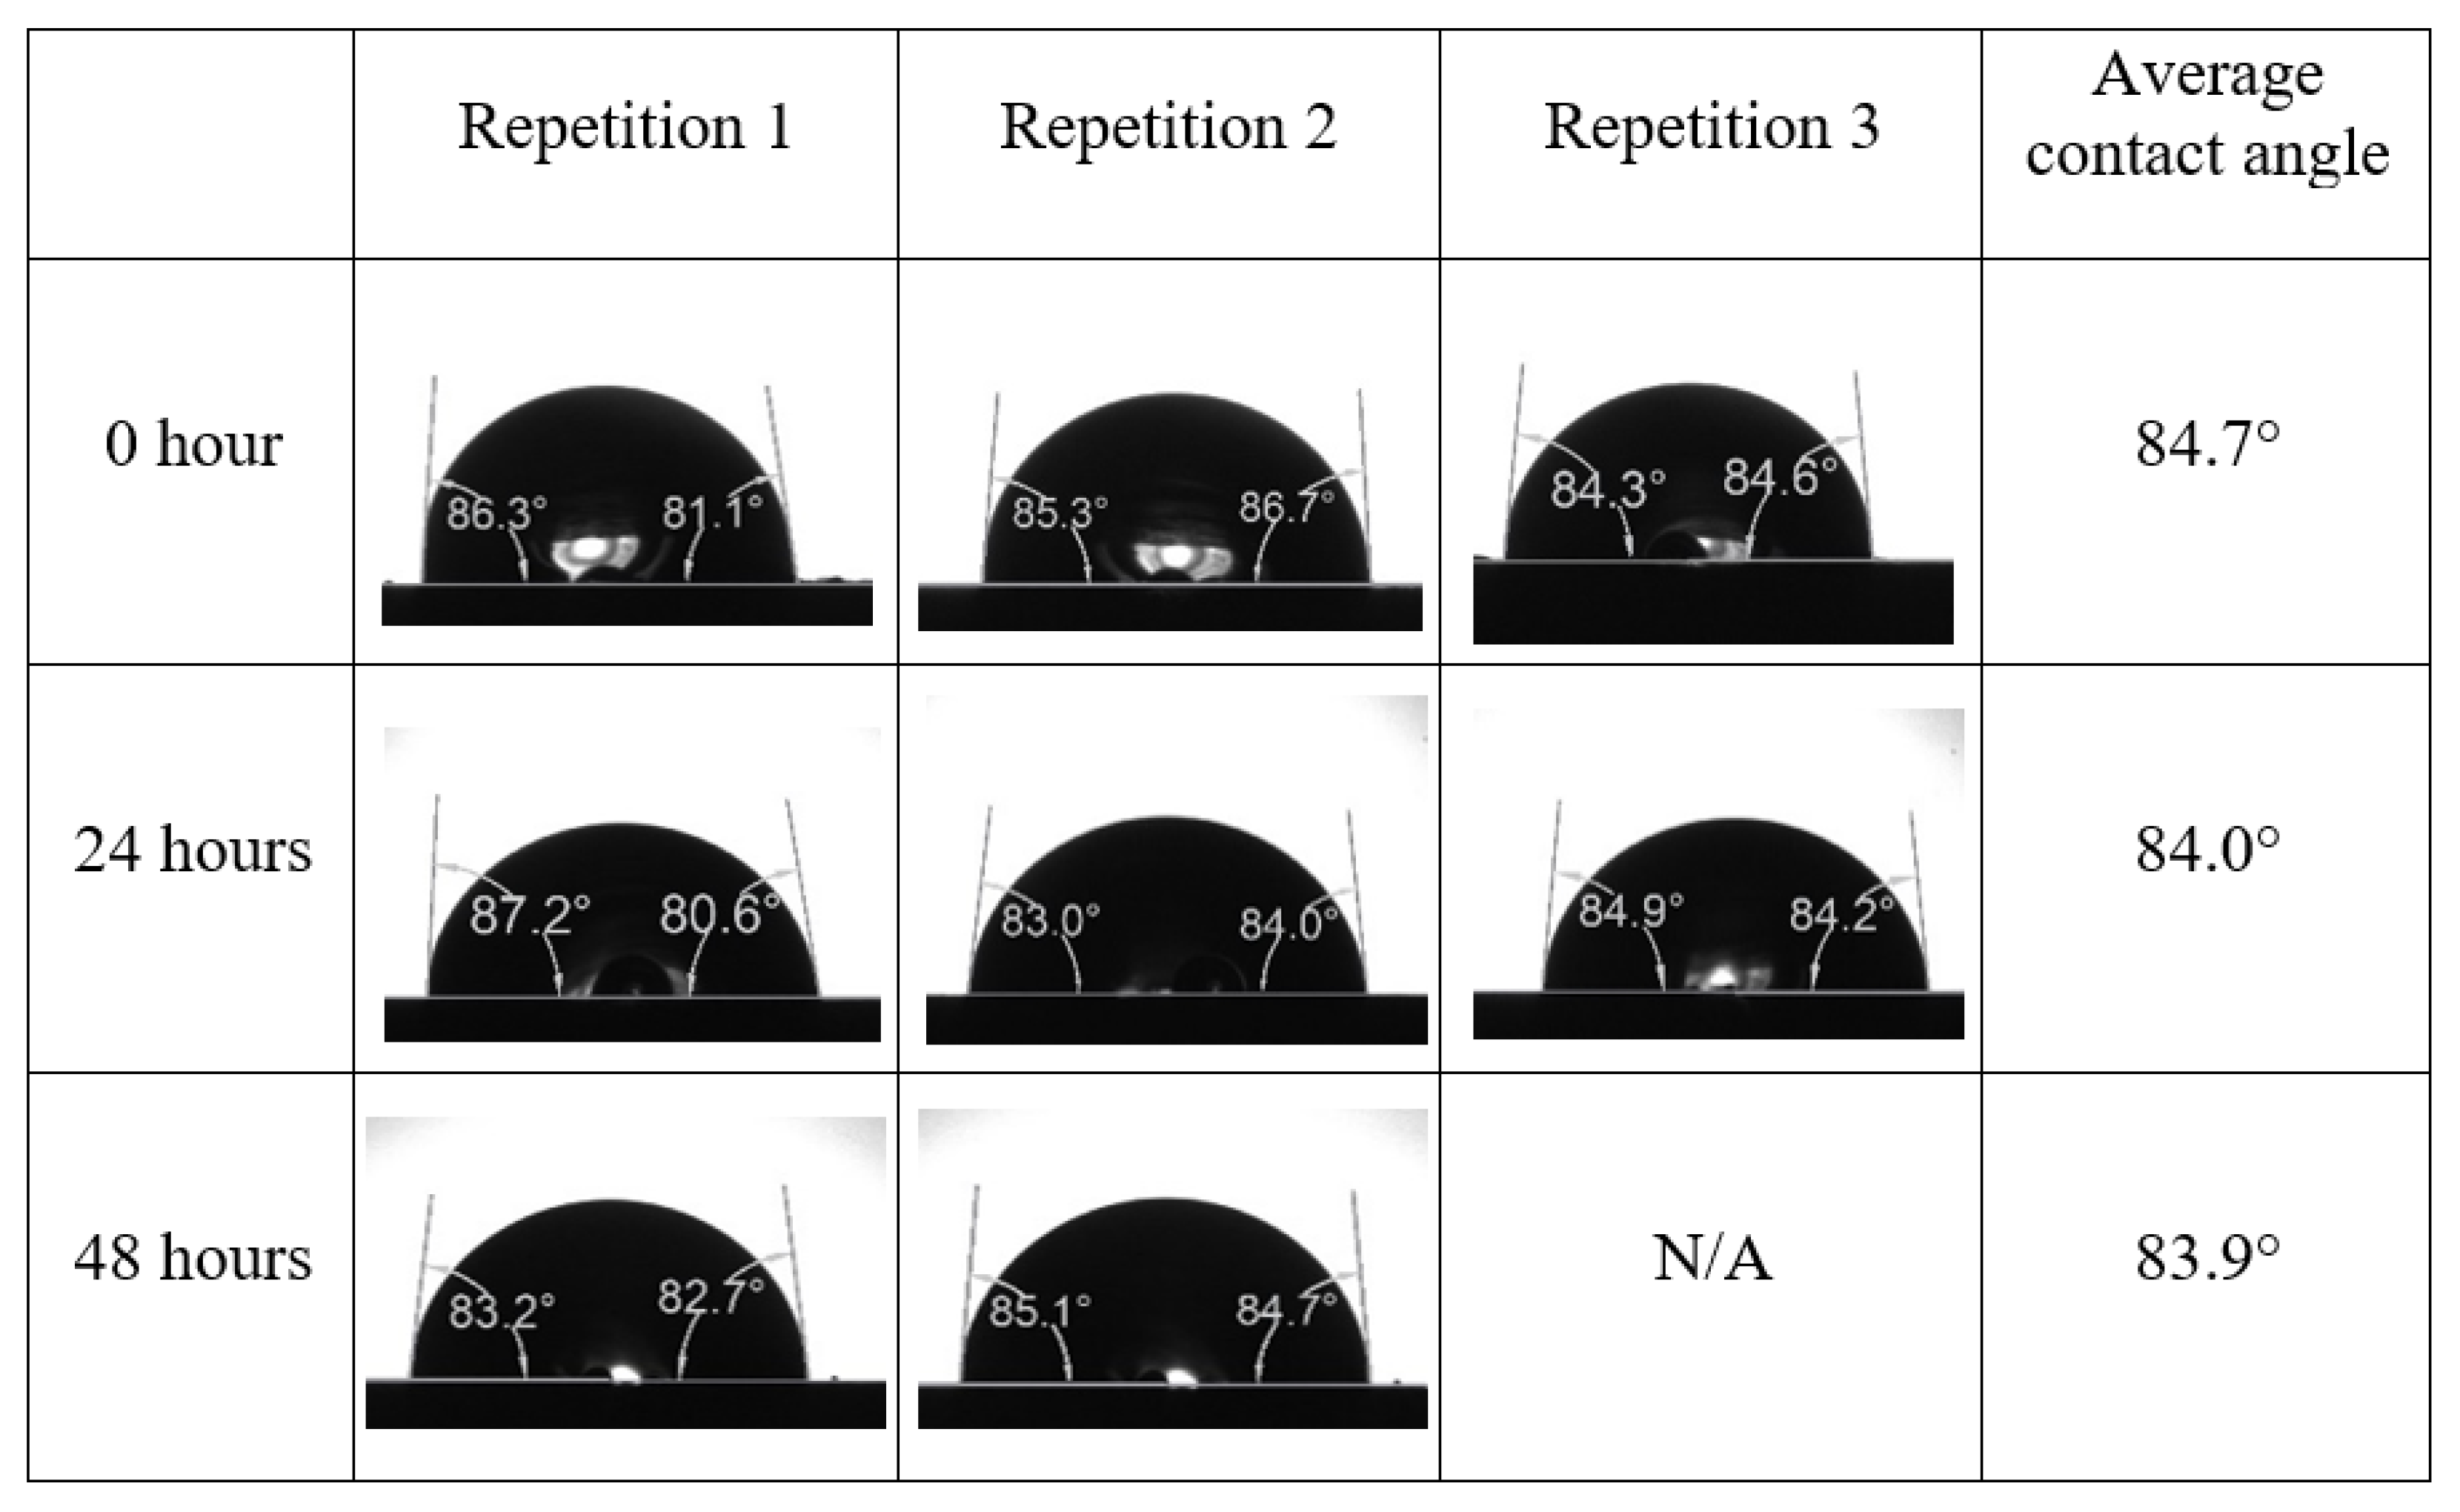
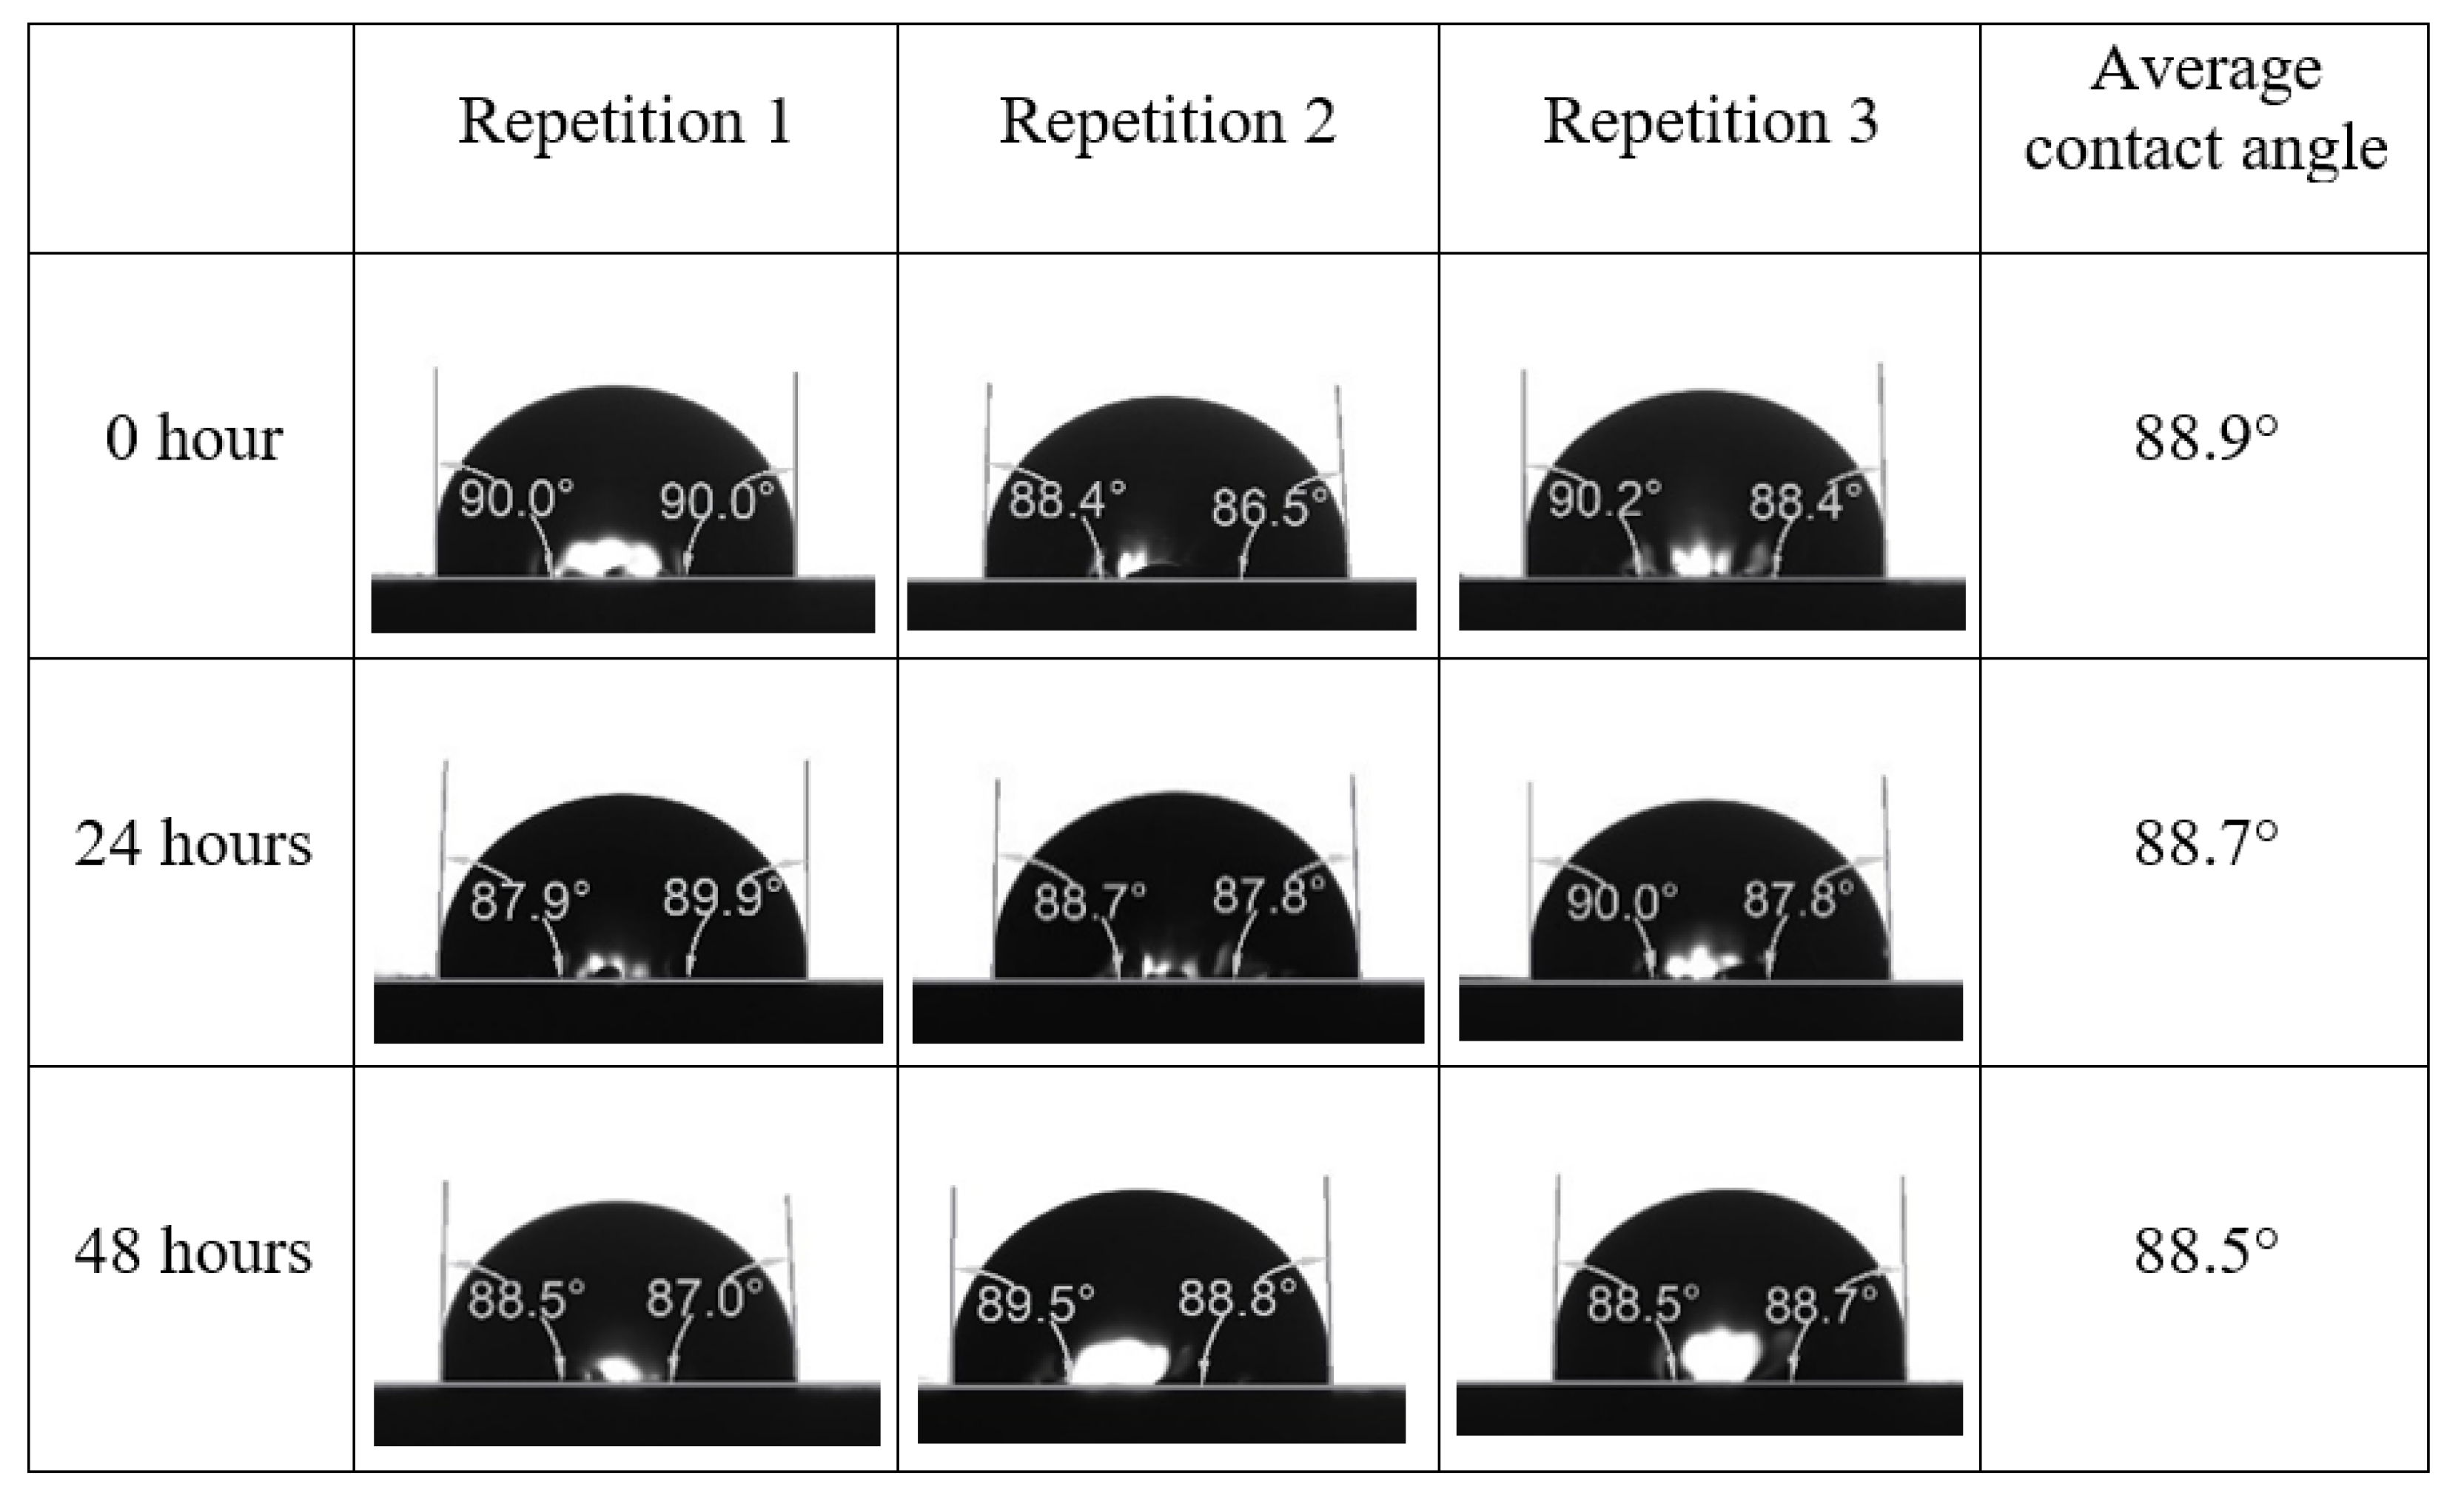
Contact Angle Test (CAT)
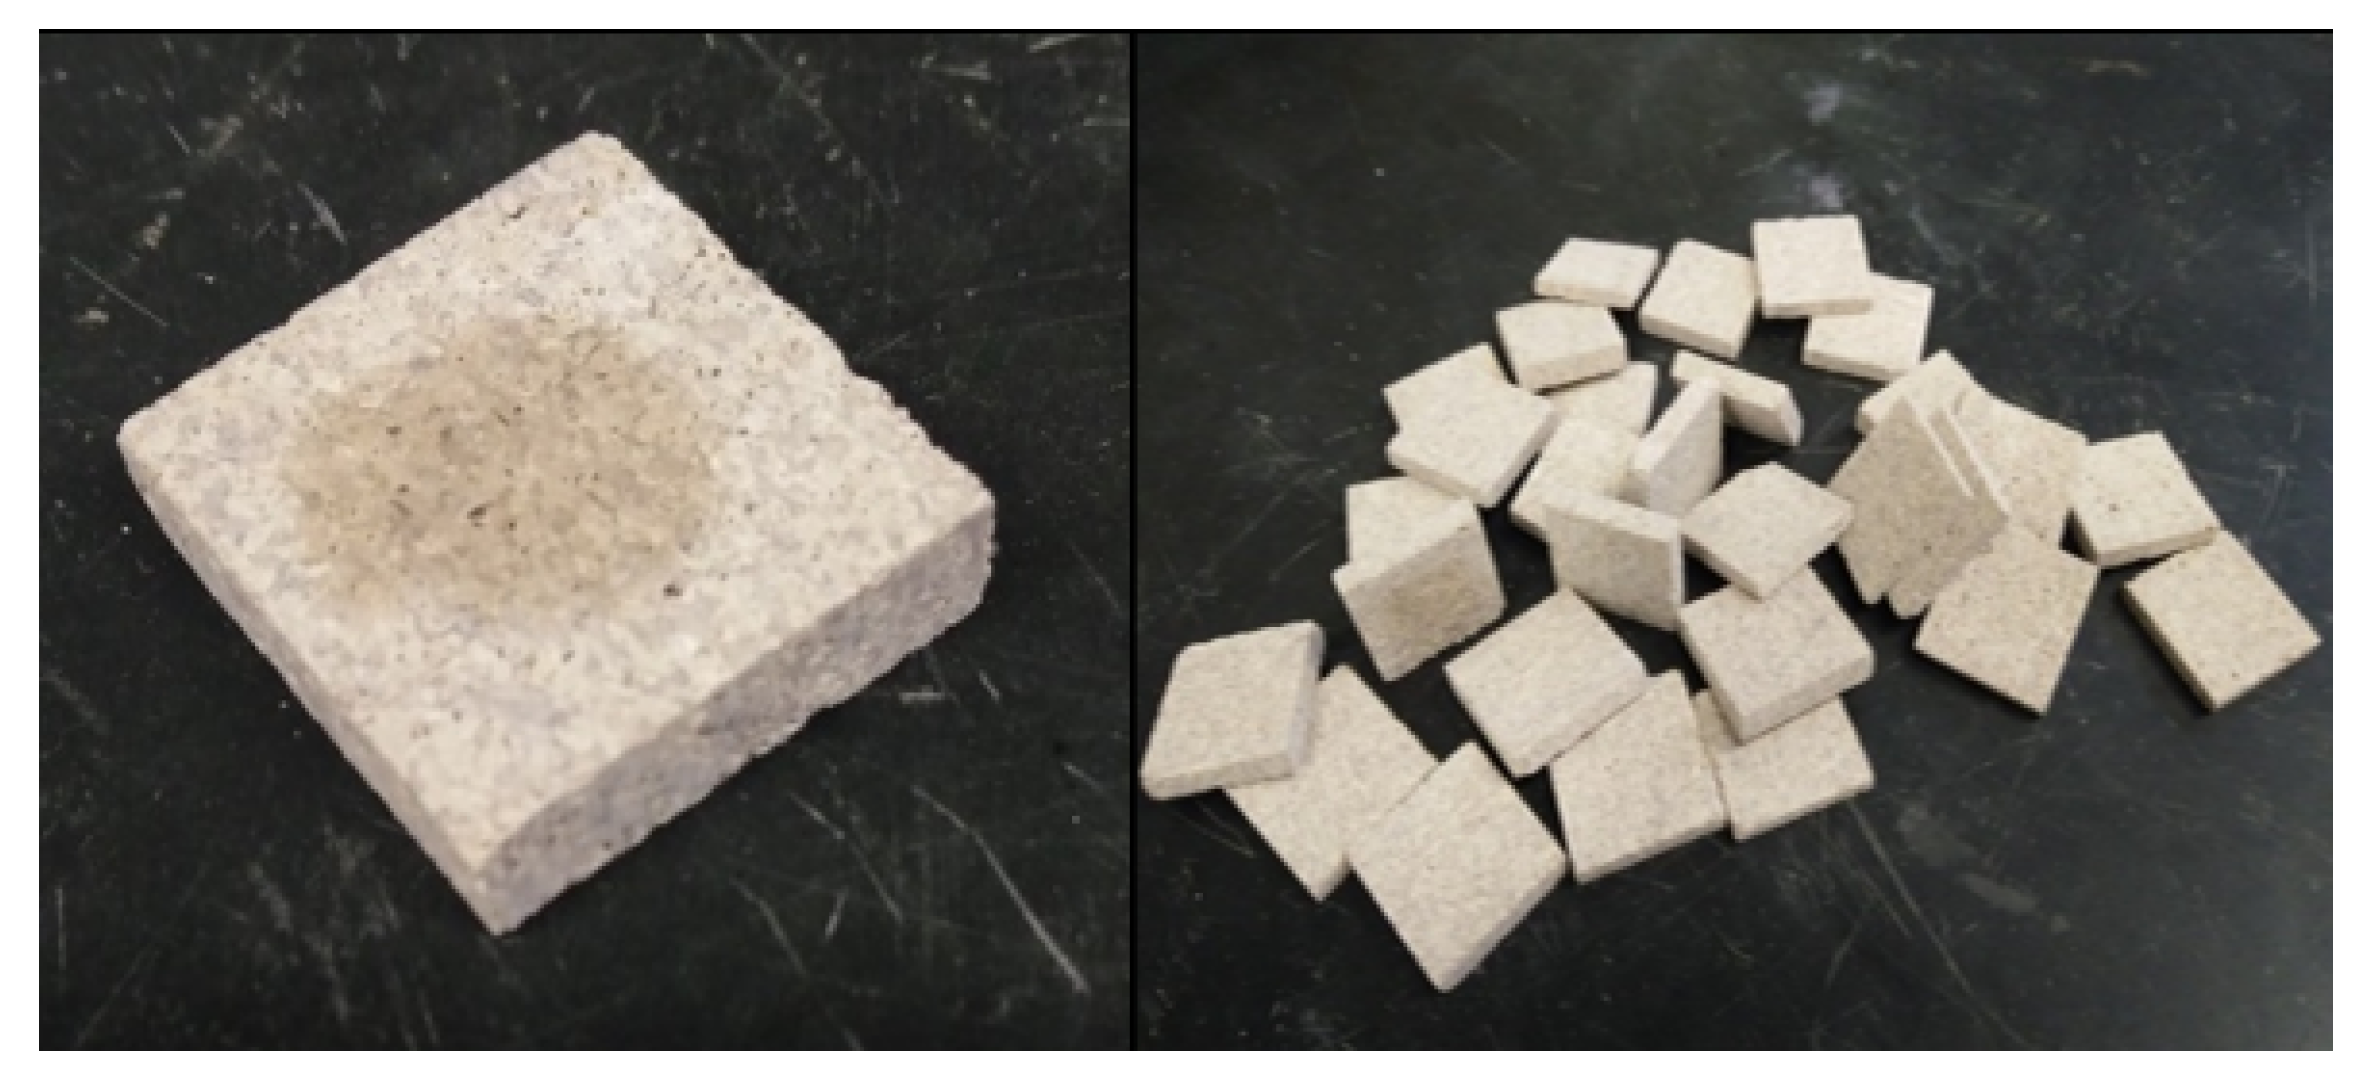
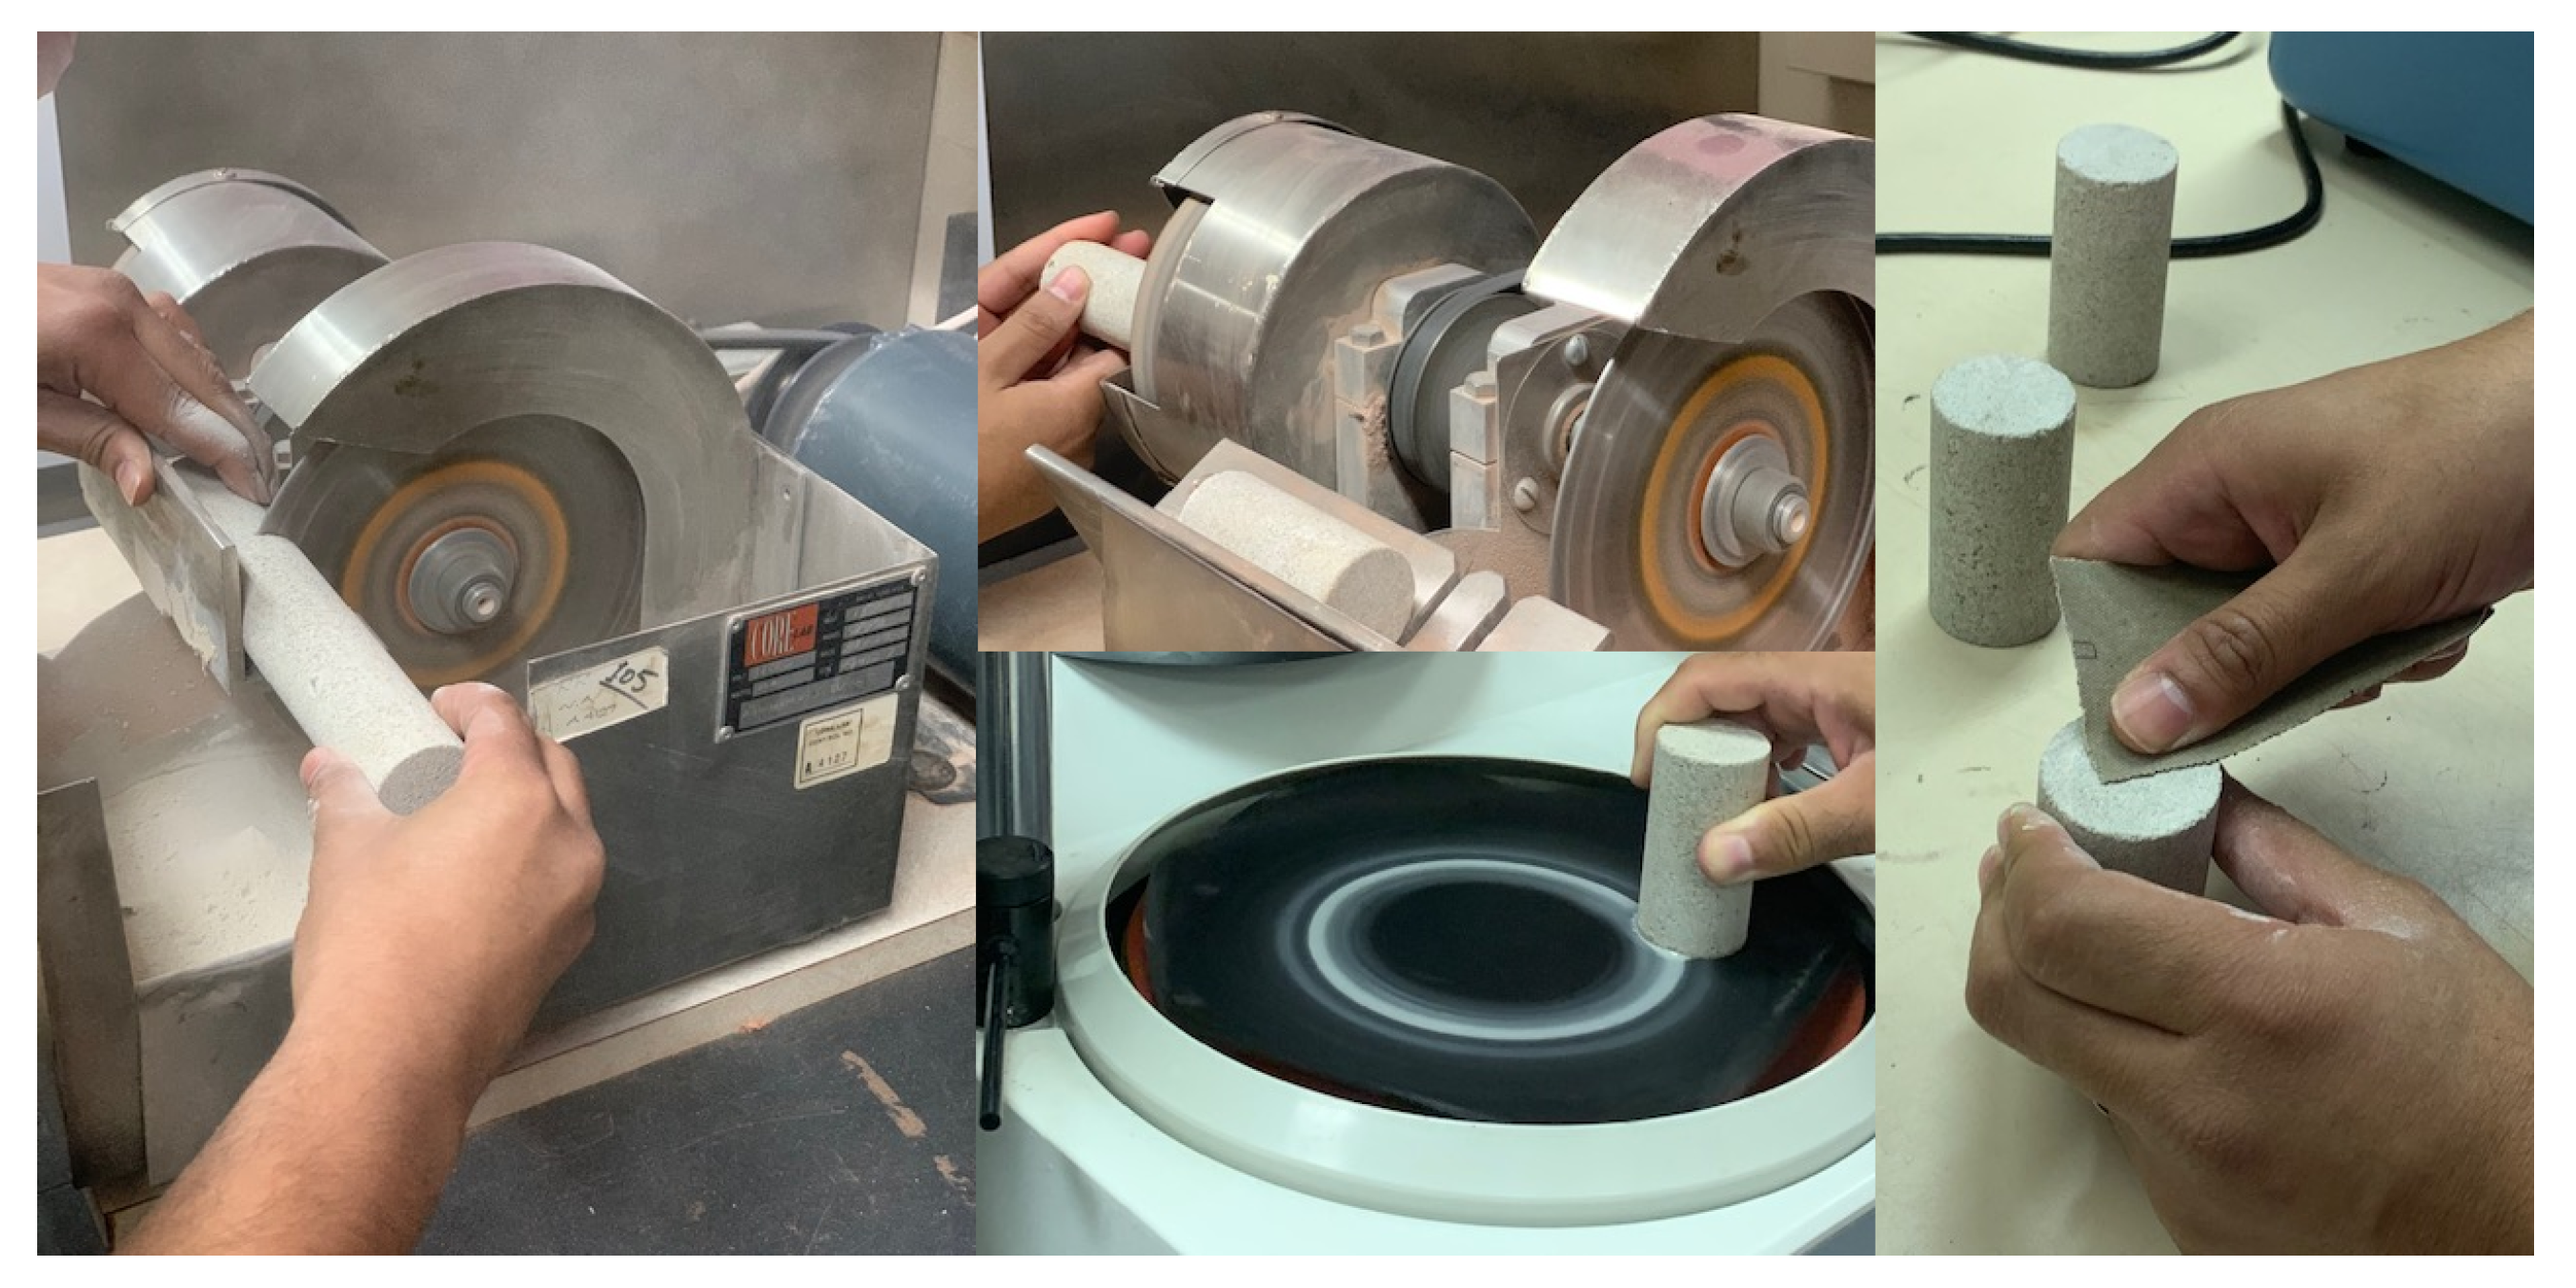
Core Slices Preparation
Contact Angle Test on Treated Core Slices
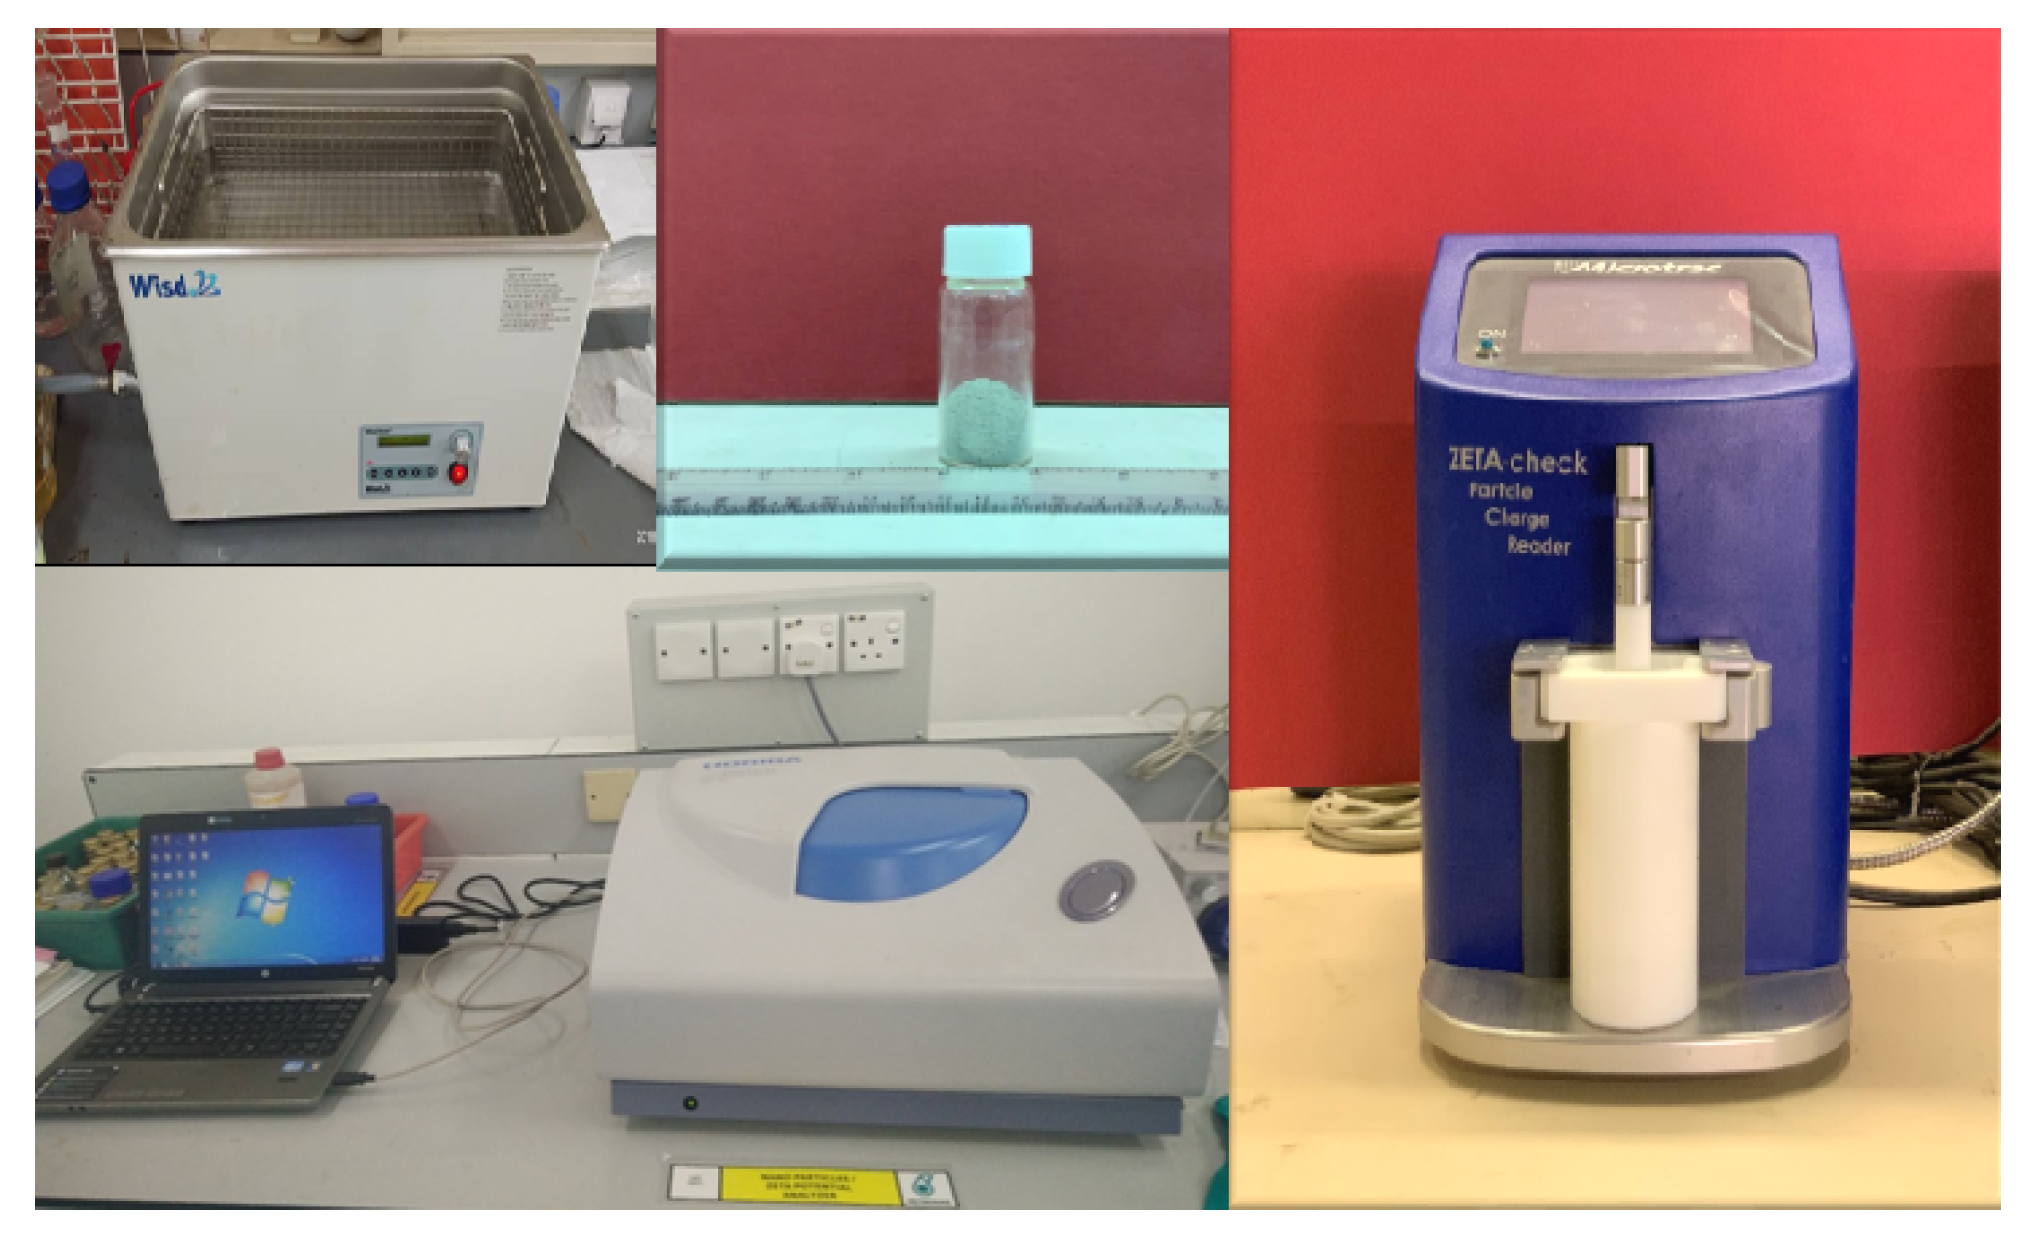
2.2.3. Zeta Potential (ZP) Measurements
Zeta Potential Test (SPT) on Treated Core Sample Powder
2.2.4. Aqueous Stability Test (AST)
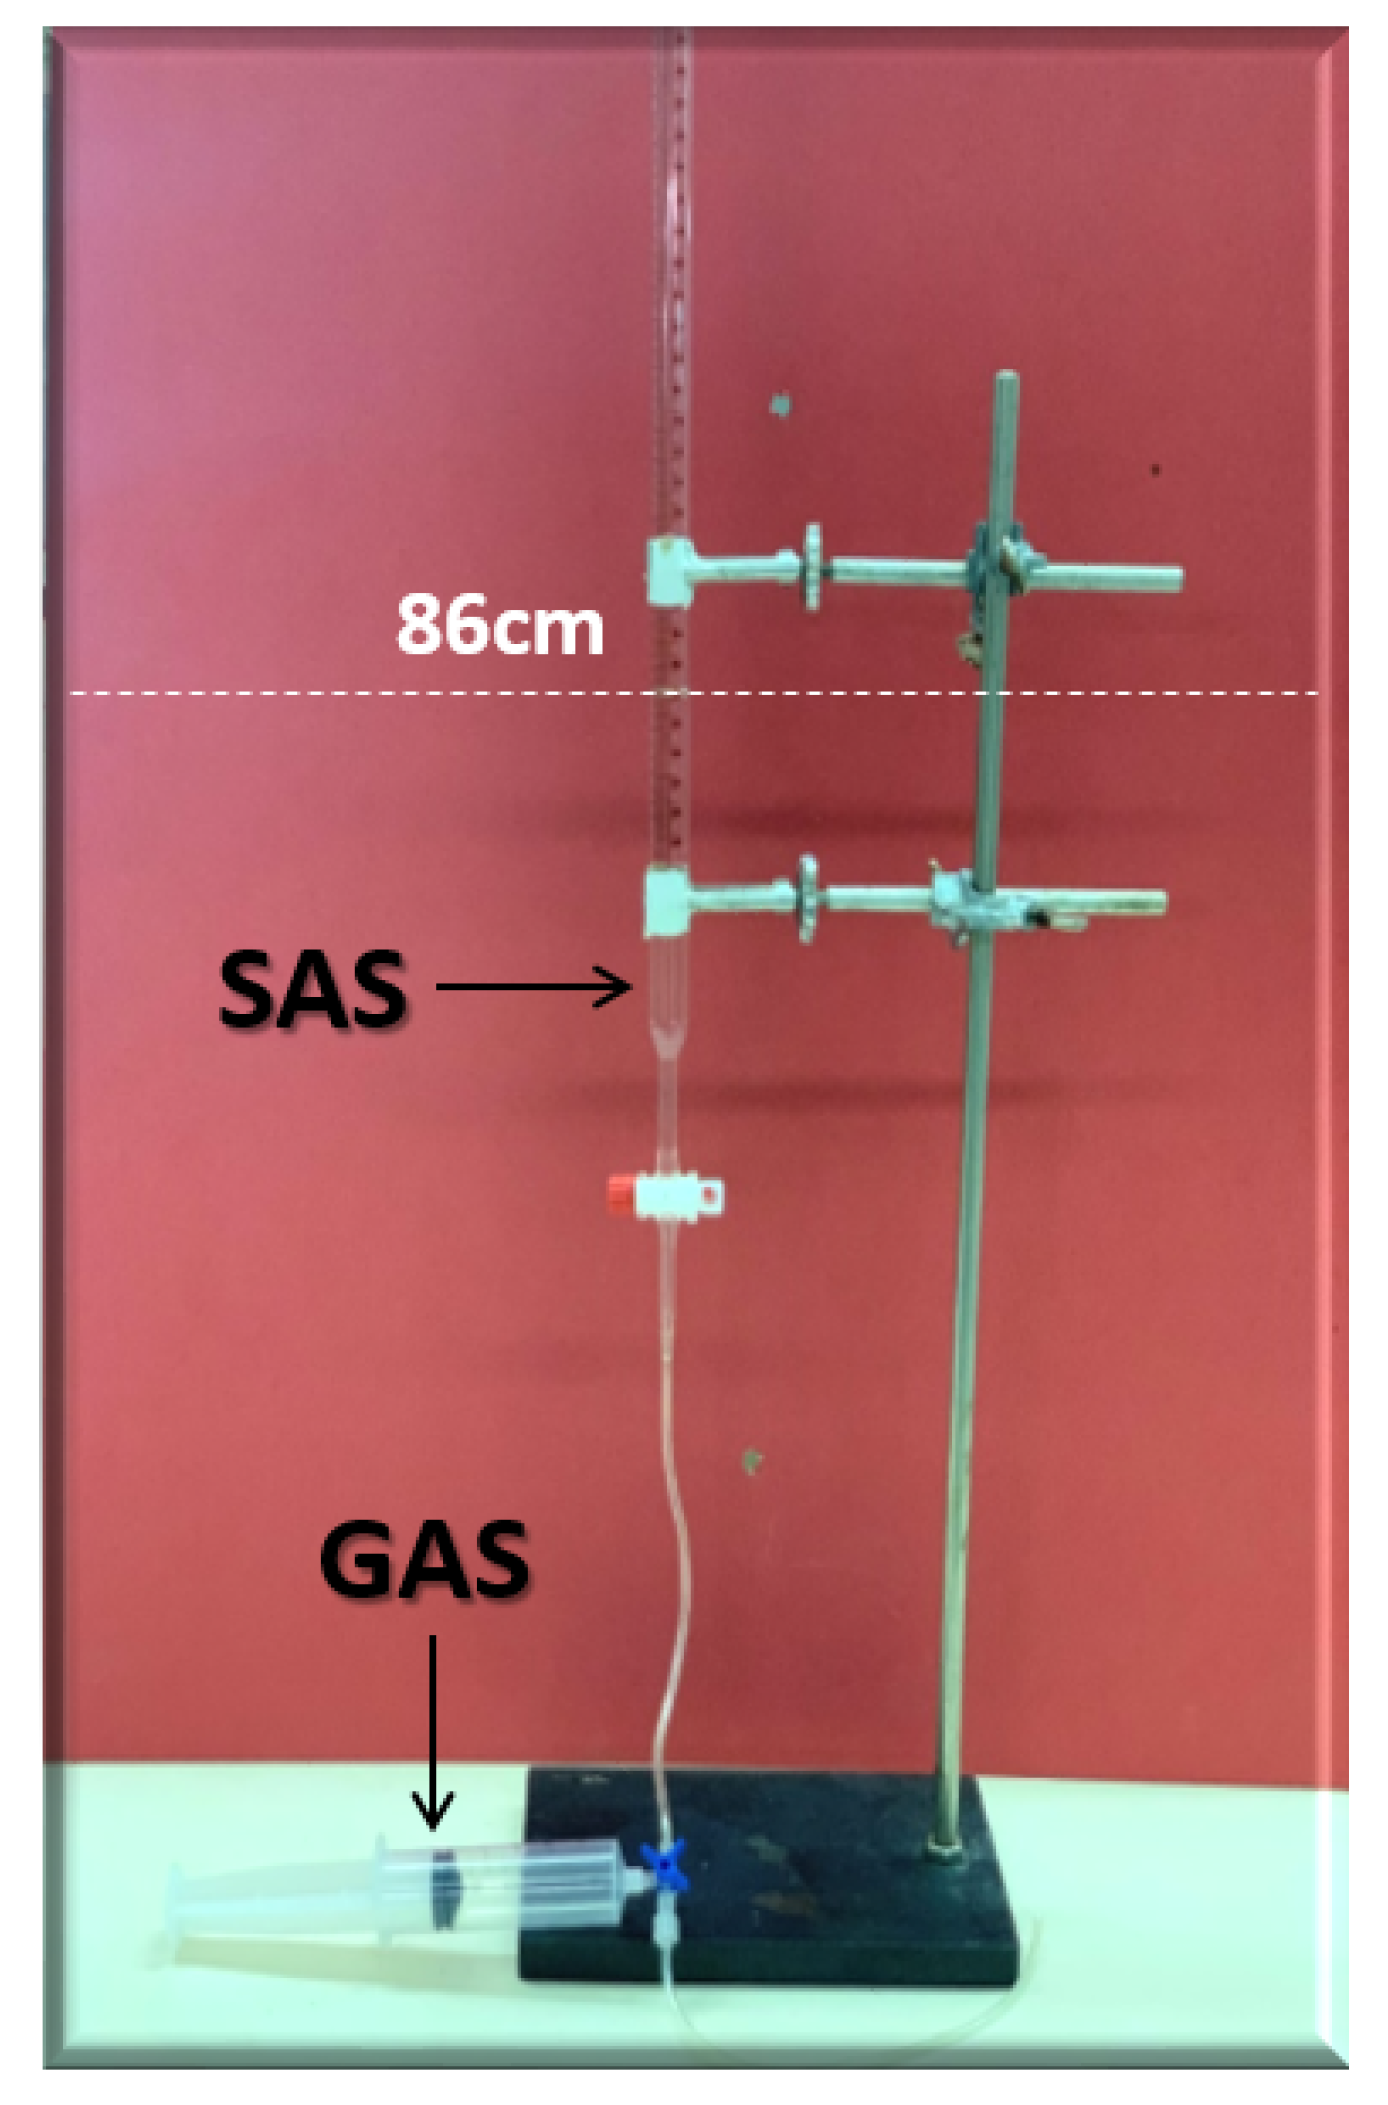
2.2.5. Foamability and Foam Stability Test (FT/FST)
- The test is easy, quick, and convenient, and the measurements are reasonably repeatable.
- During the test, the amount (volume) of gas used to make the foam is precisely regulated.
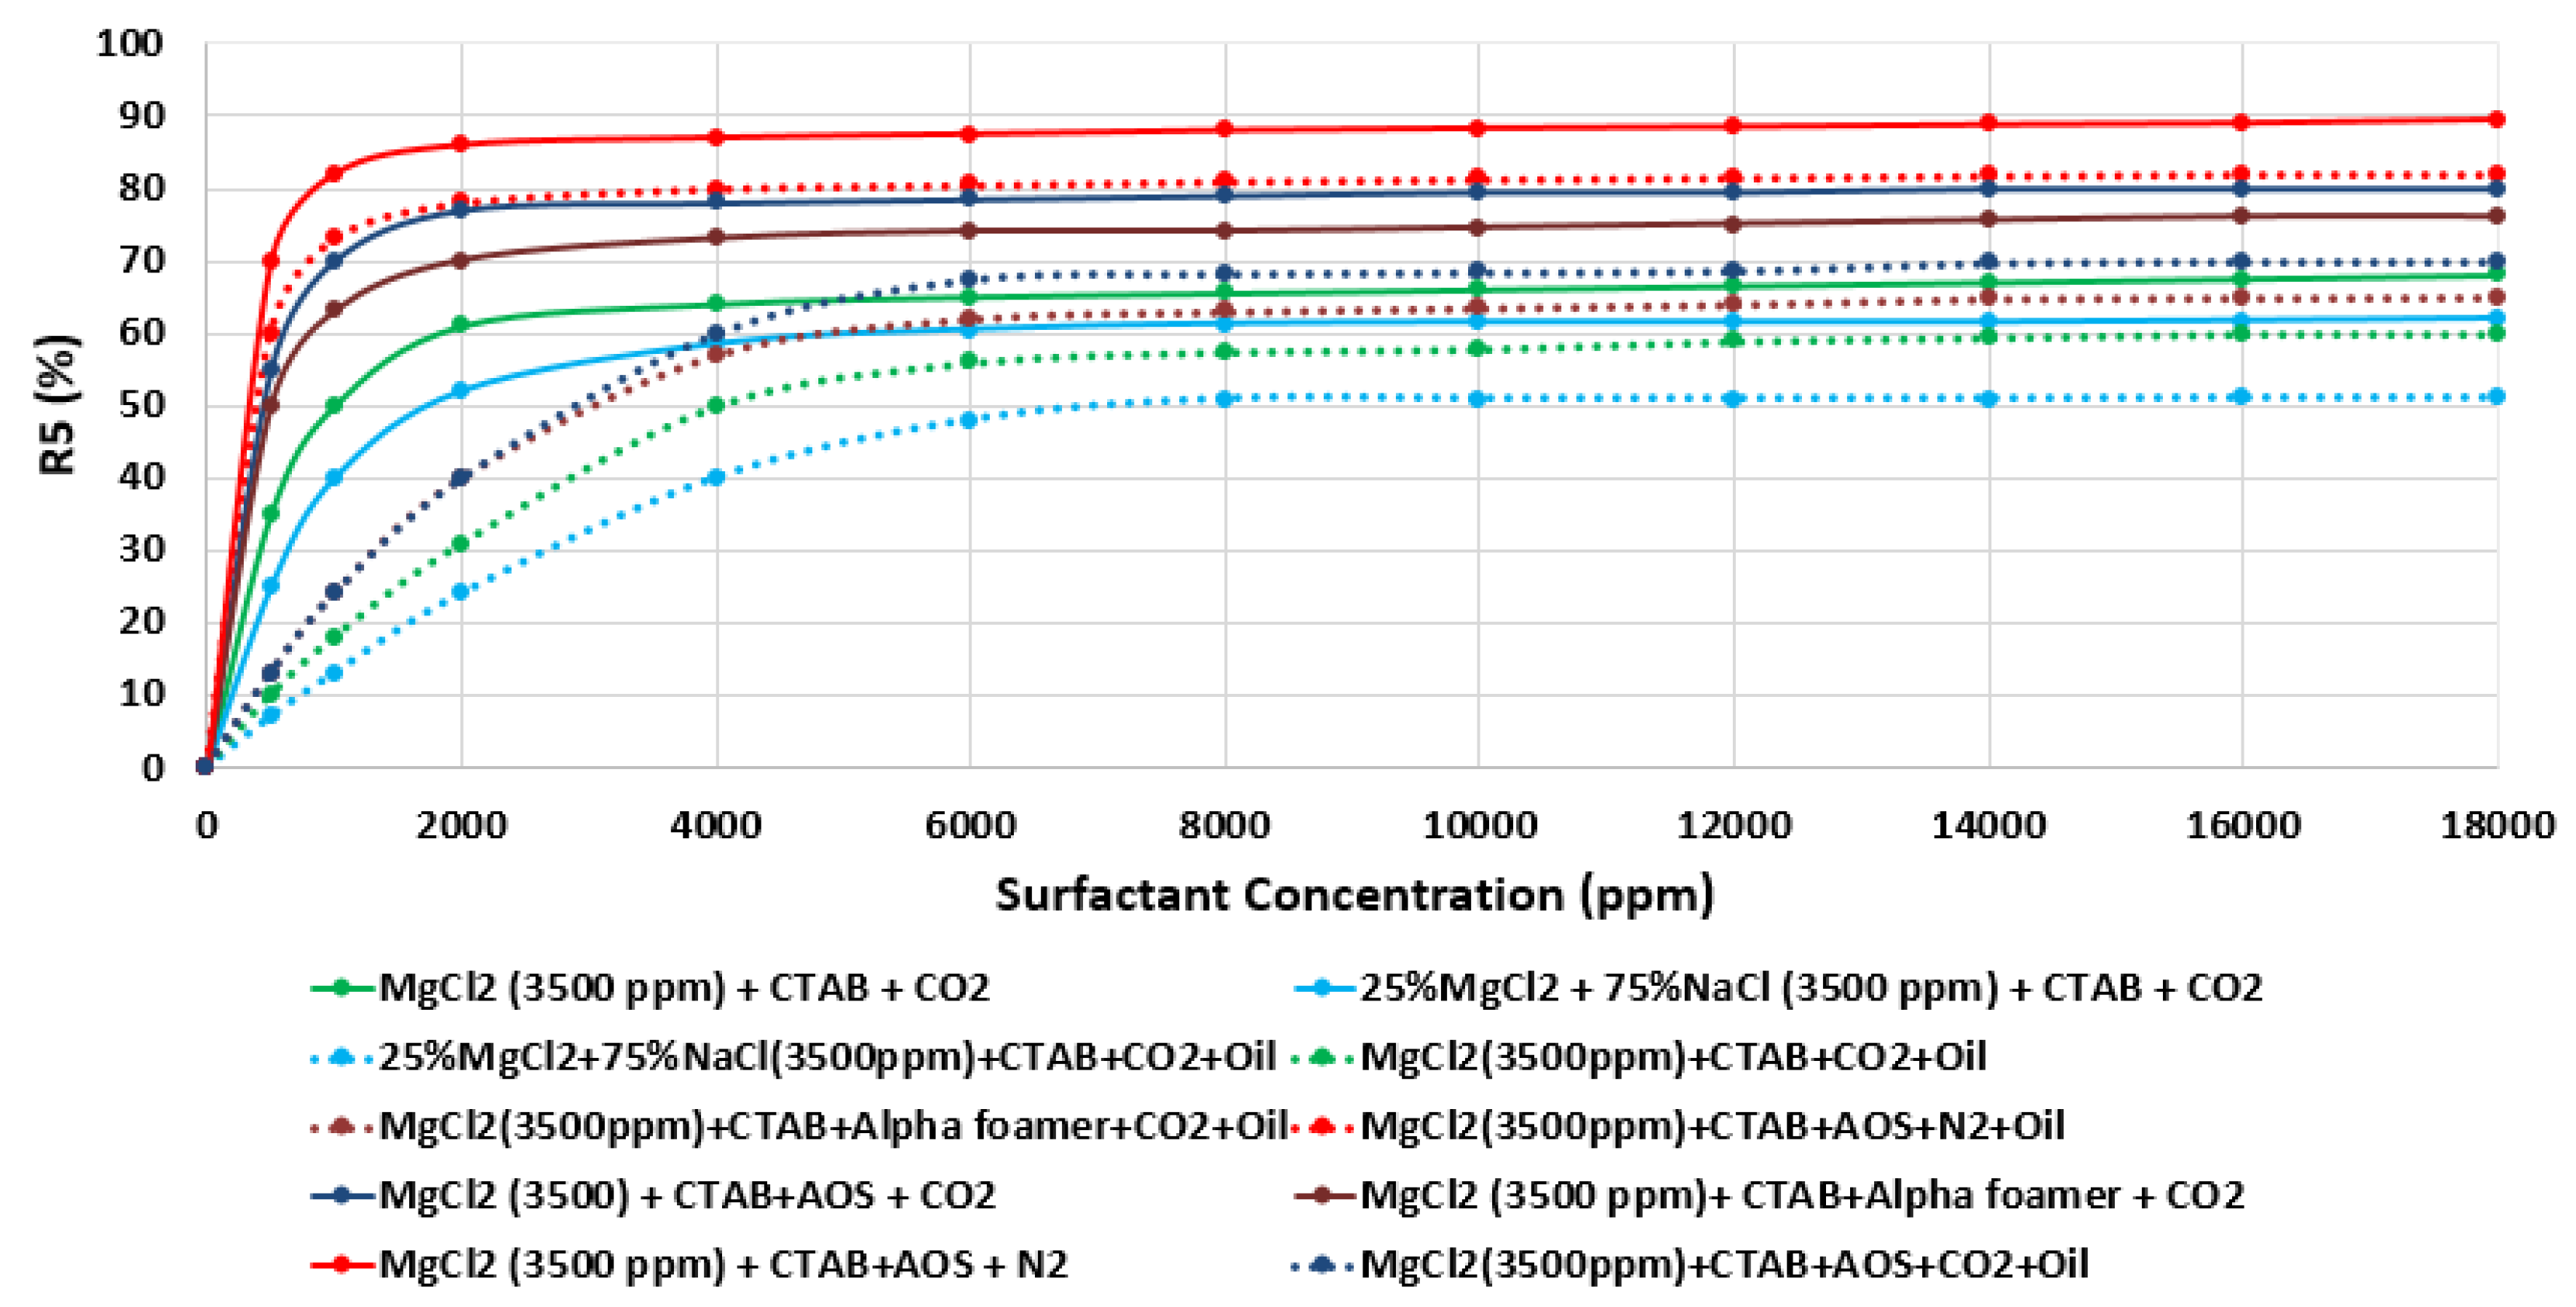
- The R5 parameter can be used to acquire similar details about foam stability akin to the prolonged measurements taken of the foam halftime in the half-life method. Foam stability is indicated by R5 values greater than 50%.
- It is easy to determine the solution content of a foam and use it as an additional parameter to classify foams.
- The method can be applied to all kinds of foams, including transient (“wet foams”) and metastable (“dry foams”), allowing for a reasonable comparison of different types of foams.
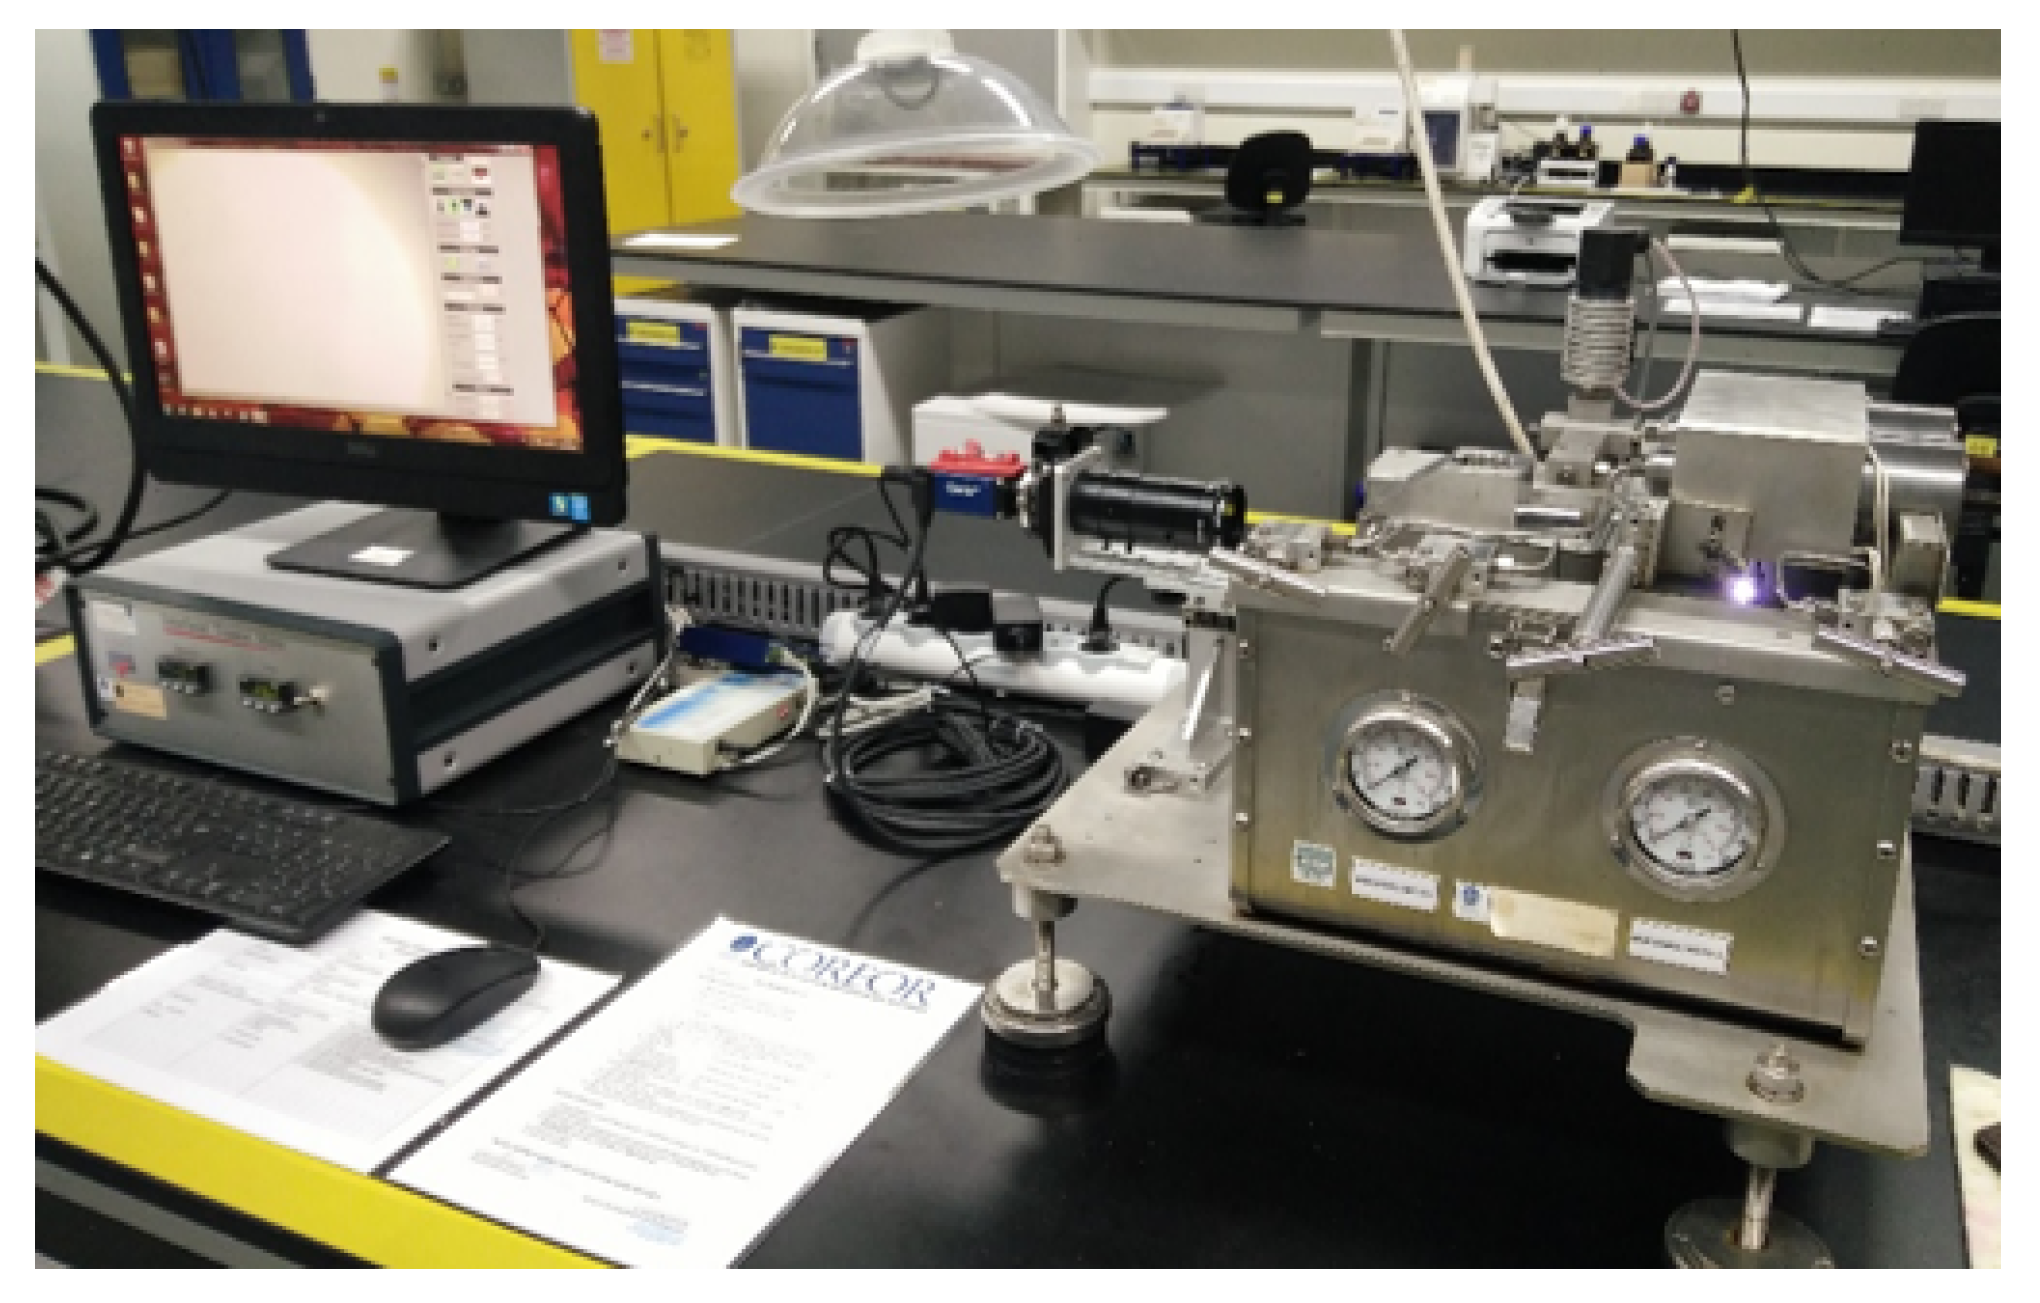
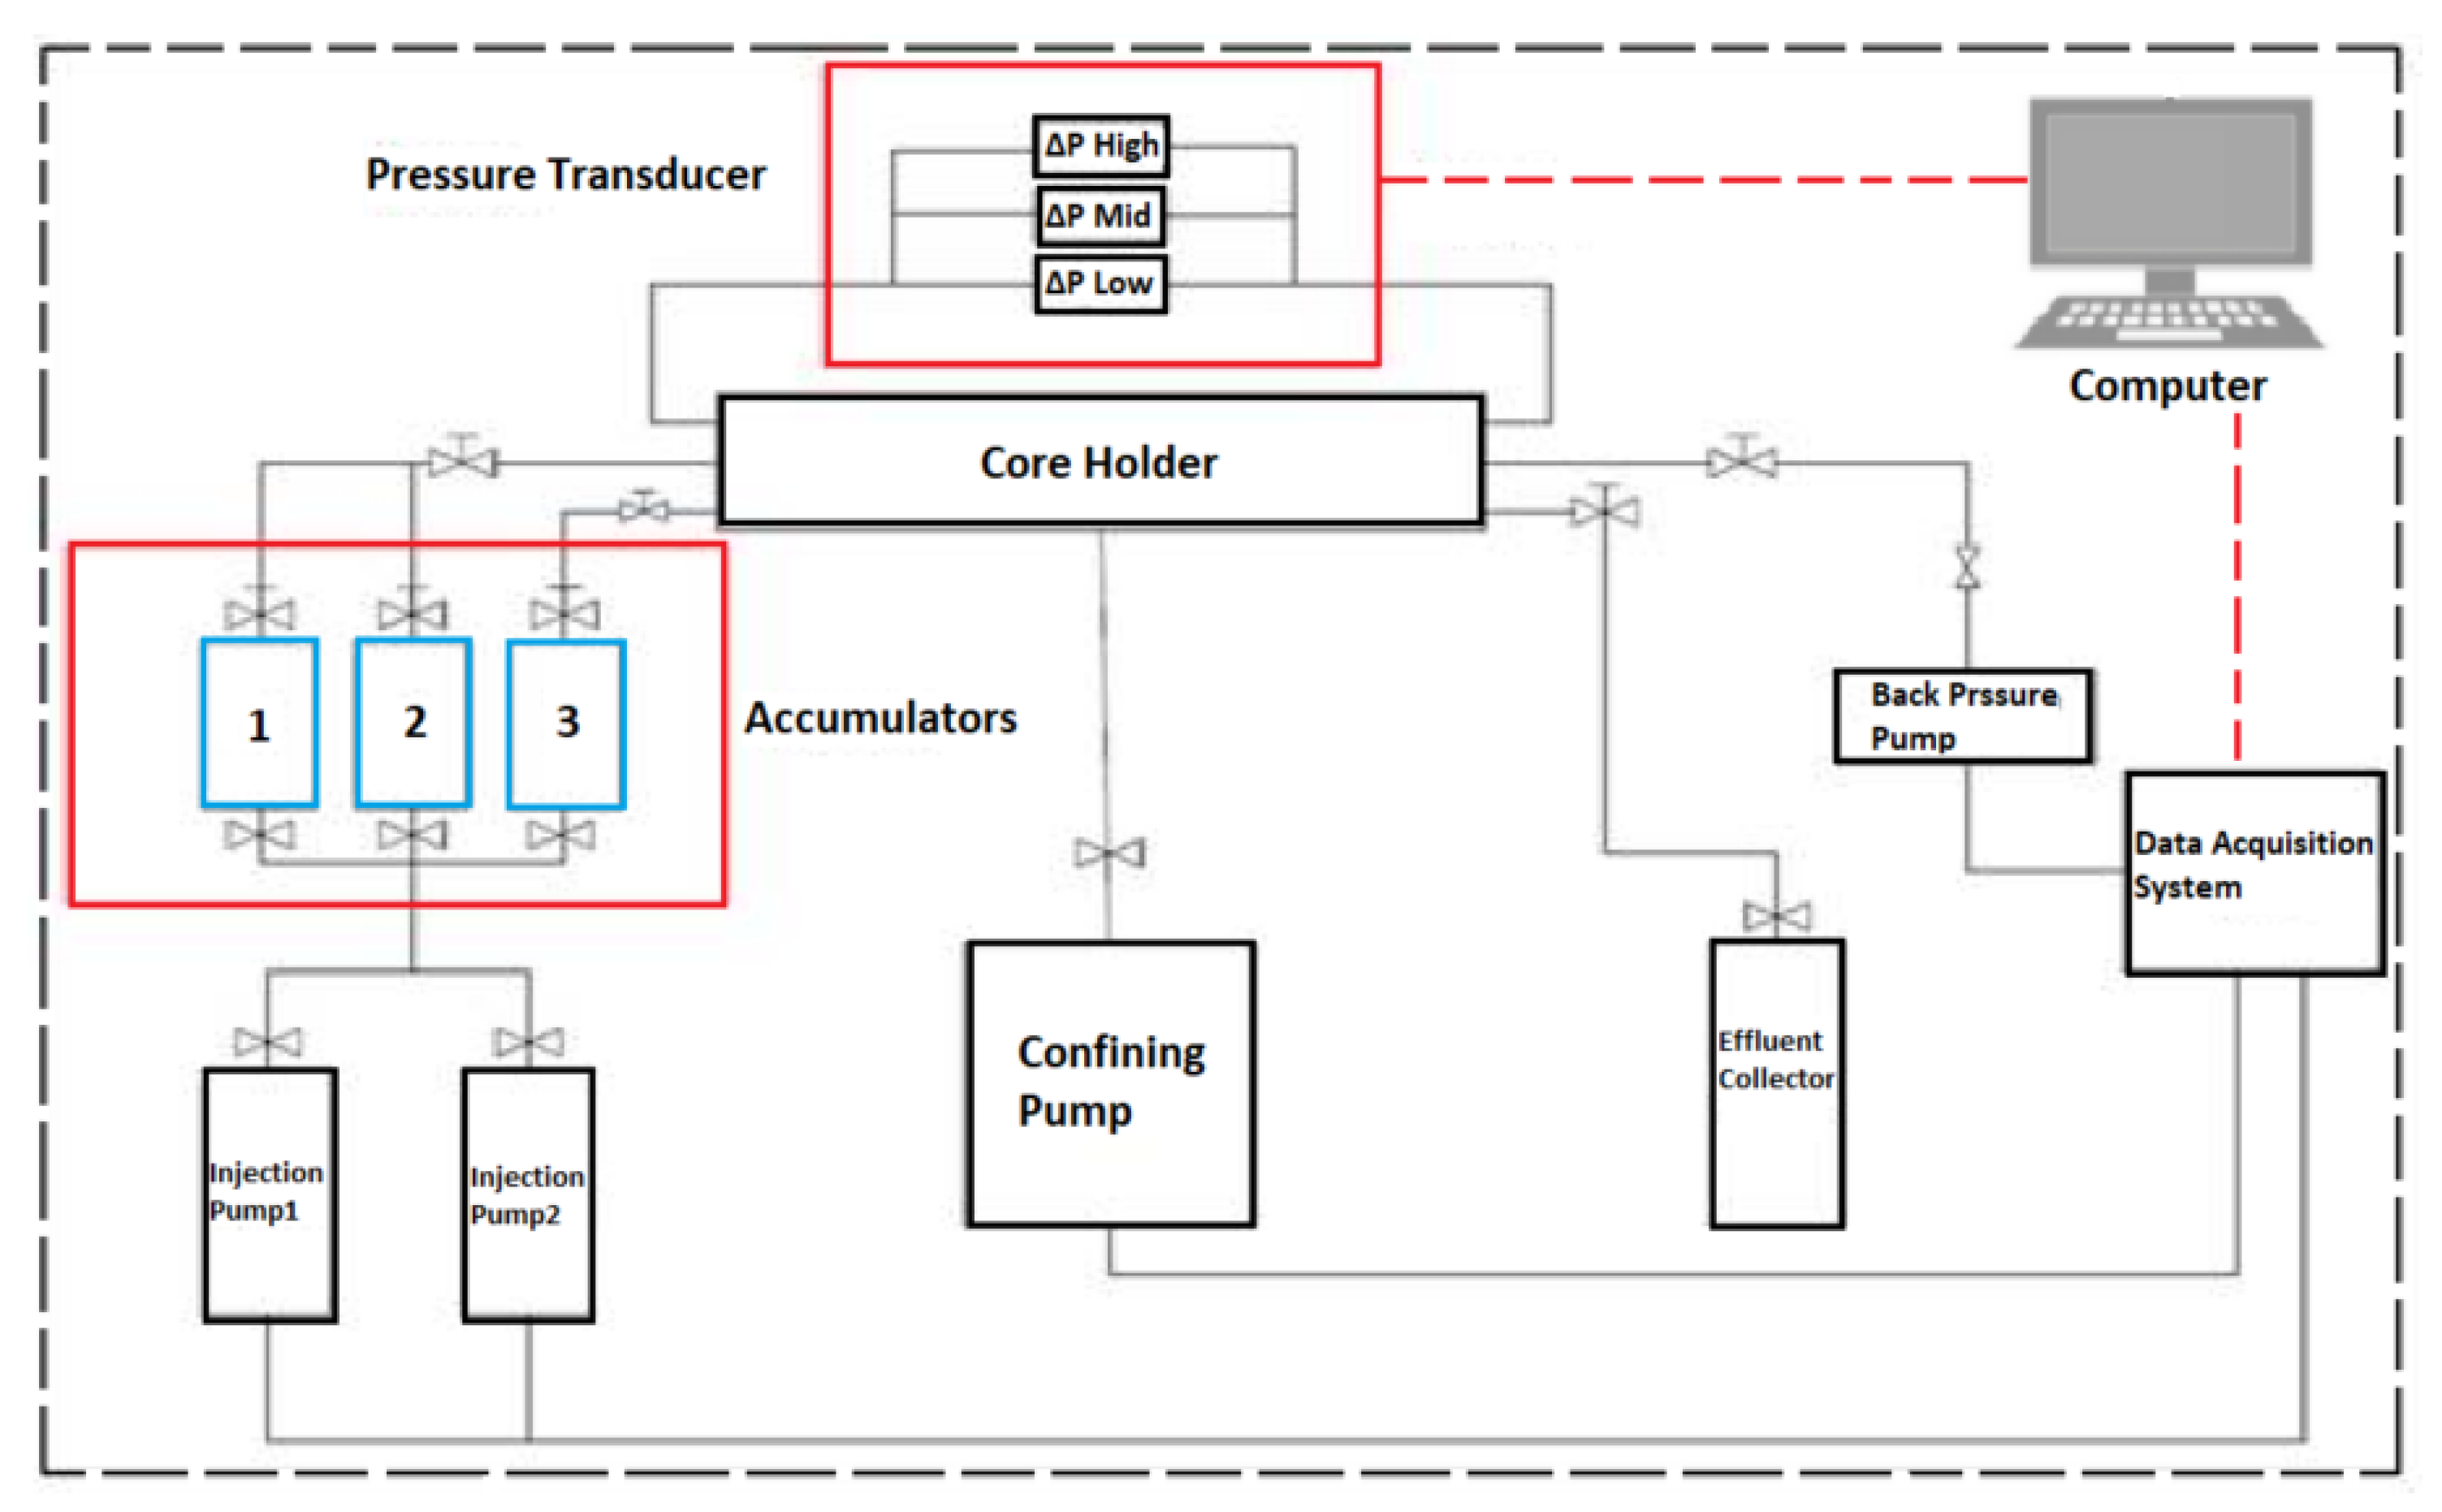
2.2.6. Core Flooding Test (CFT)
Core Sample Preparation and Saturation
Mineralogy Analysis
Permeability Measurement
Crude Oil Flooding (i.e., Drainage Process)
Sea Water Flooding (i.e., Imbibition Process)
Smart Water (SW) Flooding (i.e., Imbibition Process)
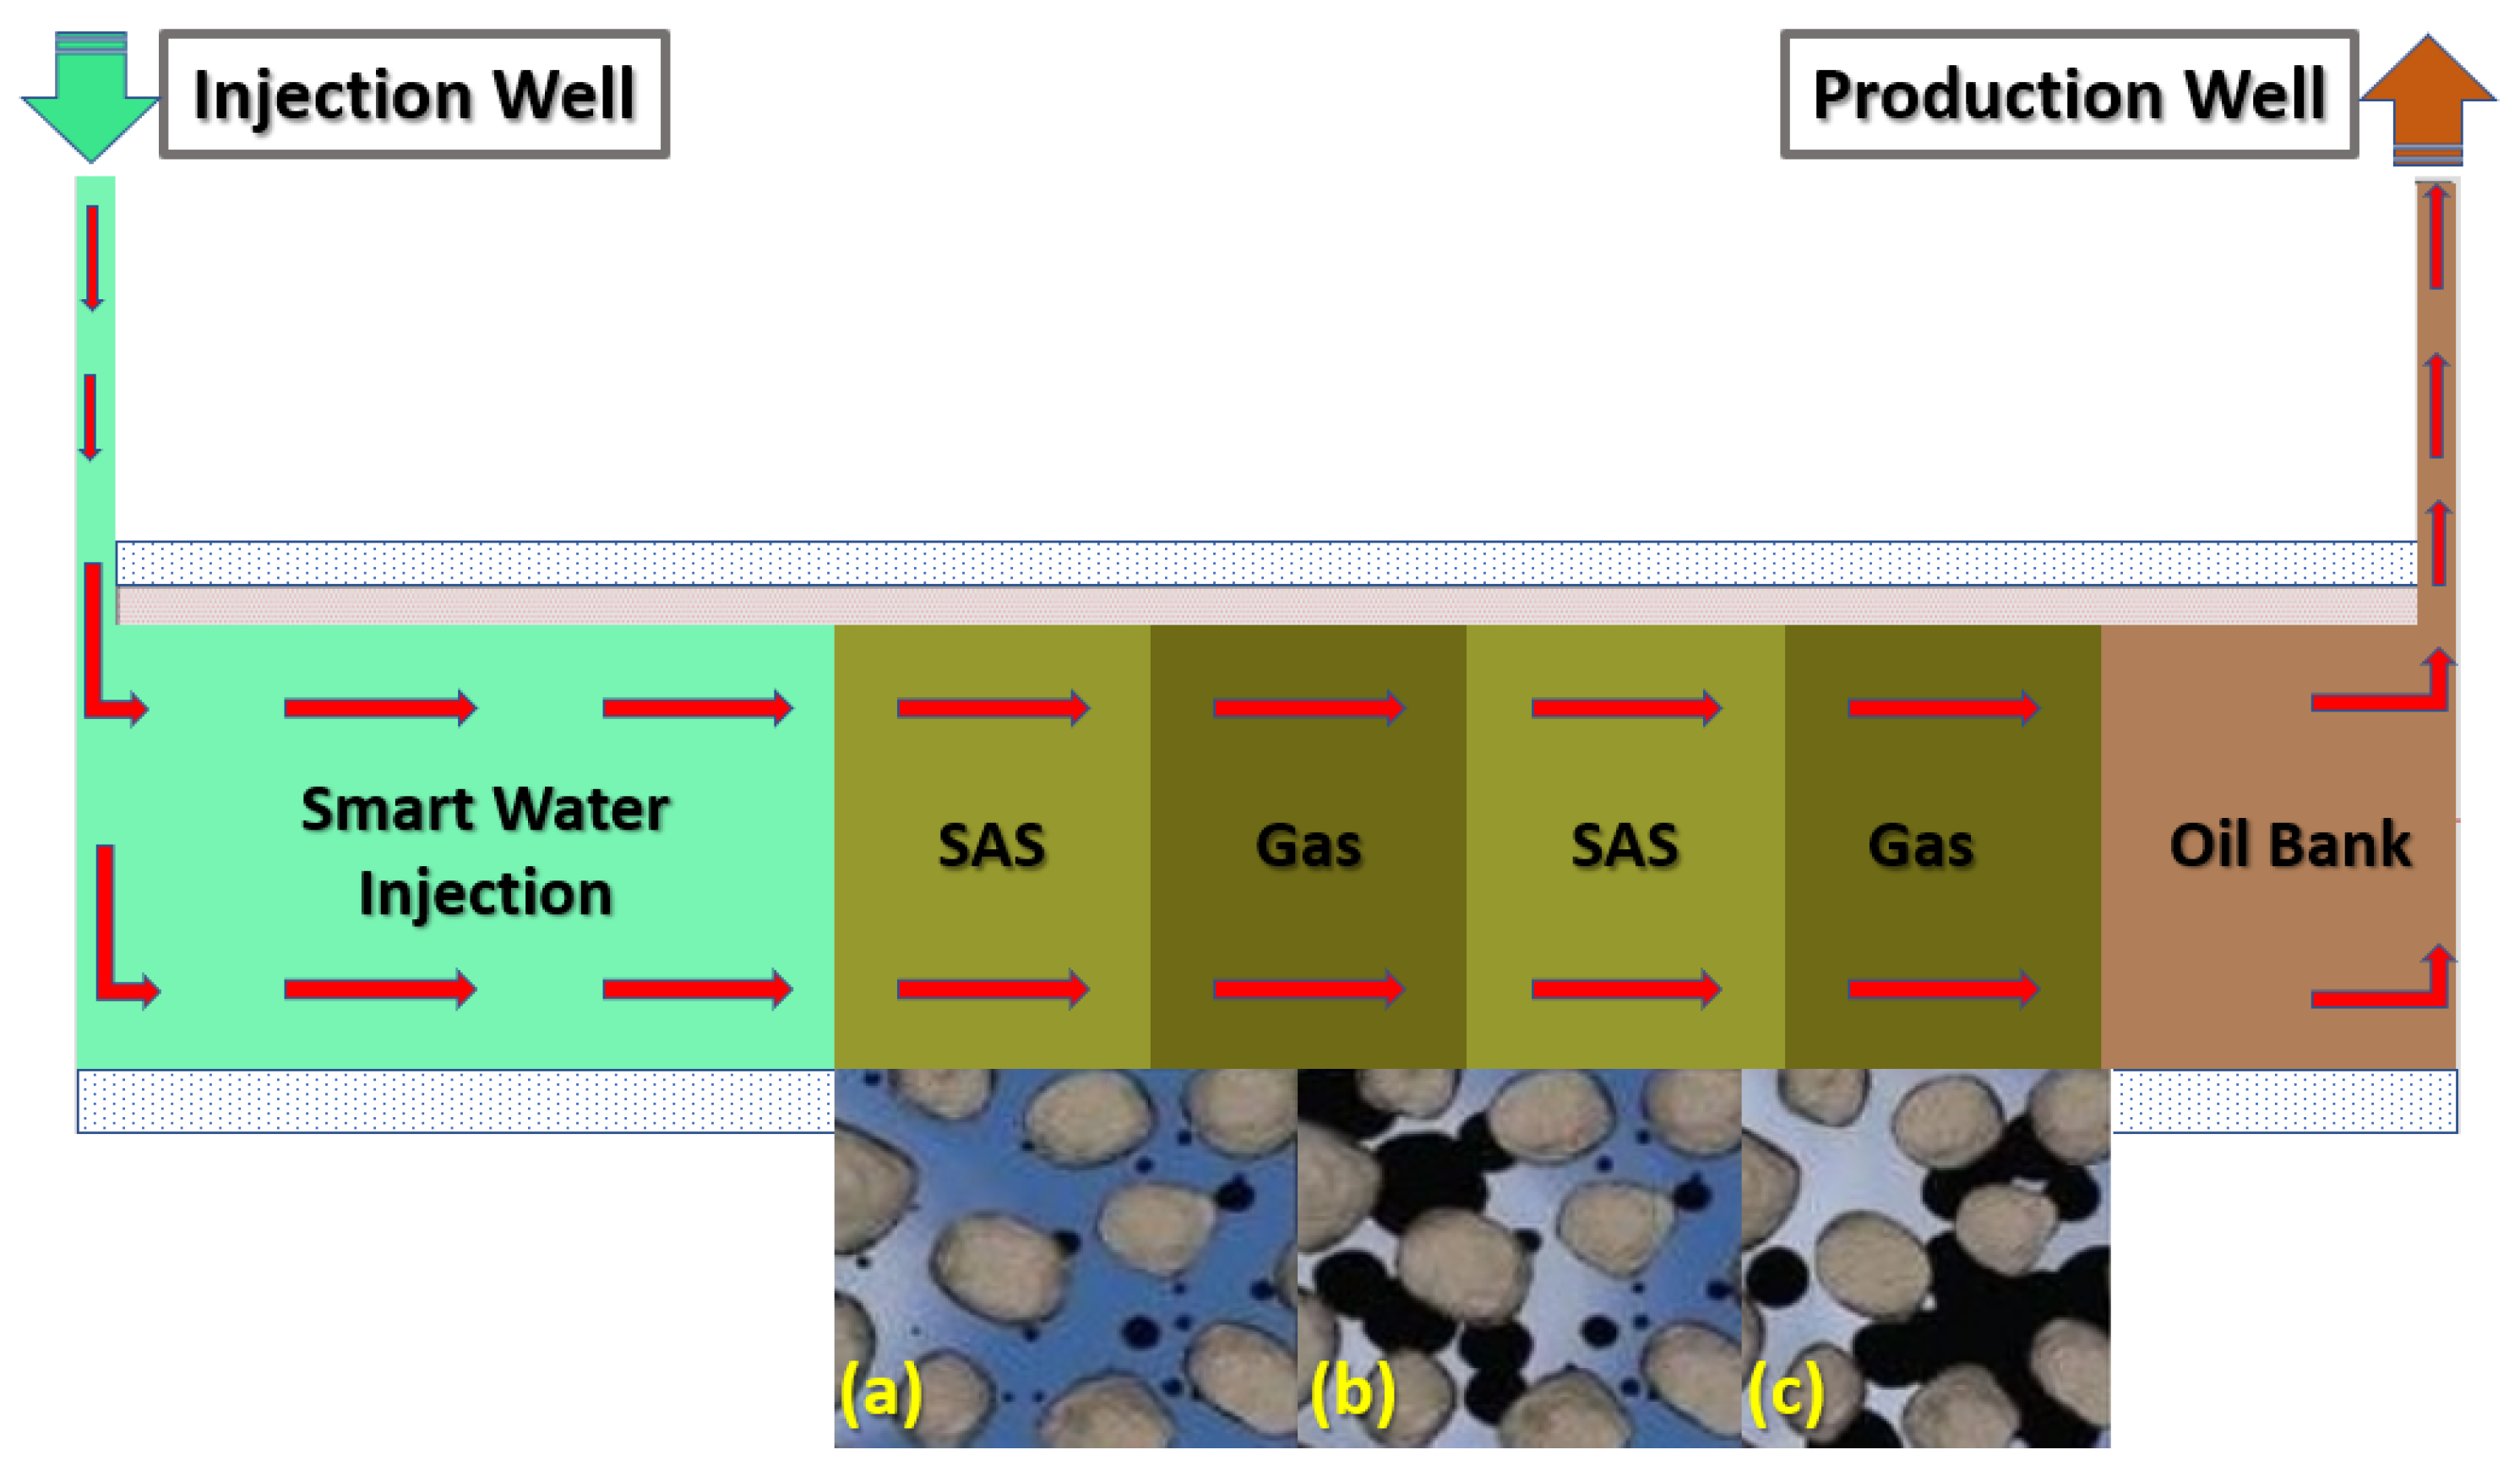
SAS Alternating Gas (SAG) Flooding
3. Experimental Results and Discussions
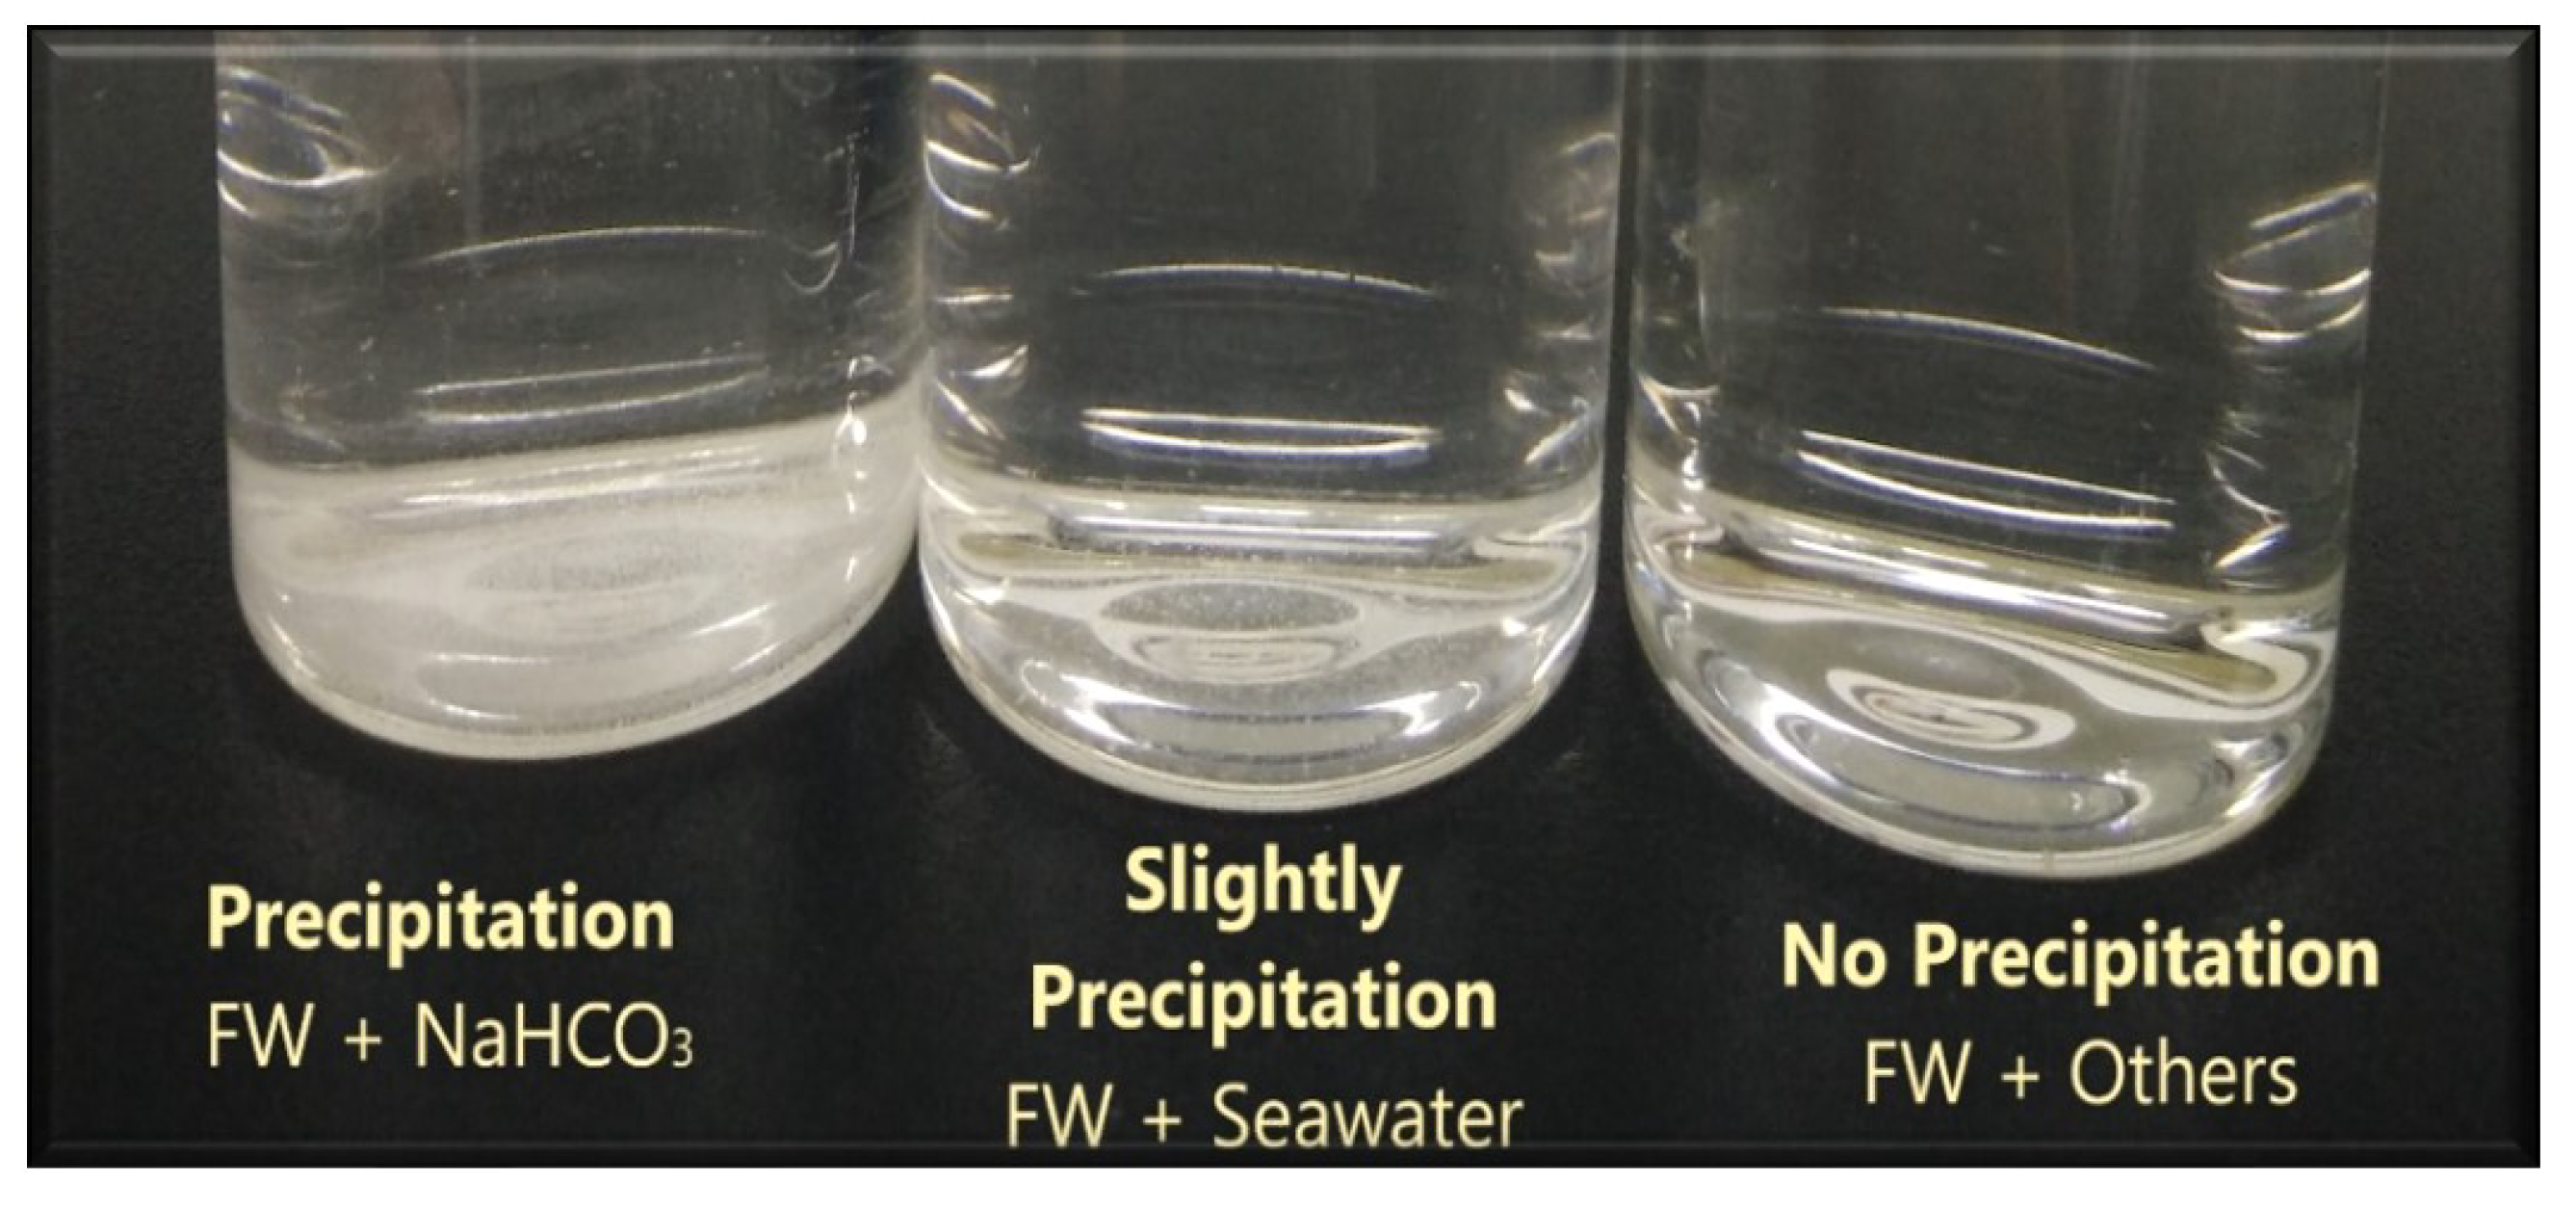
3.1. Compatibility Test
3.2. Wettability Measurement
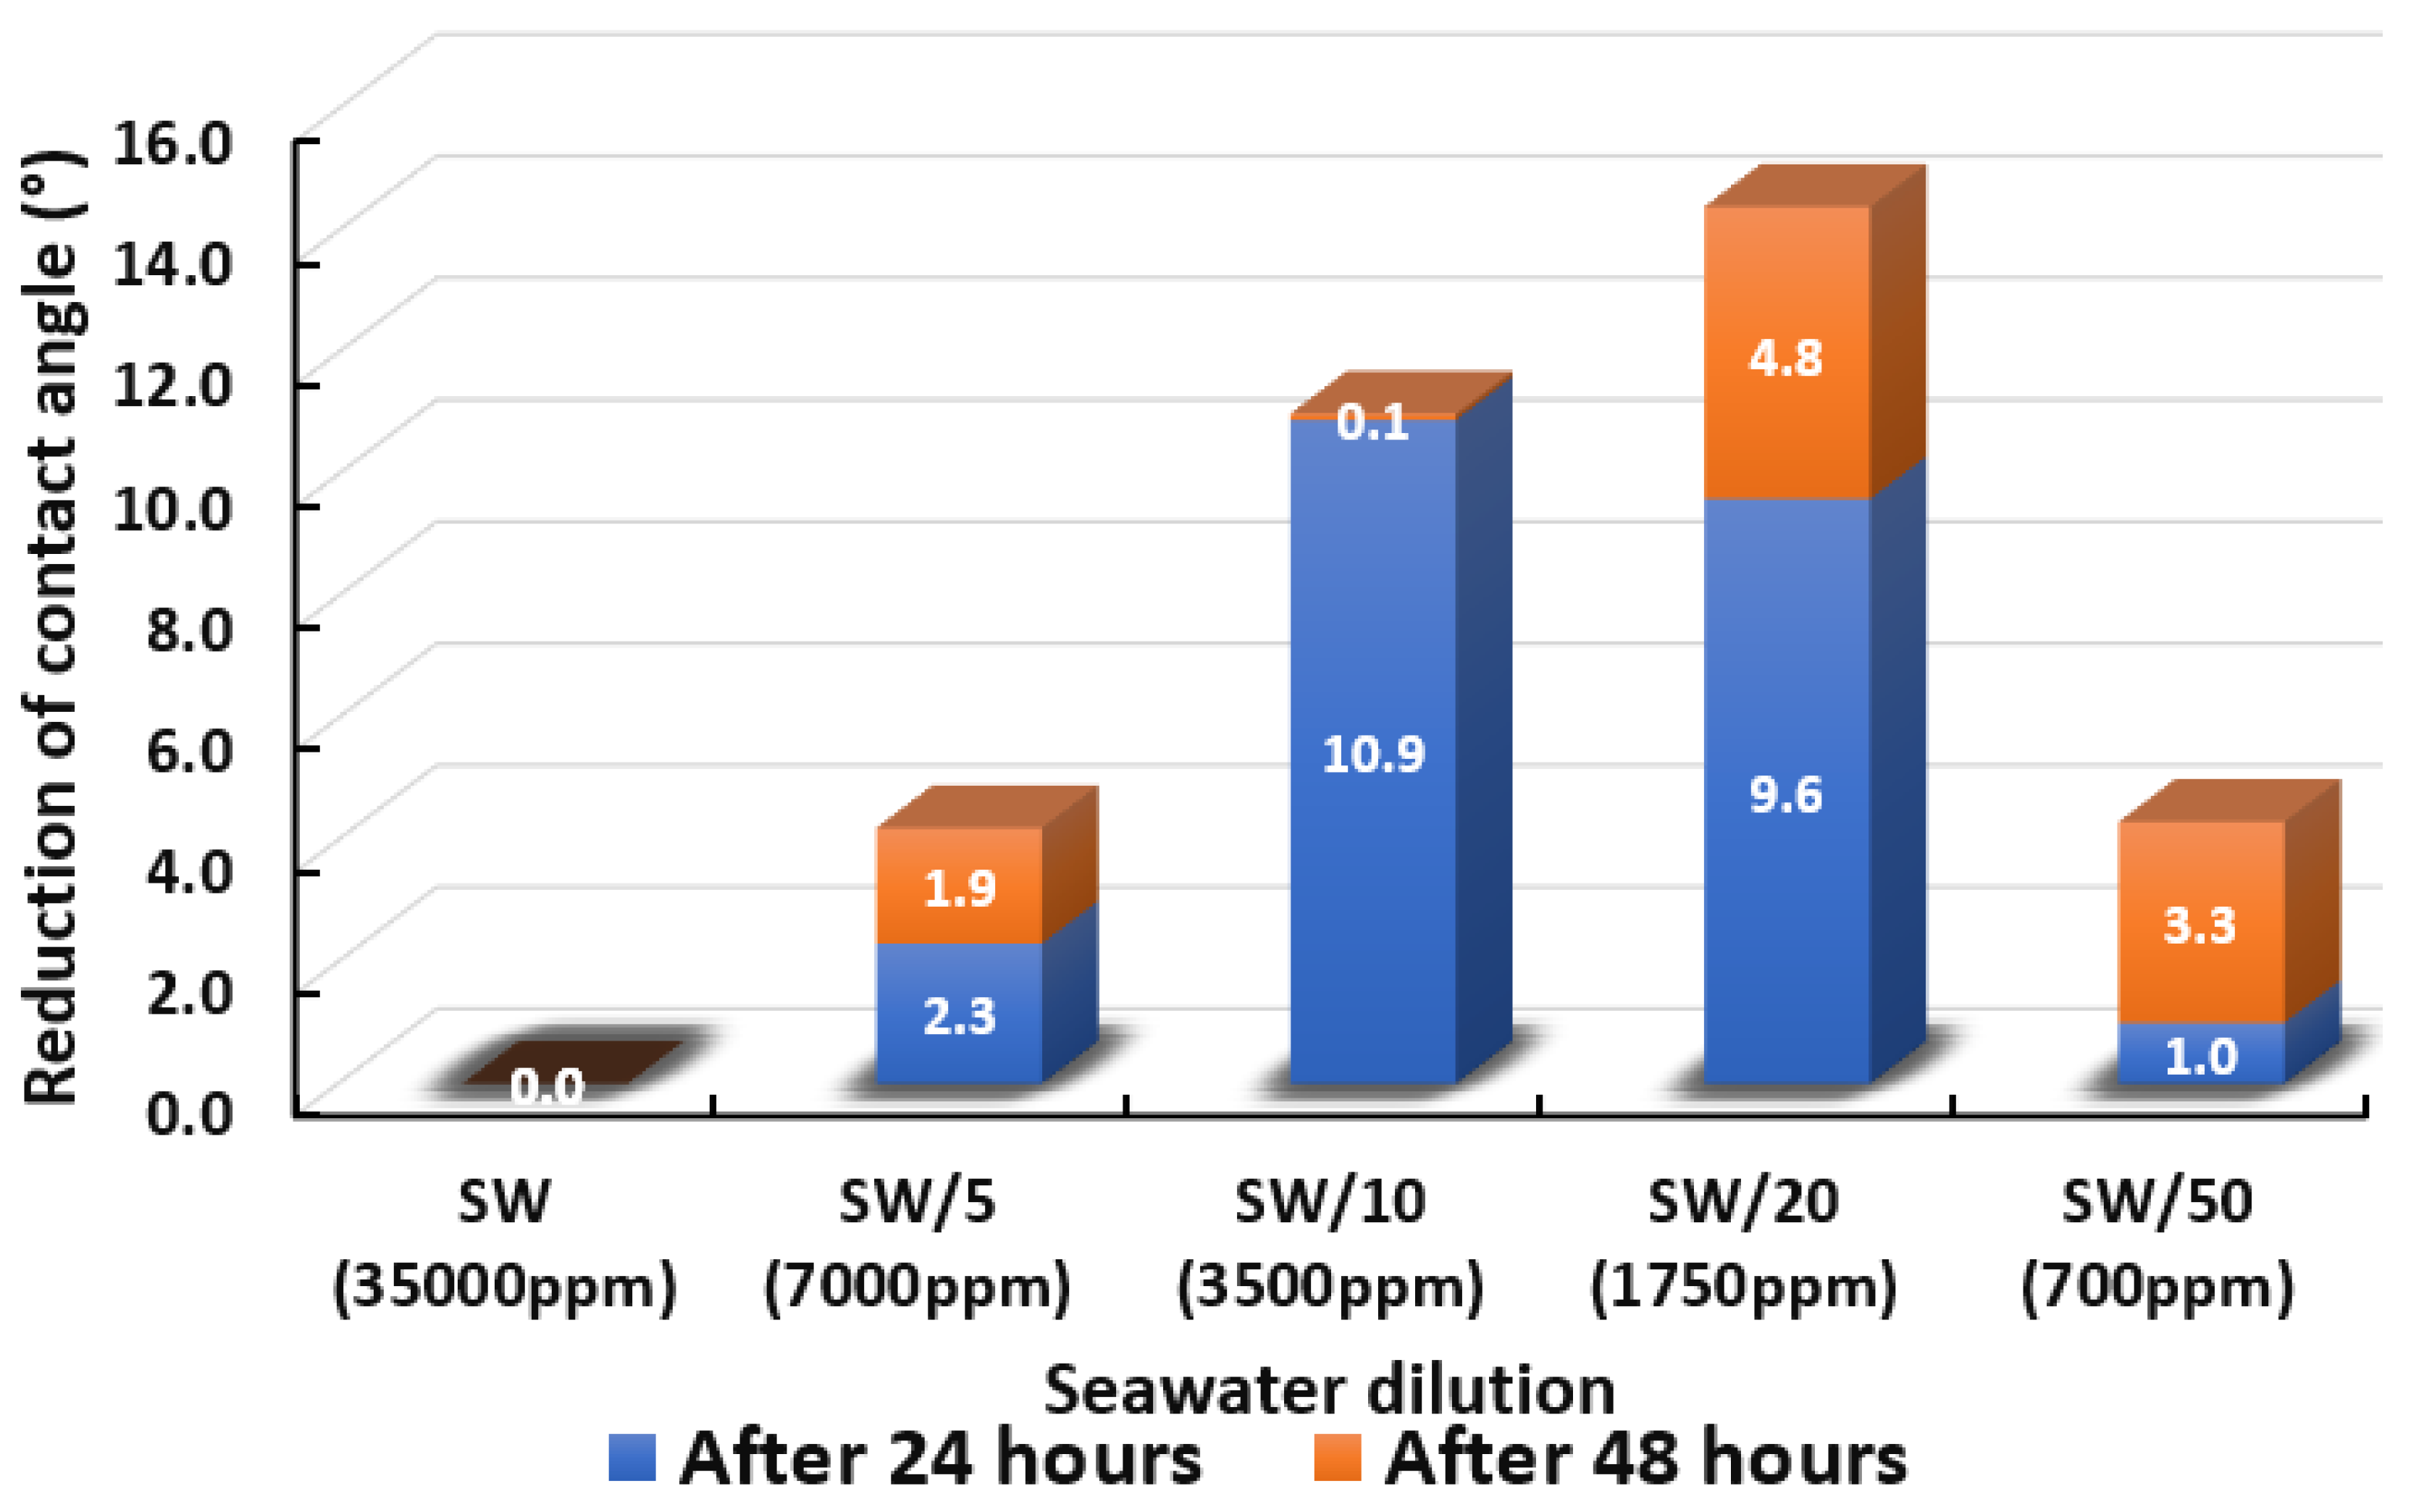
3.2.1. Seawater Solution and its Dilutions
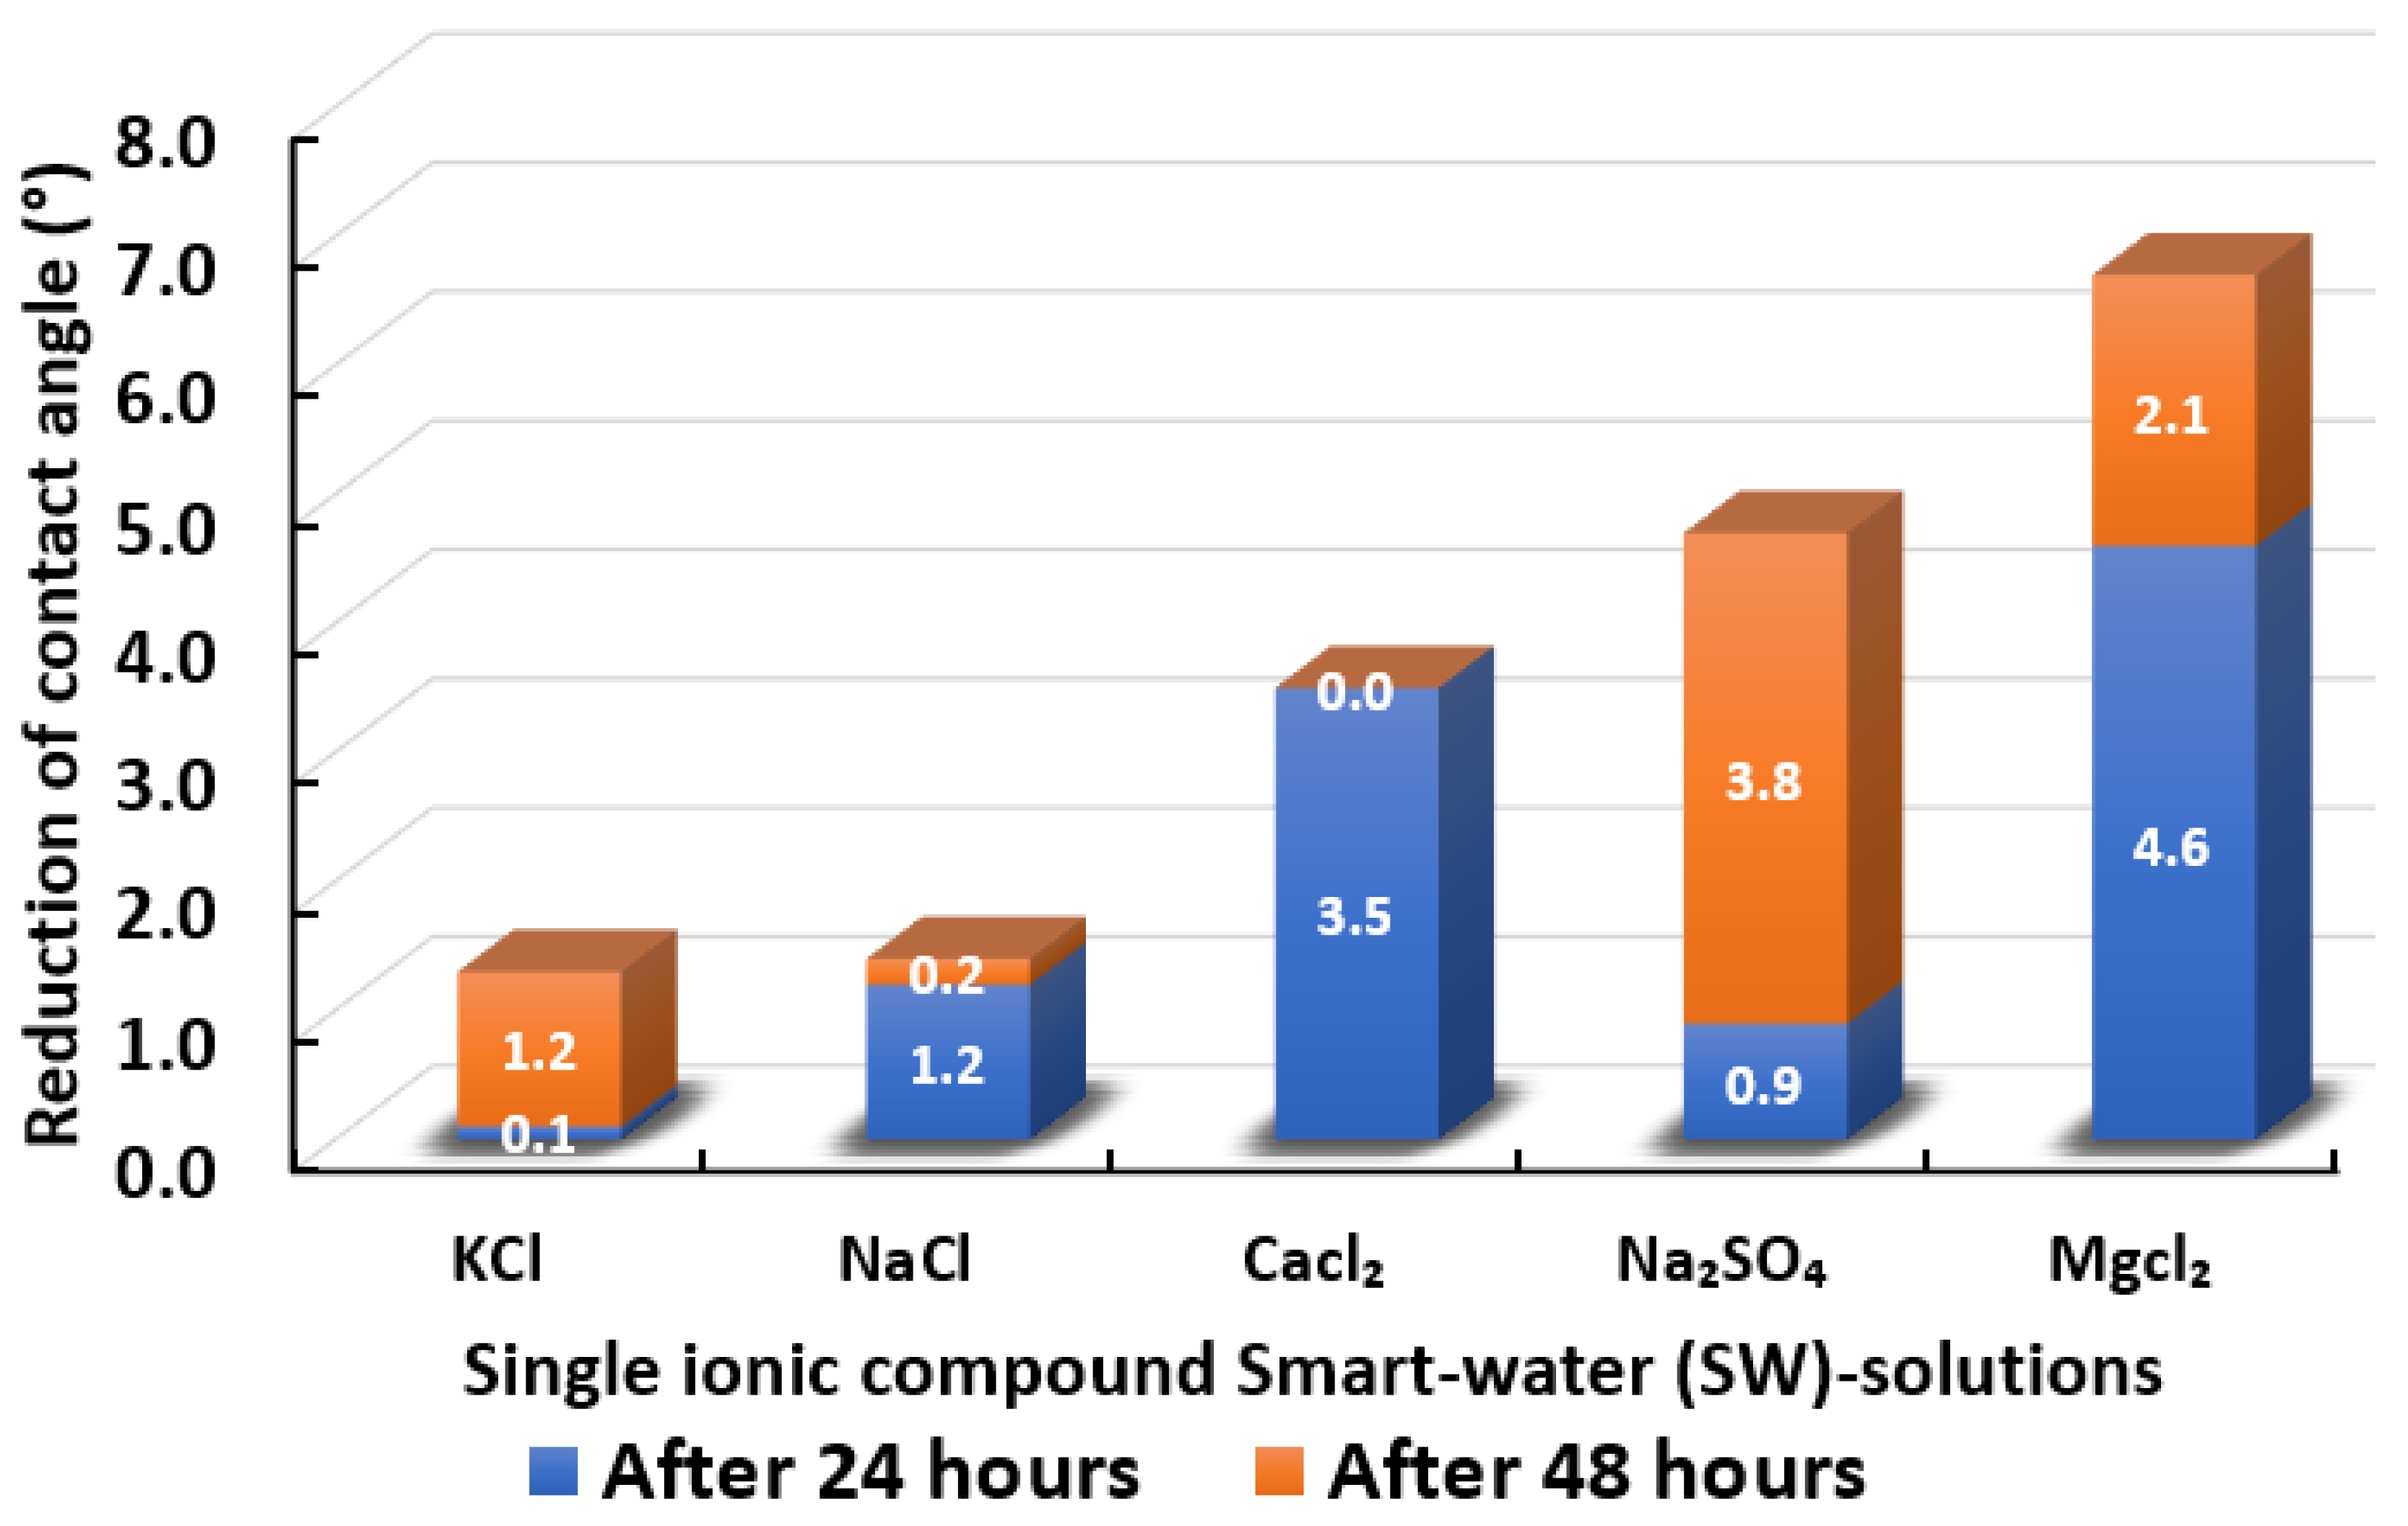
3.2.2. Single Ionic Compounds Smart Water Solutions (3500 ppm)
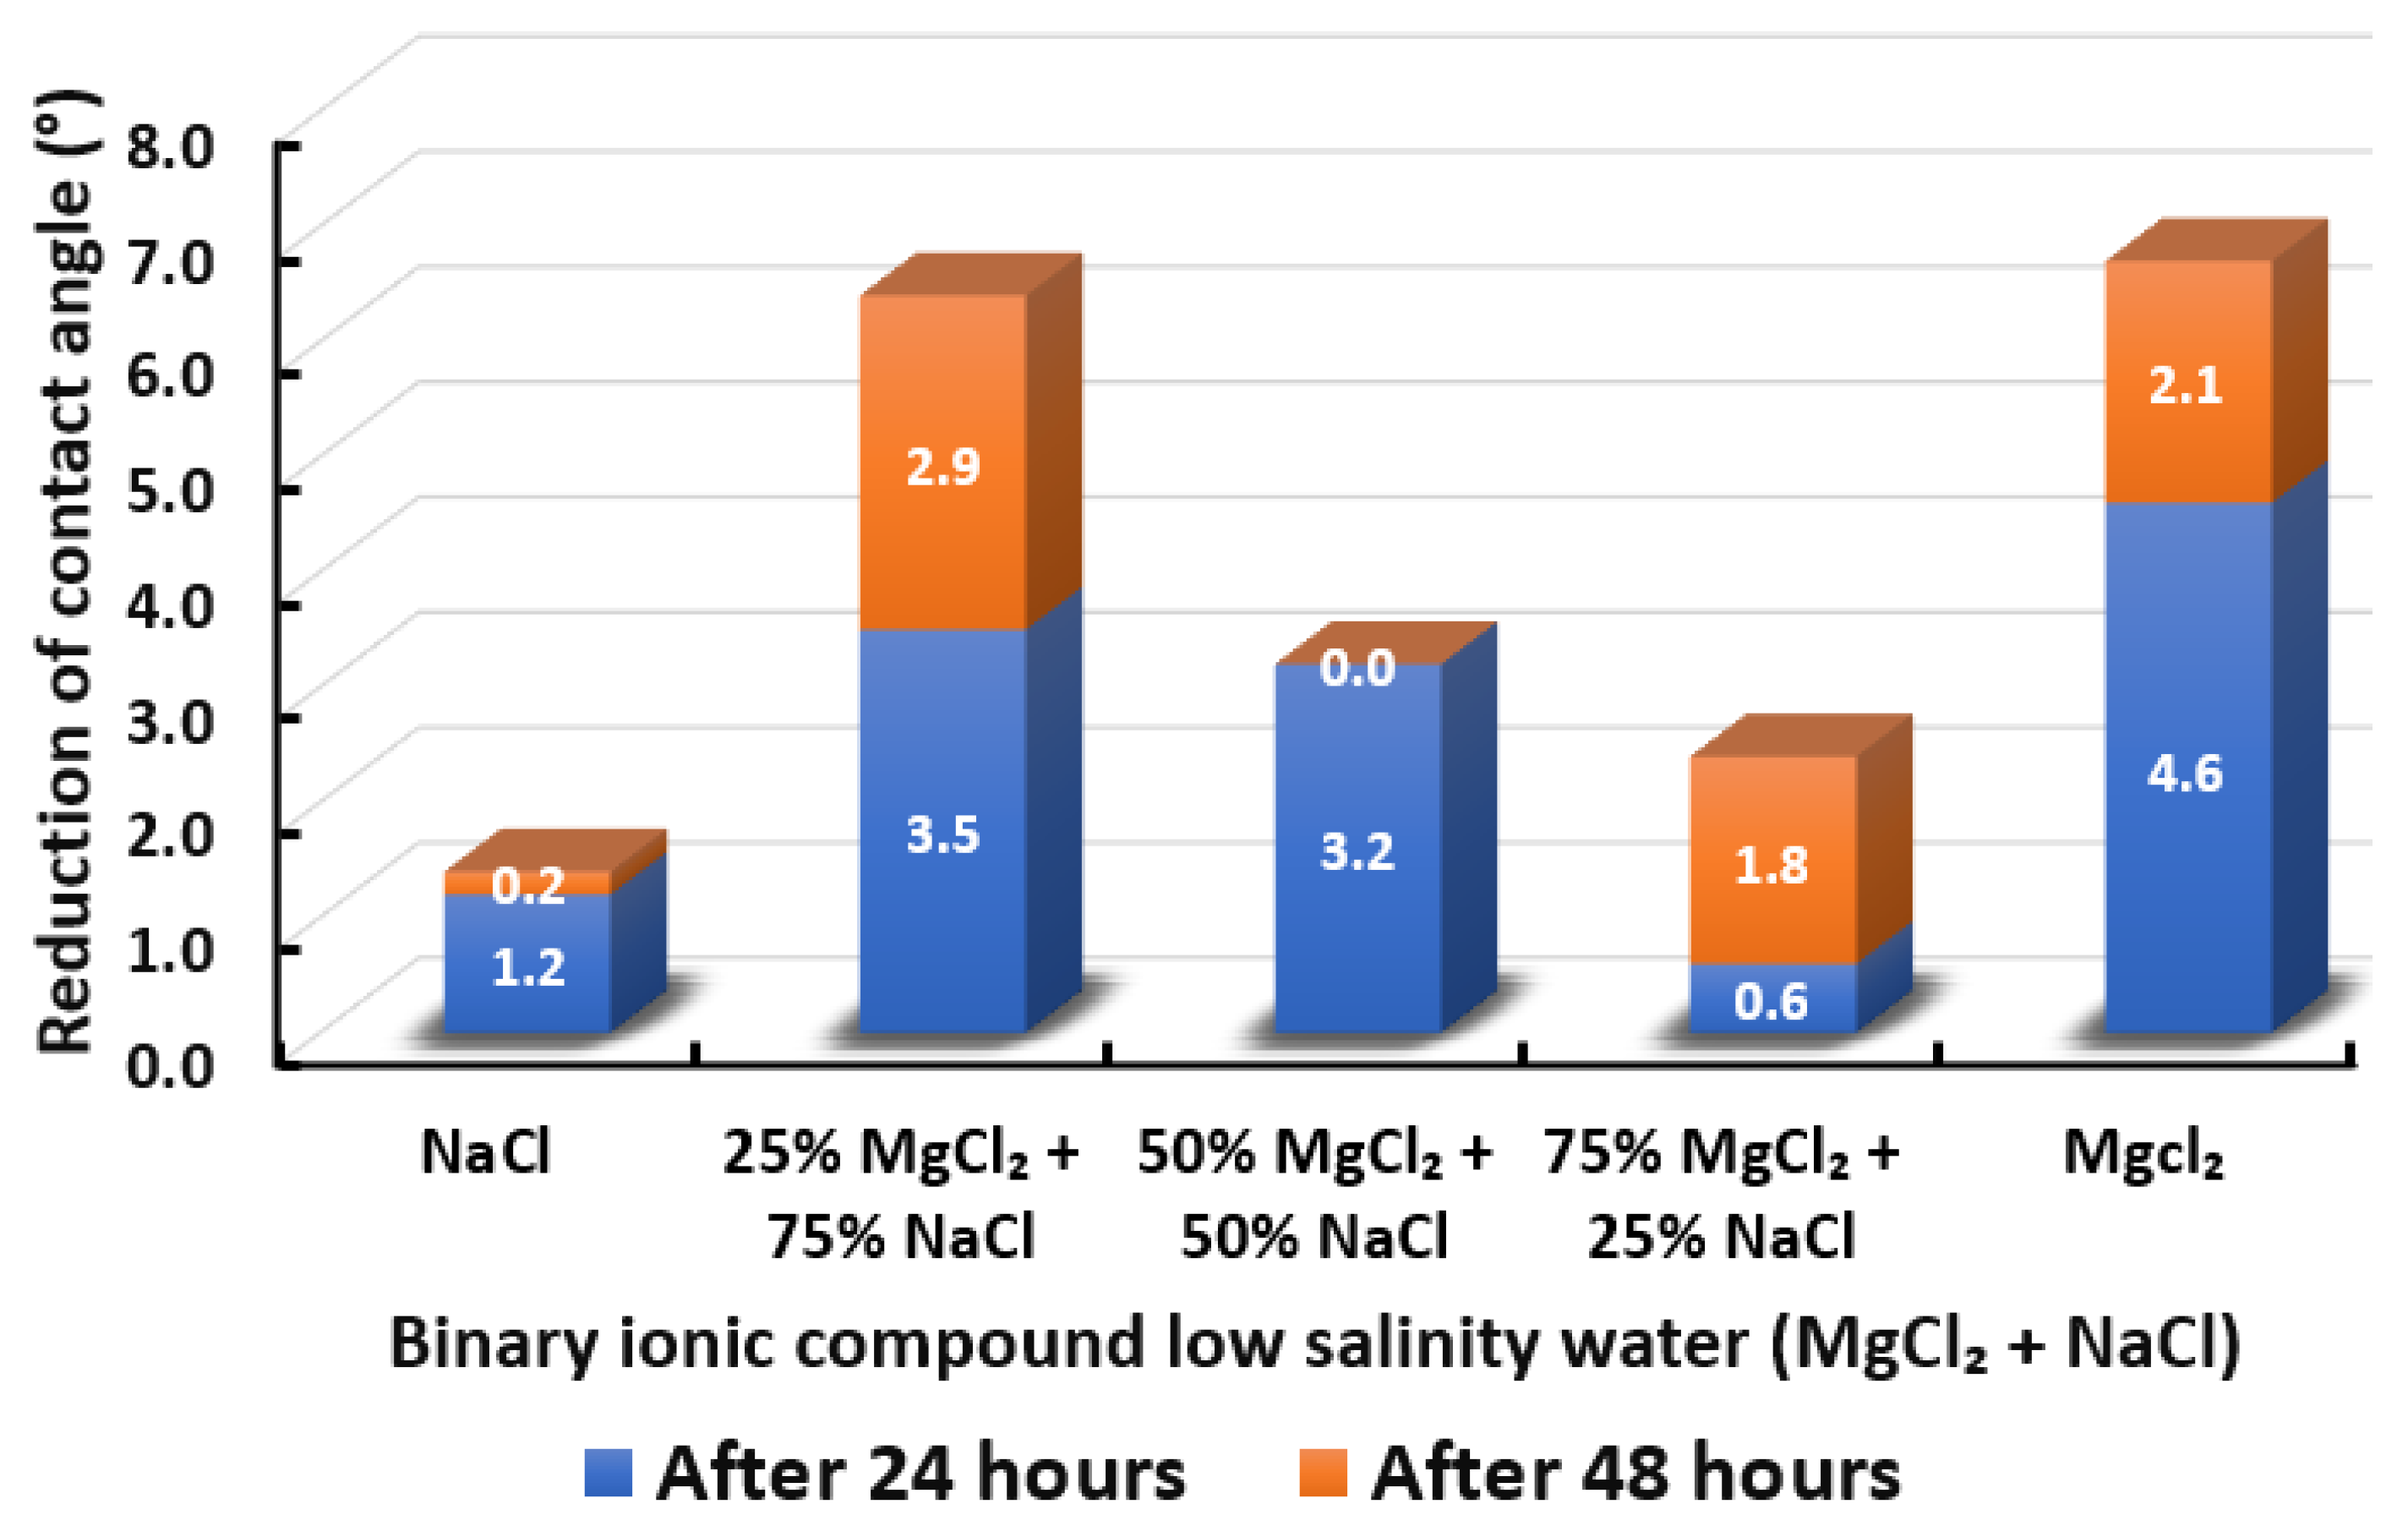
3.2.3. Binary Ionic Compounds Smart Water Solutions MgCl + NaCl (3500 ppm)
3.2.4. Binary Ionic Compounds Smart Water Solutions MgCl + KCl (3500 ppm)
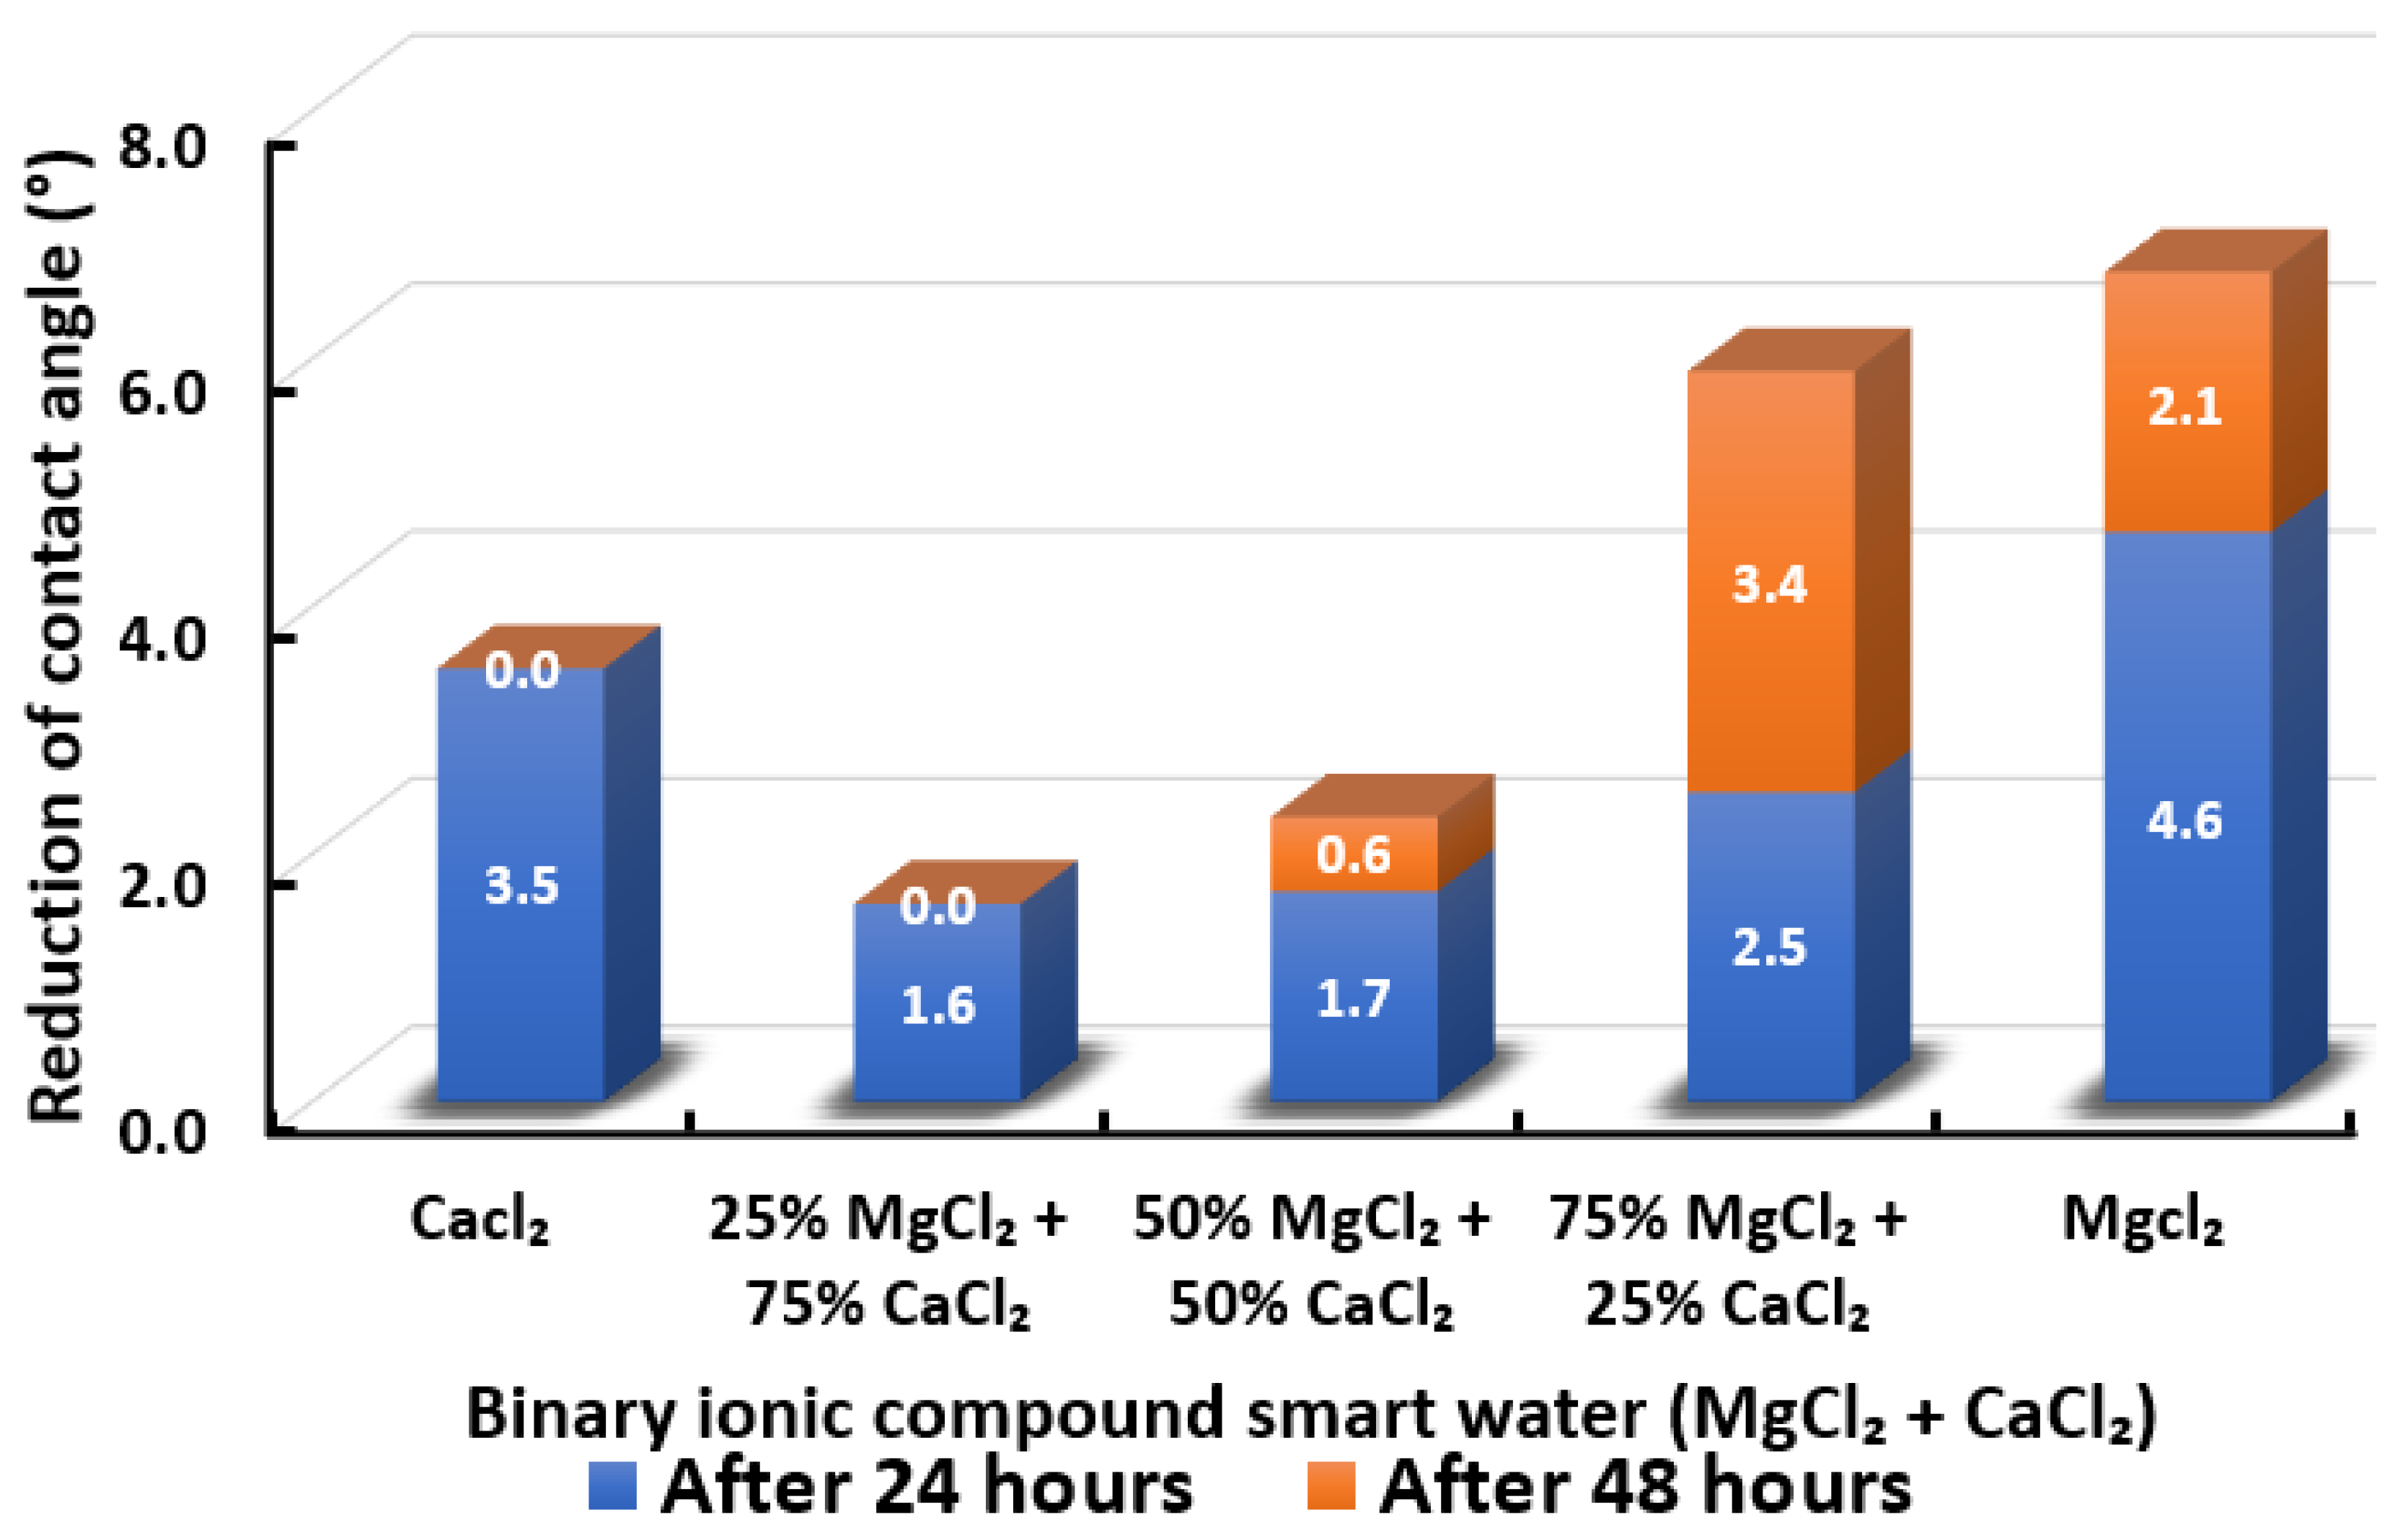
3.2.5. Binary Ionic Compounds Smart Water Solutions MgCl + CaCl (3500 ppm)
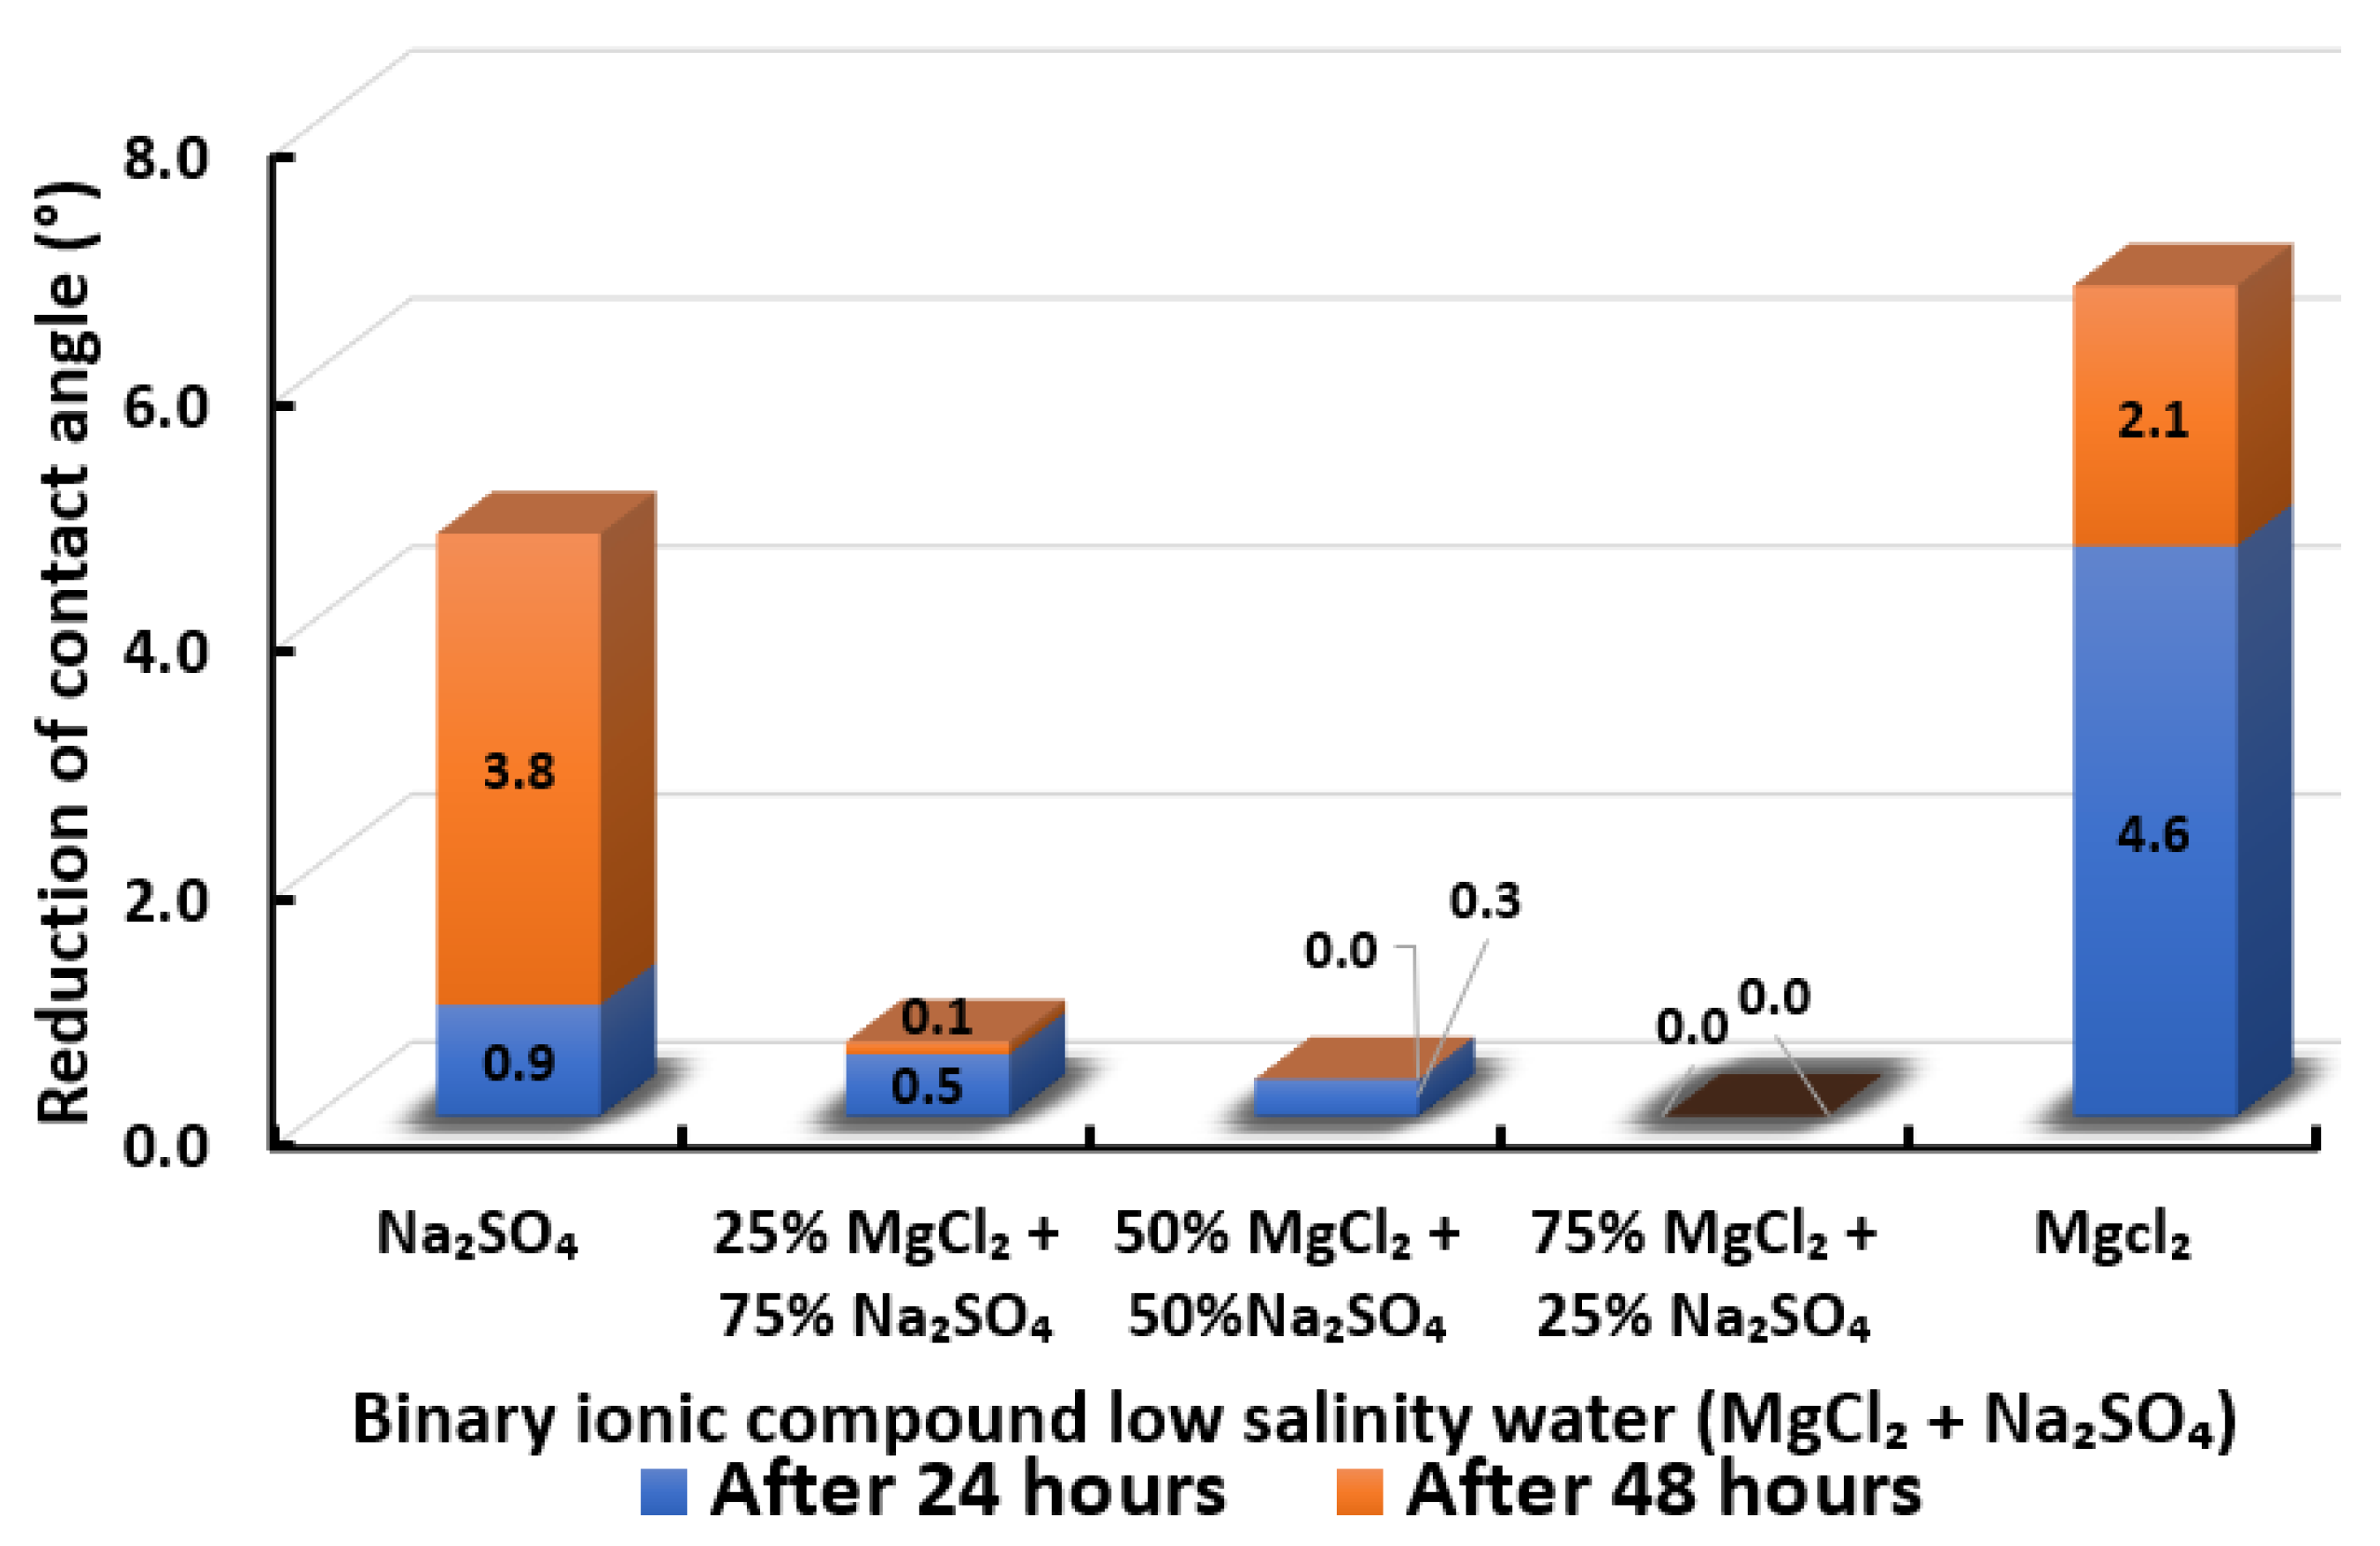
3.2.6. Binary Ionic Compounds Smart Water Solutions MgCl + NaSO (3500 ppm)
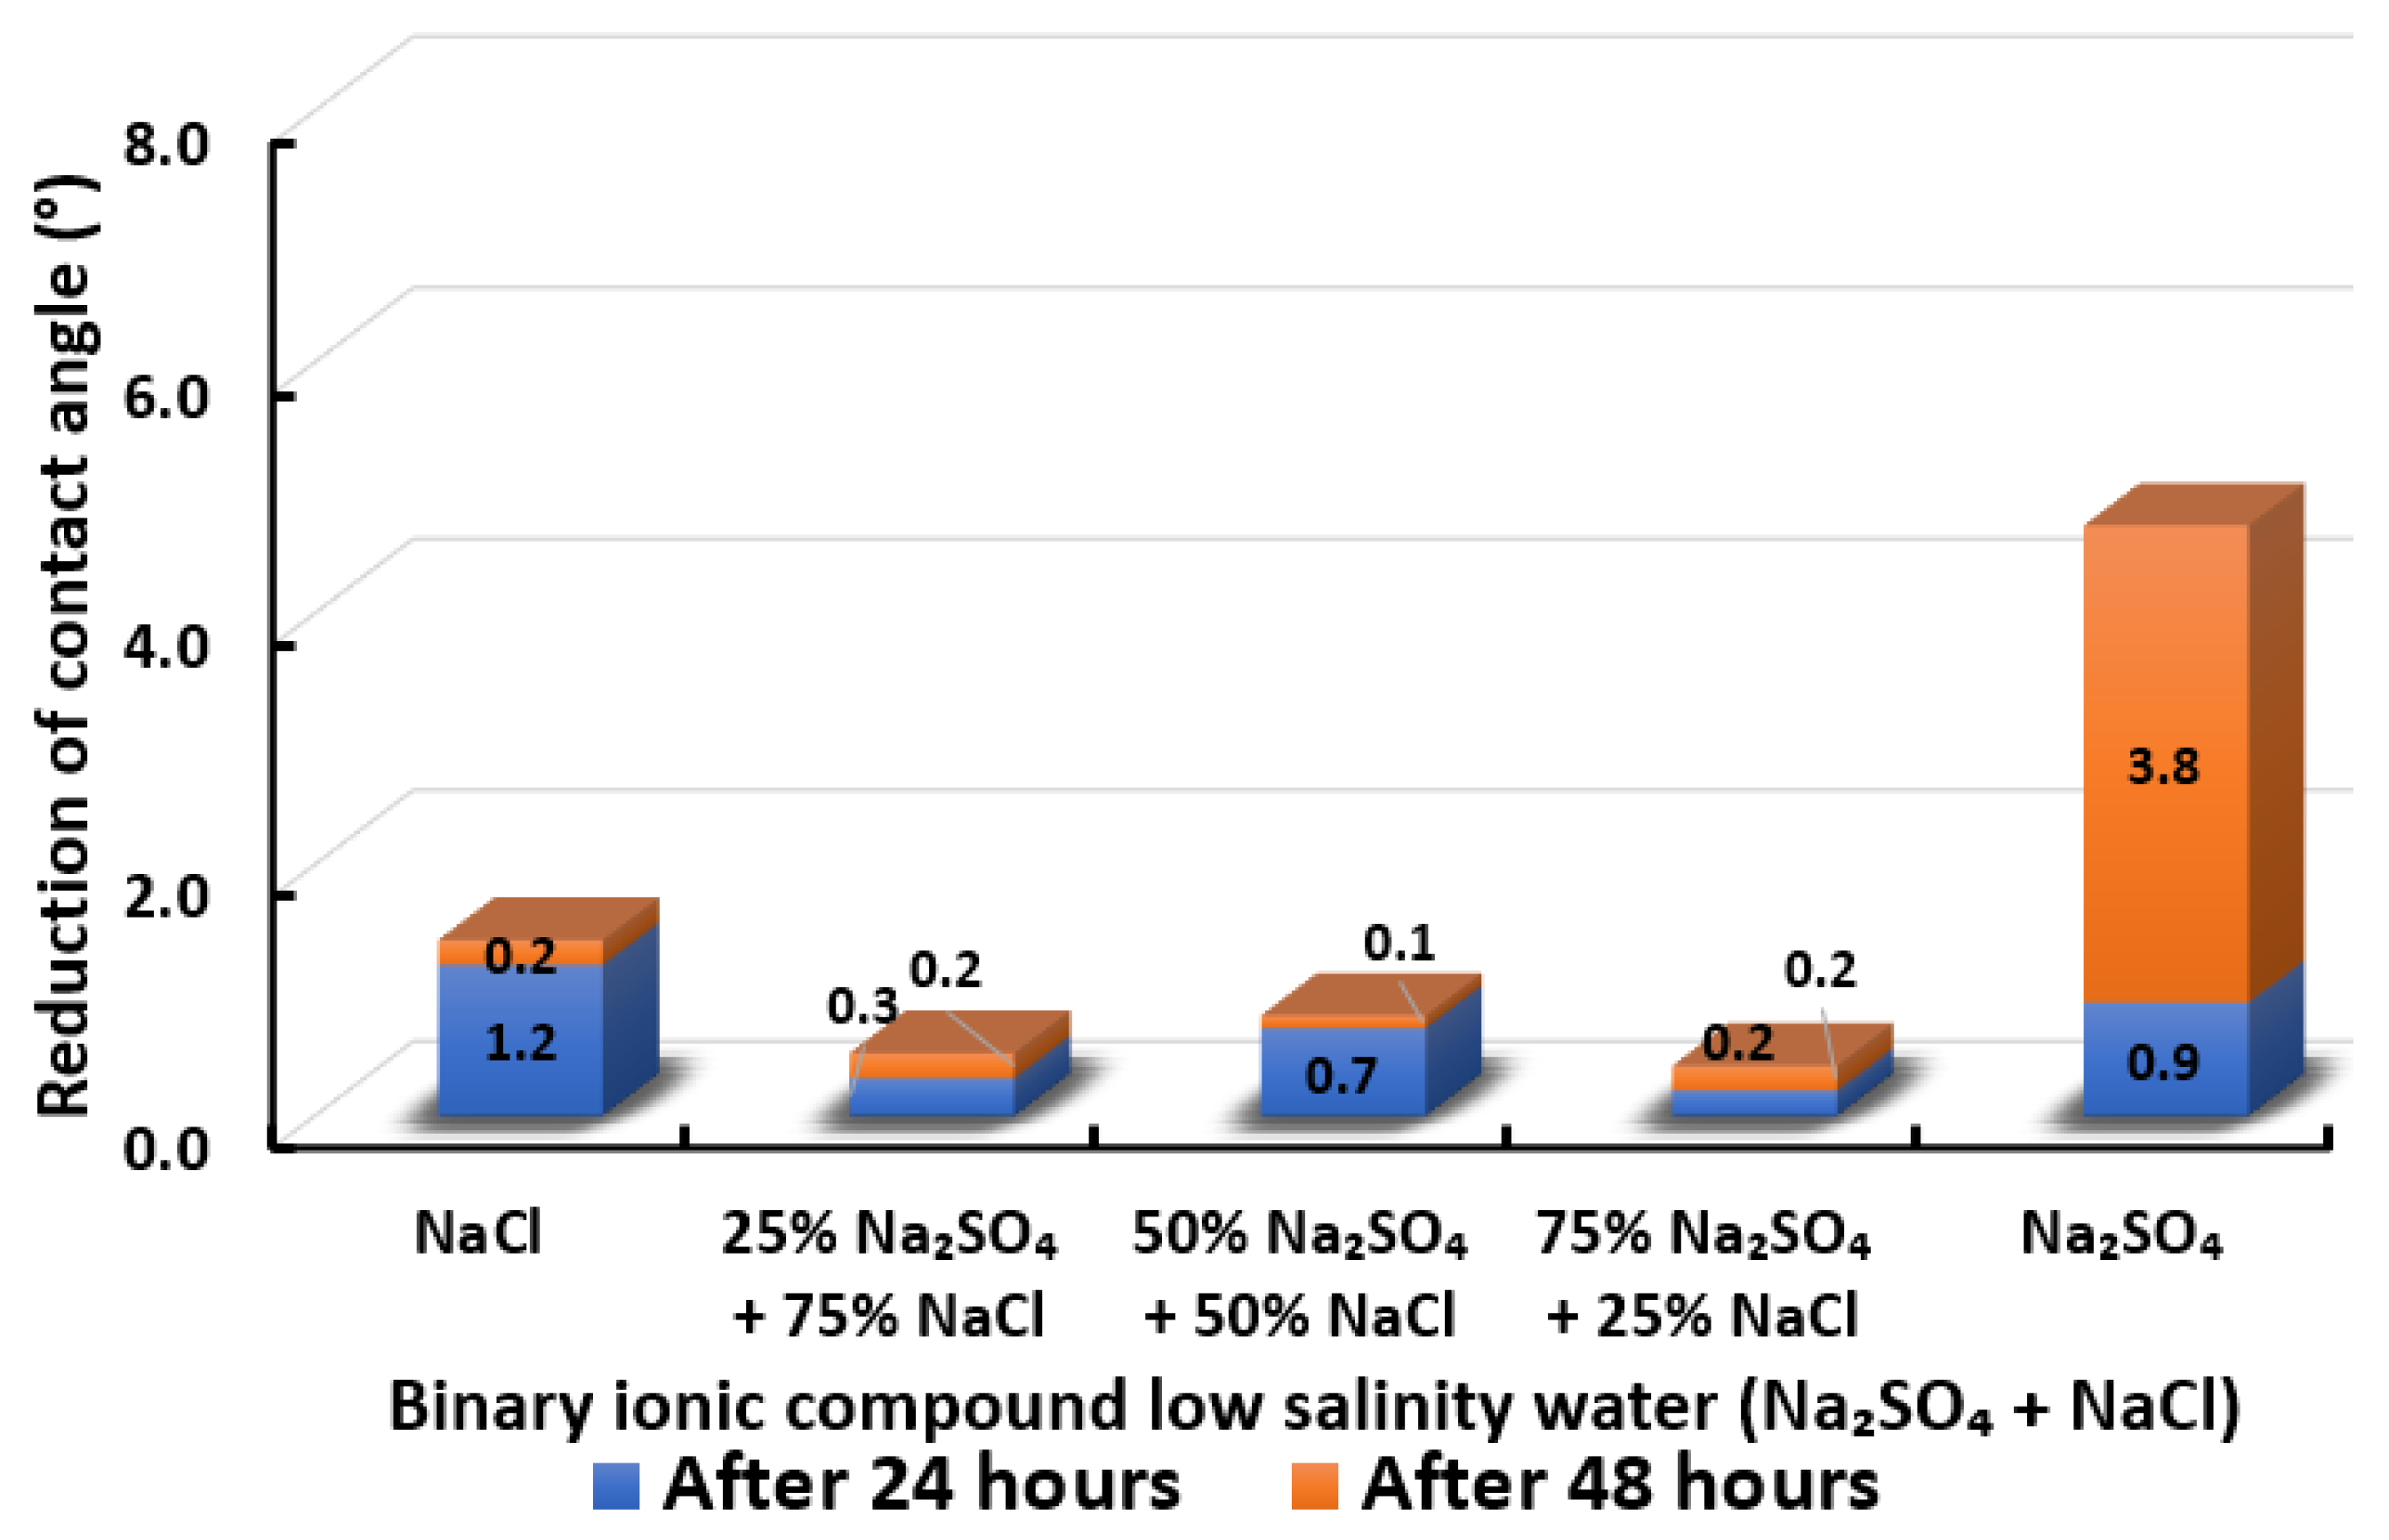
3.2.7. Binary Ionic Compounds Smart Water Solutions NaSO + NaCl (3500 ppm)
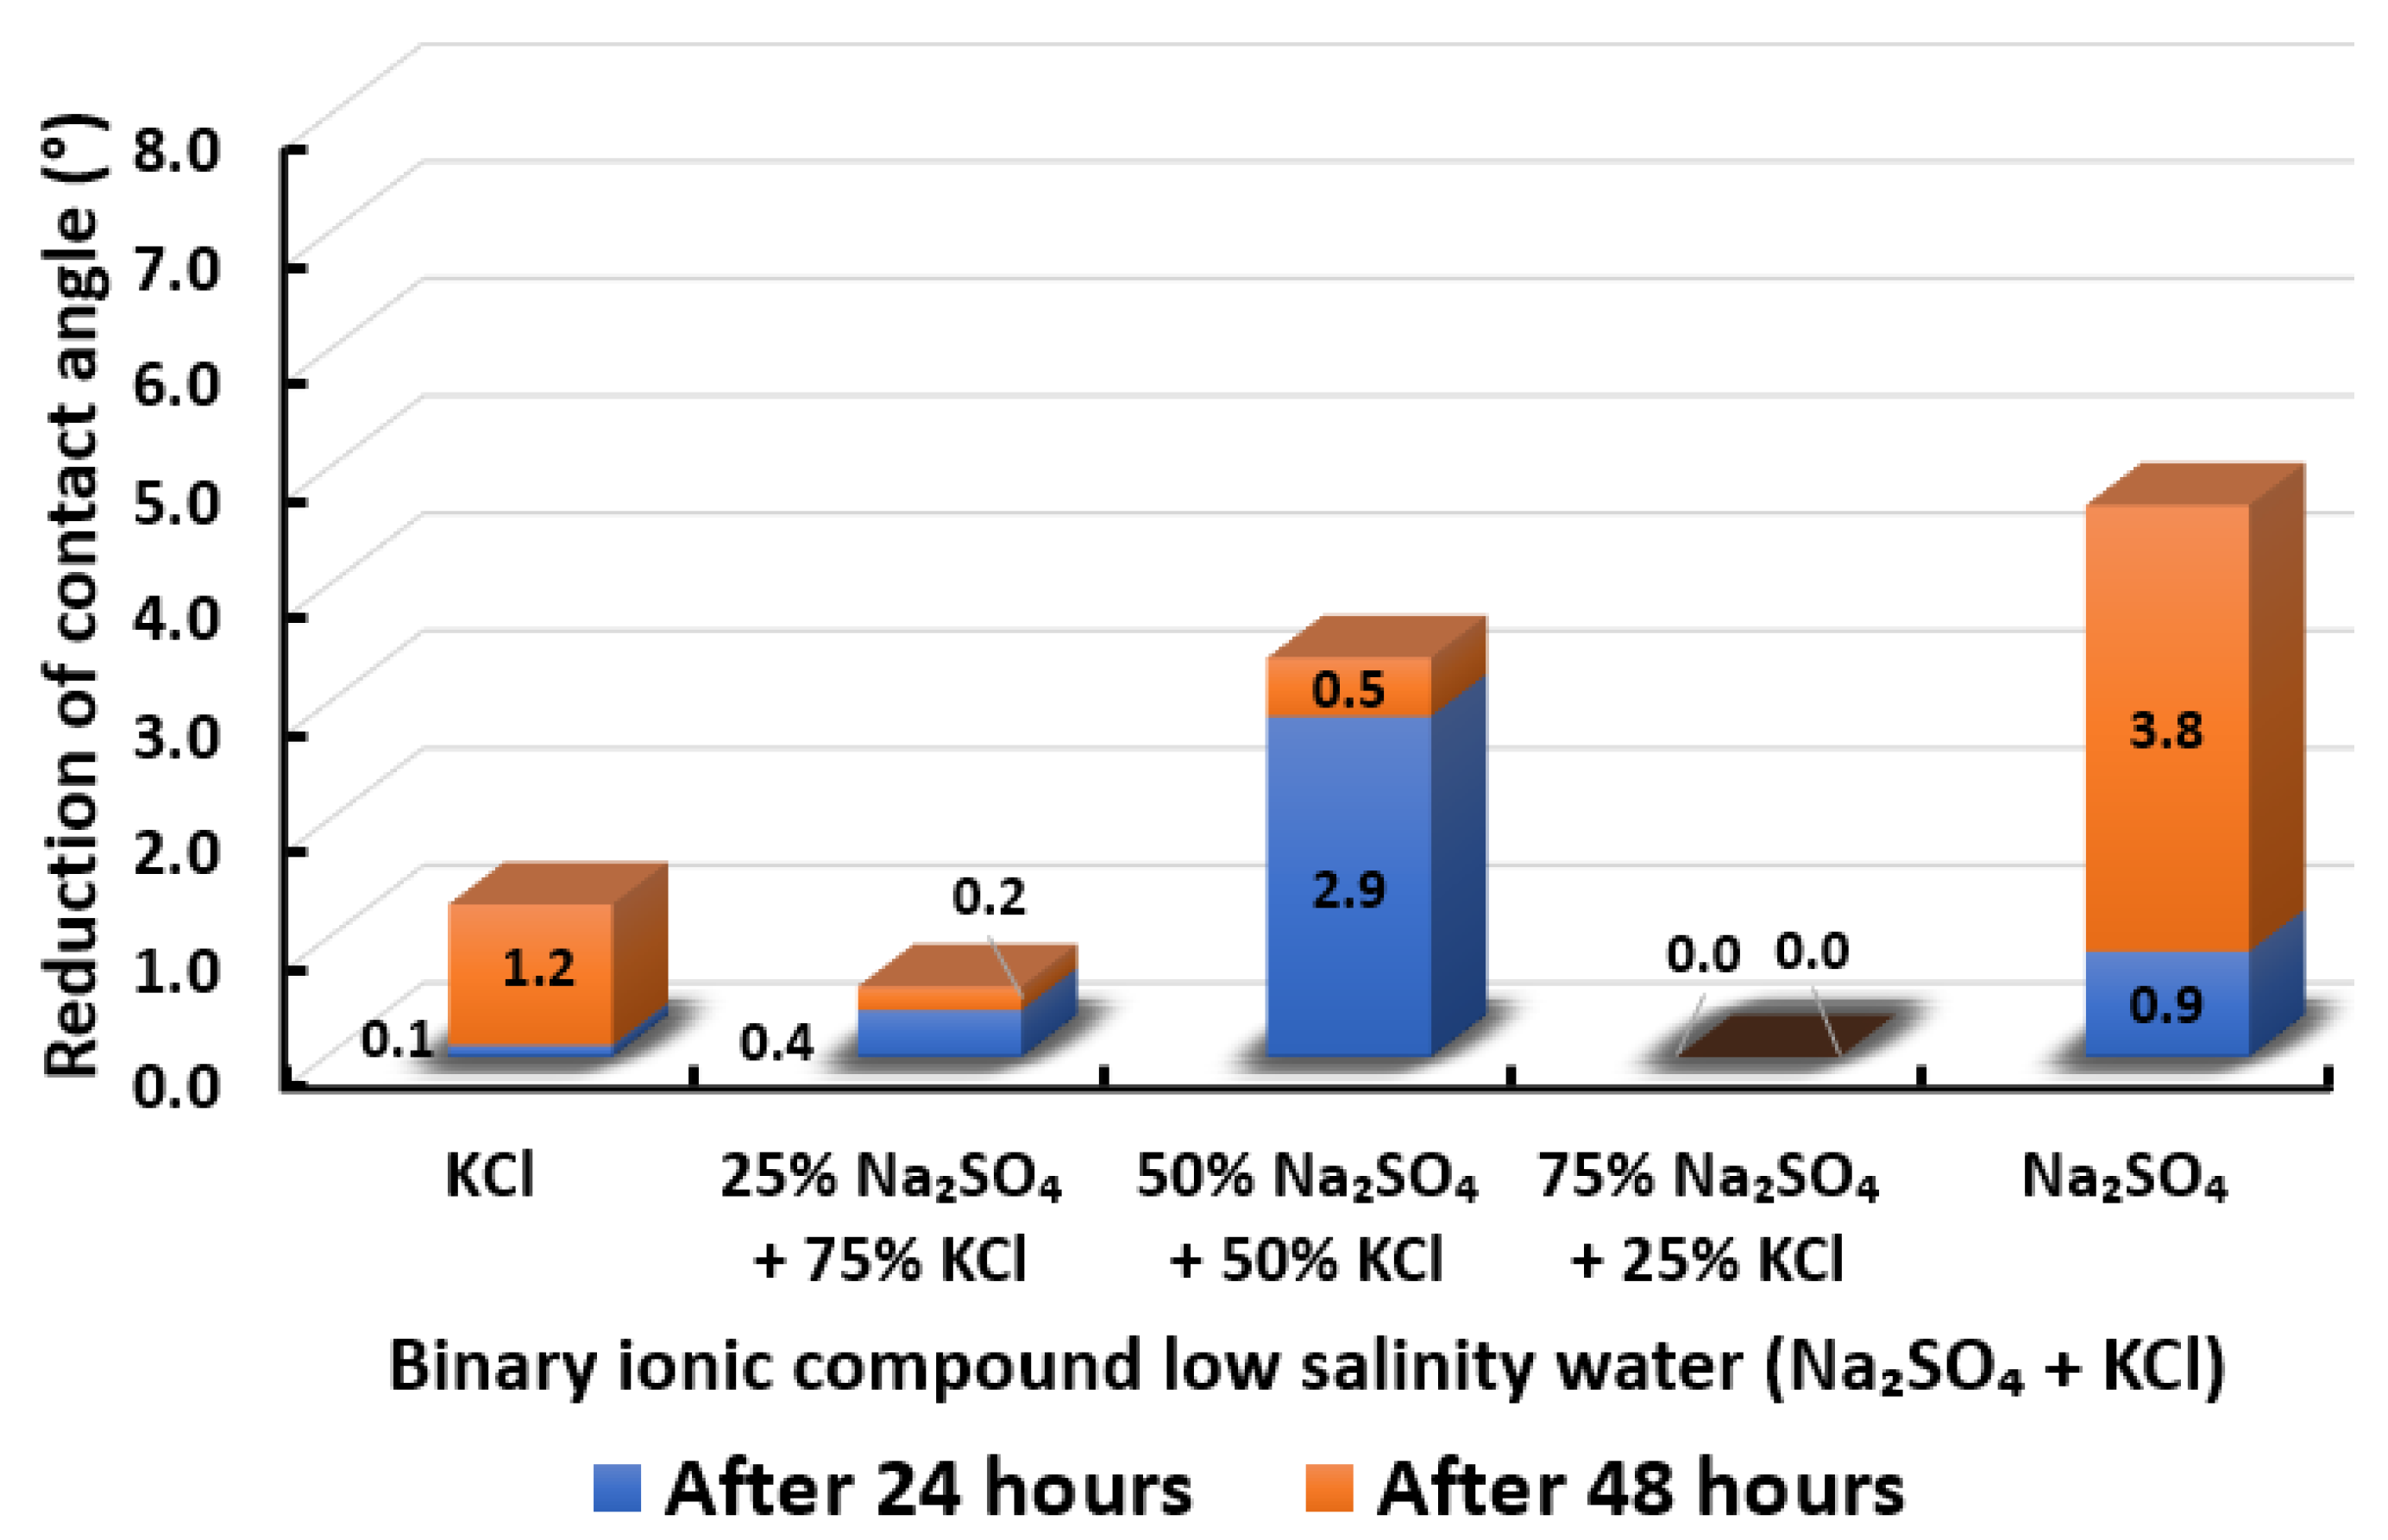
3.2.8. Binary Ionic Compounds Smart Water Solutions NaSO + KCl (3500 ppm)
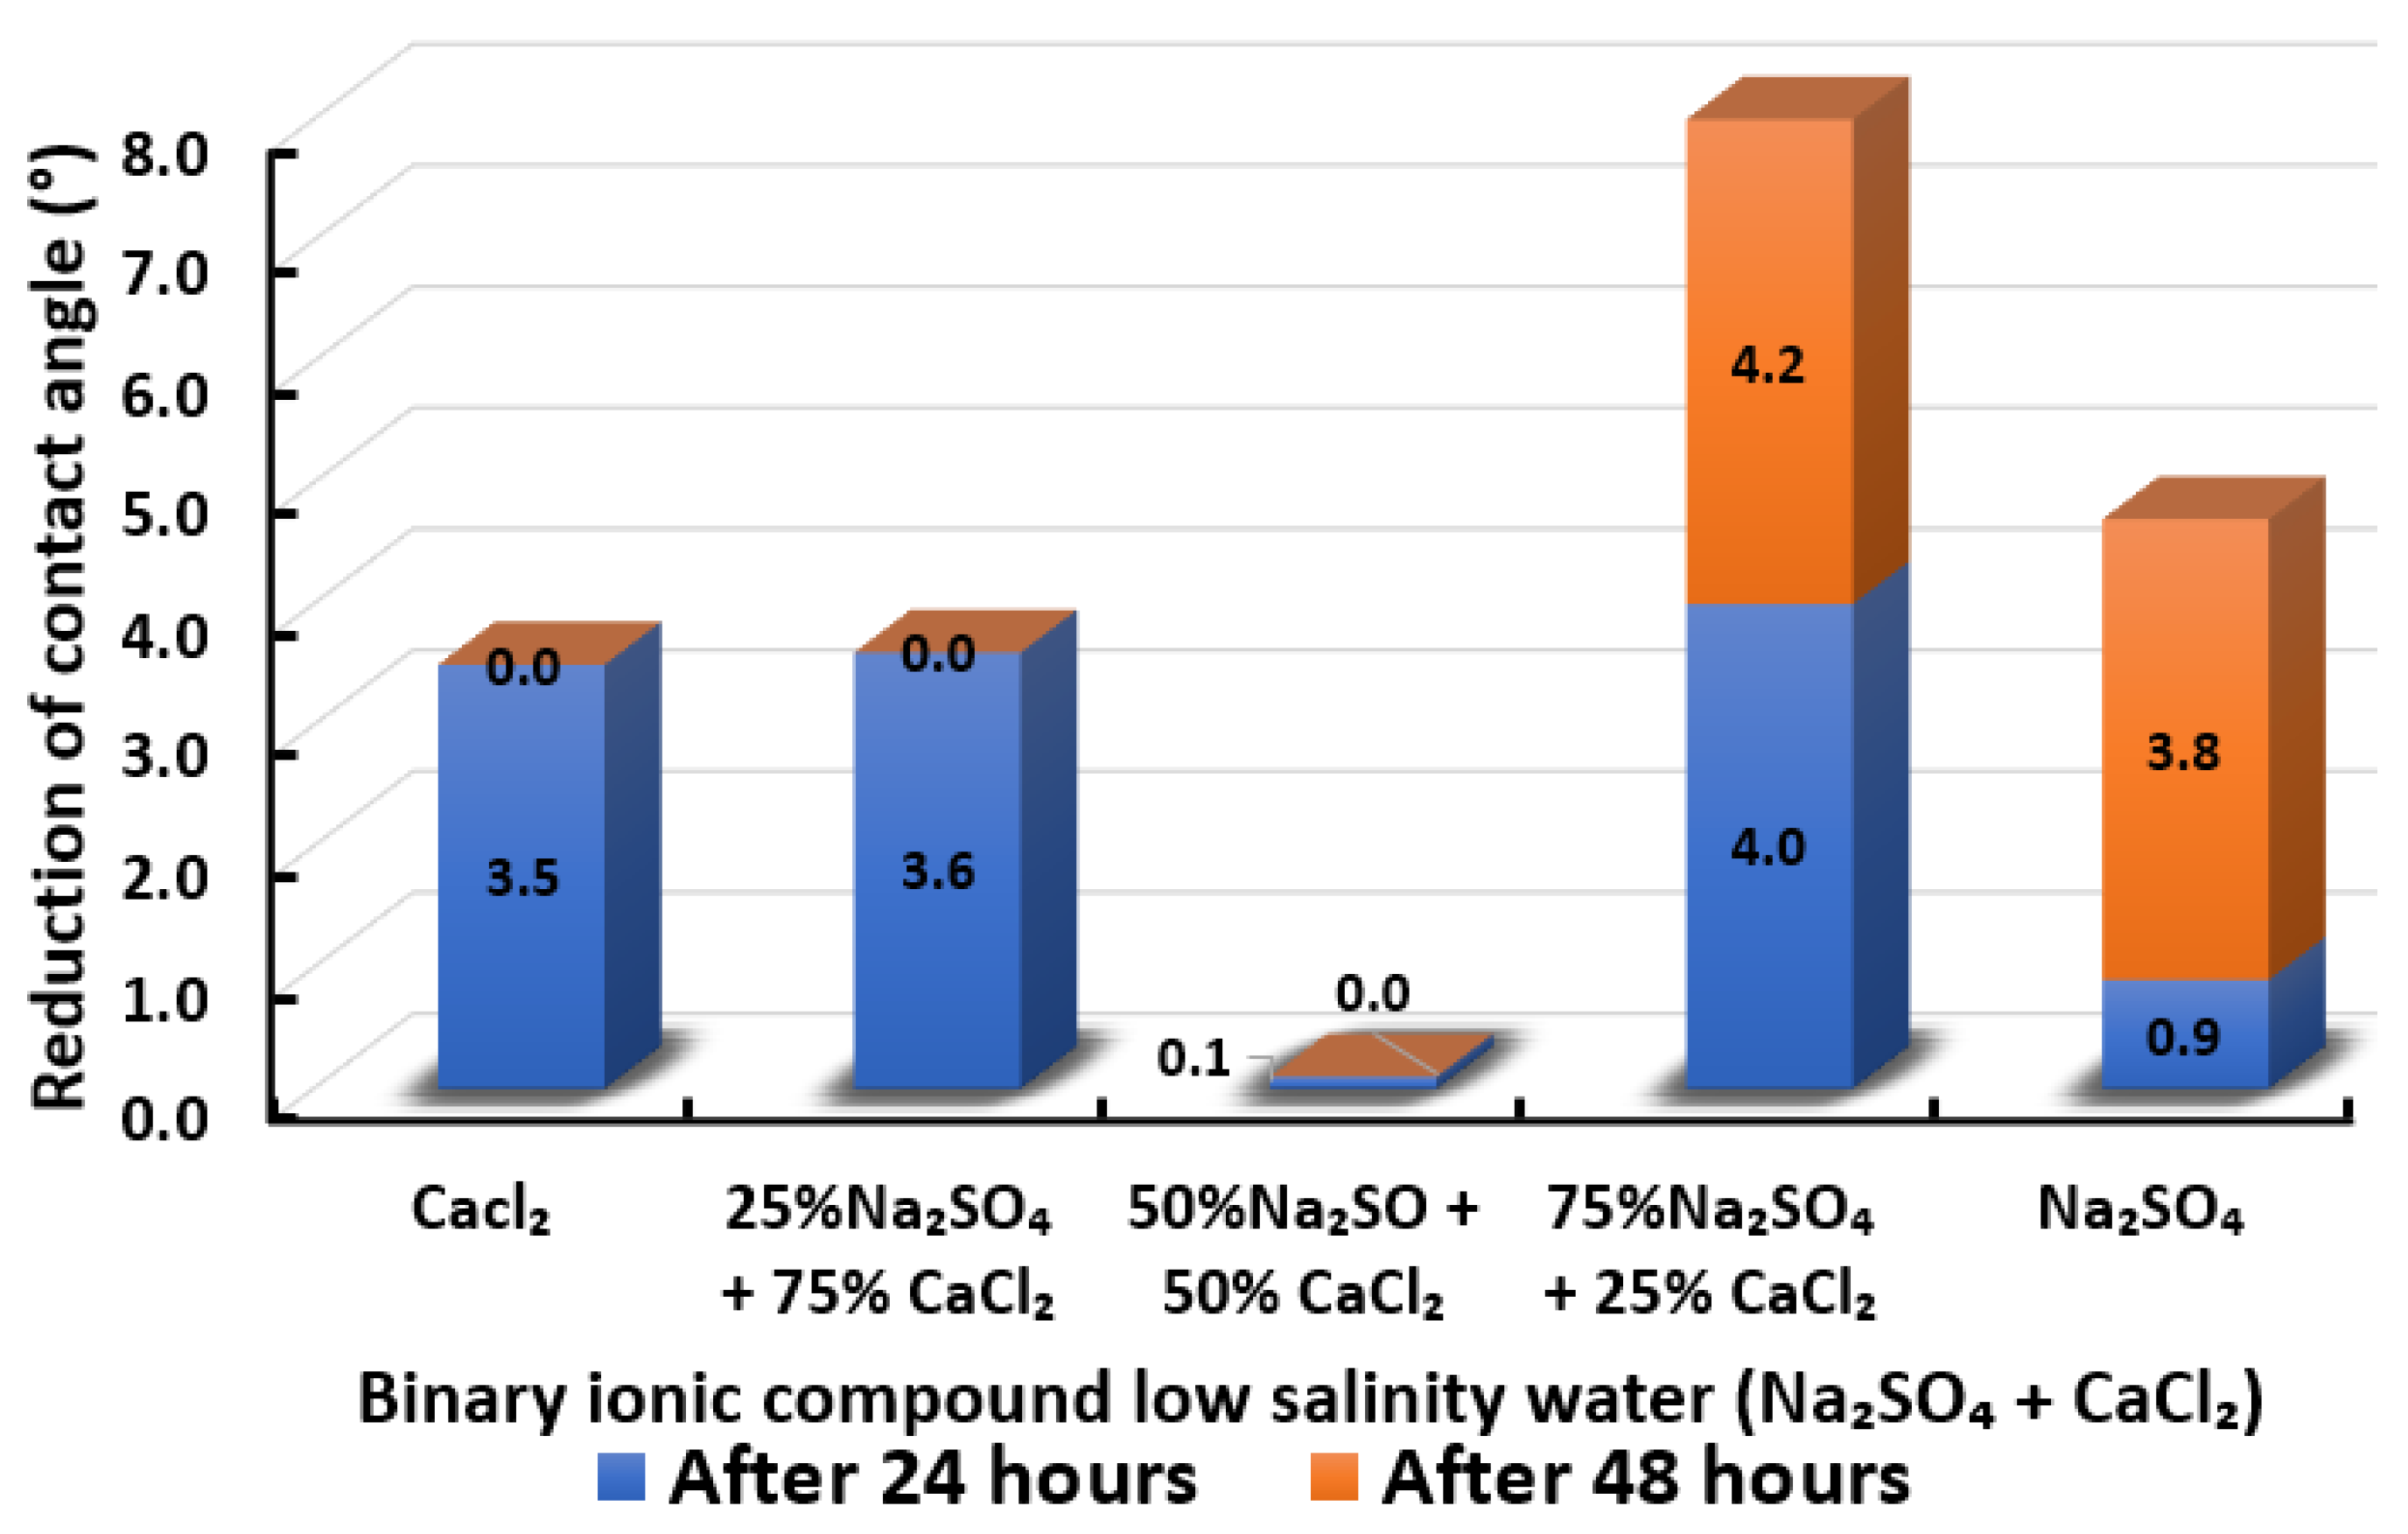
3.2.9. Binary Ionic Compounds Smart Water Solutions NaSO + CaCl (3500 ppm)
3.2.10. Selection of Smart Water Solutions (1750 ppm and 3500 ppm)
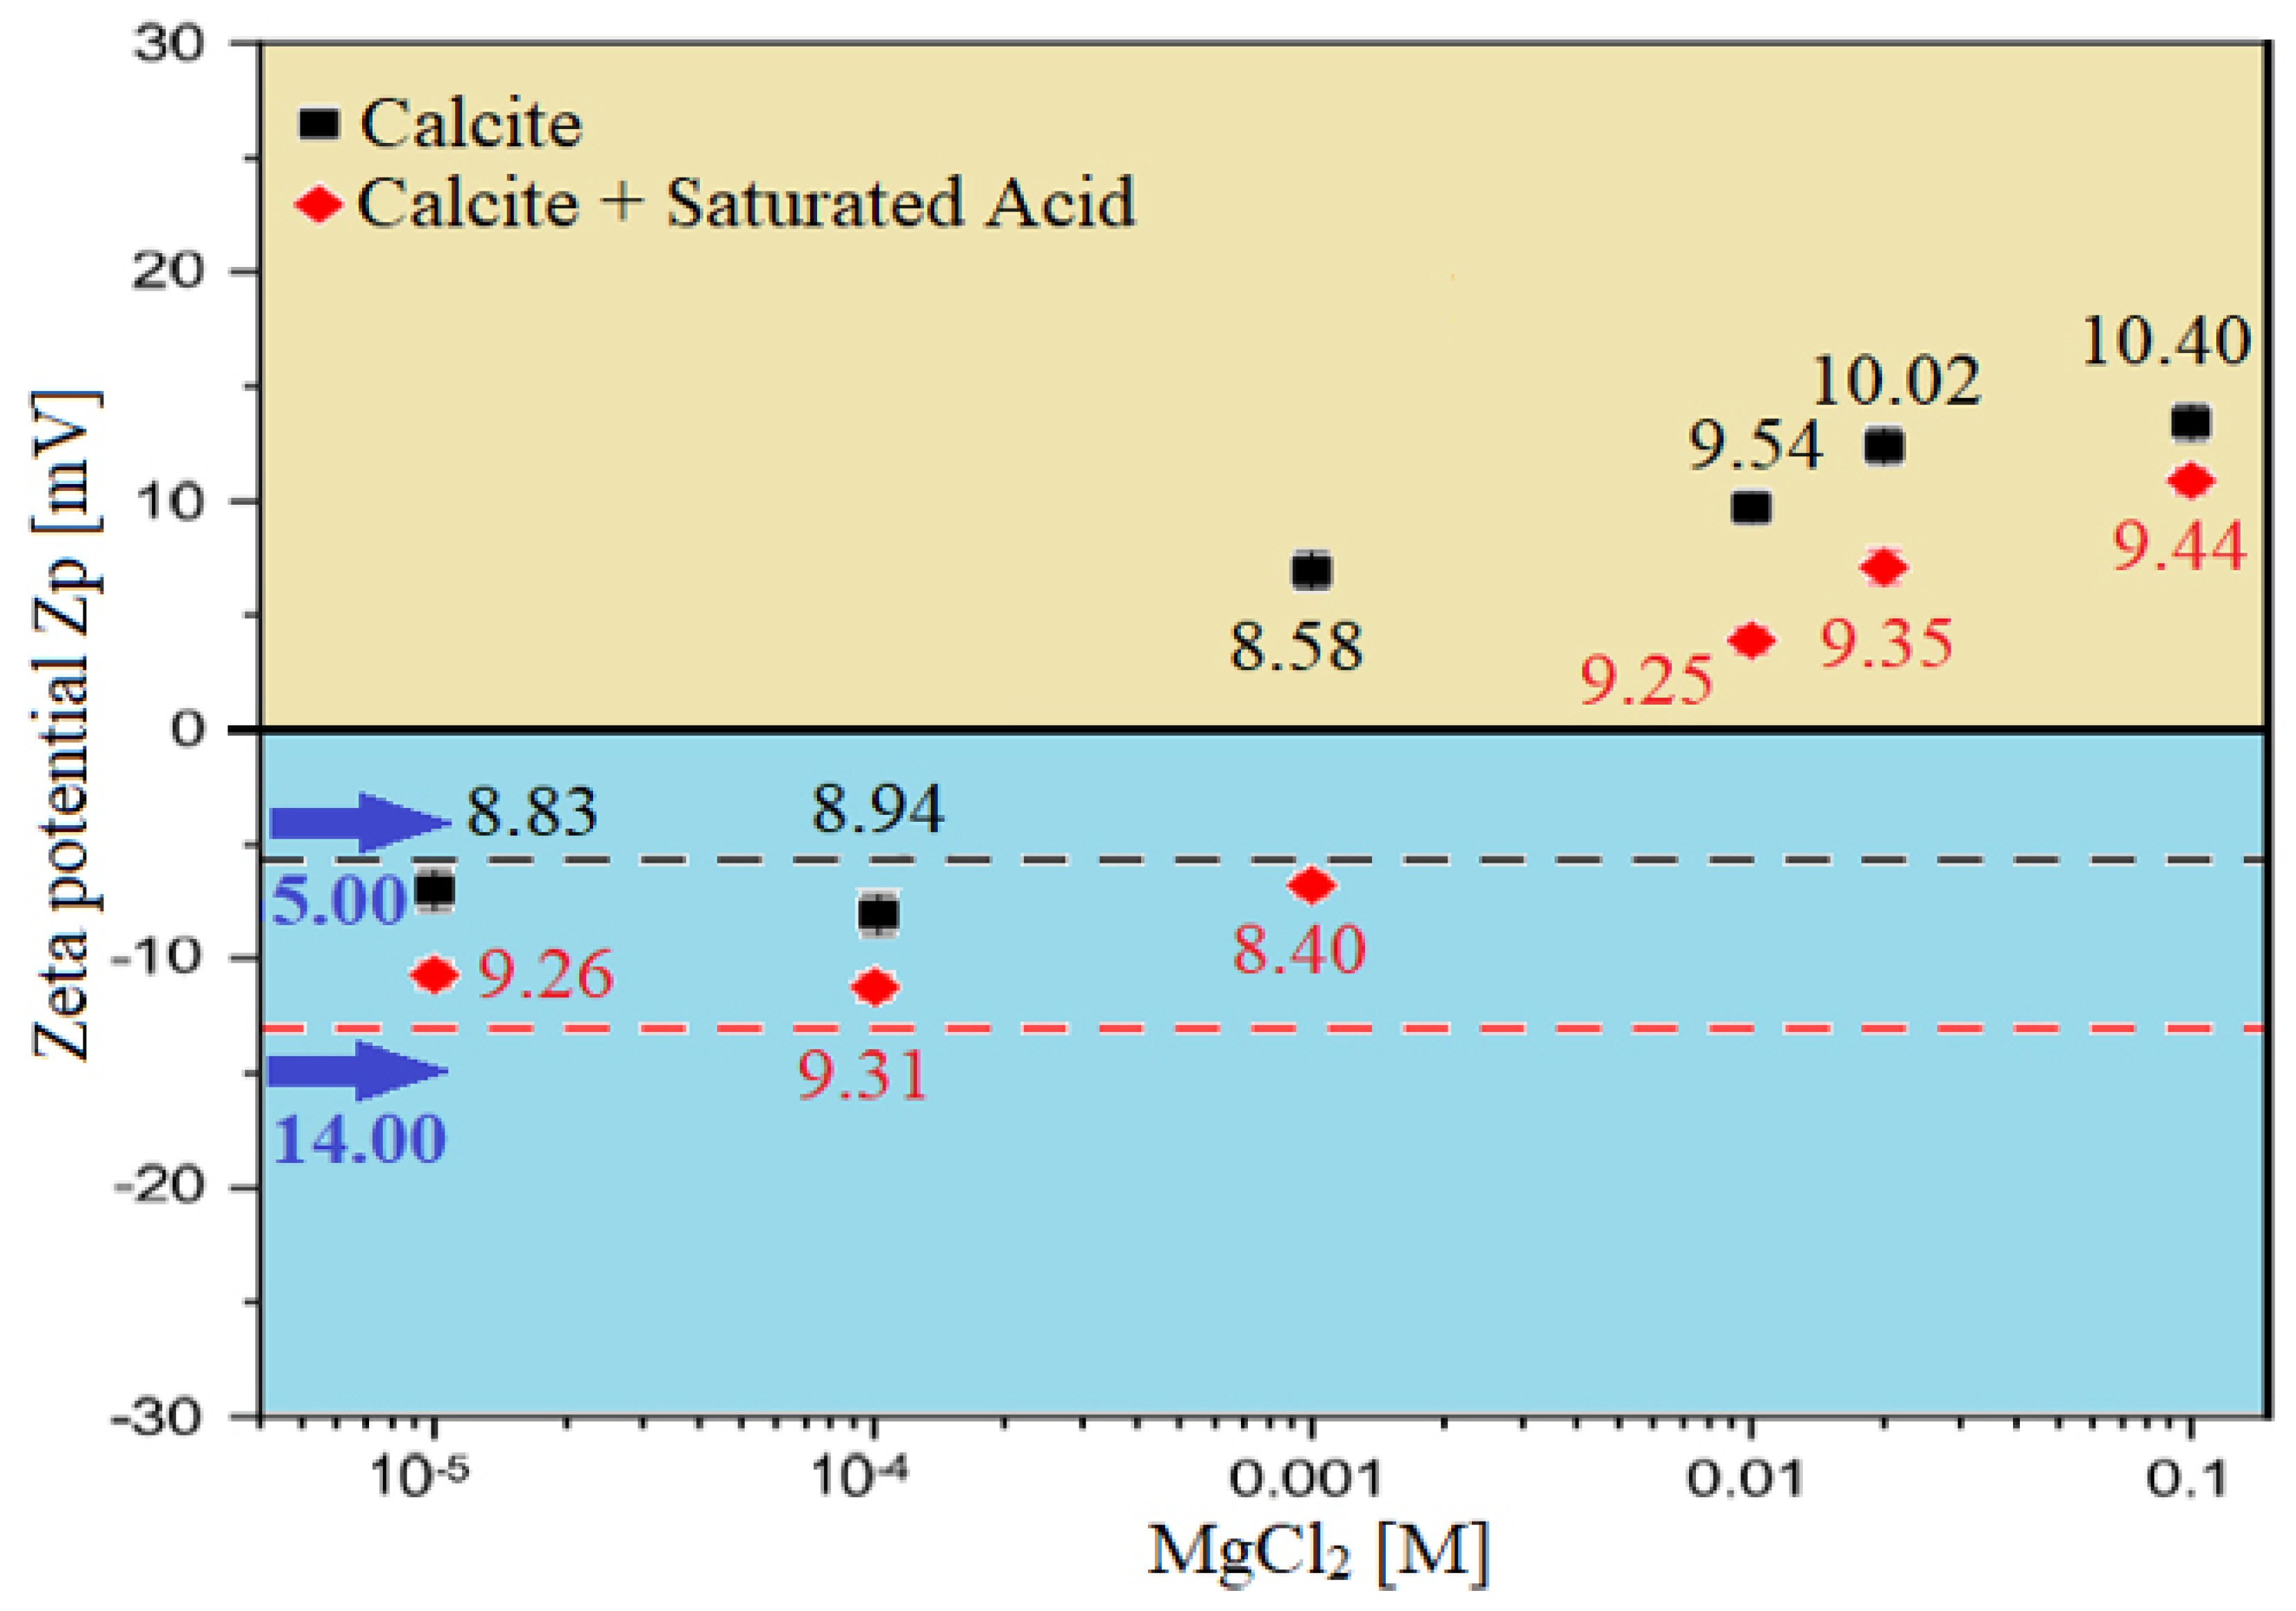
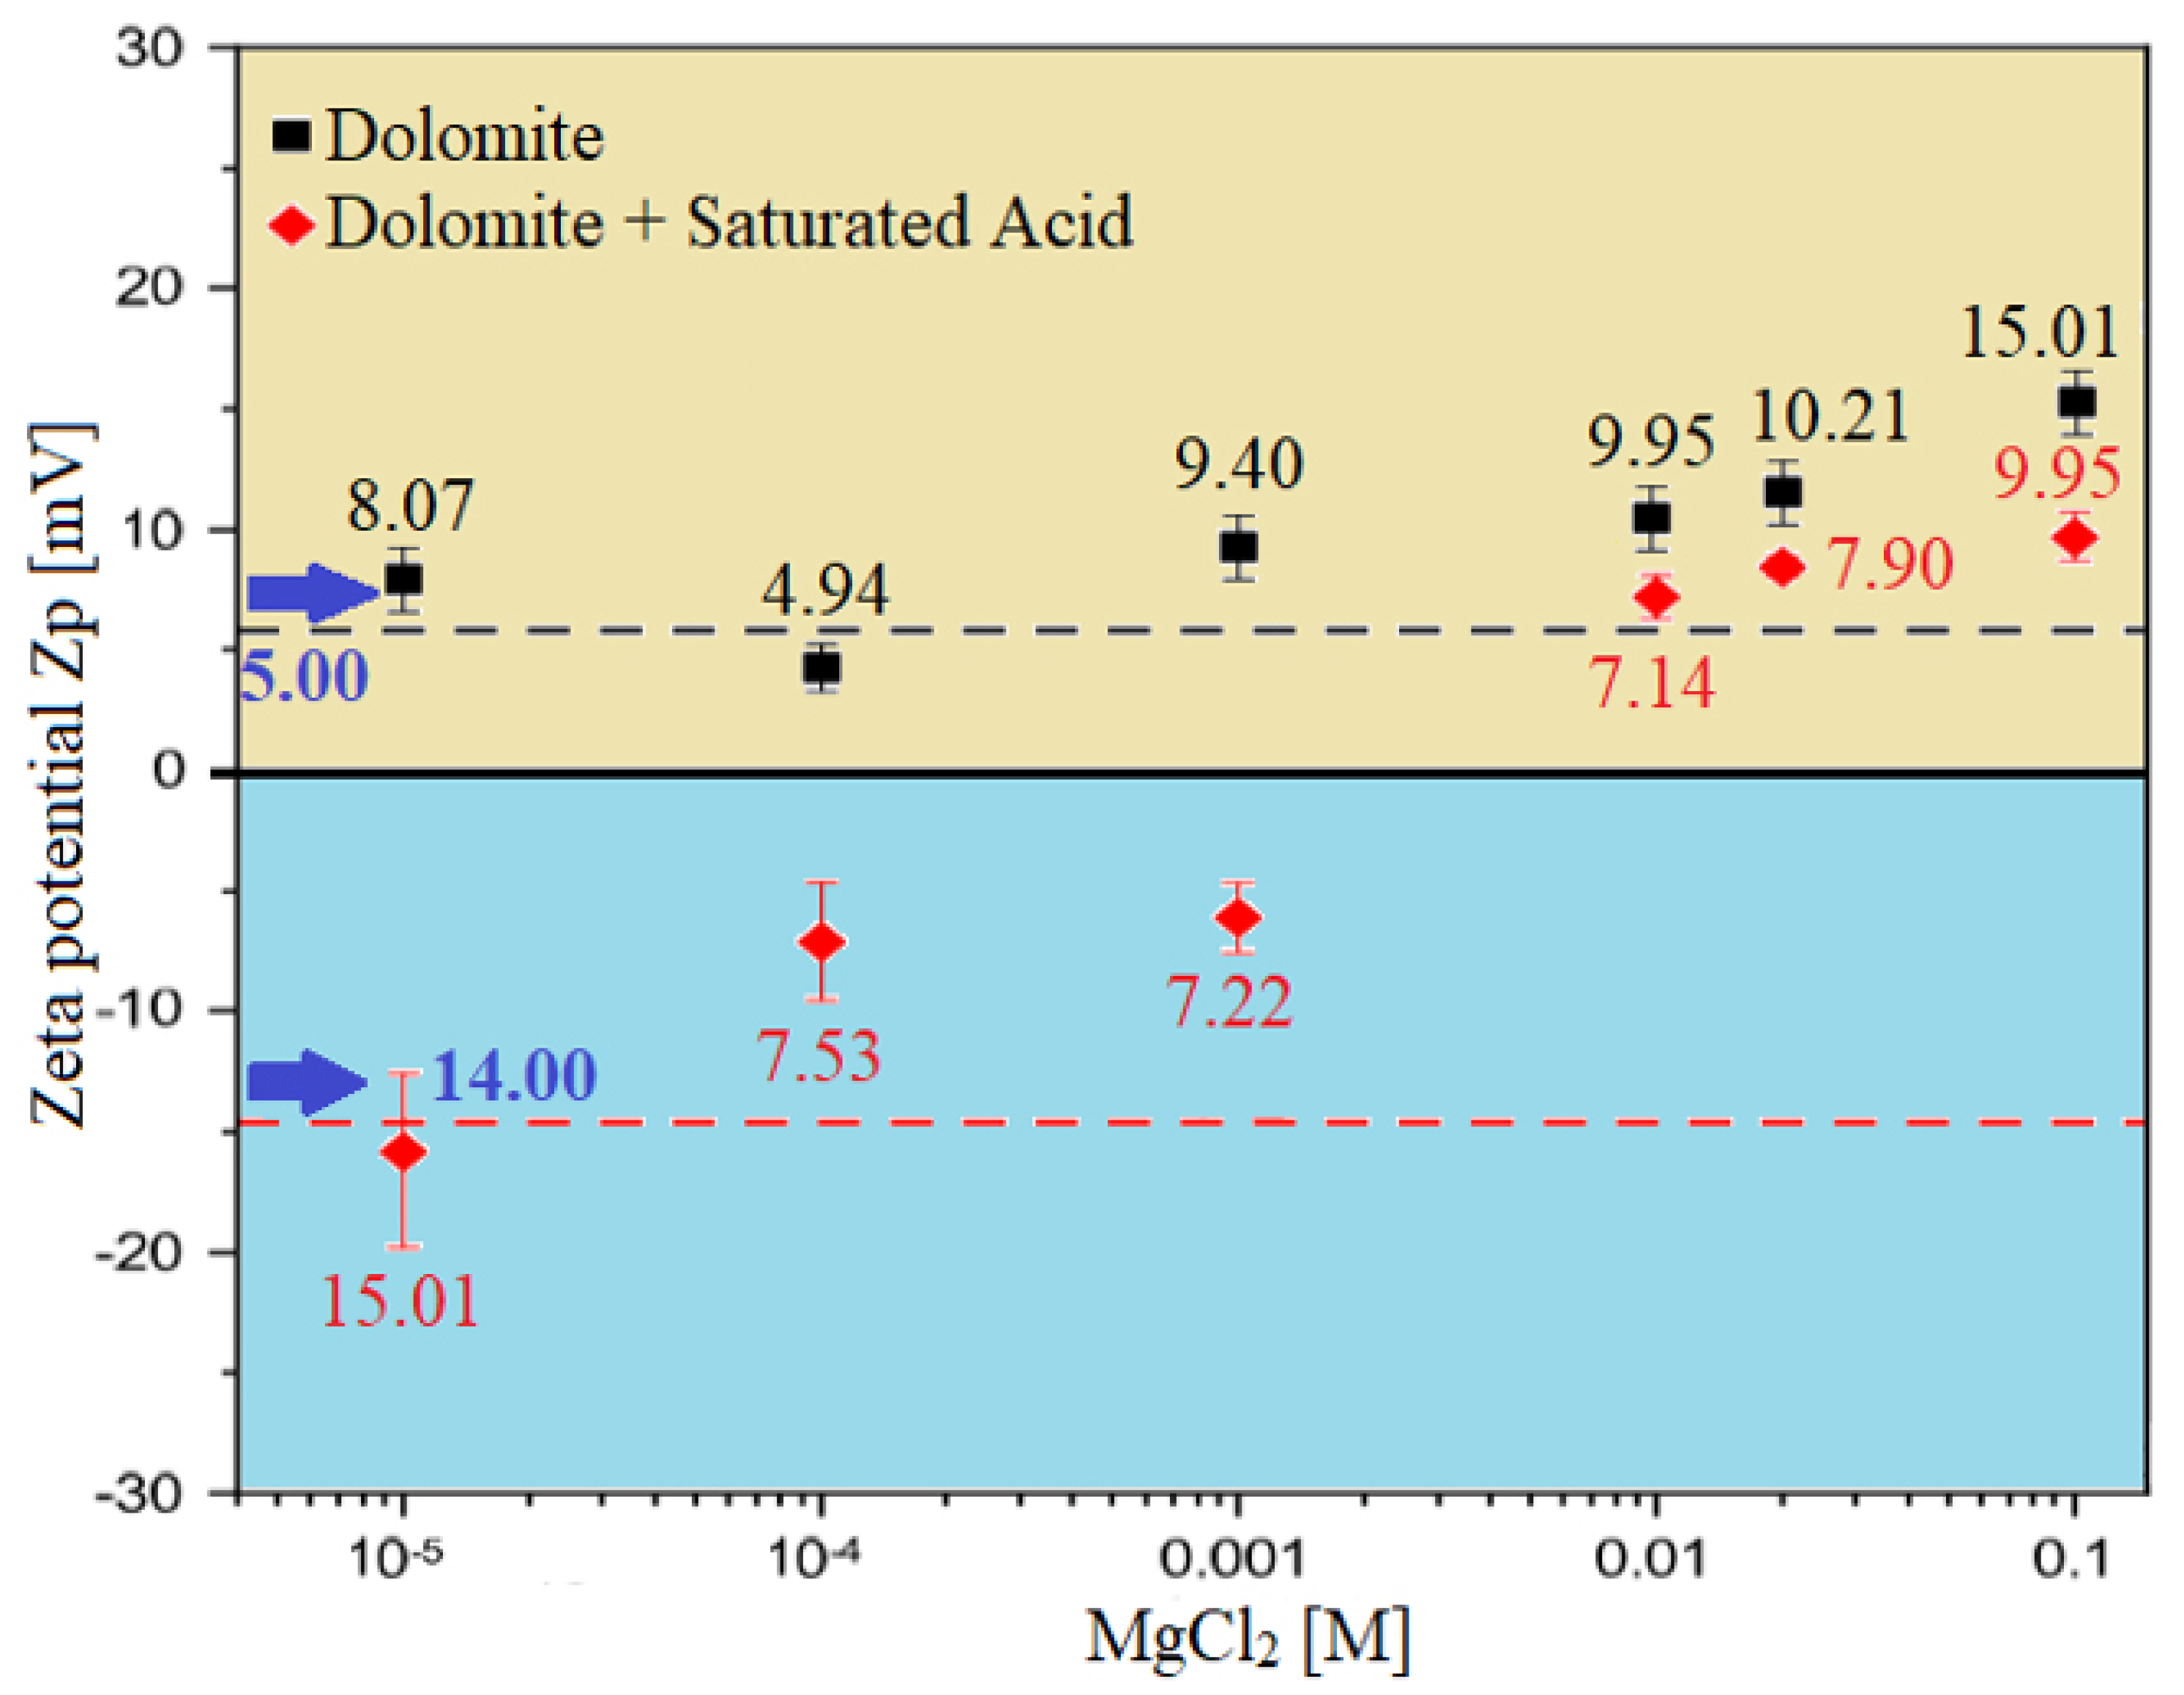
3.3. Zeta Potential Test (ZPT)
3.3.1. Zeta Potential at Brine–Rock Interface
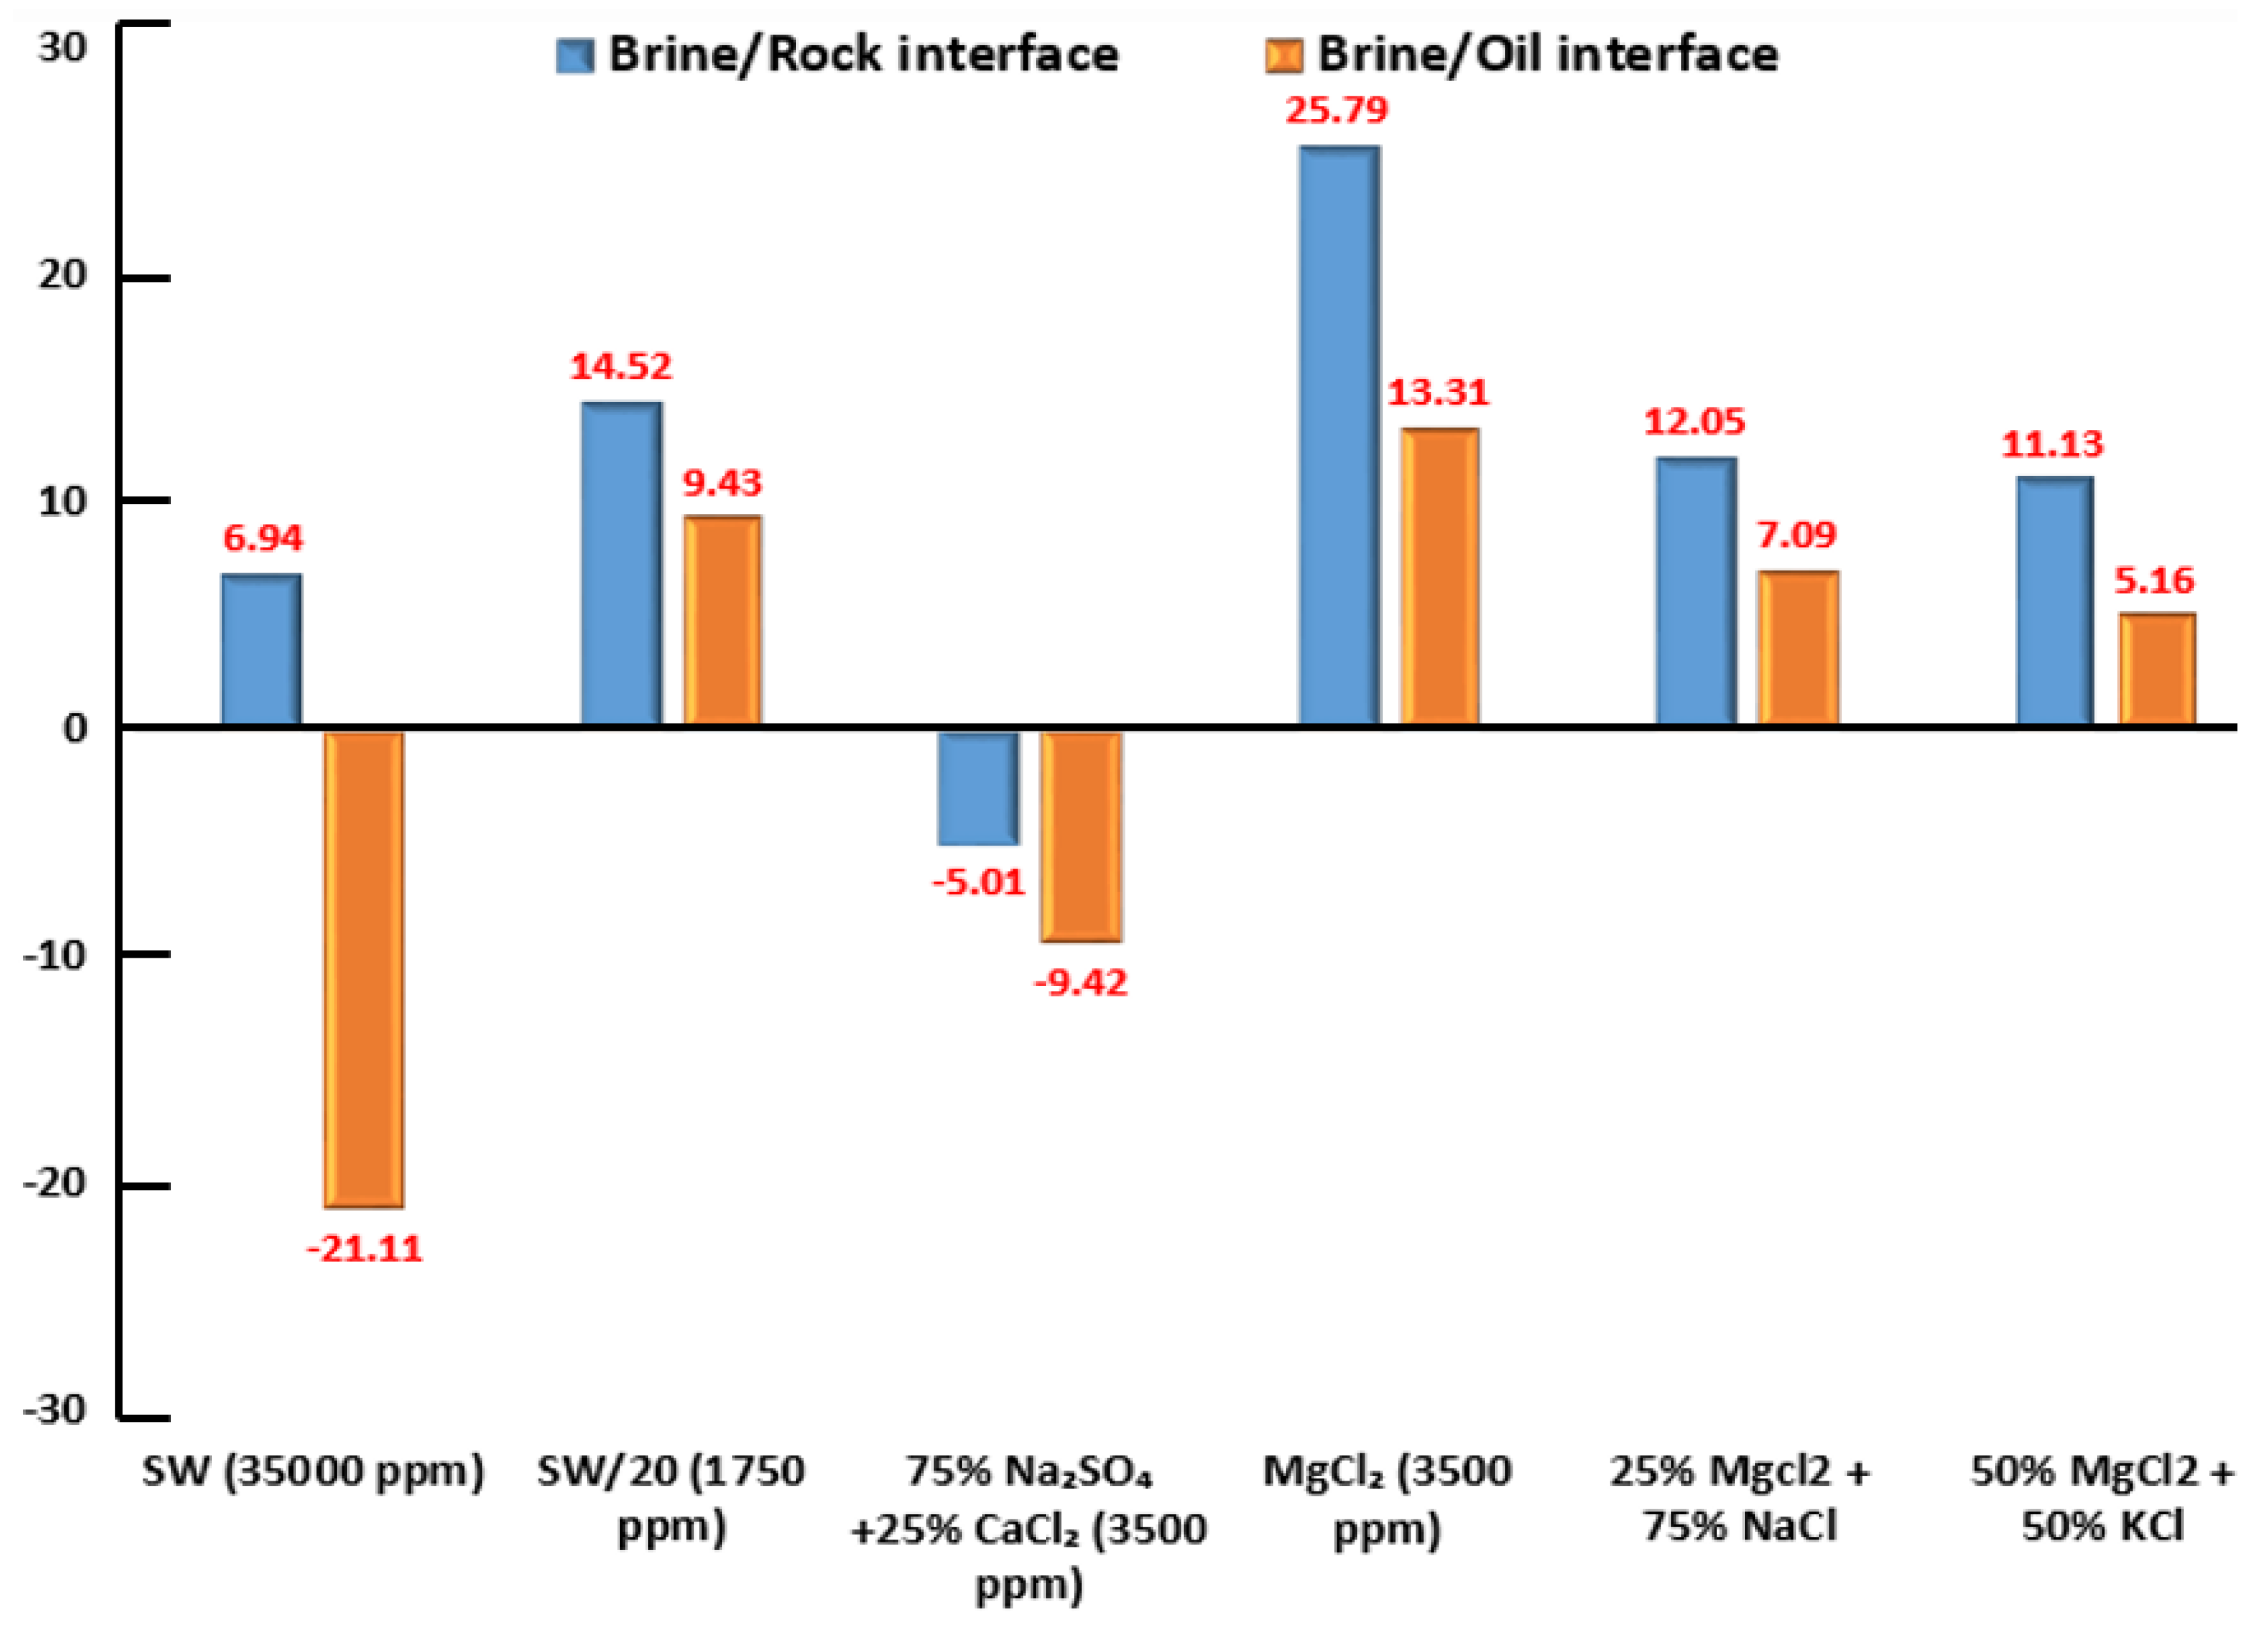
3.3.2. Zeta Potential at Crude Oil-Brine Interface
3.3.3. Interaction between Two Interfaces
3.4. Aqueous Stability Test (AST)
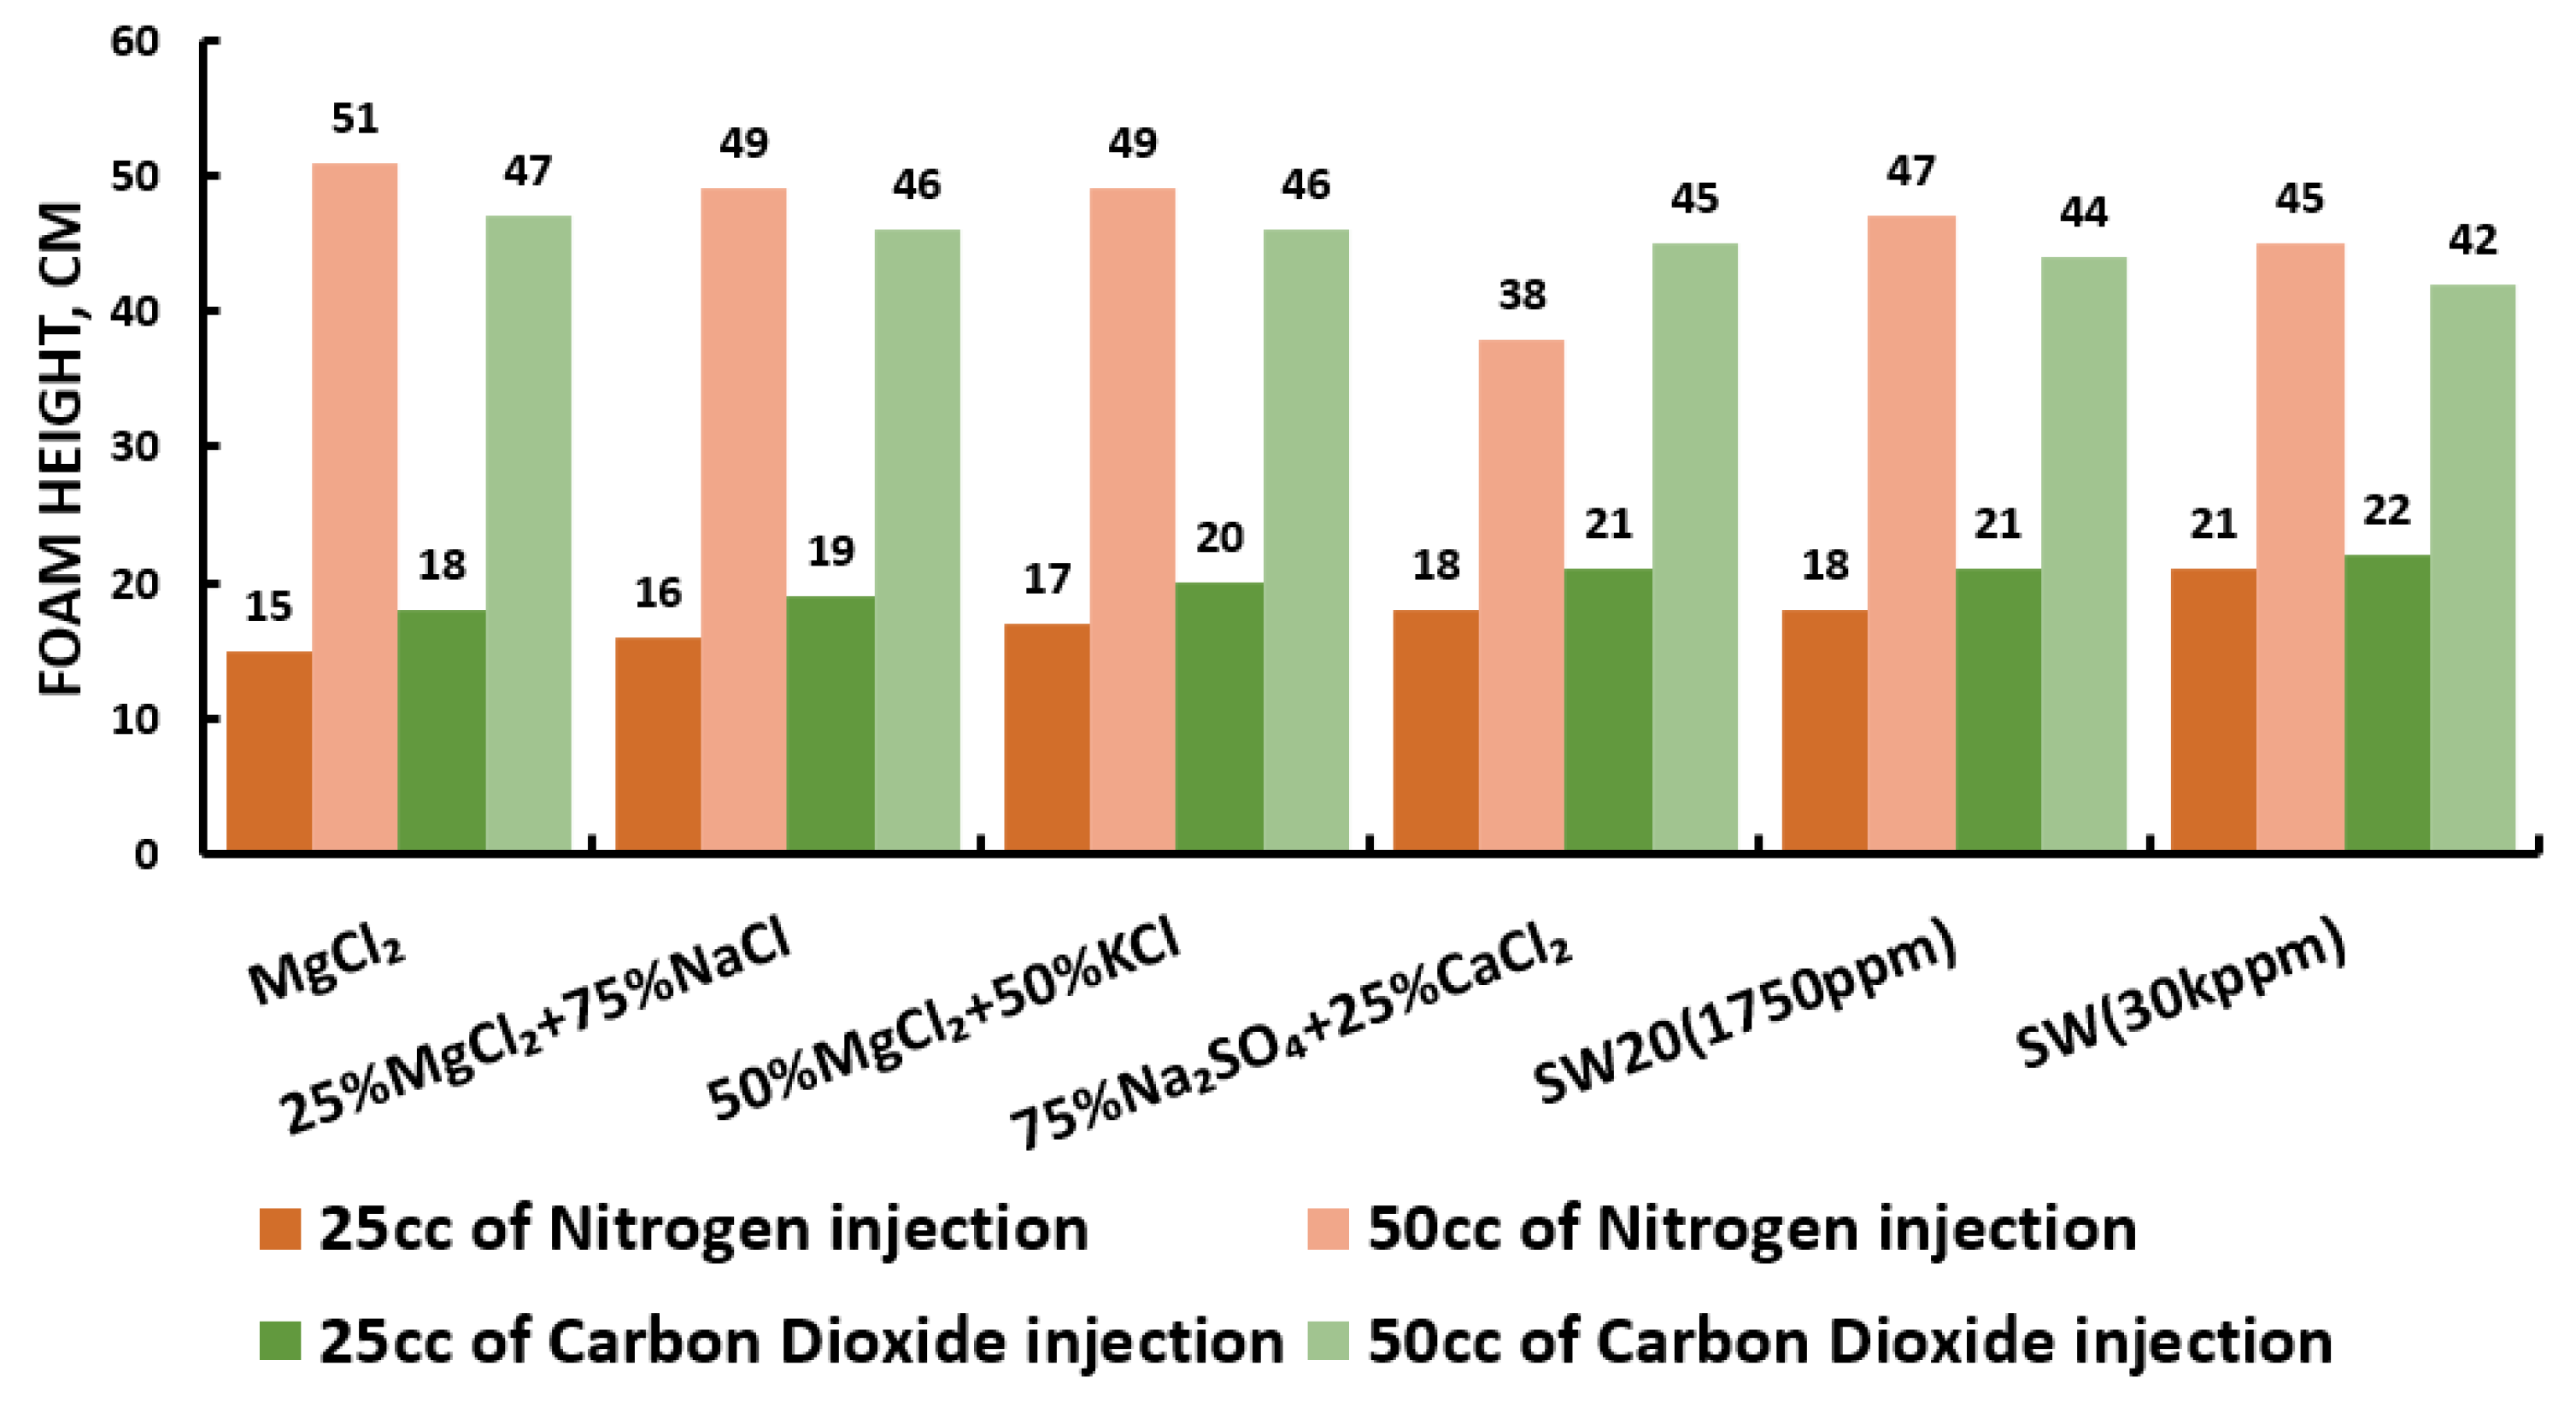
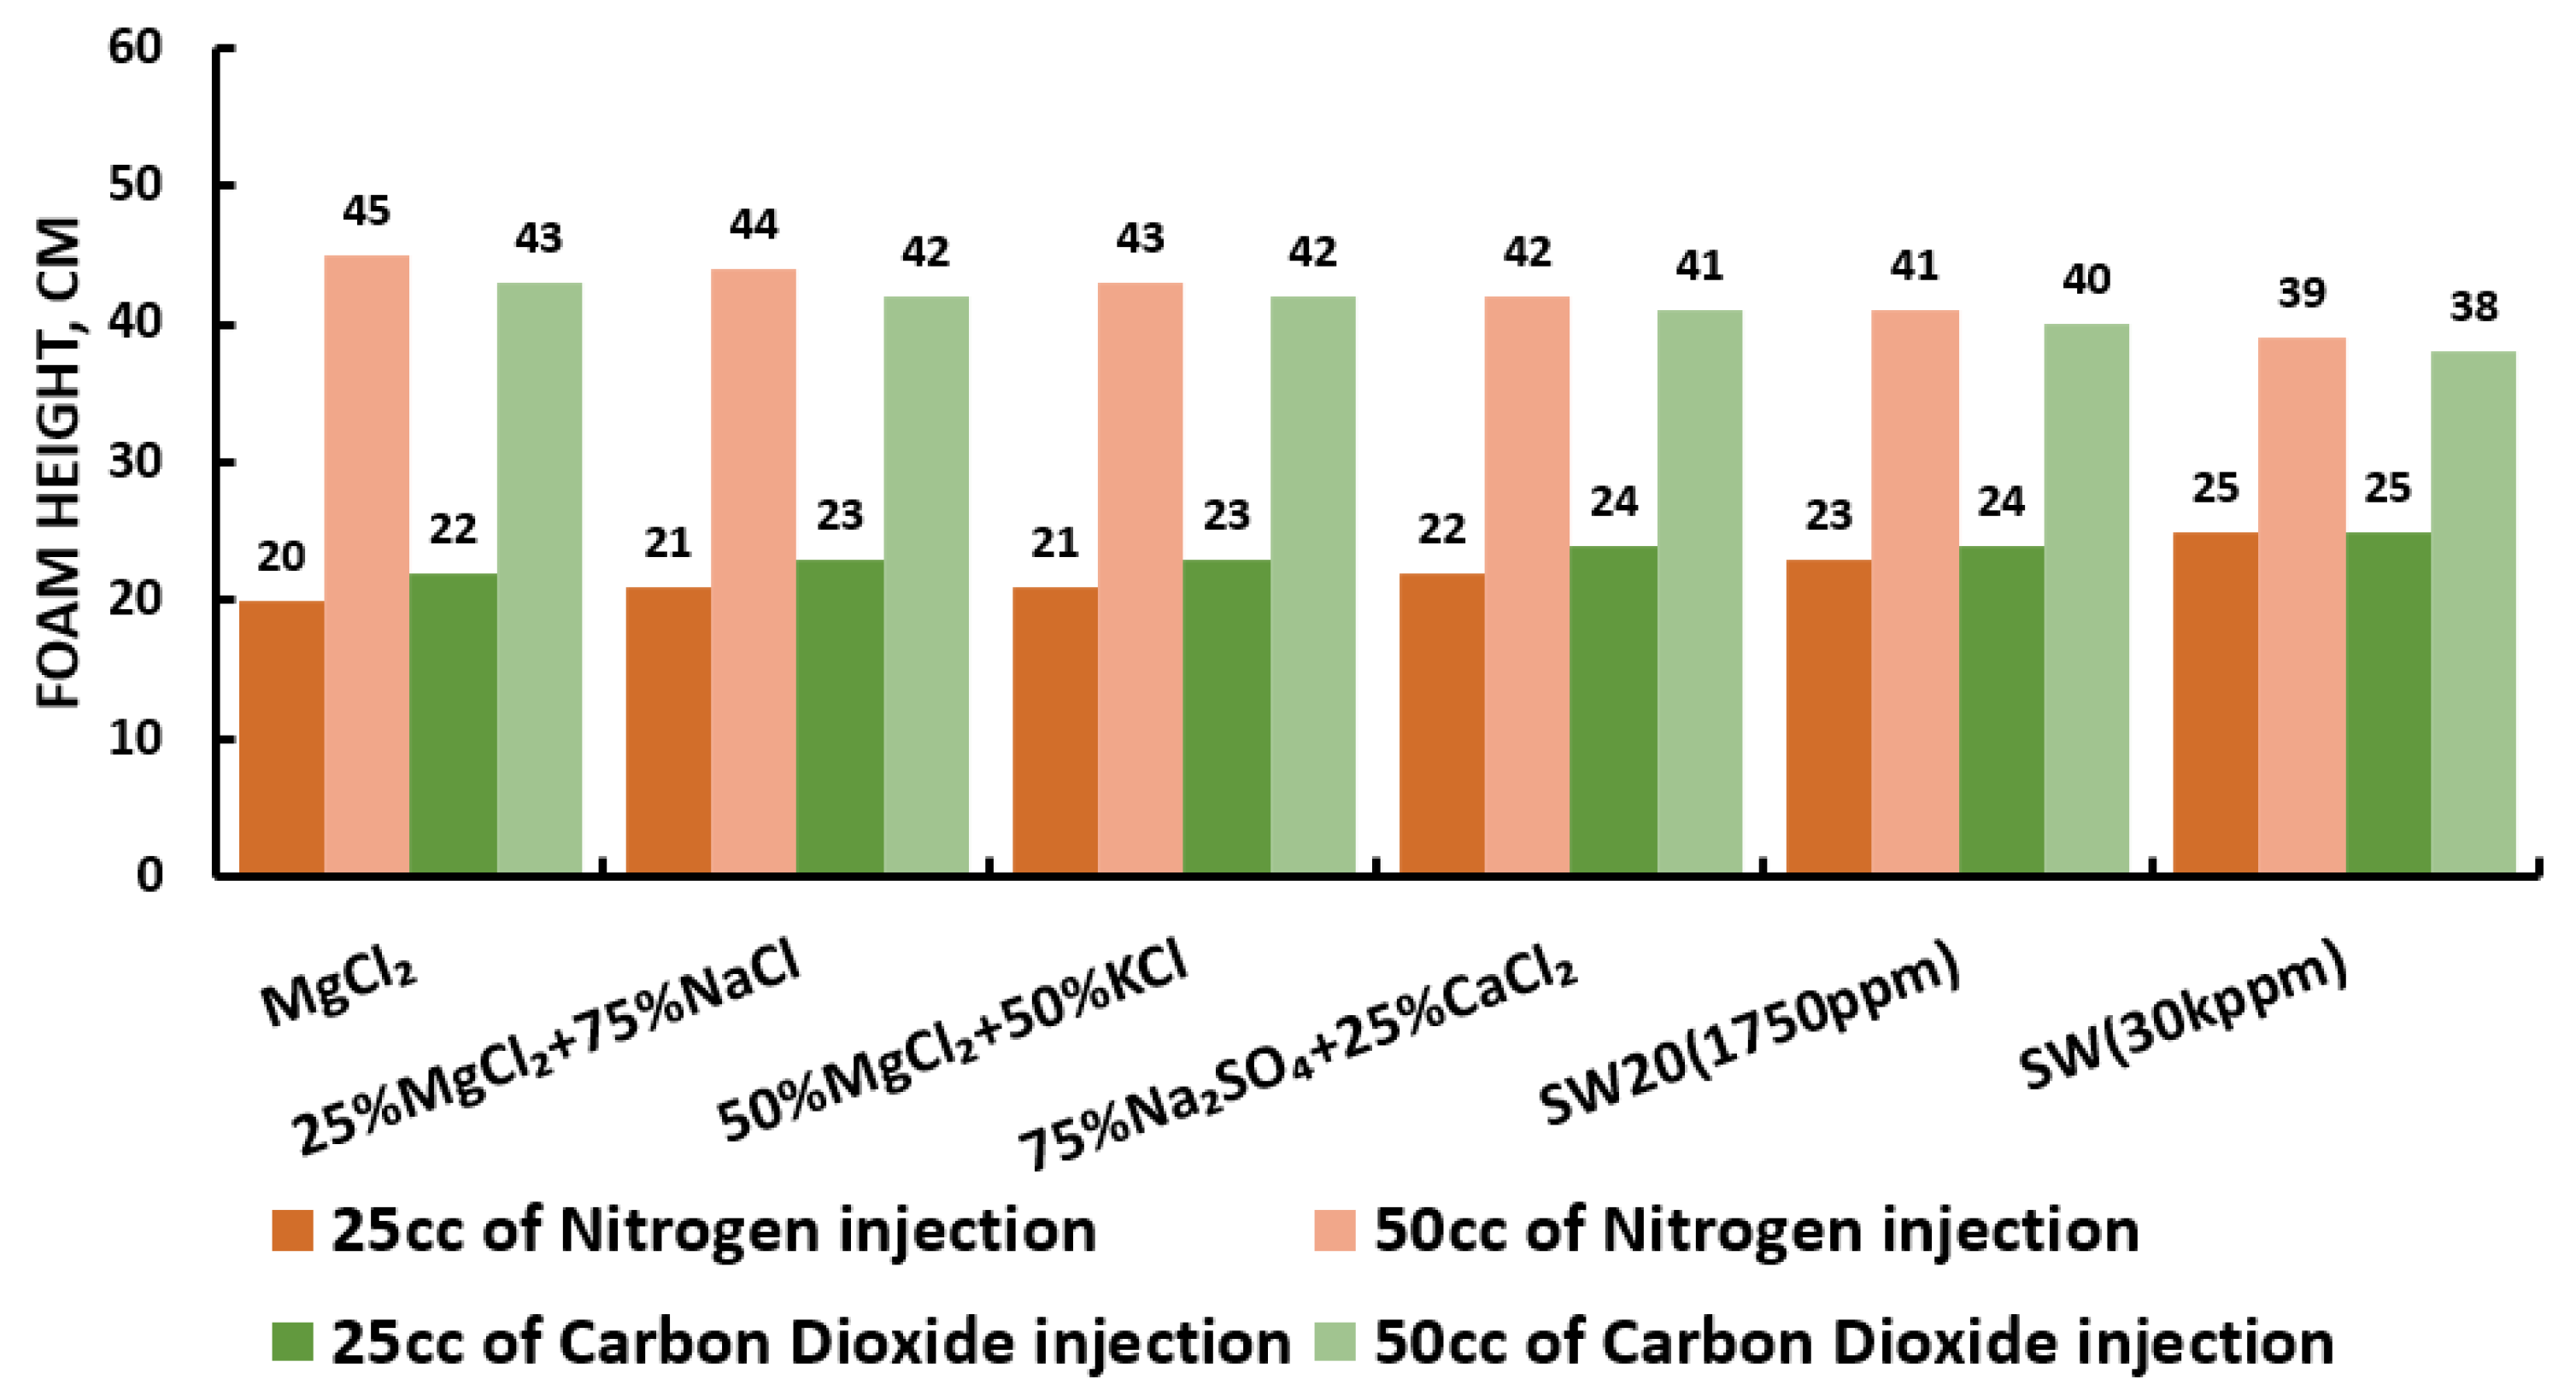
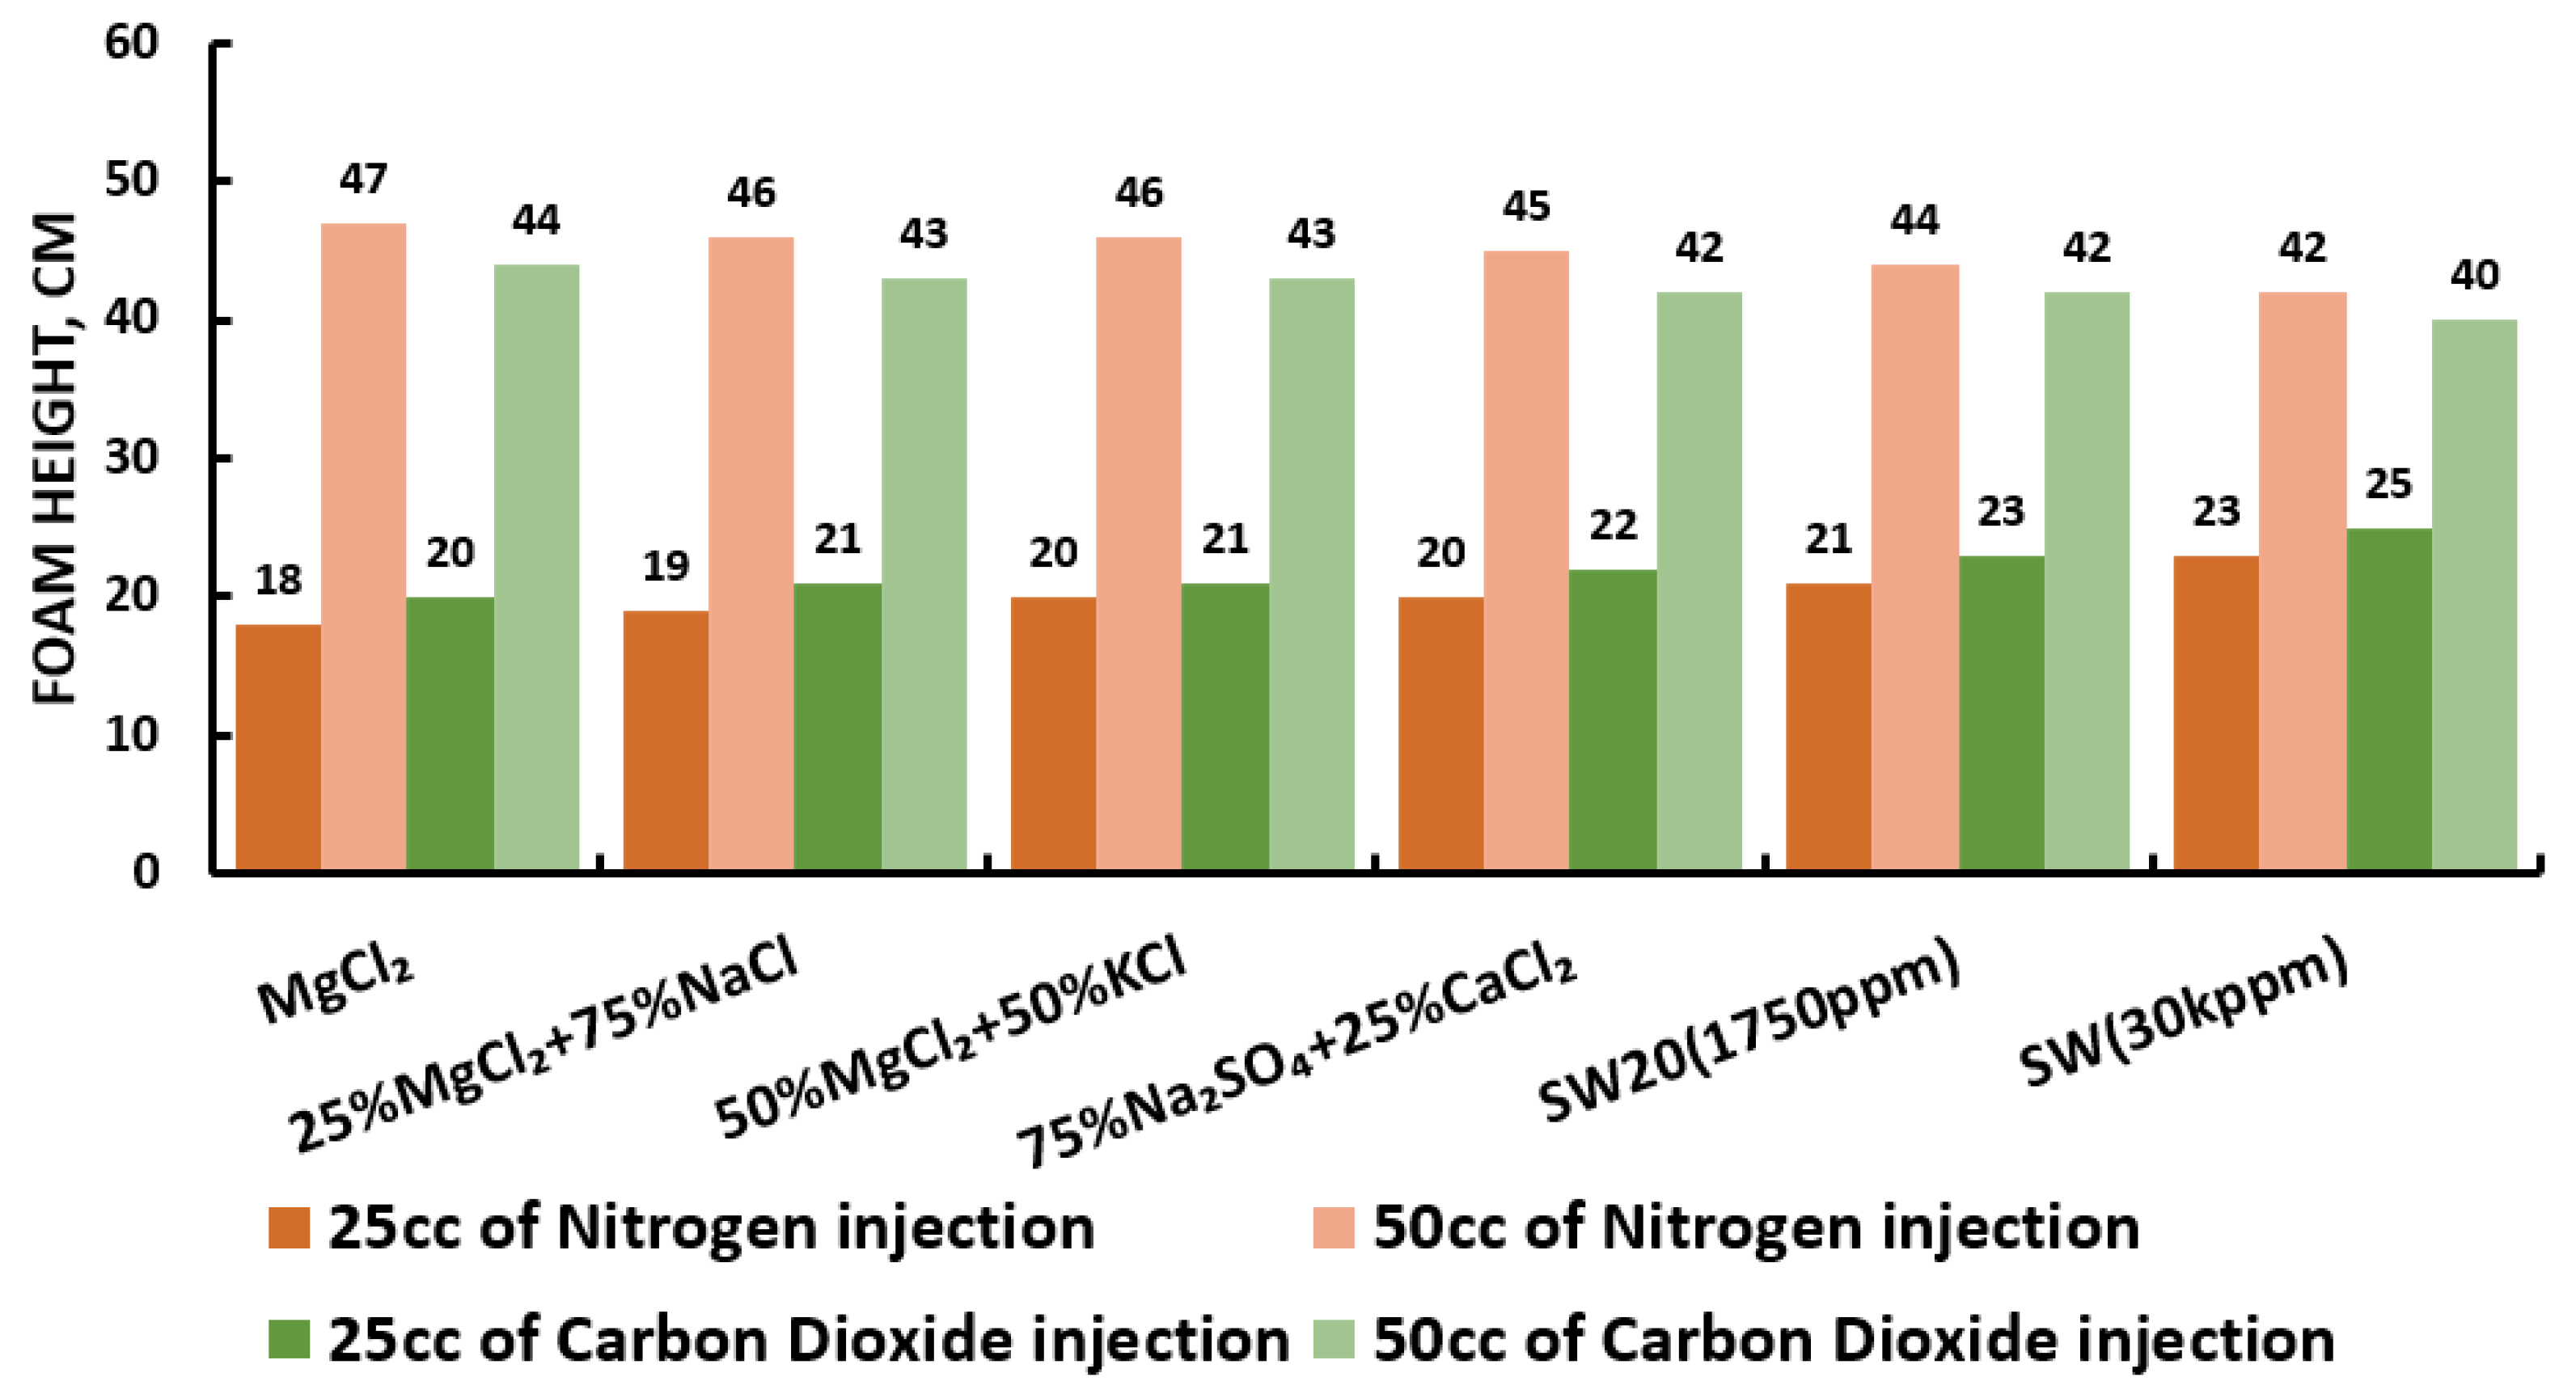
3.5. Foamability and Foam Stability Test (FT and FST)
3.6. Core-Flooding Test
- Core sample properties: In all injection scenarios we have used Indiana limestone (ILS) core samples with similar petrophysical properties (known as sister core samples). Our ILS cores samples are in the same range of permeability (i.e., 50–100 mD) and porosity (14–19%), as shown in Table 6 and Table 7.
- Crude oil properties: There were no significant contrasts in the two crude oil (Type A and Type B) properties in terms of API degrees of 28.42 and 30.26, respectively, TAN of 1.17 and 0.81 mgKOH/g, respectively, and TBN of 0.23 and 0.59 mgKOH/g, respectively, as specified in Table 2.
4. Summary and Conclusions
- Our designed smart water (SW) has the characteristic of dual improvement effect resulting in compounded oil displacement. Both the fluid–rock (i.e., brine–rock) and fluid–fluid (i.e., brine/oil) interactions are affected by the designed SW solutions.
- To identify the optimum smart water solutions, wettability measurements revealed that 100% MgCl (i.e., 3500 ppm) (PDIs) and 20-times diluted seawater (1750 ppm) can alter the surface charge and consequently has a significant impact on Indiana limestone (ILS) surface charge modifications, as shown in Figure 14 and Figure 15 respectively. On the contrary, the formation water (FW) solution represent the worst-case scenario in altering the surface charge of the ILS core samples as indicated in Figure 14.
- These altered surface charges at both rock/fluid and fluid/fluid interfaces cause the brine/rock interface and the brine/oil interface to have the same sign (e.g., in the case of 100% MgCl SW solution), resulting in a stable water film as shown in Figure 26 (i.e., zeta potential measurements). In contrast, when the brine/rock interface and the brine/oil interface have different zeta potential signs (e.g., in the case of formation water or FW solution), the water film will collapse (i.e., see Figure 26) [30,31].
- Furthermore, to generate the surfactant aqueous solutions (SAS), four types of surfactants (i.e., anionic and cationic) were mixed with selected smart water solutions candidates at different surfactant concentrations.
- Foamability and foam stability tests using the R5 parameter method were conducted to assess the best SAS formulations that ensure stable foam generation and the propagation inside the porous media during the dynamic mode (i.e., core flooding).
- The highest foam stability was attained at 90% when CTAB + AOS (i.e., 1000 ppm) was mixed with MgCl (i.e., 3500 ppm) and nitrogen.
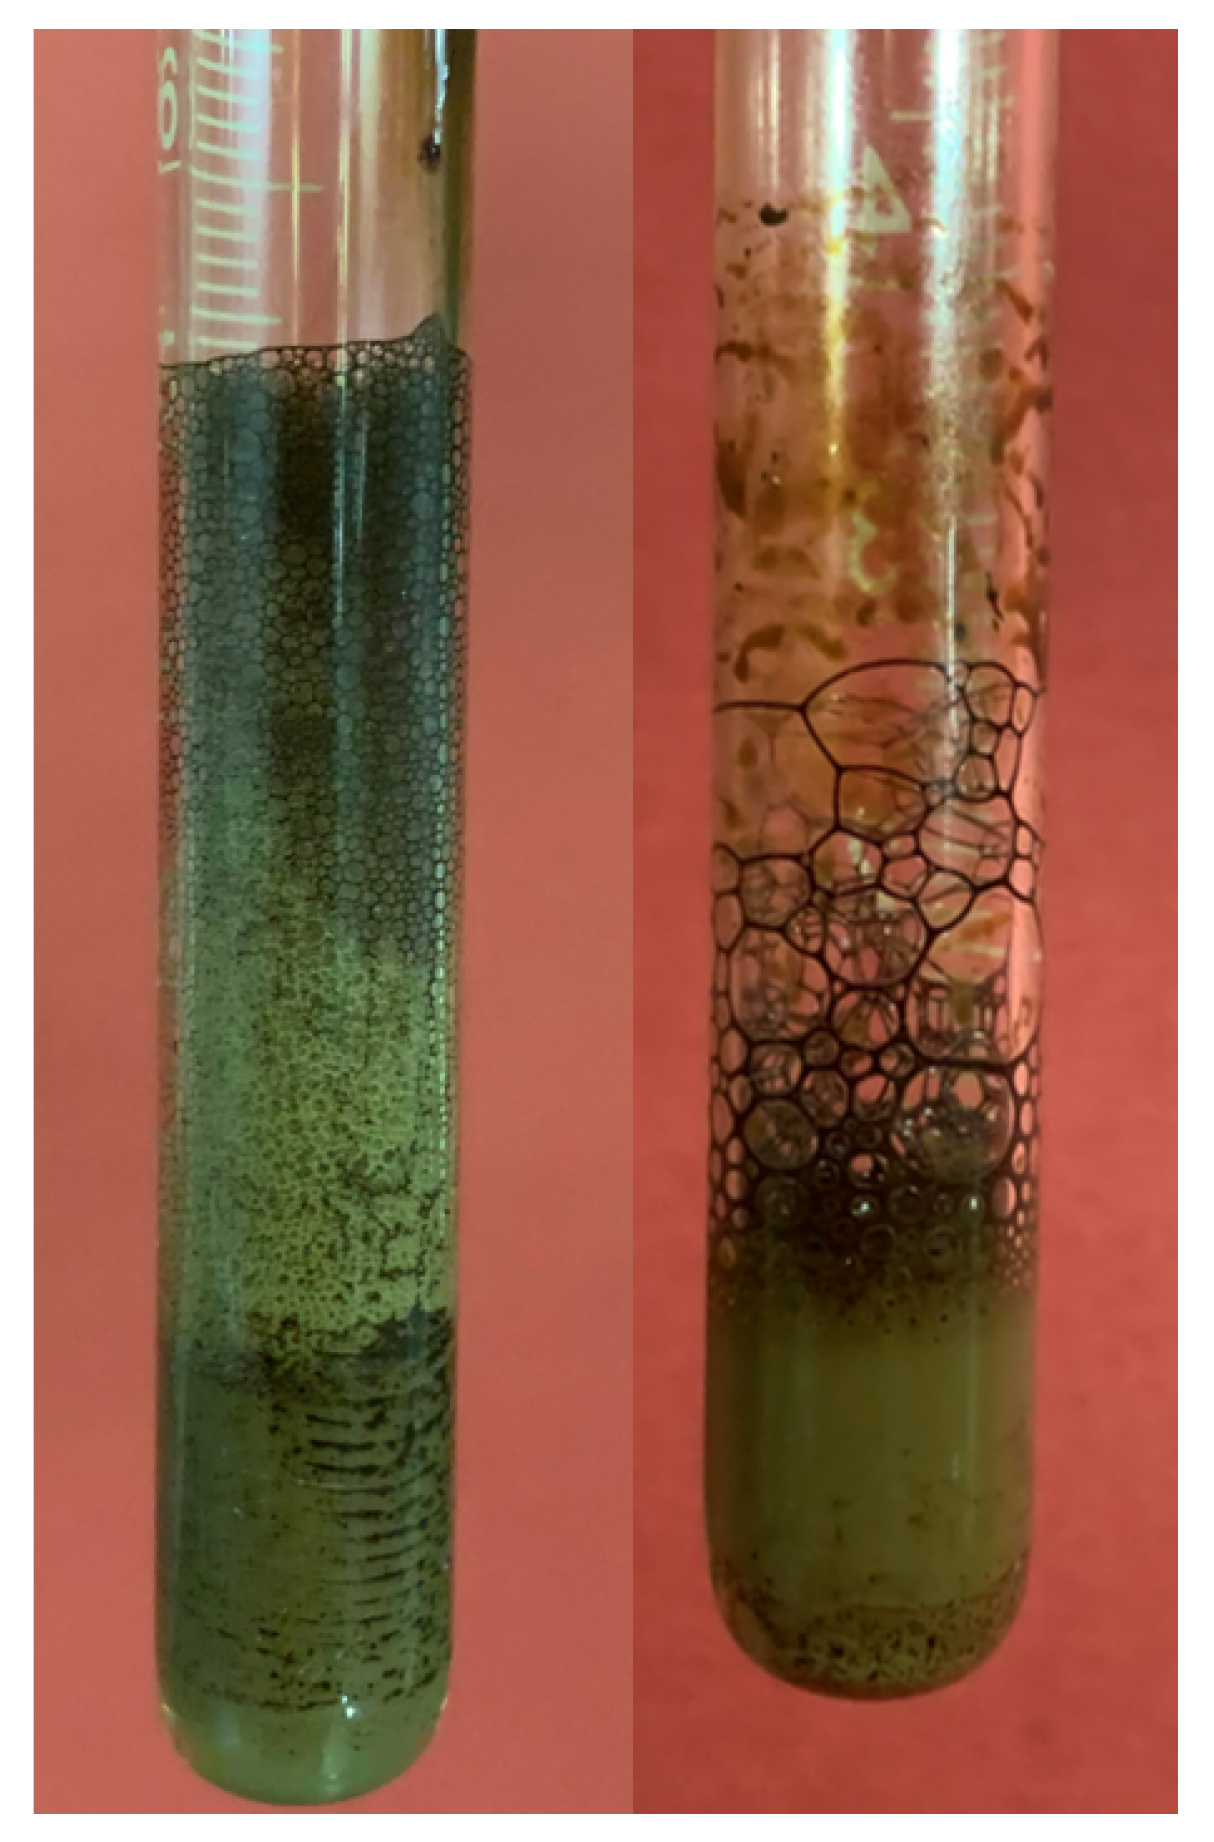
- A significant concern when using foam for mobility control is its stability in the presence of oil. In the presence of crude oil, foam generation and stability were negatively affected as expected. Figure 32 show that in the presence of oil, all SAS solutions reveal lesser foam stability compared with those attained by Figure 31 (i.e., the R5 stability percentage decreases approximately 10%) [42].
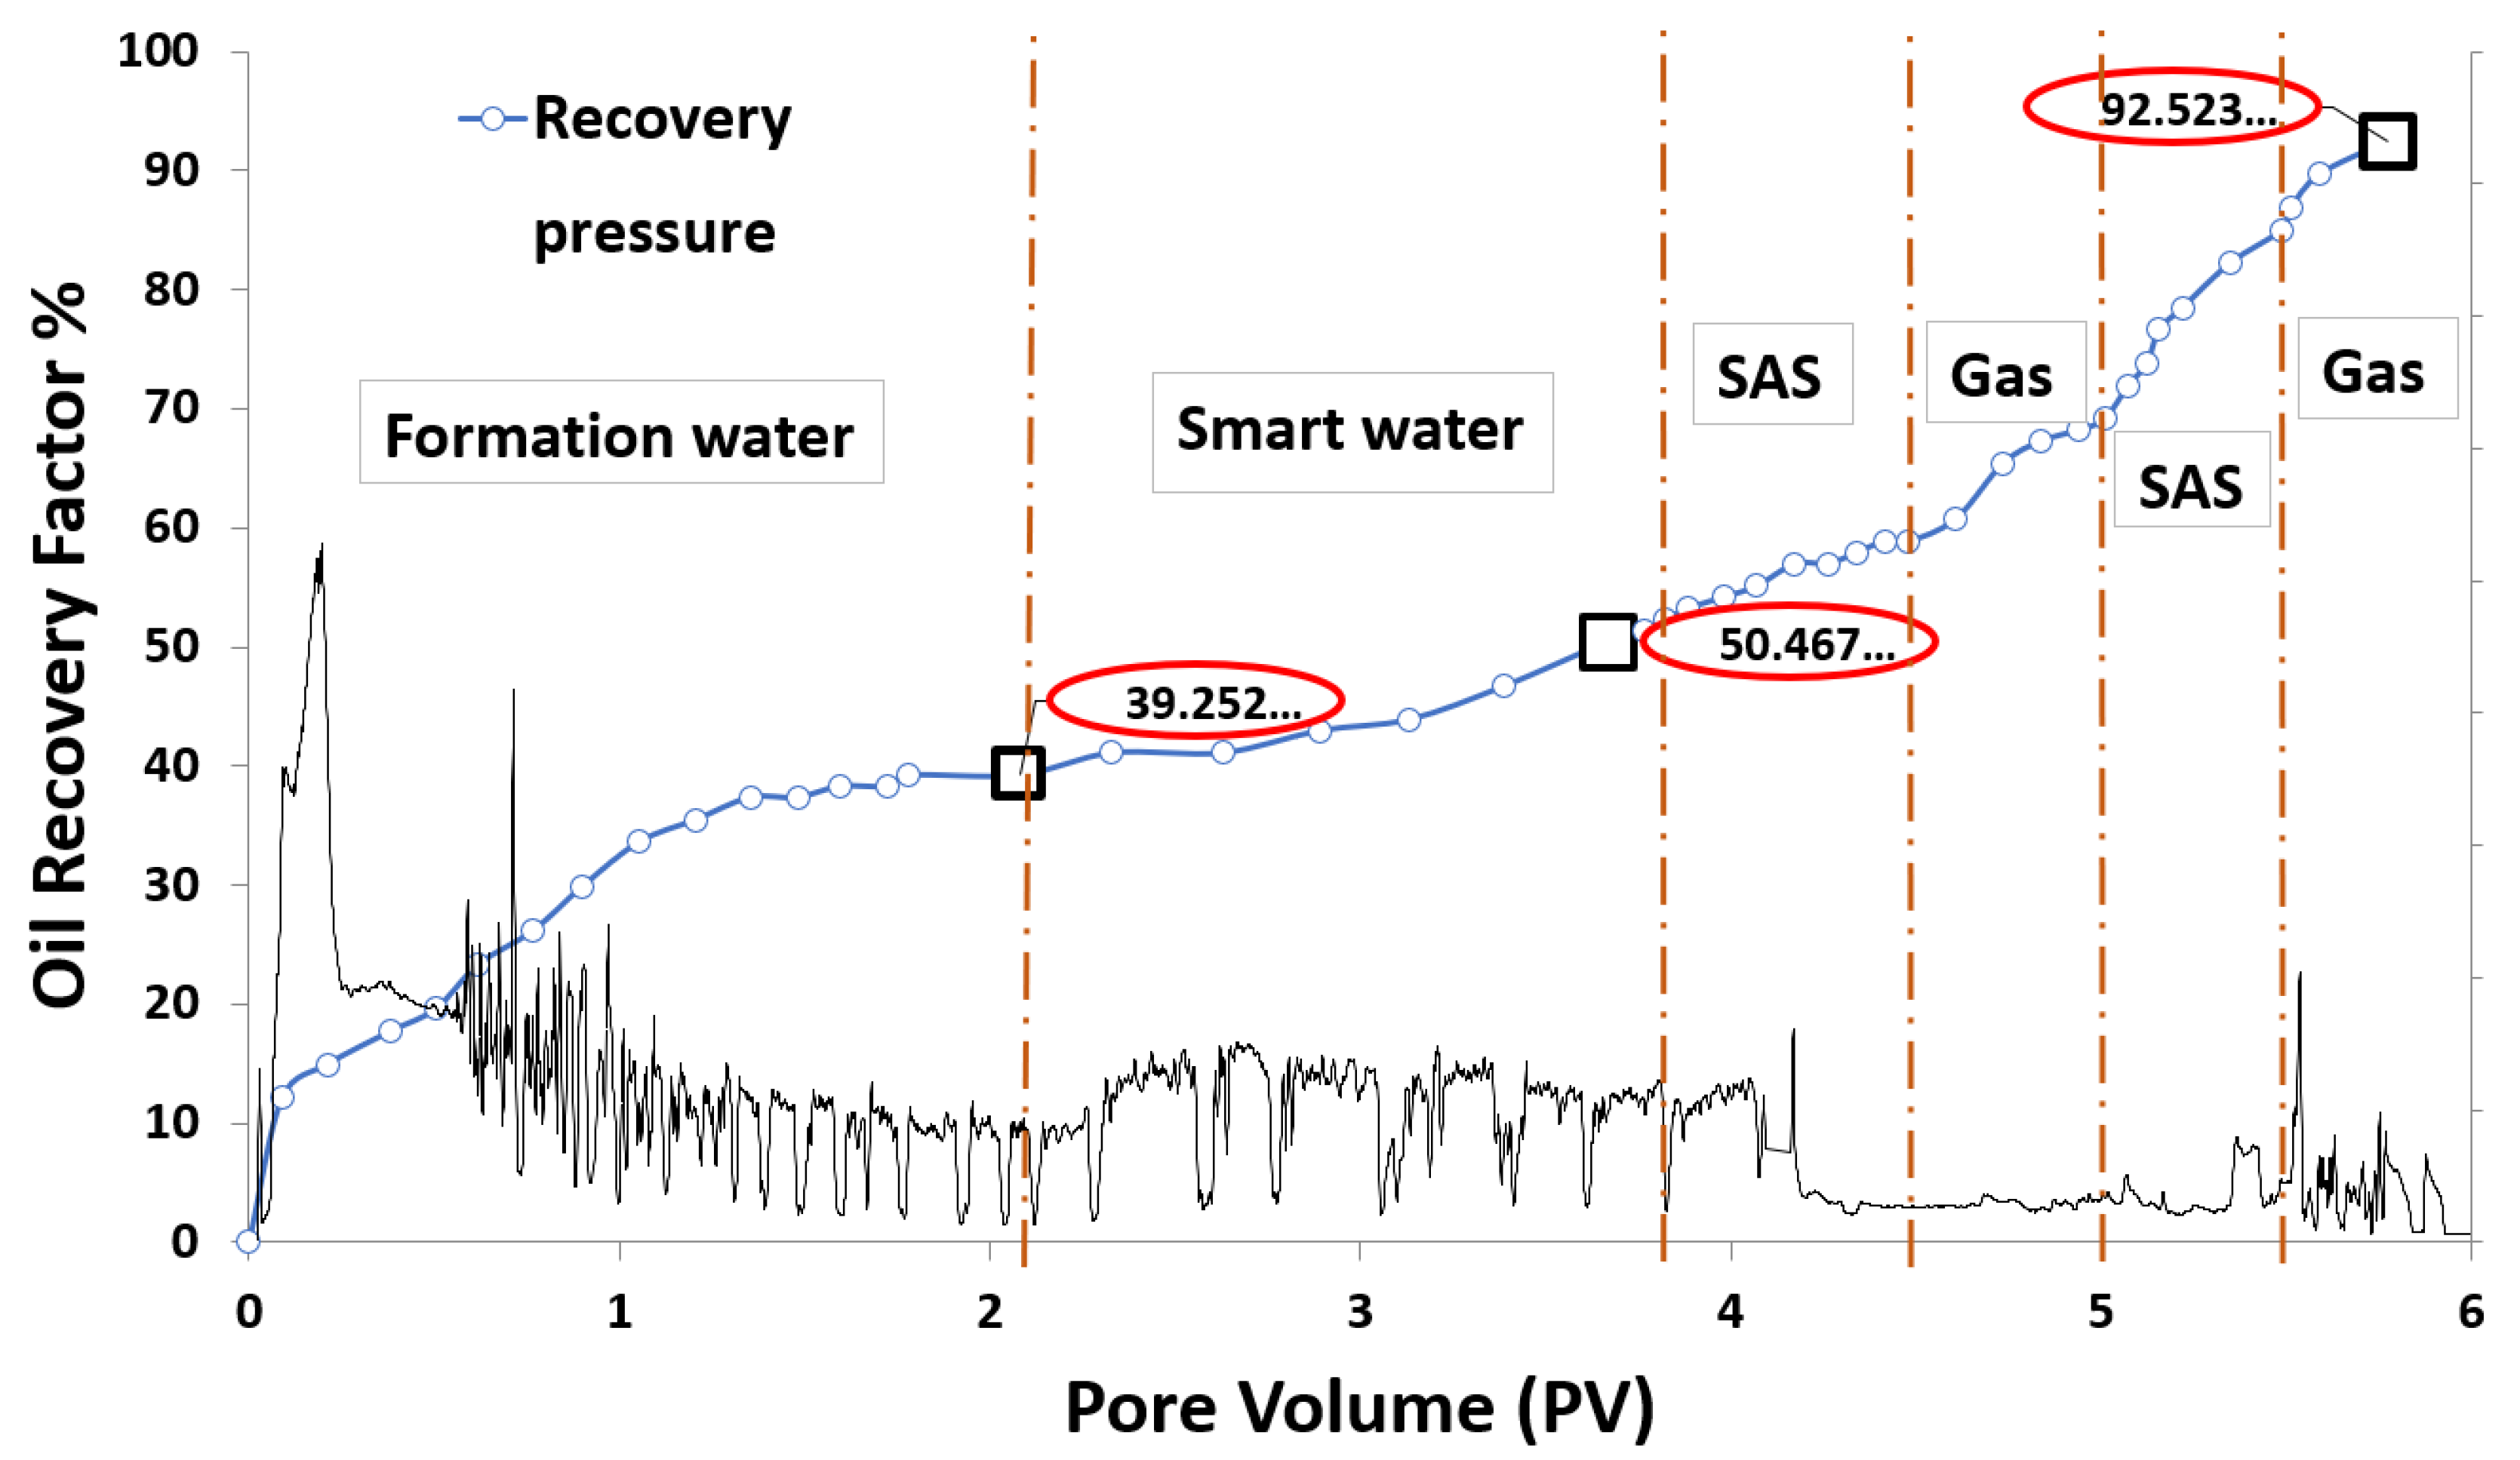
- Based on the core flooding tests, the foaming and foam stability of MgCl + CTAB + AOS with nitrogen in the presence of crude oil (Type A) showed excellent ultimate oil recovery and improved the displacement efficiency (i.e., 92% cumulative OIIC).
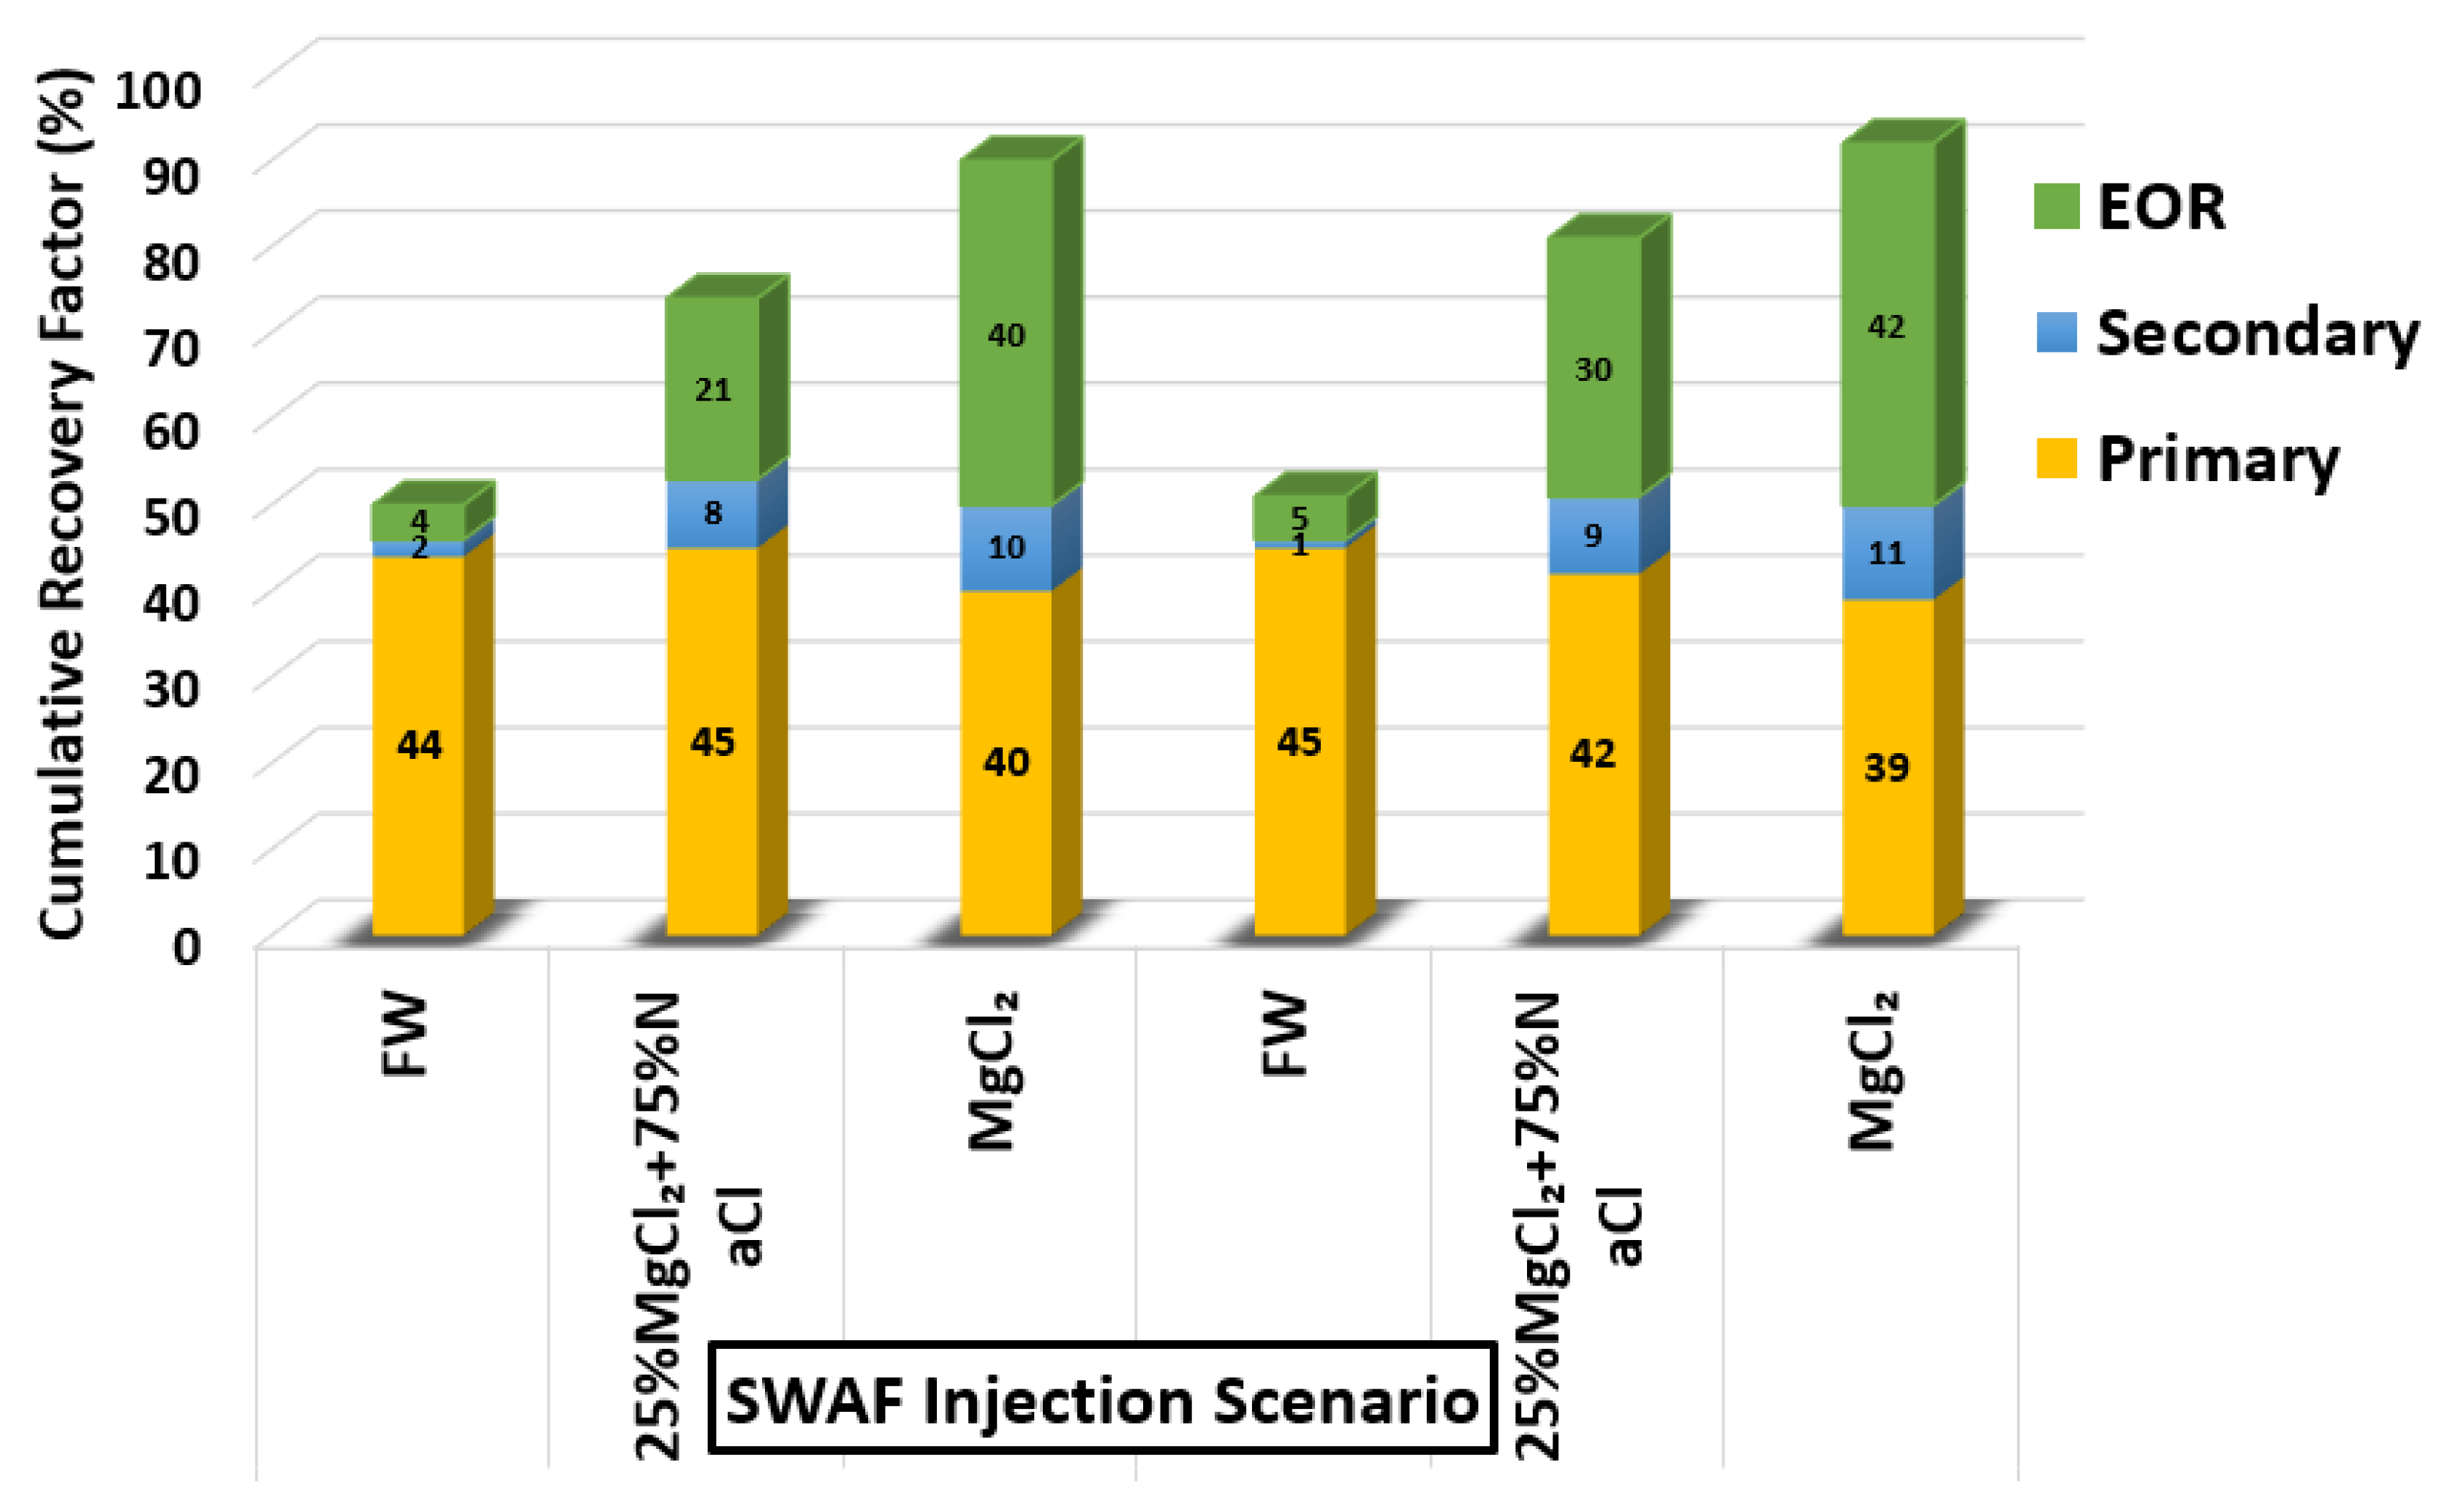
- The modes of injection, including slugs of SAS followed by gas followed by a slug of SAS flowed by gas, shows that the SAG (SAS alternating gas) mode appears to have better performance than other injection sequence scenarios in terms of oil recovery i.e., 42% incremental OIIC (see Figure 34), which represents an optimistic scenario (i.e., in the case of 100% MgCl and CTAB at desired concentration of 1000 ppm).
- It should be noted that even the pessimistic scenario with 20% incremental recovery of SWAF process i.e., in the case of 25% MgCl + 75% NaCl and CTAB at desired surfactant concentration (21%, as shown in Figure 34) is still higher than the one obtained with the conventional EOR (i.e., average 17%), which is reported in the literature [96].
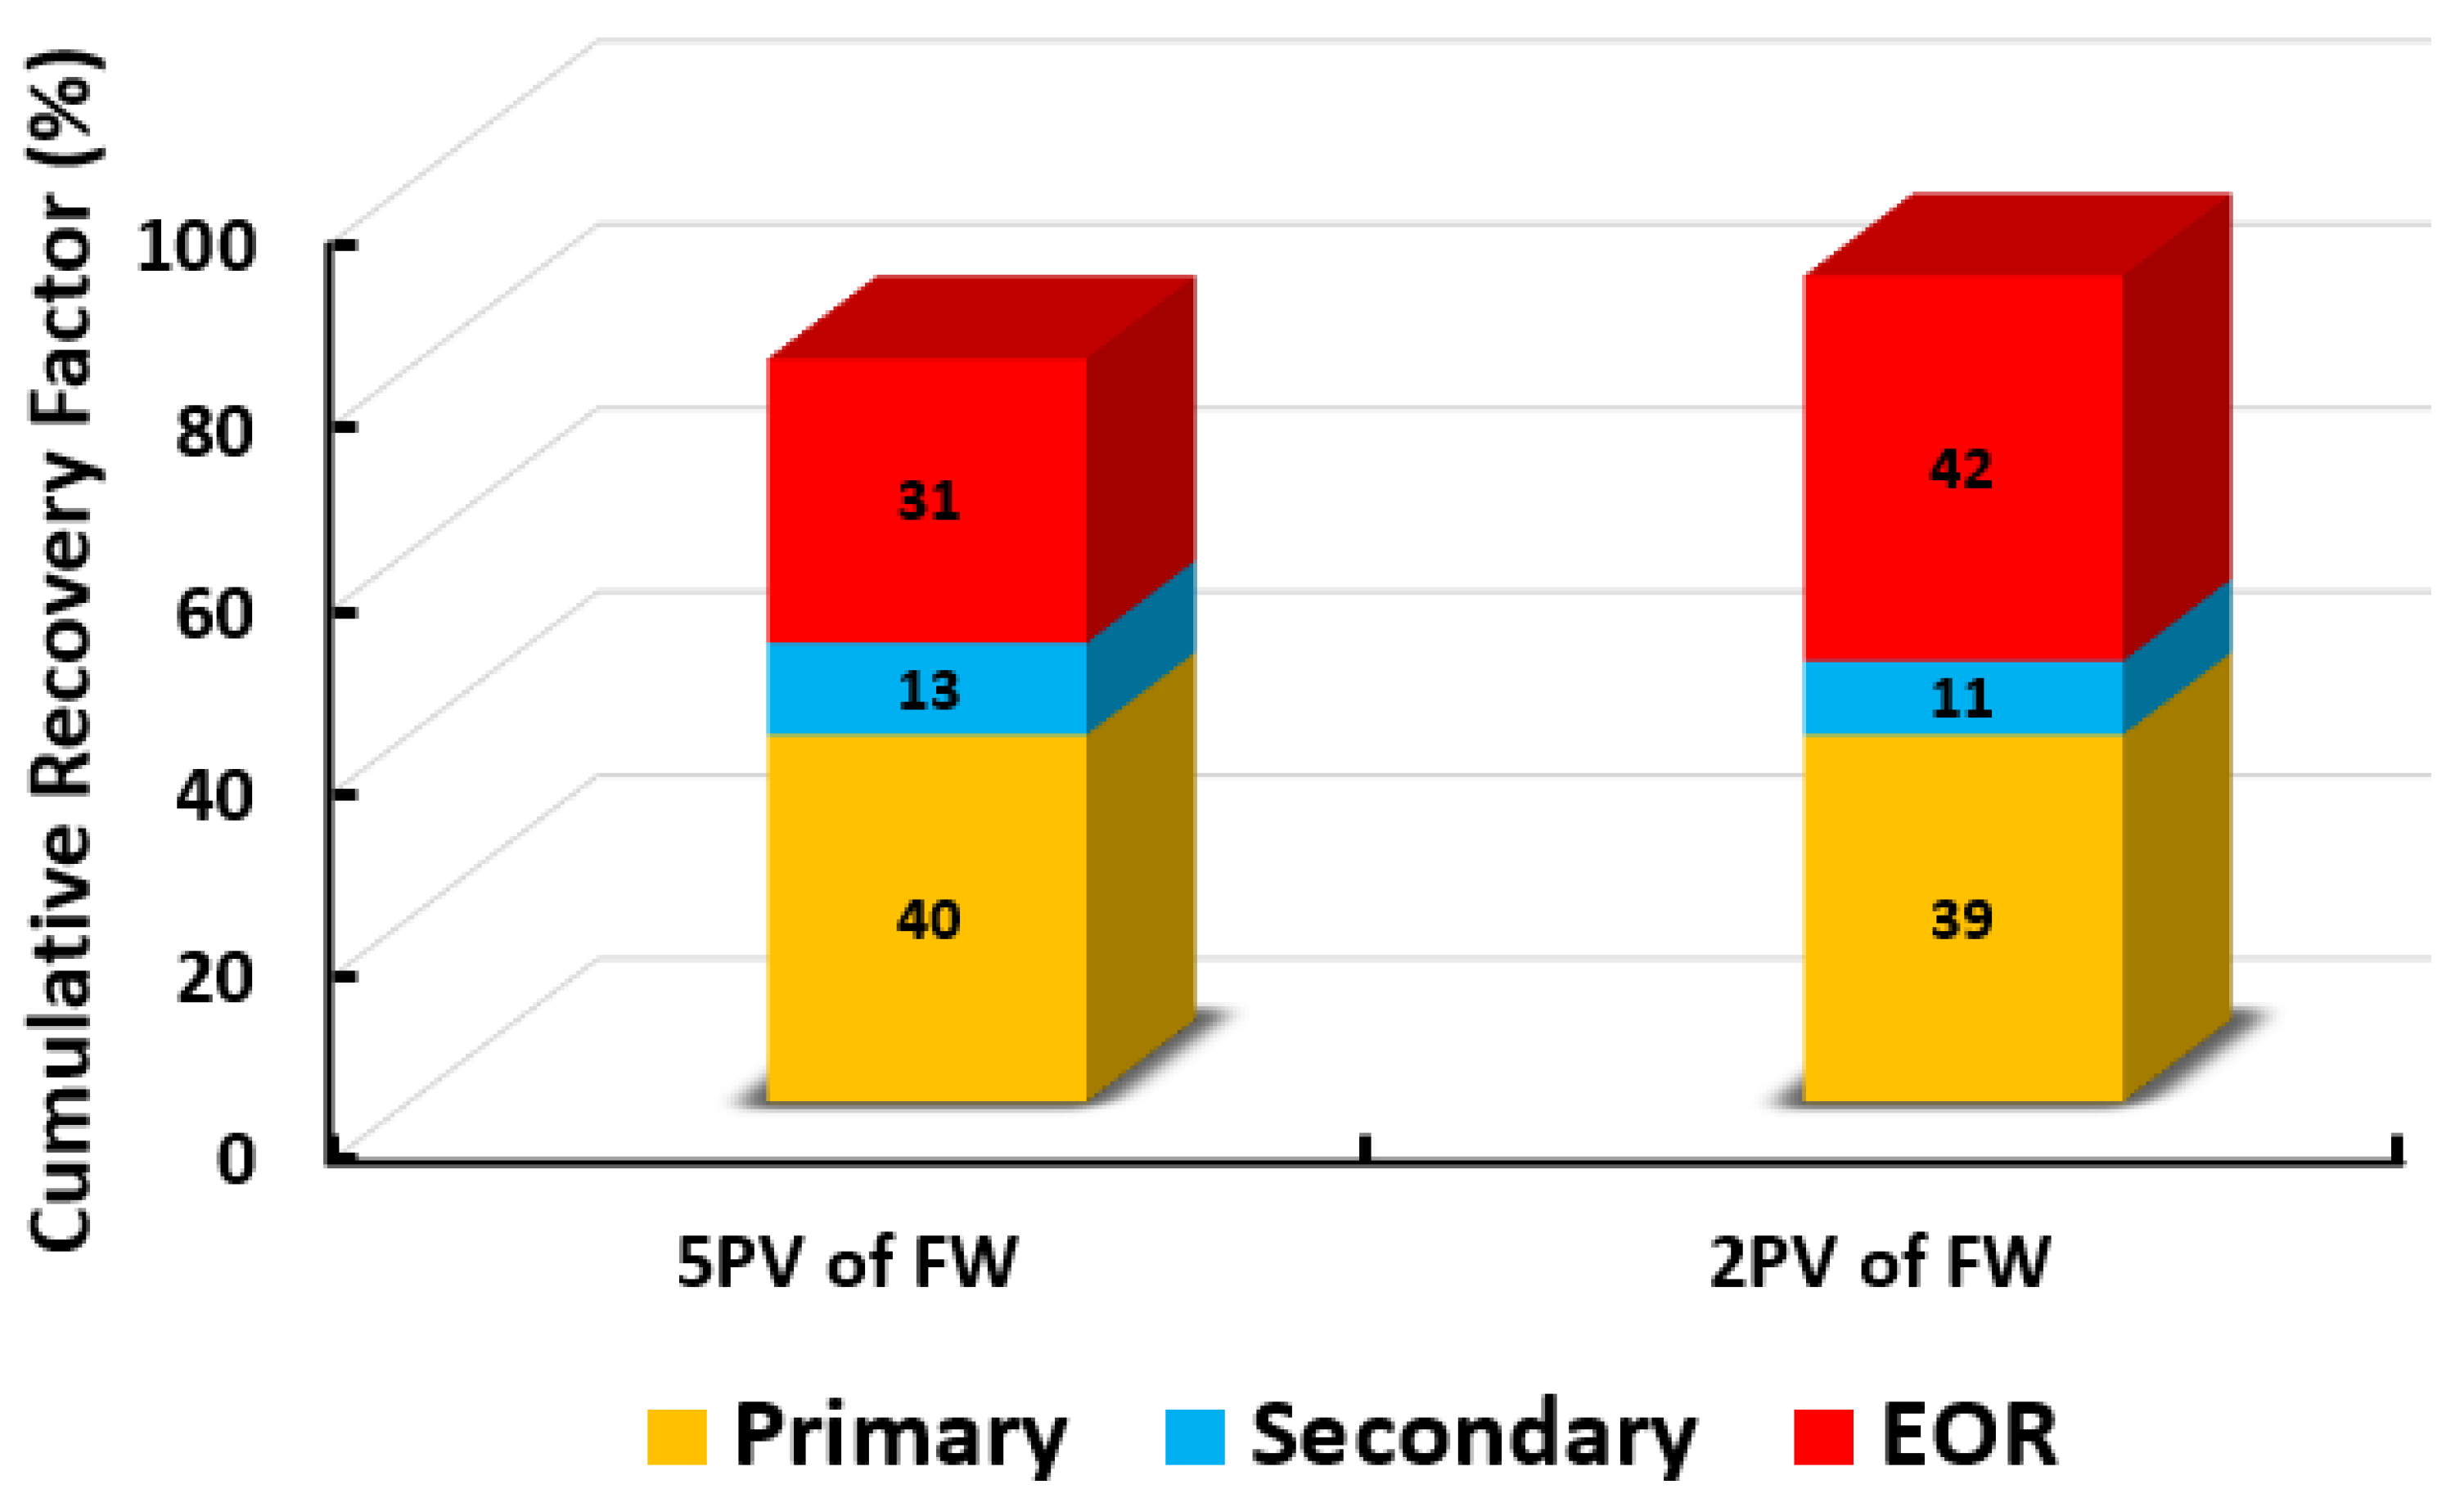
- The optimum SWAF injection scenario (i.e., 100% MgCl and CTAB at 1000 ppm) is optimized by studying the effect of the slug size of the SWAF injection scenarios. It is observed that changing the slug size of the SWAF injection scenario from 5 PV to 2 PV)leads to more oil recovery. Additionally, reducing the slug size from 5 PV to 2 PV reduces the fluid circulation costs, thus lowering the CO footprint
- In summary, it is expected that the novel hybrid SWAF process under optimum controlled conditions can make the proposed new hybrid EOR method economically and environmentally attractive.
Author Contributions
Funding
Acknowledgments
Conflicts of Interest
Abbreviations
| AST | Aqueous Solution Test |
| AOS | Alpha Olefin Sulfonate |
| CapEx | Capital Expenditures |
| CAT | Contact Angle Test |
| CF | Core-Flooding Test |
| COBR | Crude Oil Brine Rock |
| CT | Compatibility Test |
| CTAB | Cetyltrimethylammonium Bromide |
| DLVO | Derjaguin, Landau, Verwey, and Overbeek |
| EDL | Electrical Double Layer |
| EOR | Enhanced Oil Recovery |
| FST | Foam Stability Test |
| FT | Foamability Test |
| FW | Formation Water |
| IFT | Interfacial Tension |
| ILS | Indiana Limestone |
| LSW | Low Salinity Water |
| OIIC | Oil Initial In Core |
| OIIP | Oil initial In place |
| OpEx | Operational Expenditures |
| PDI | Potential Determining Ion |
| PV | Pore Volume |
| SAG | SAS Alternating GAS |
| SAS | Surfactant Aqueous Solution |
| SCM | Surface Complexation Modeling |
| SW | Smart Water |
| SWAF | Smart Water-Assisted Foam |
| TAN | Total Acid Number |
| TBN | Total Base Number |
| UCS | Unconfined Compressive Strength |
| US | United States |
| VdW | Van der Waals |
| XRD | X-Ray Diffraction |
| ZP | Zeta Potential |
| ZPC | Zero Point of Charge |
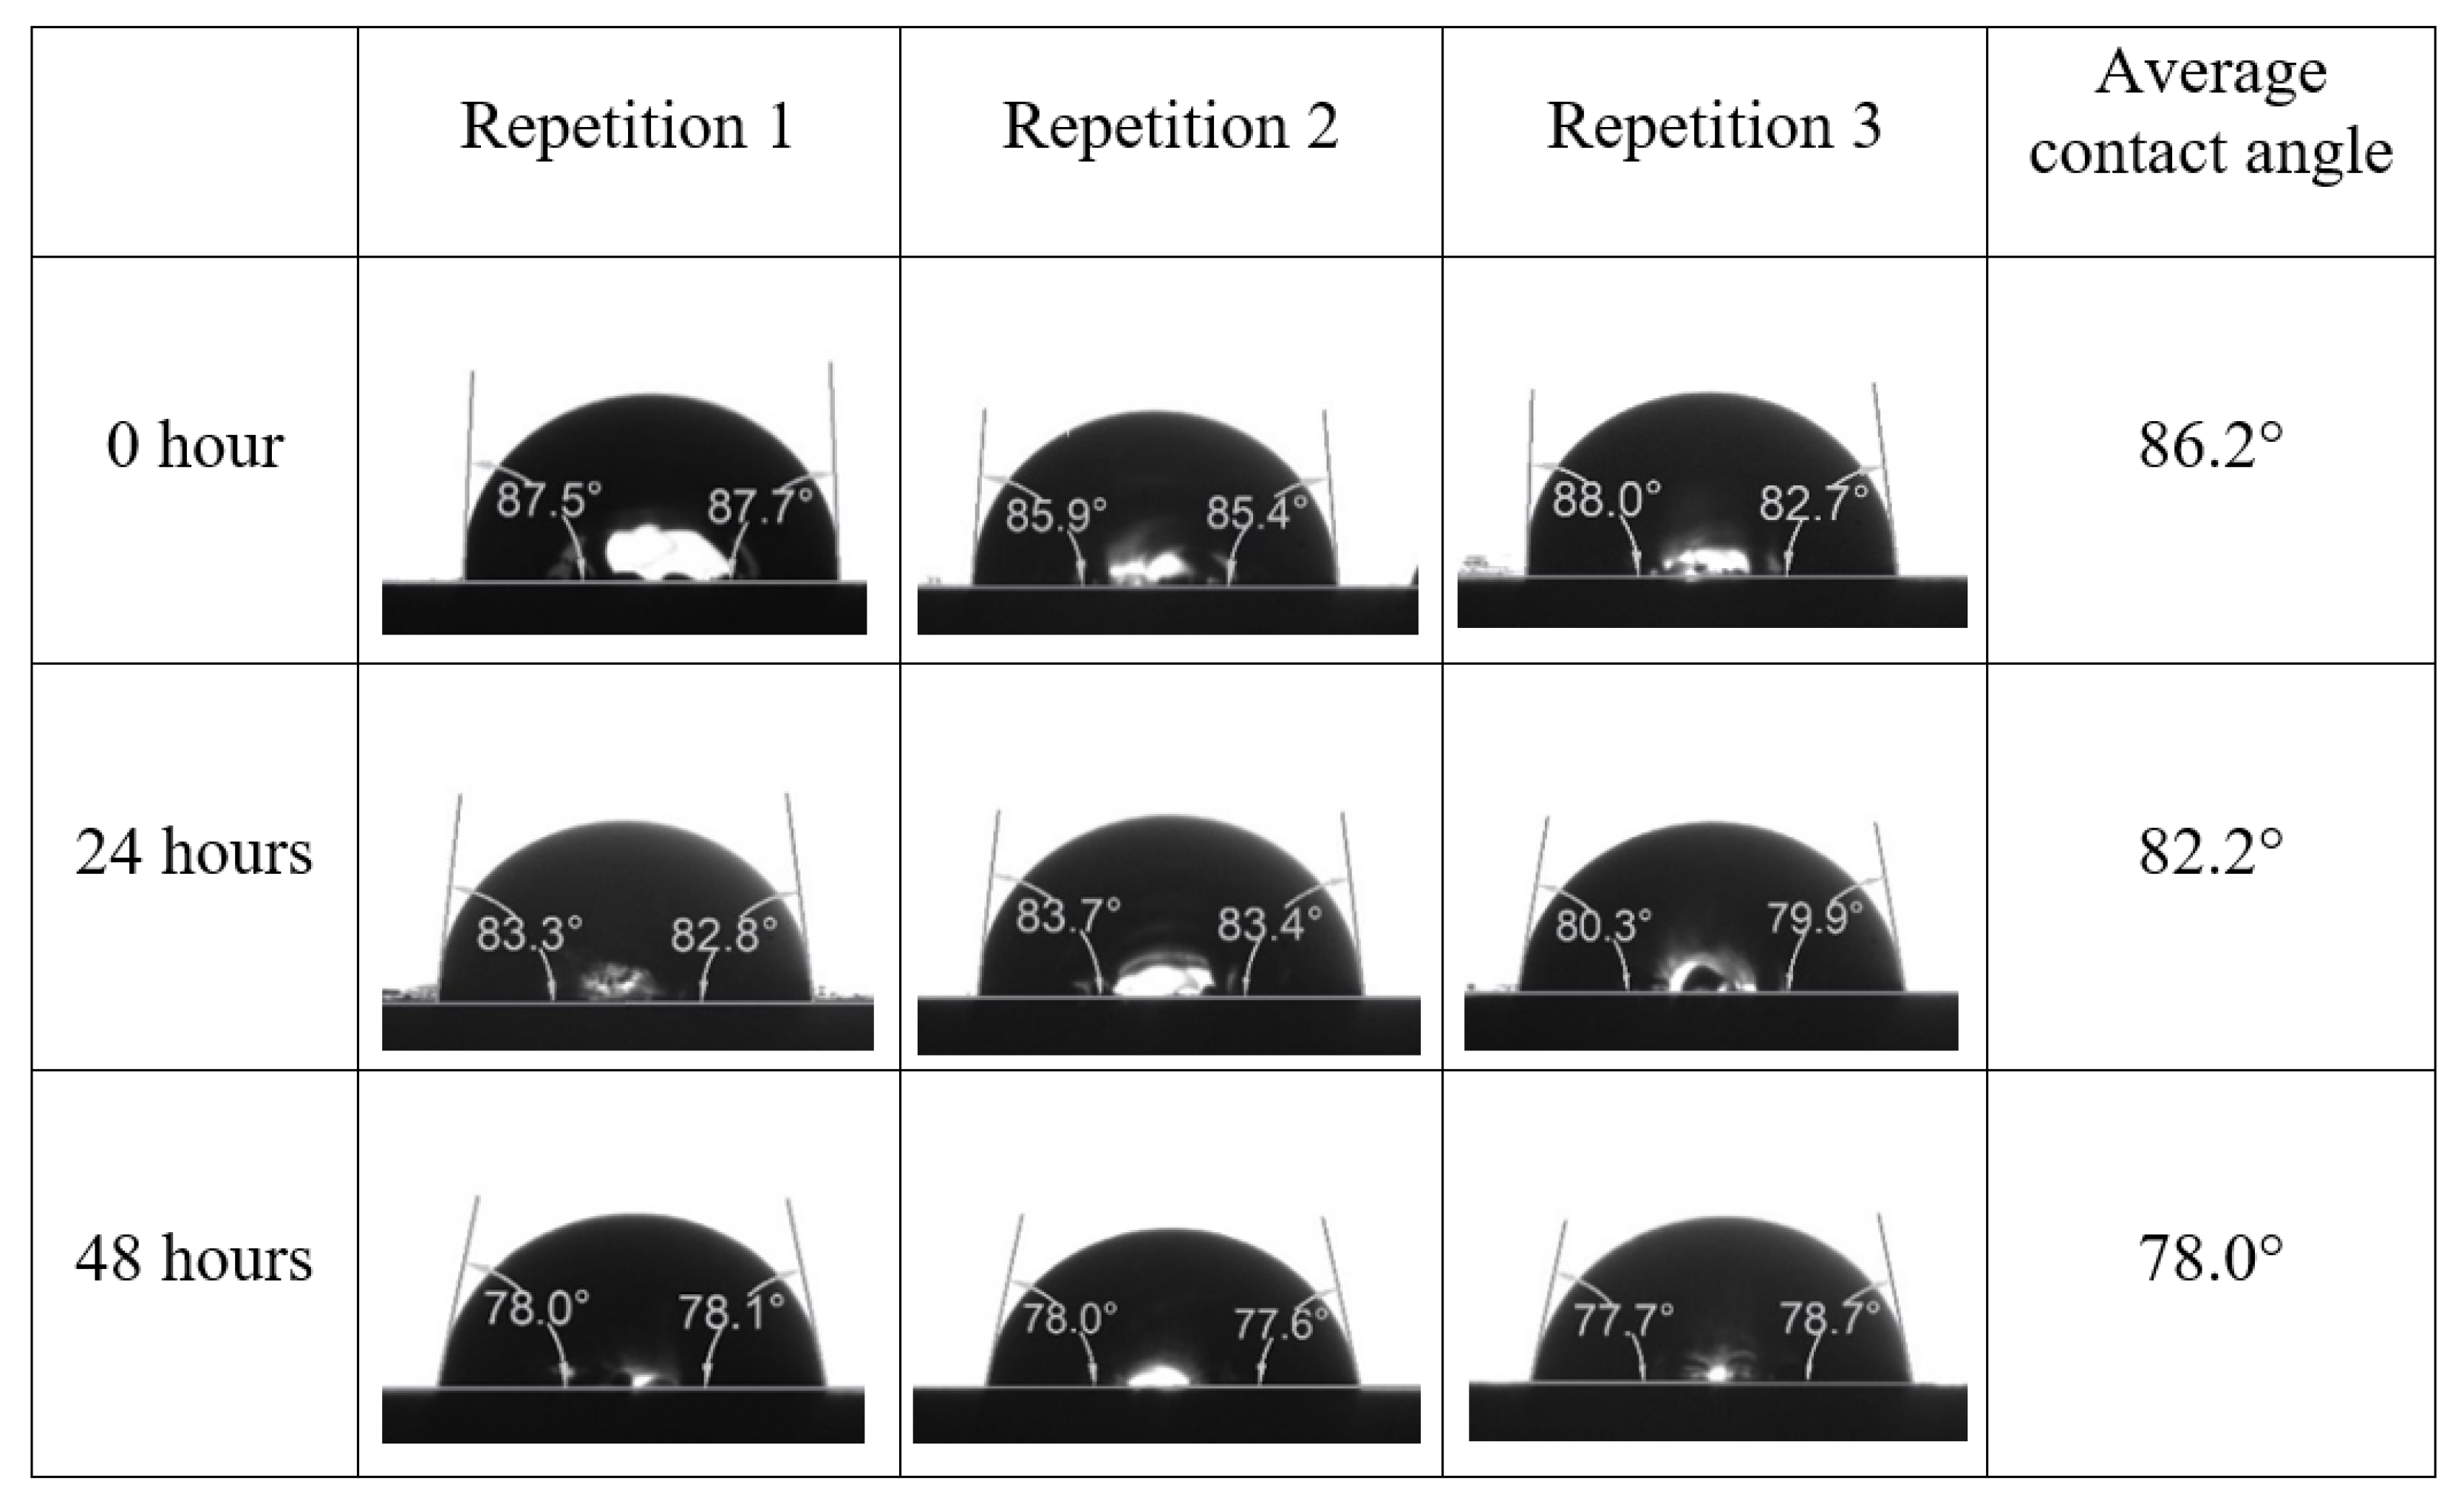
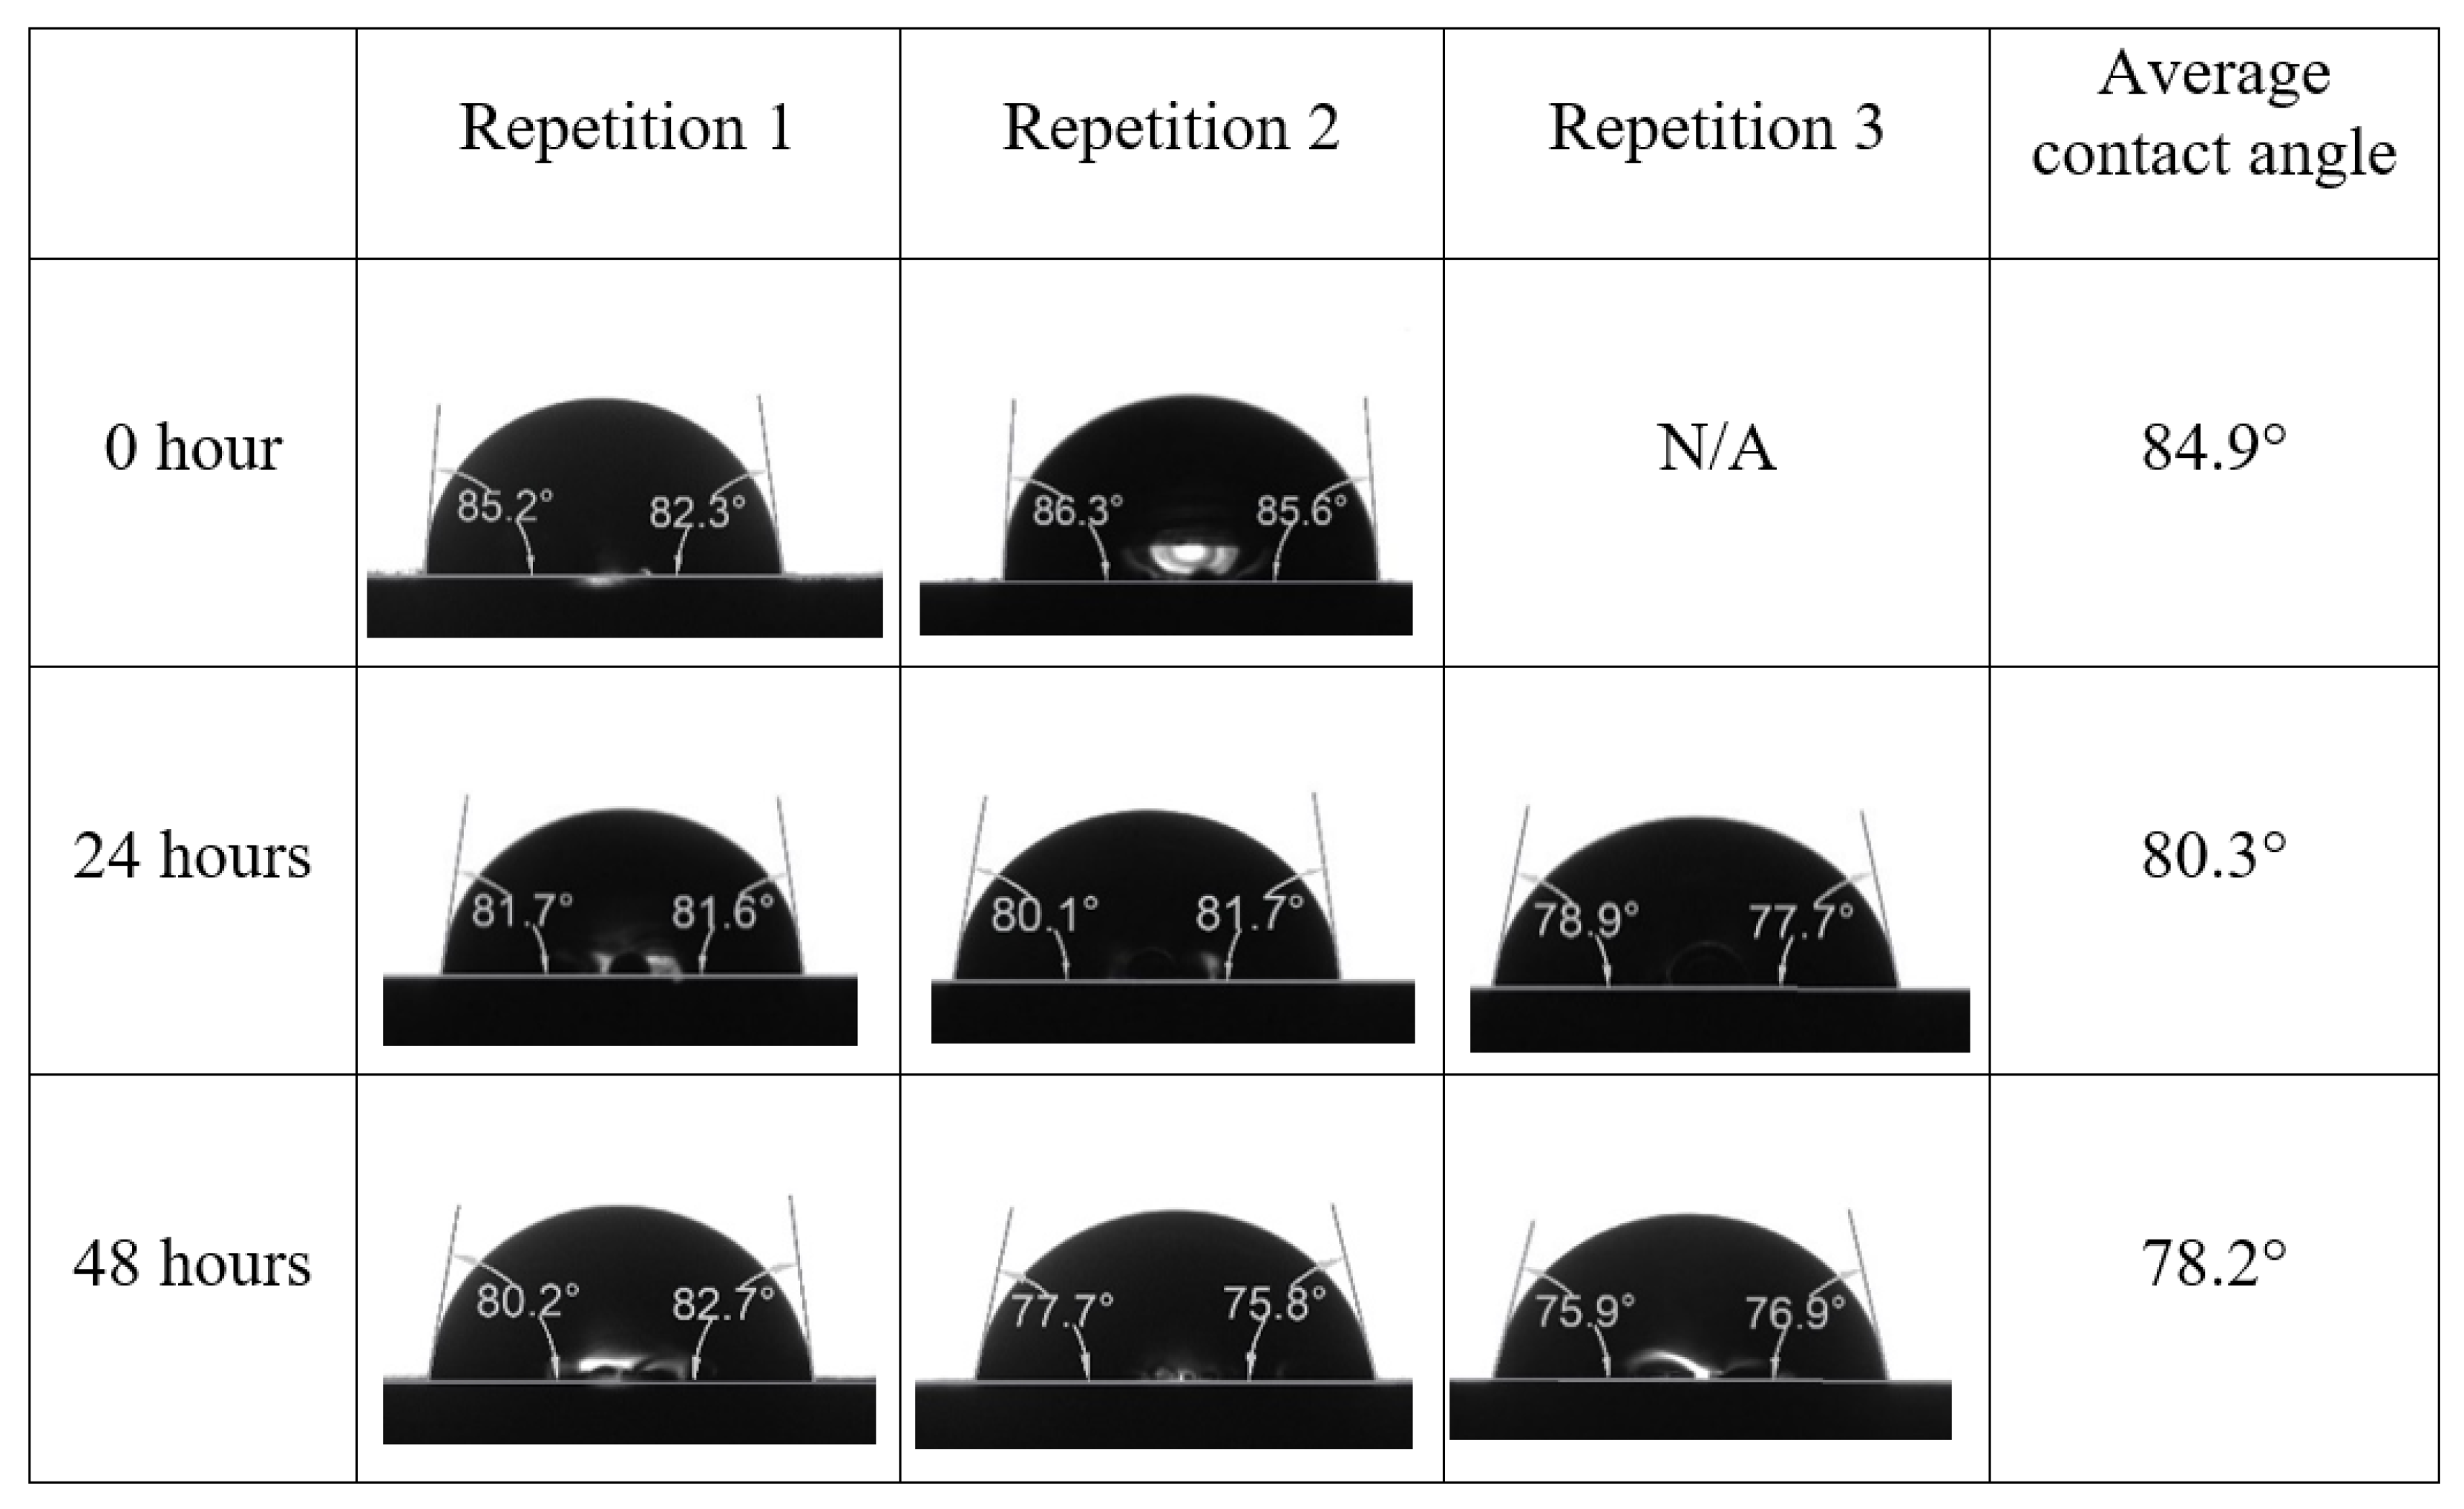
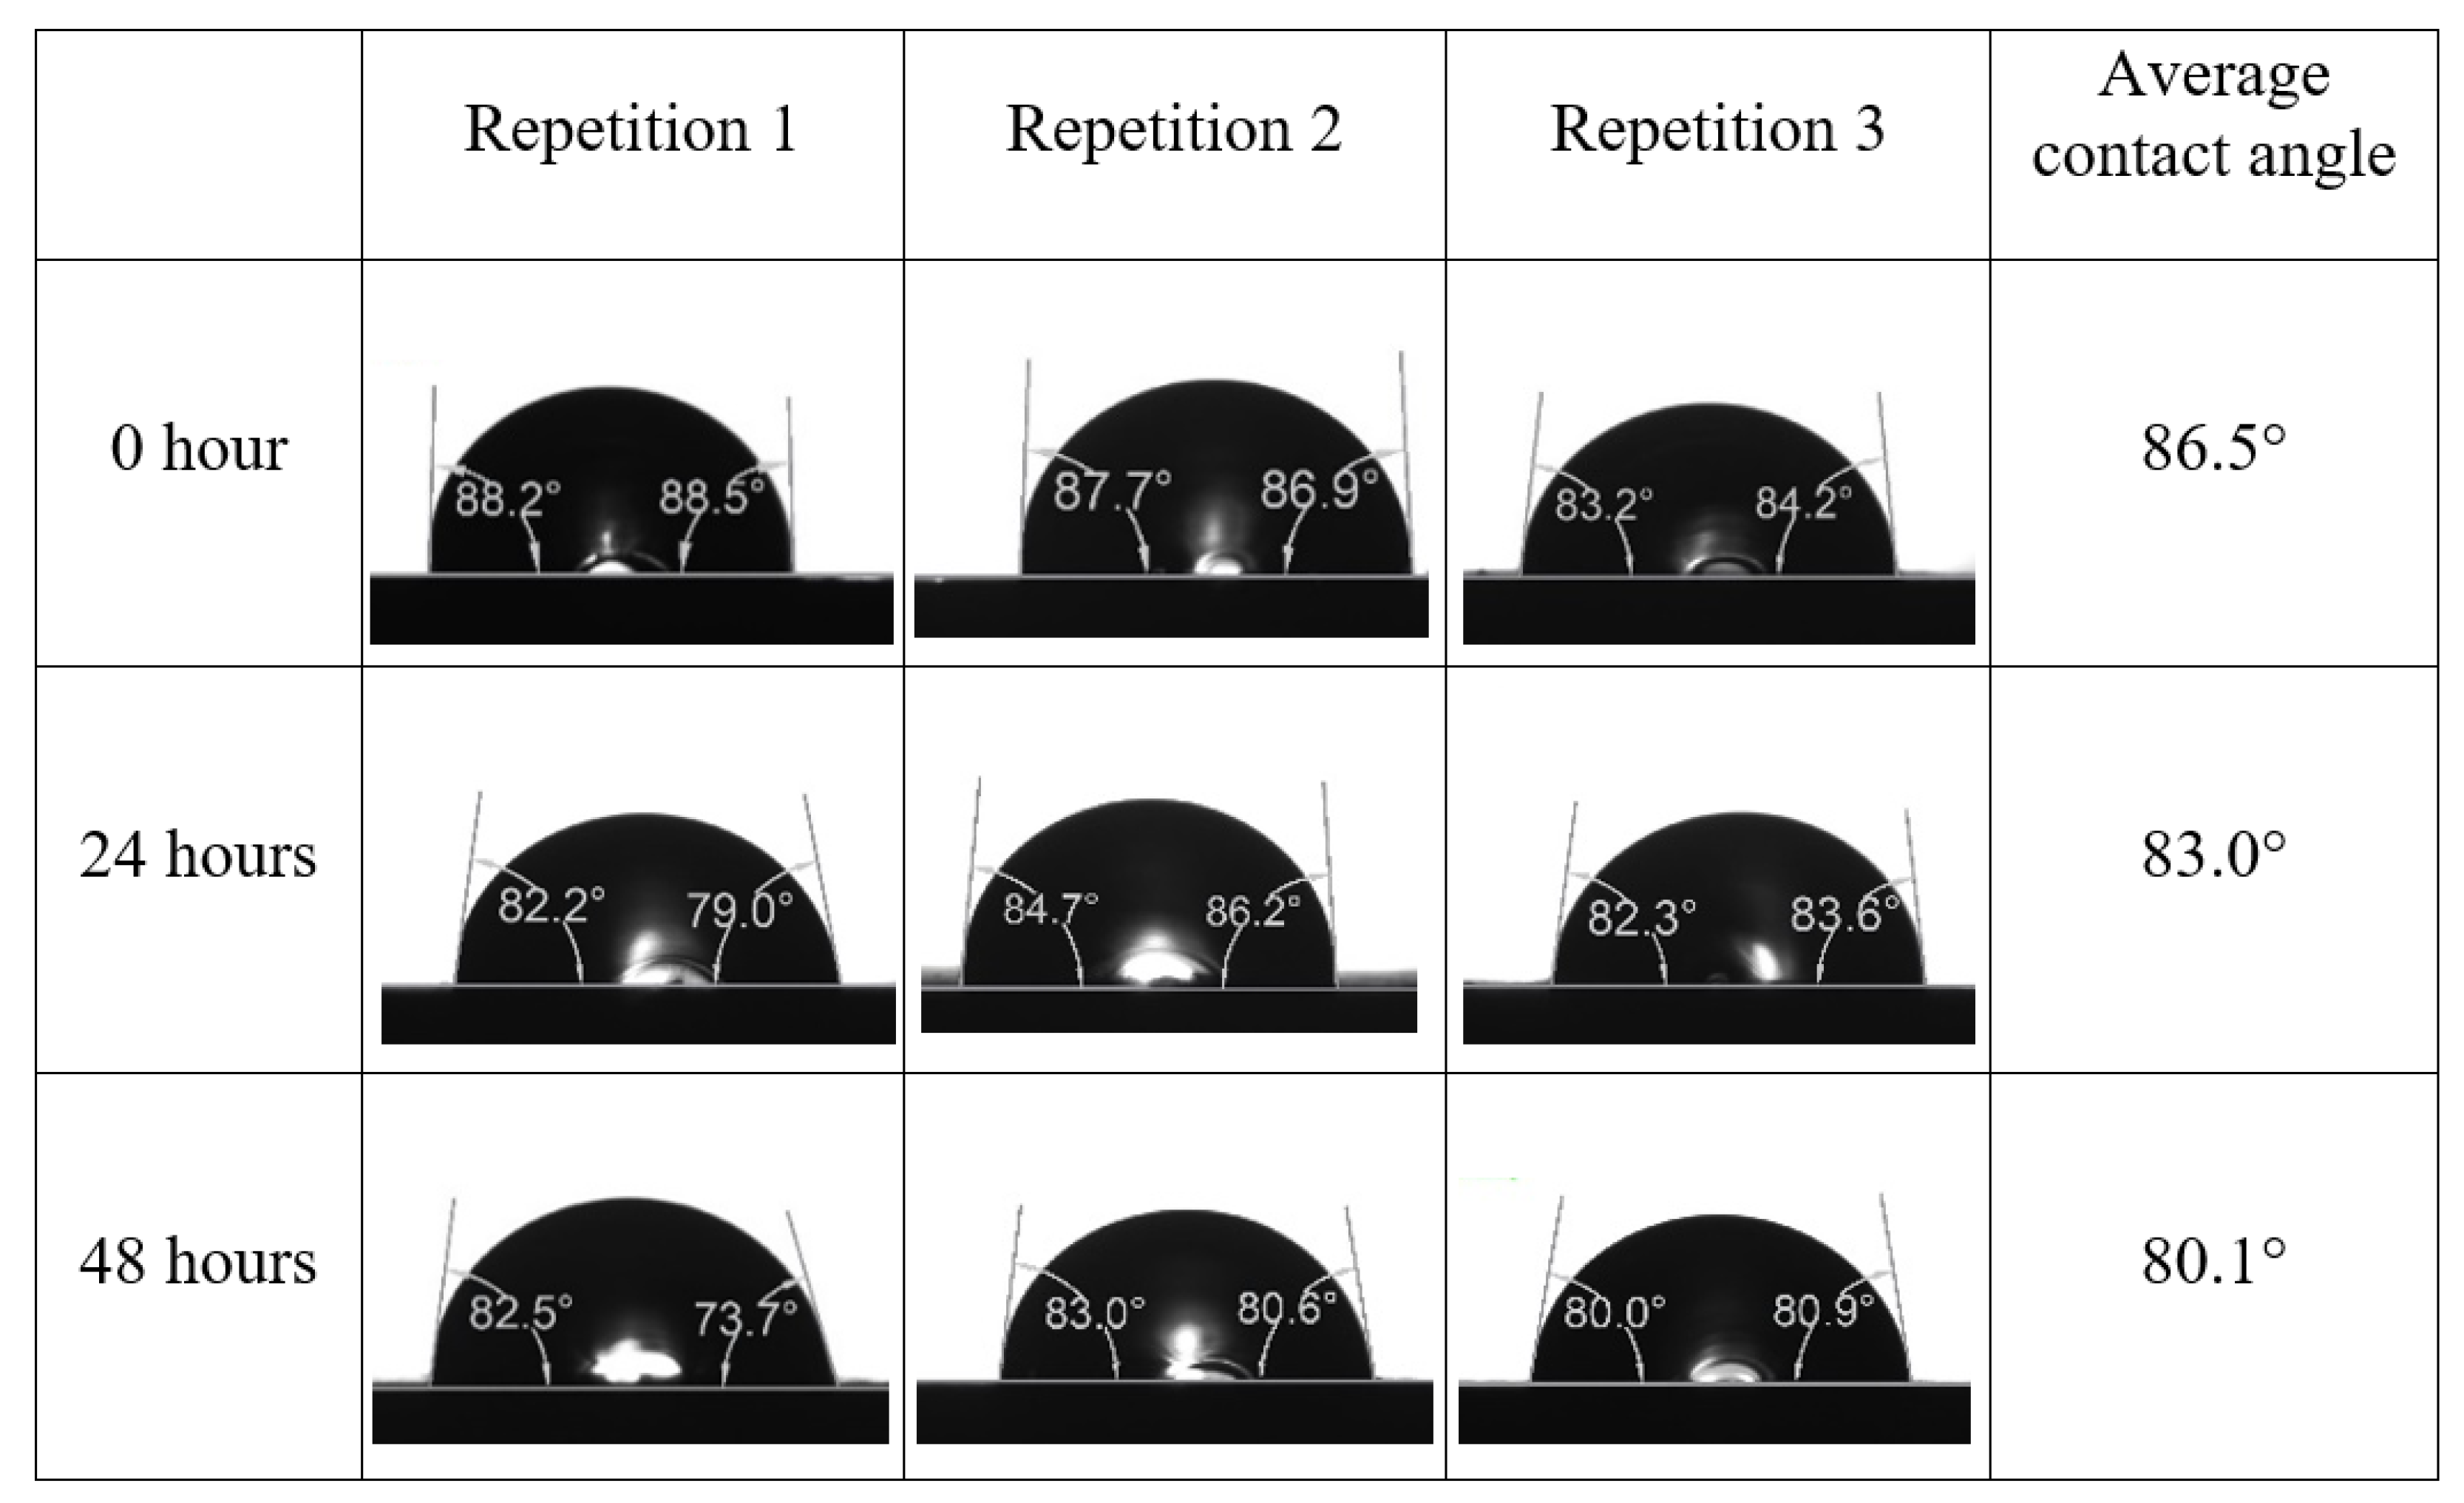
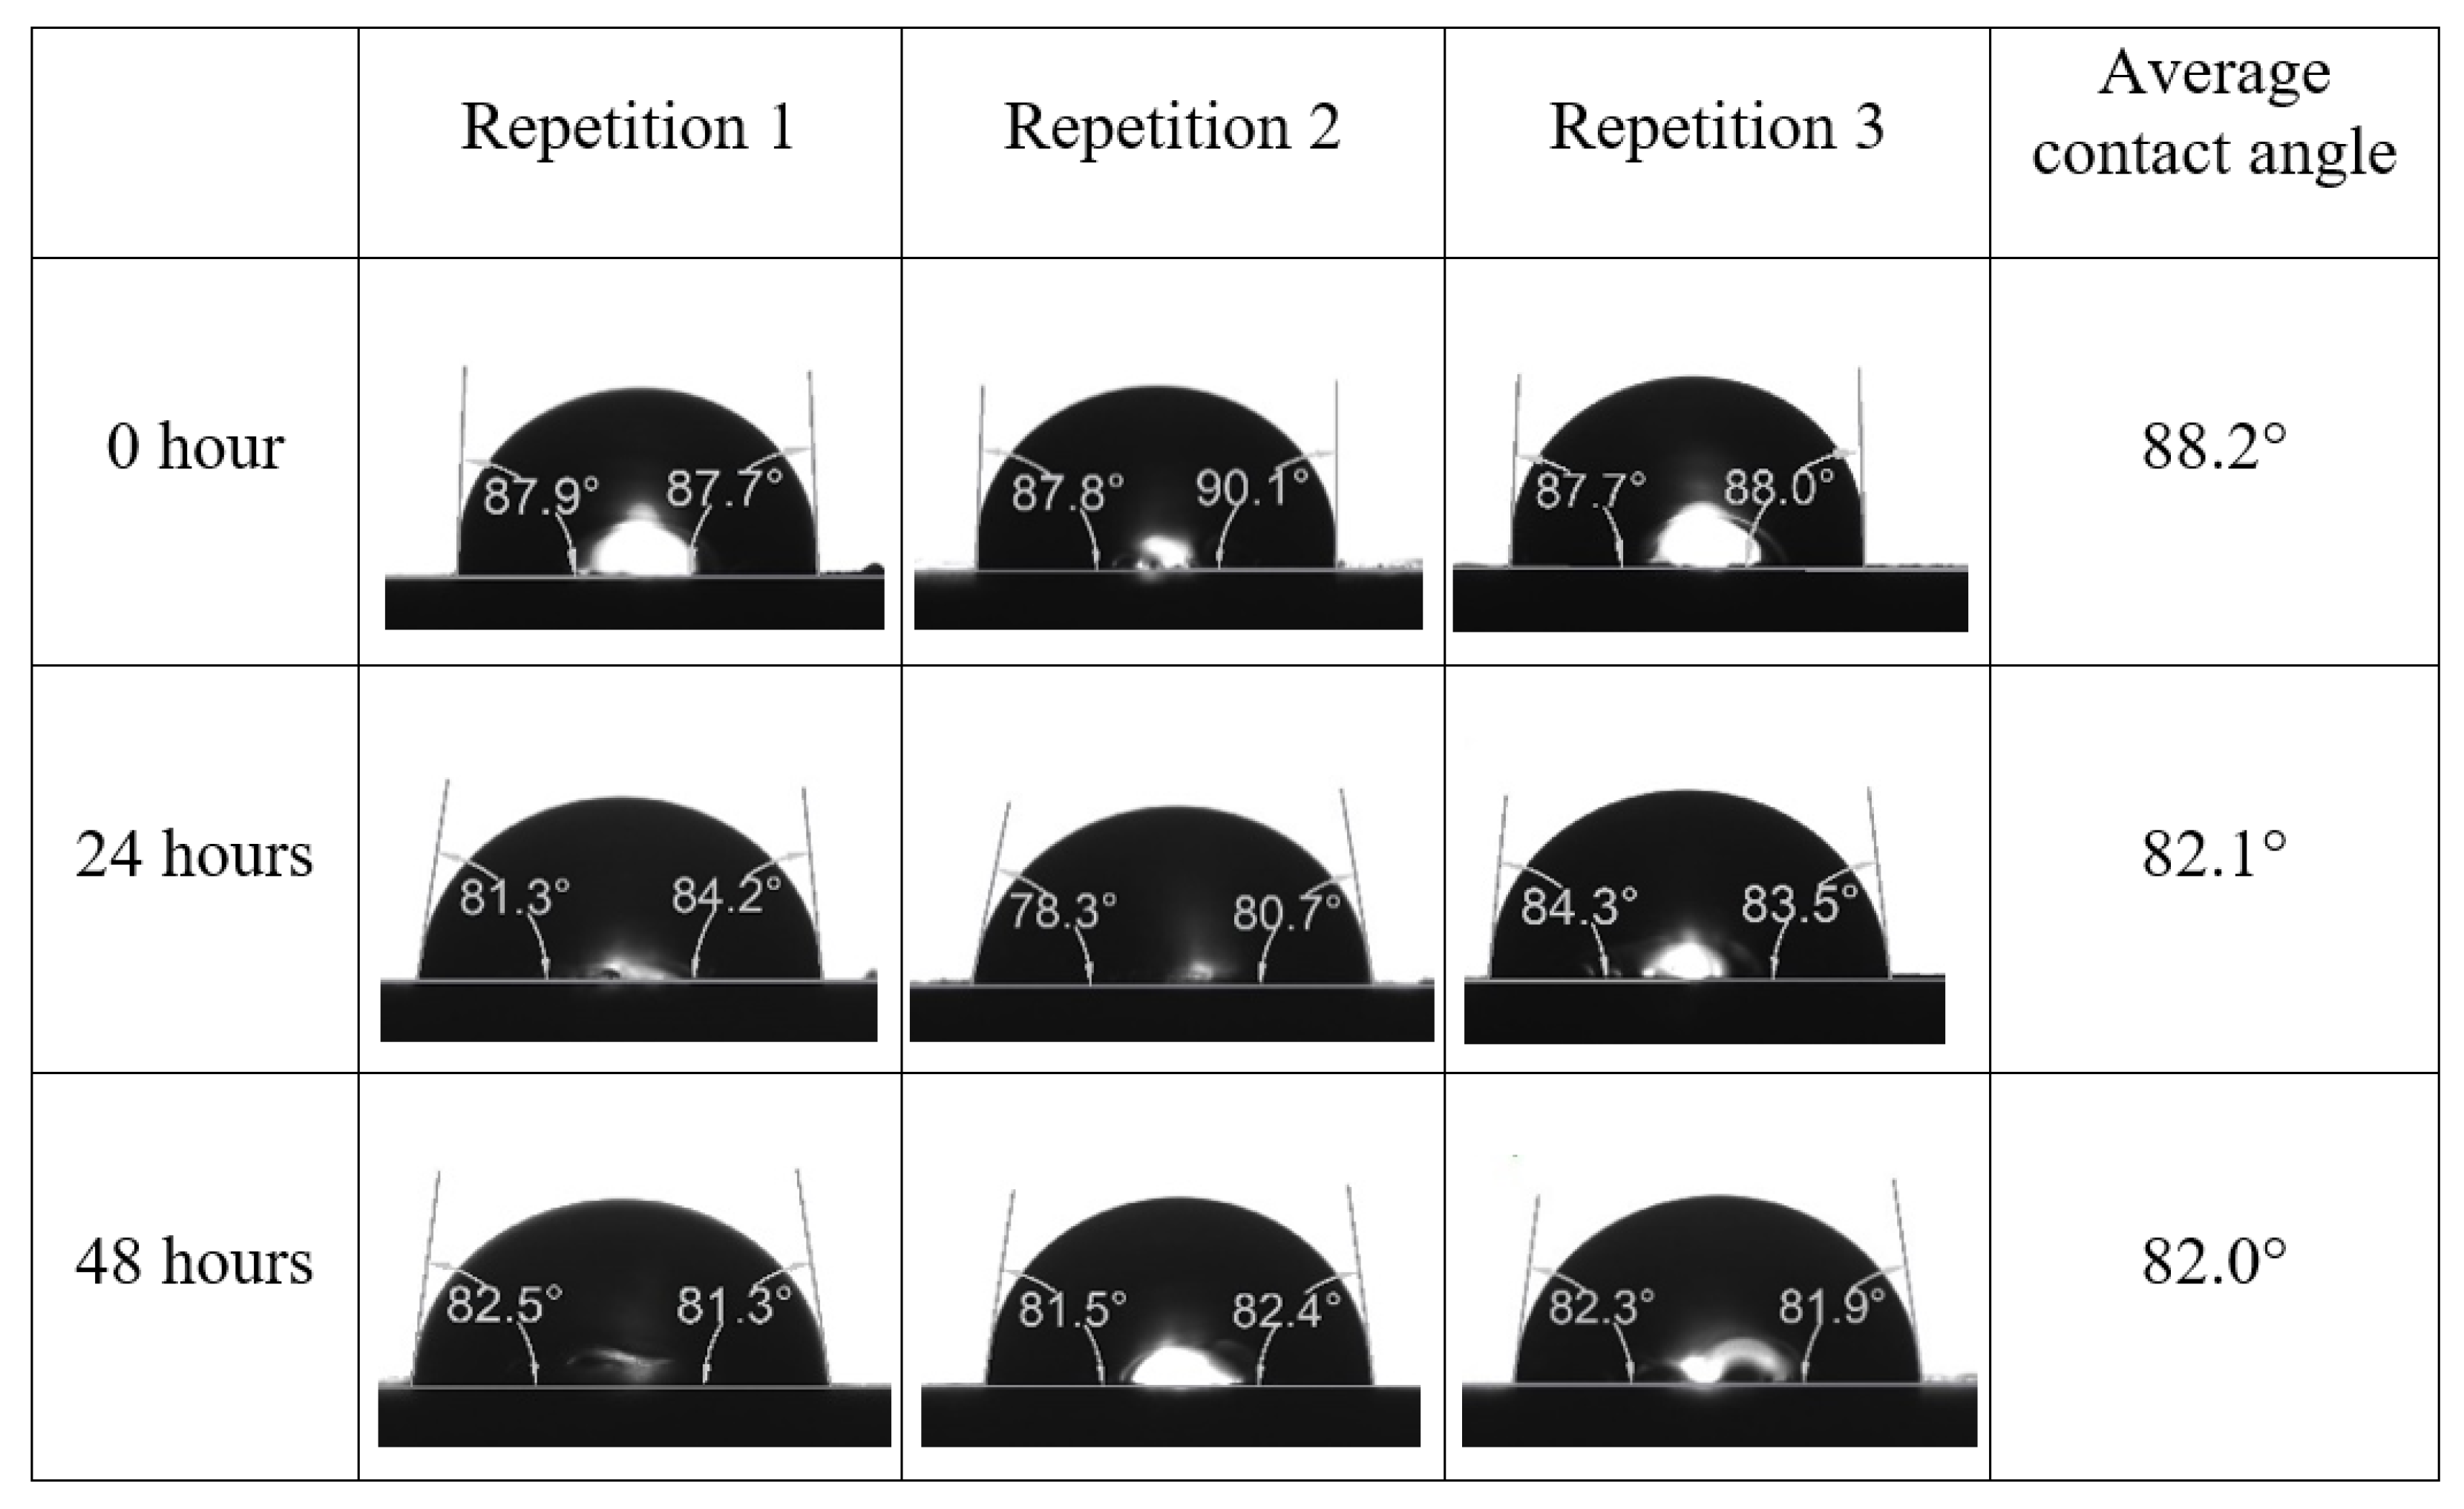
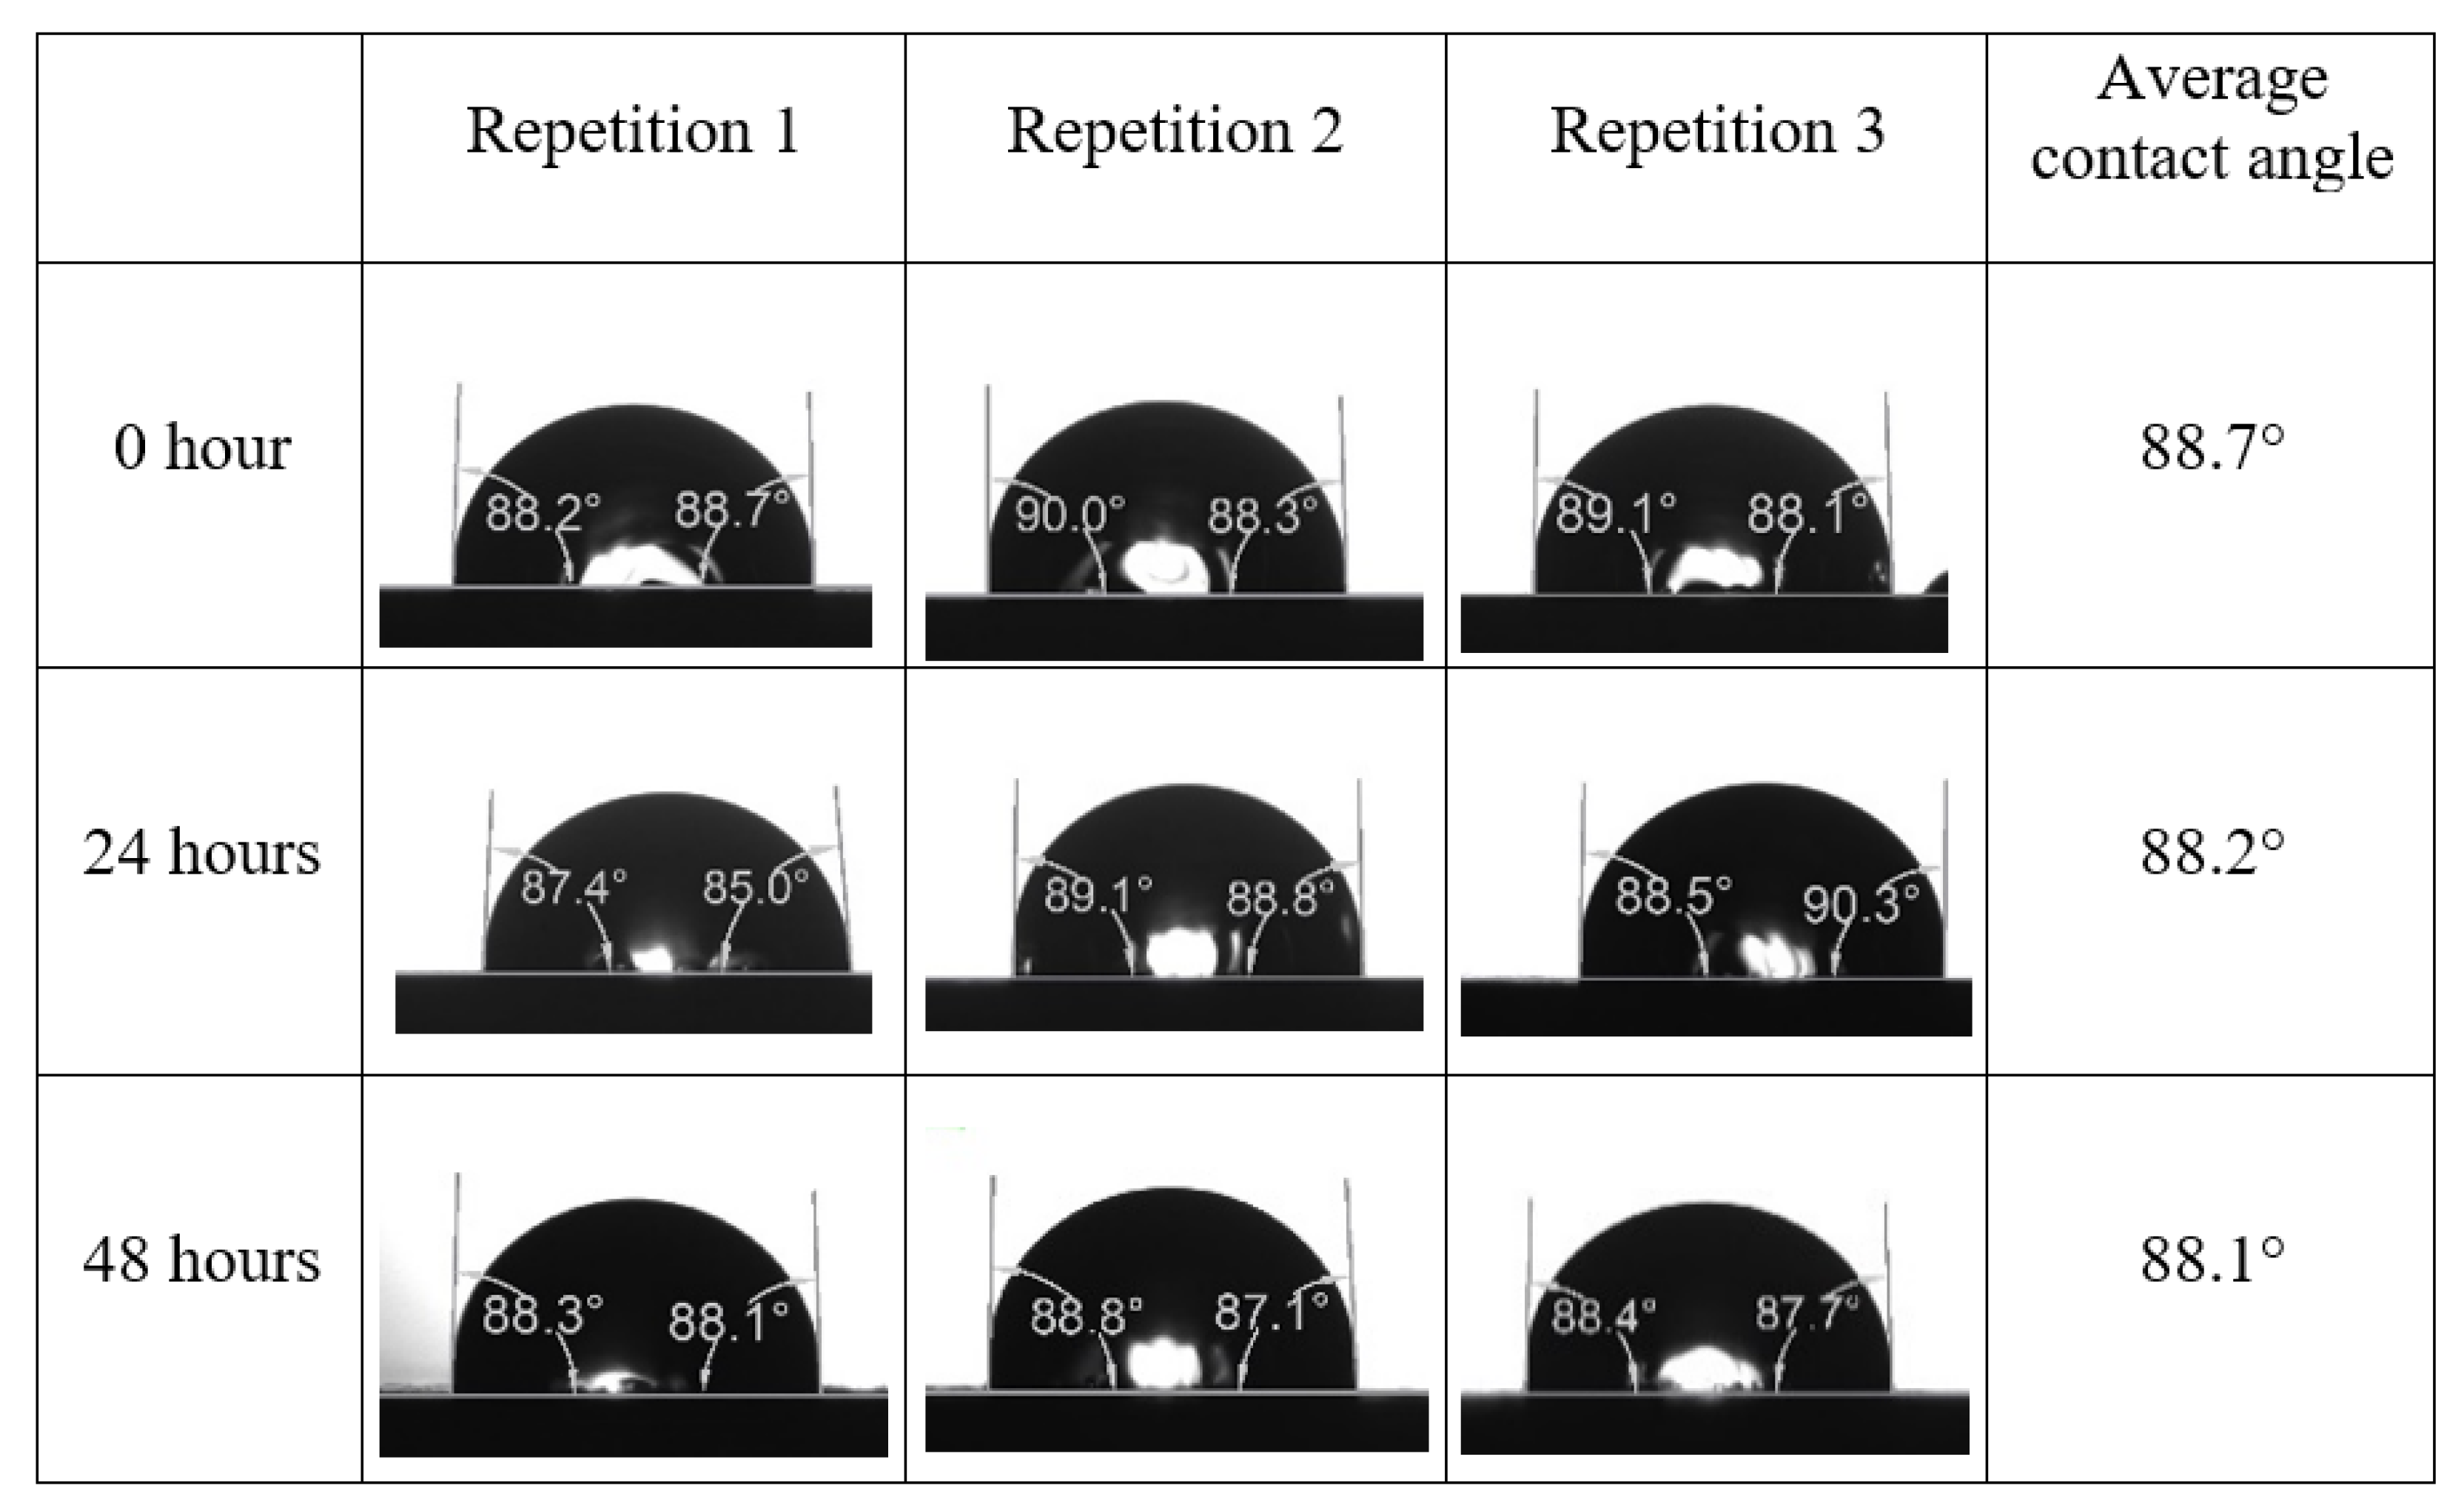
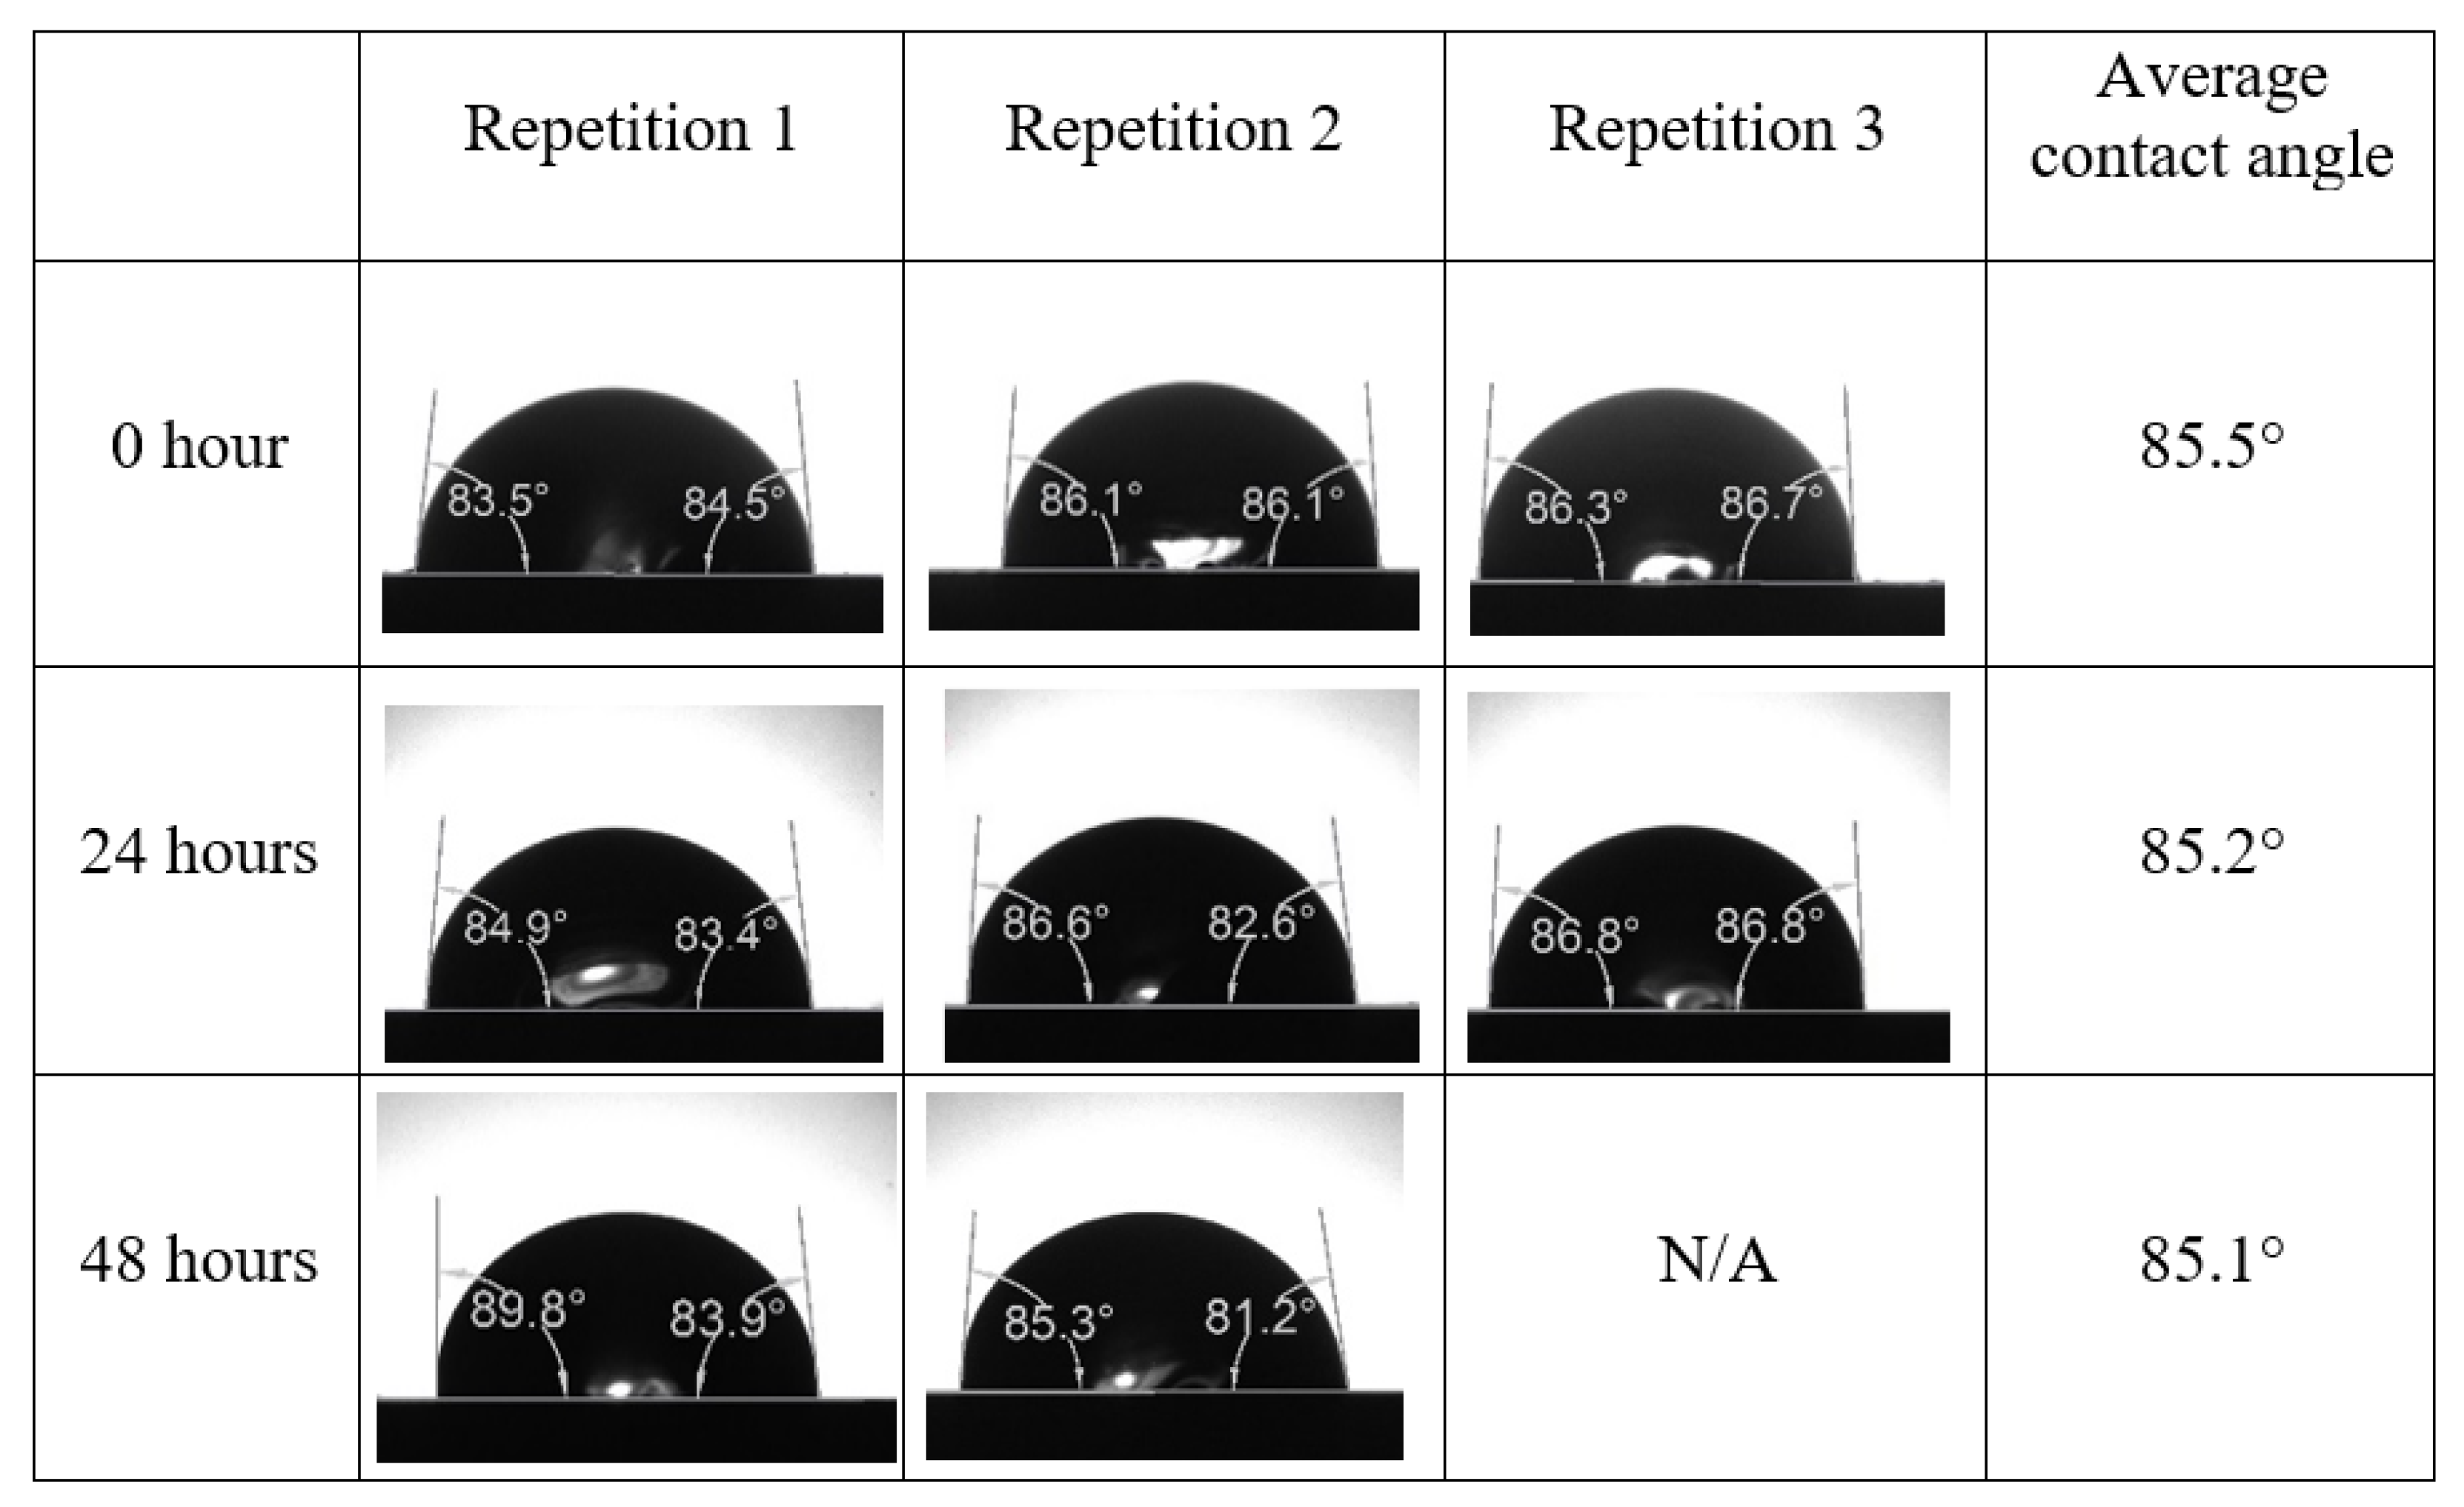
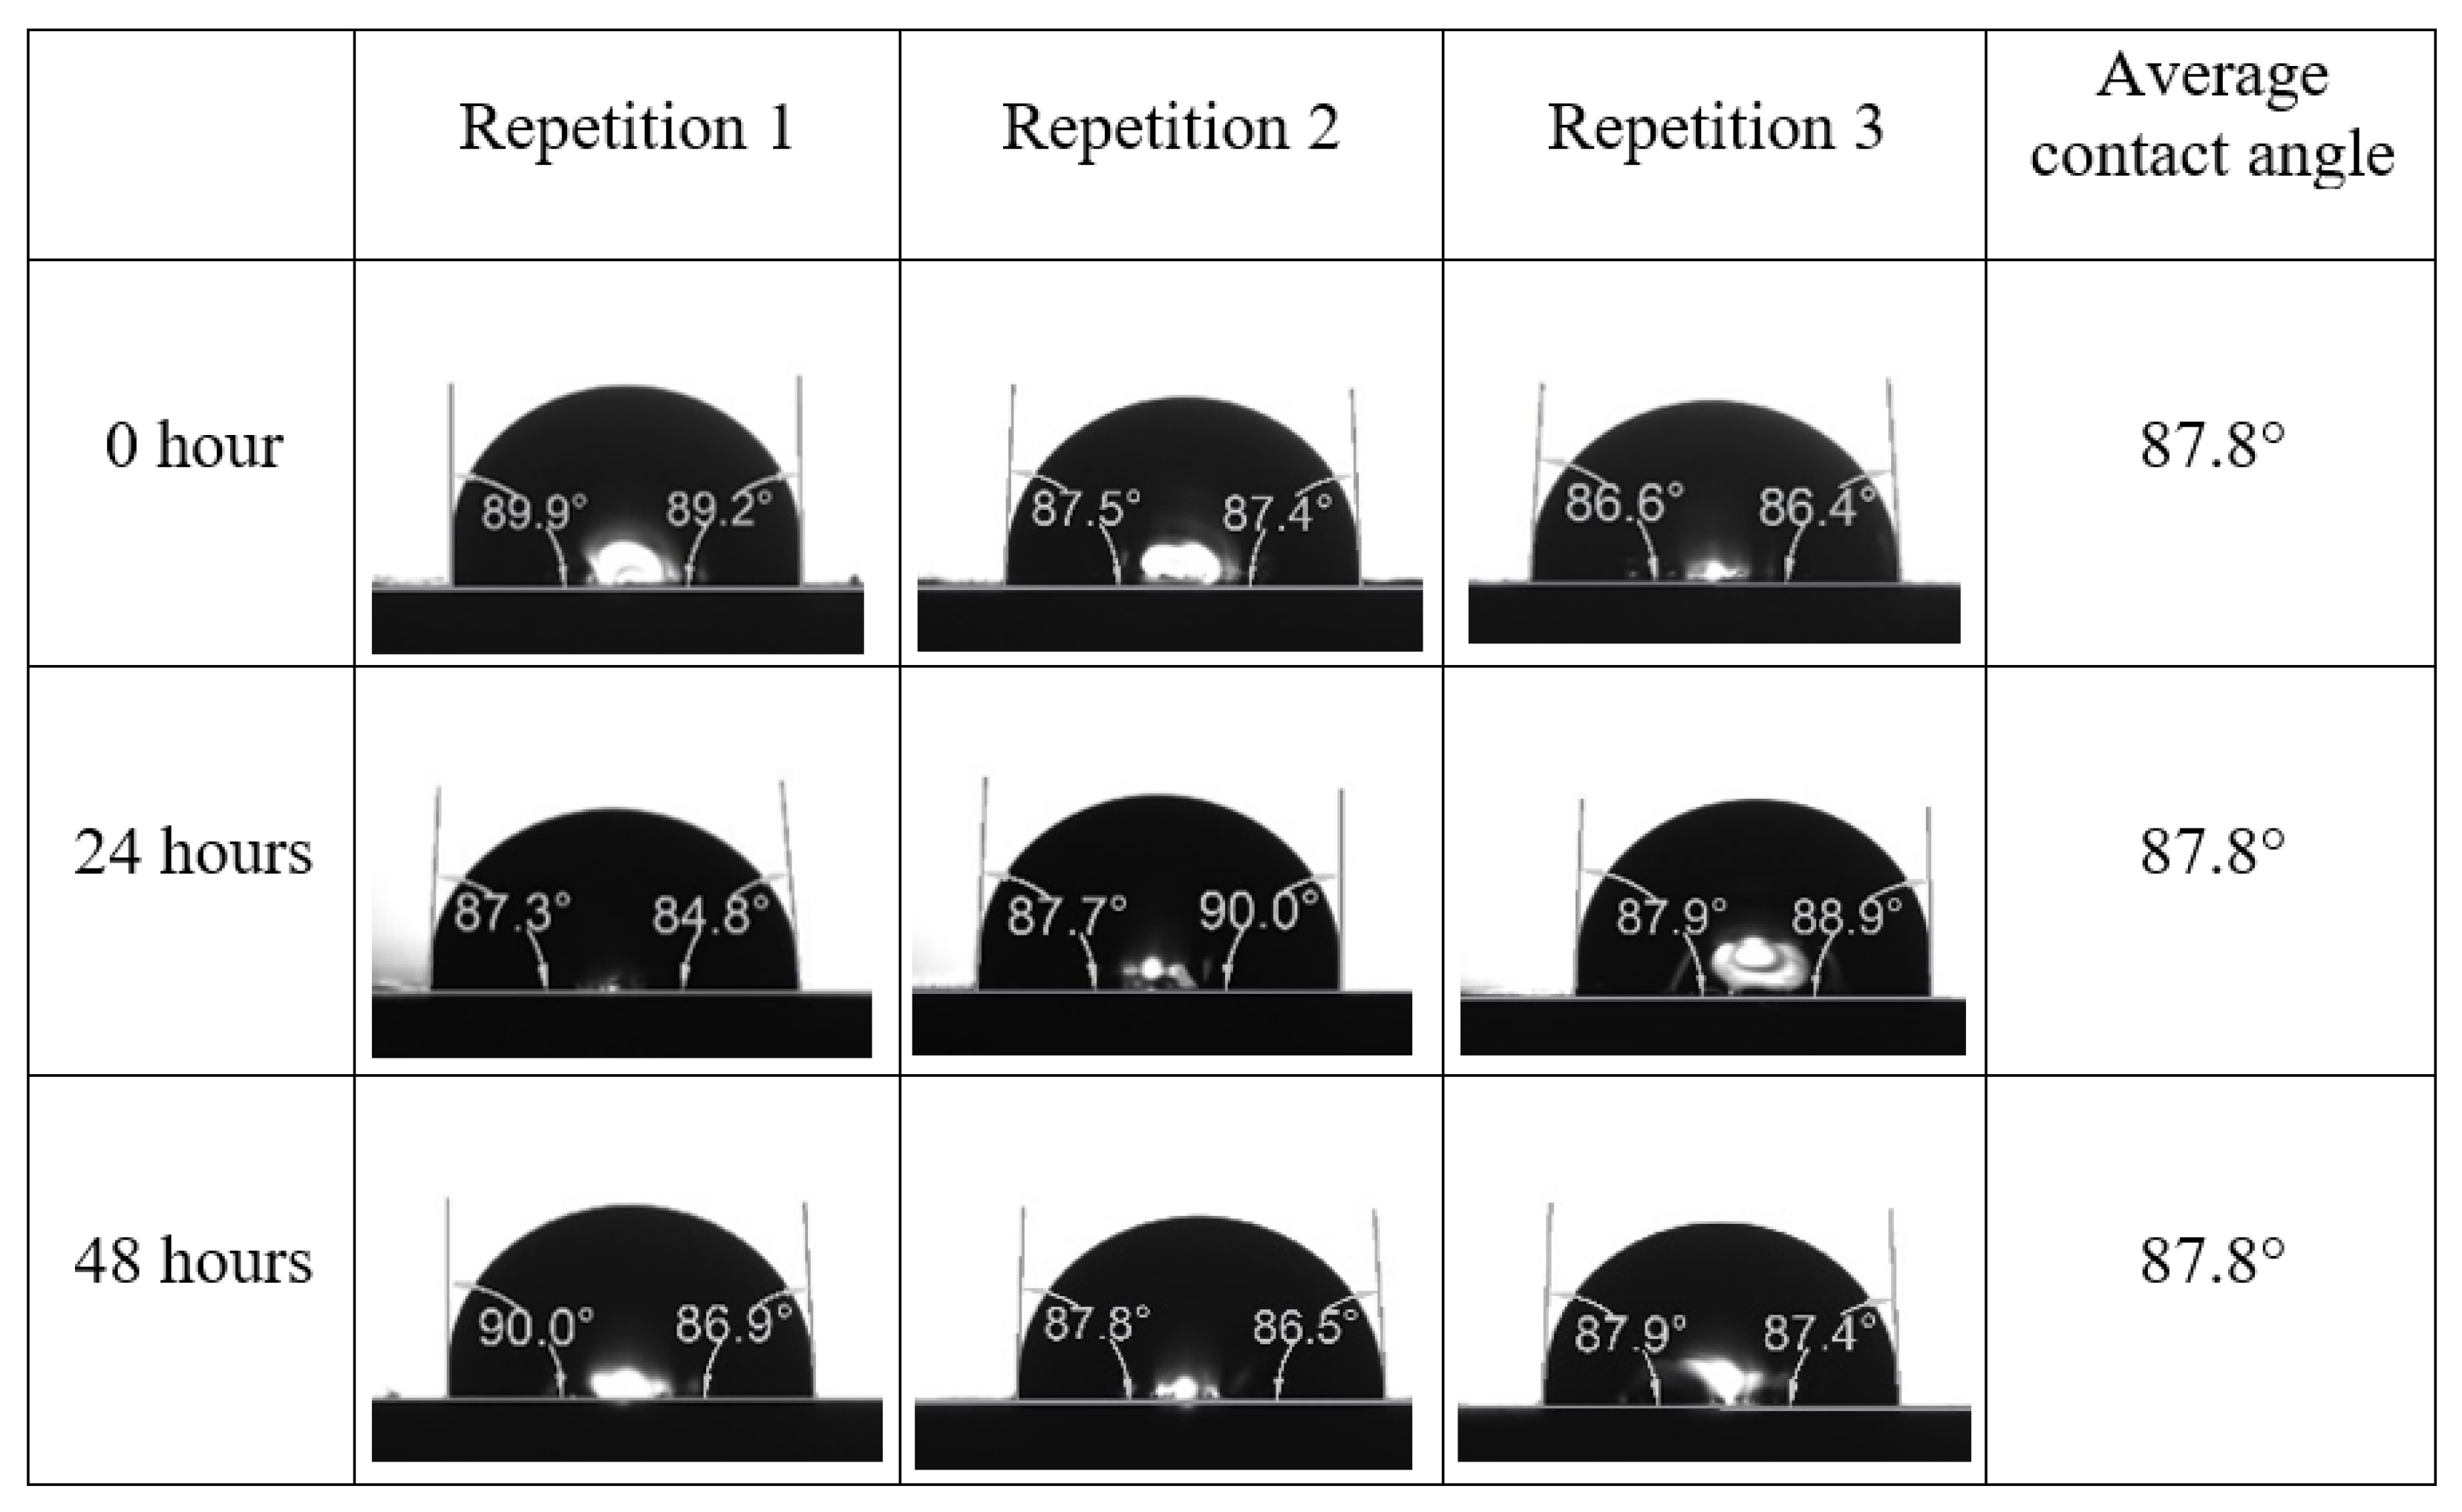
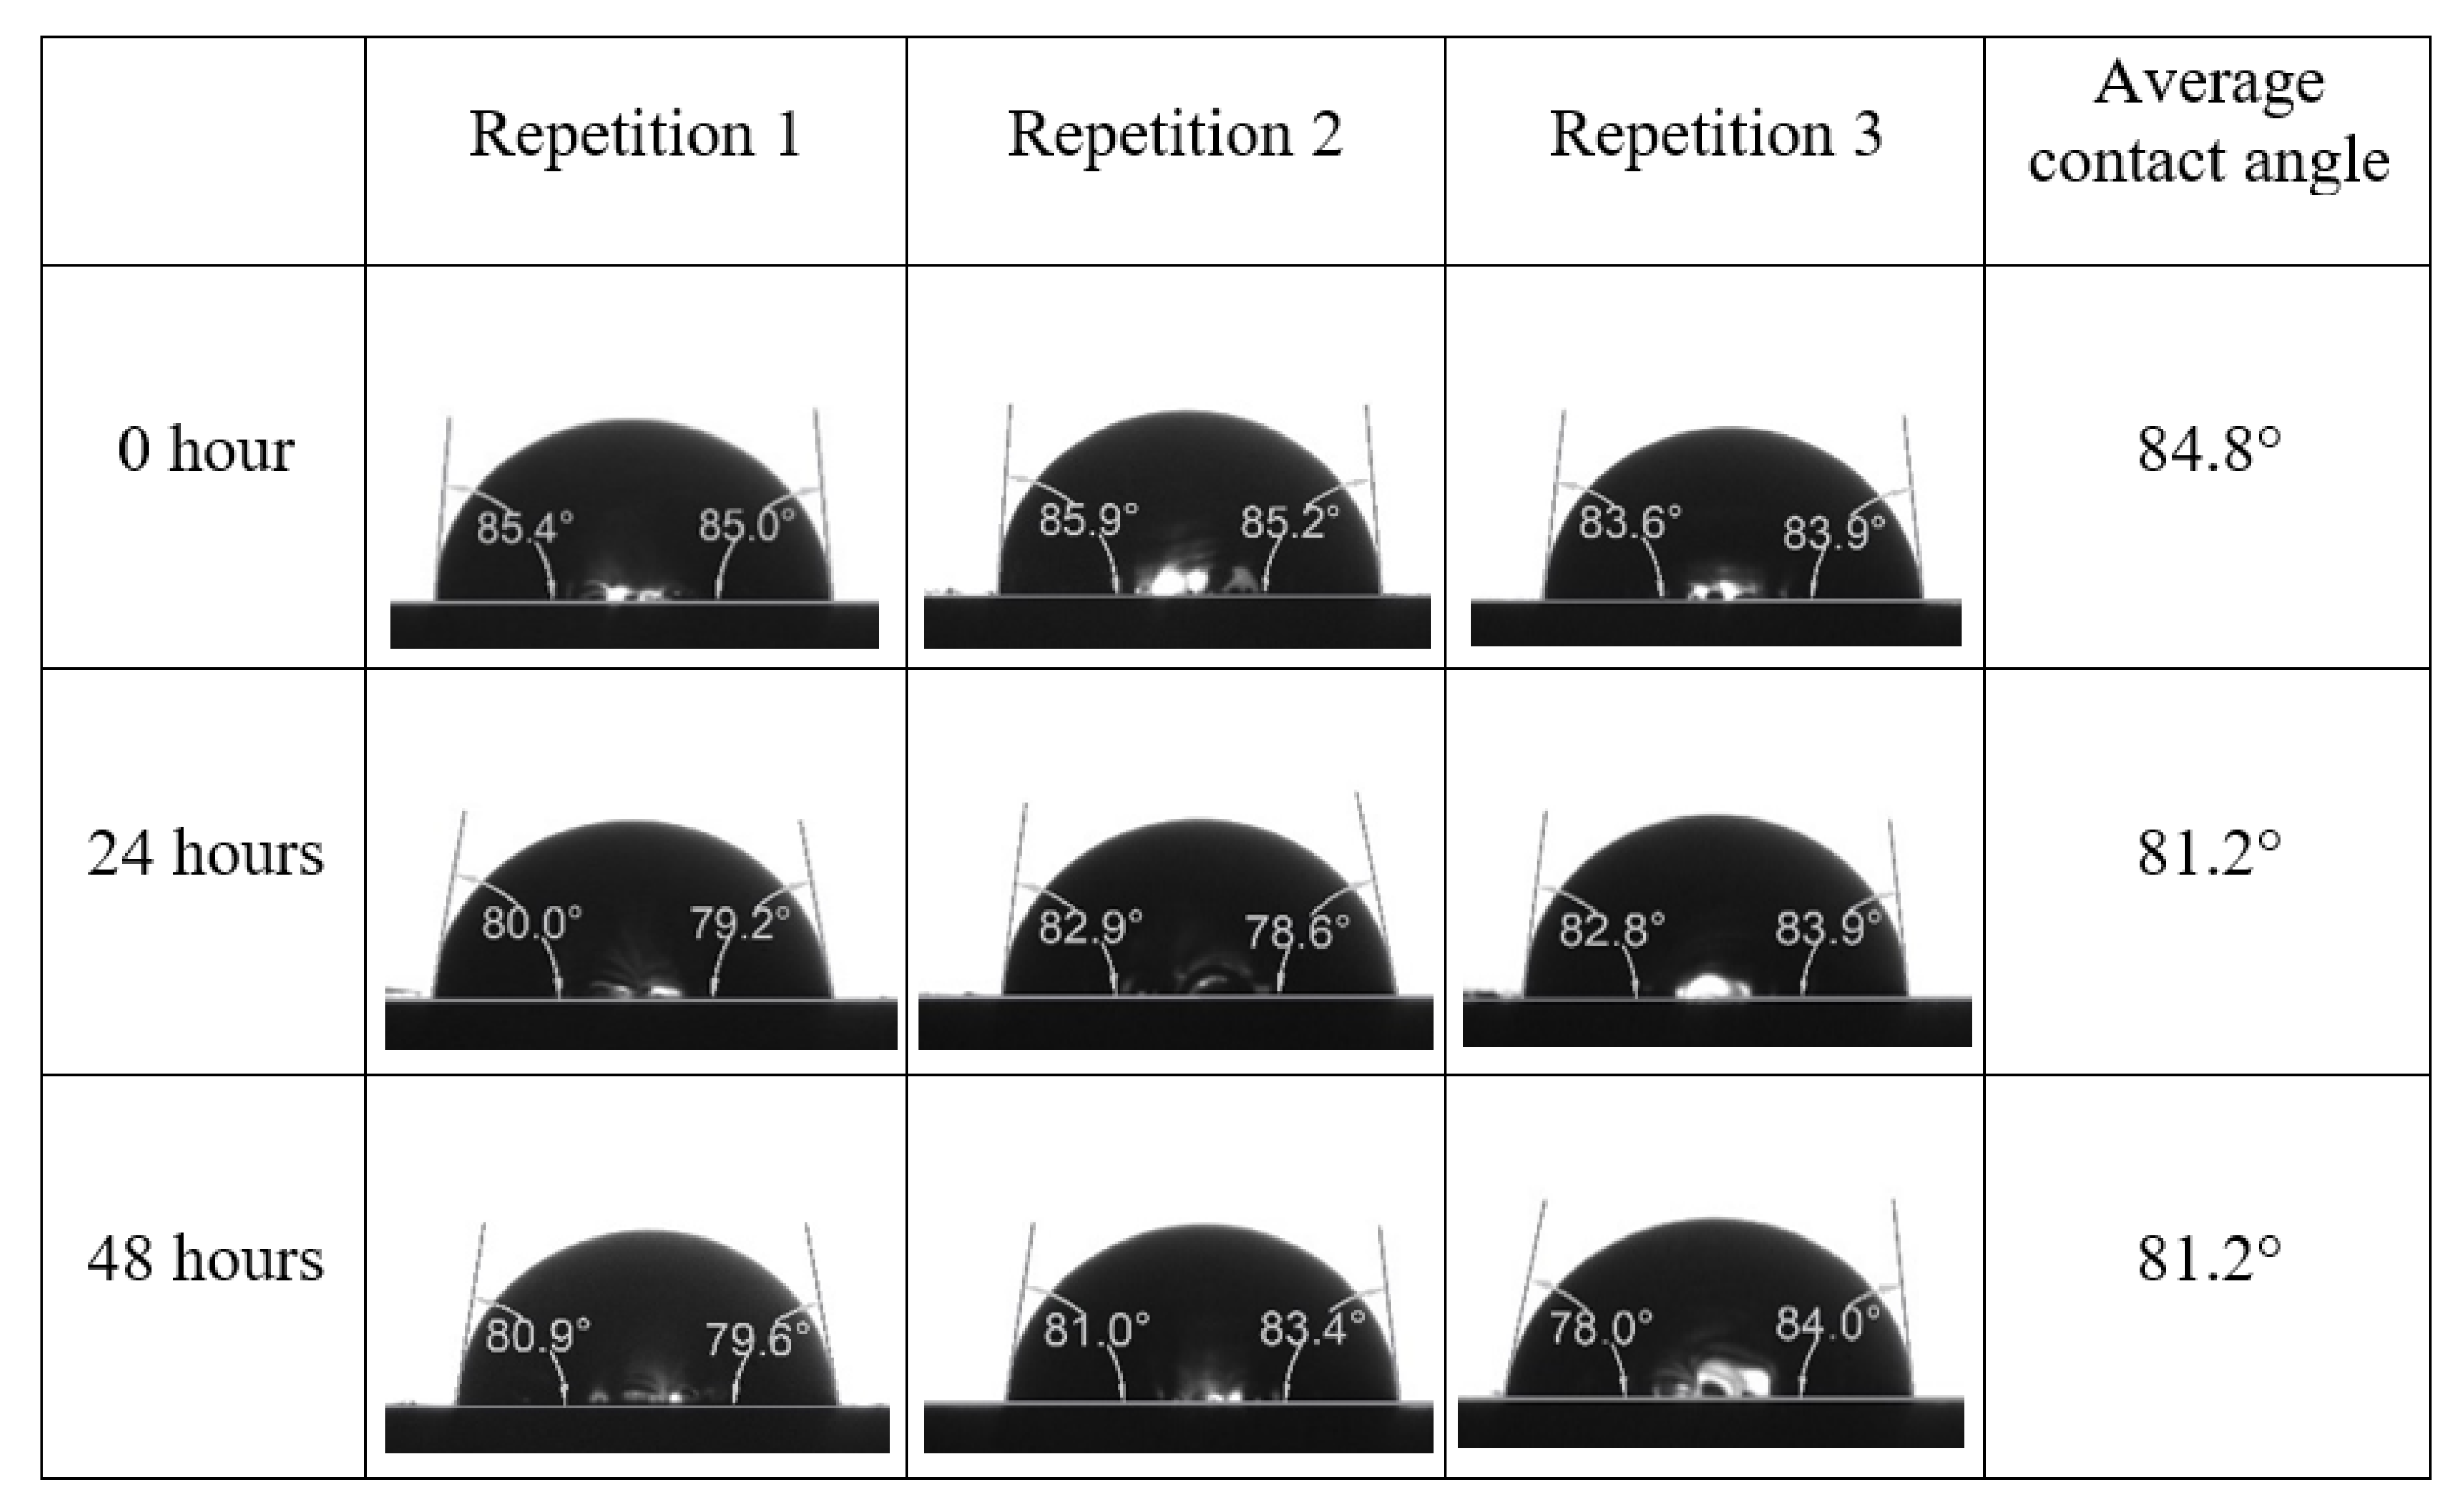
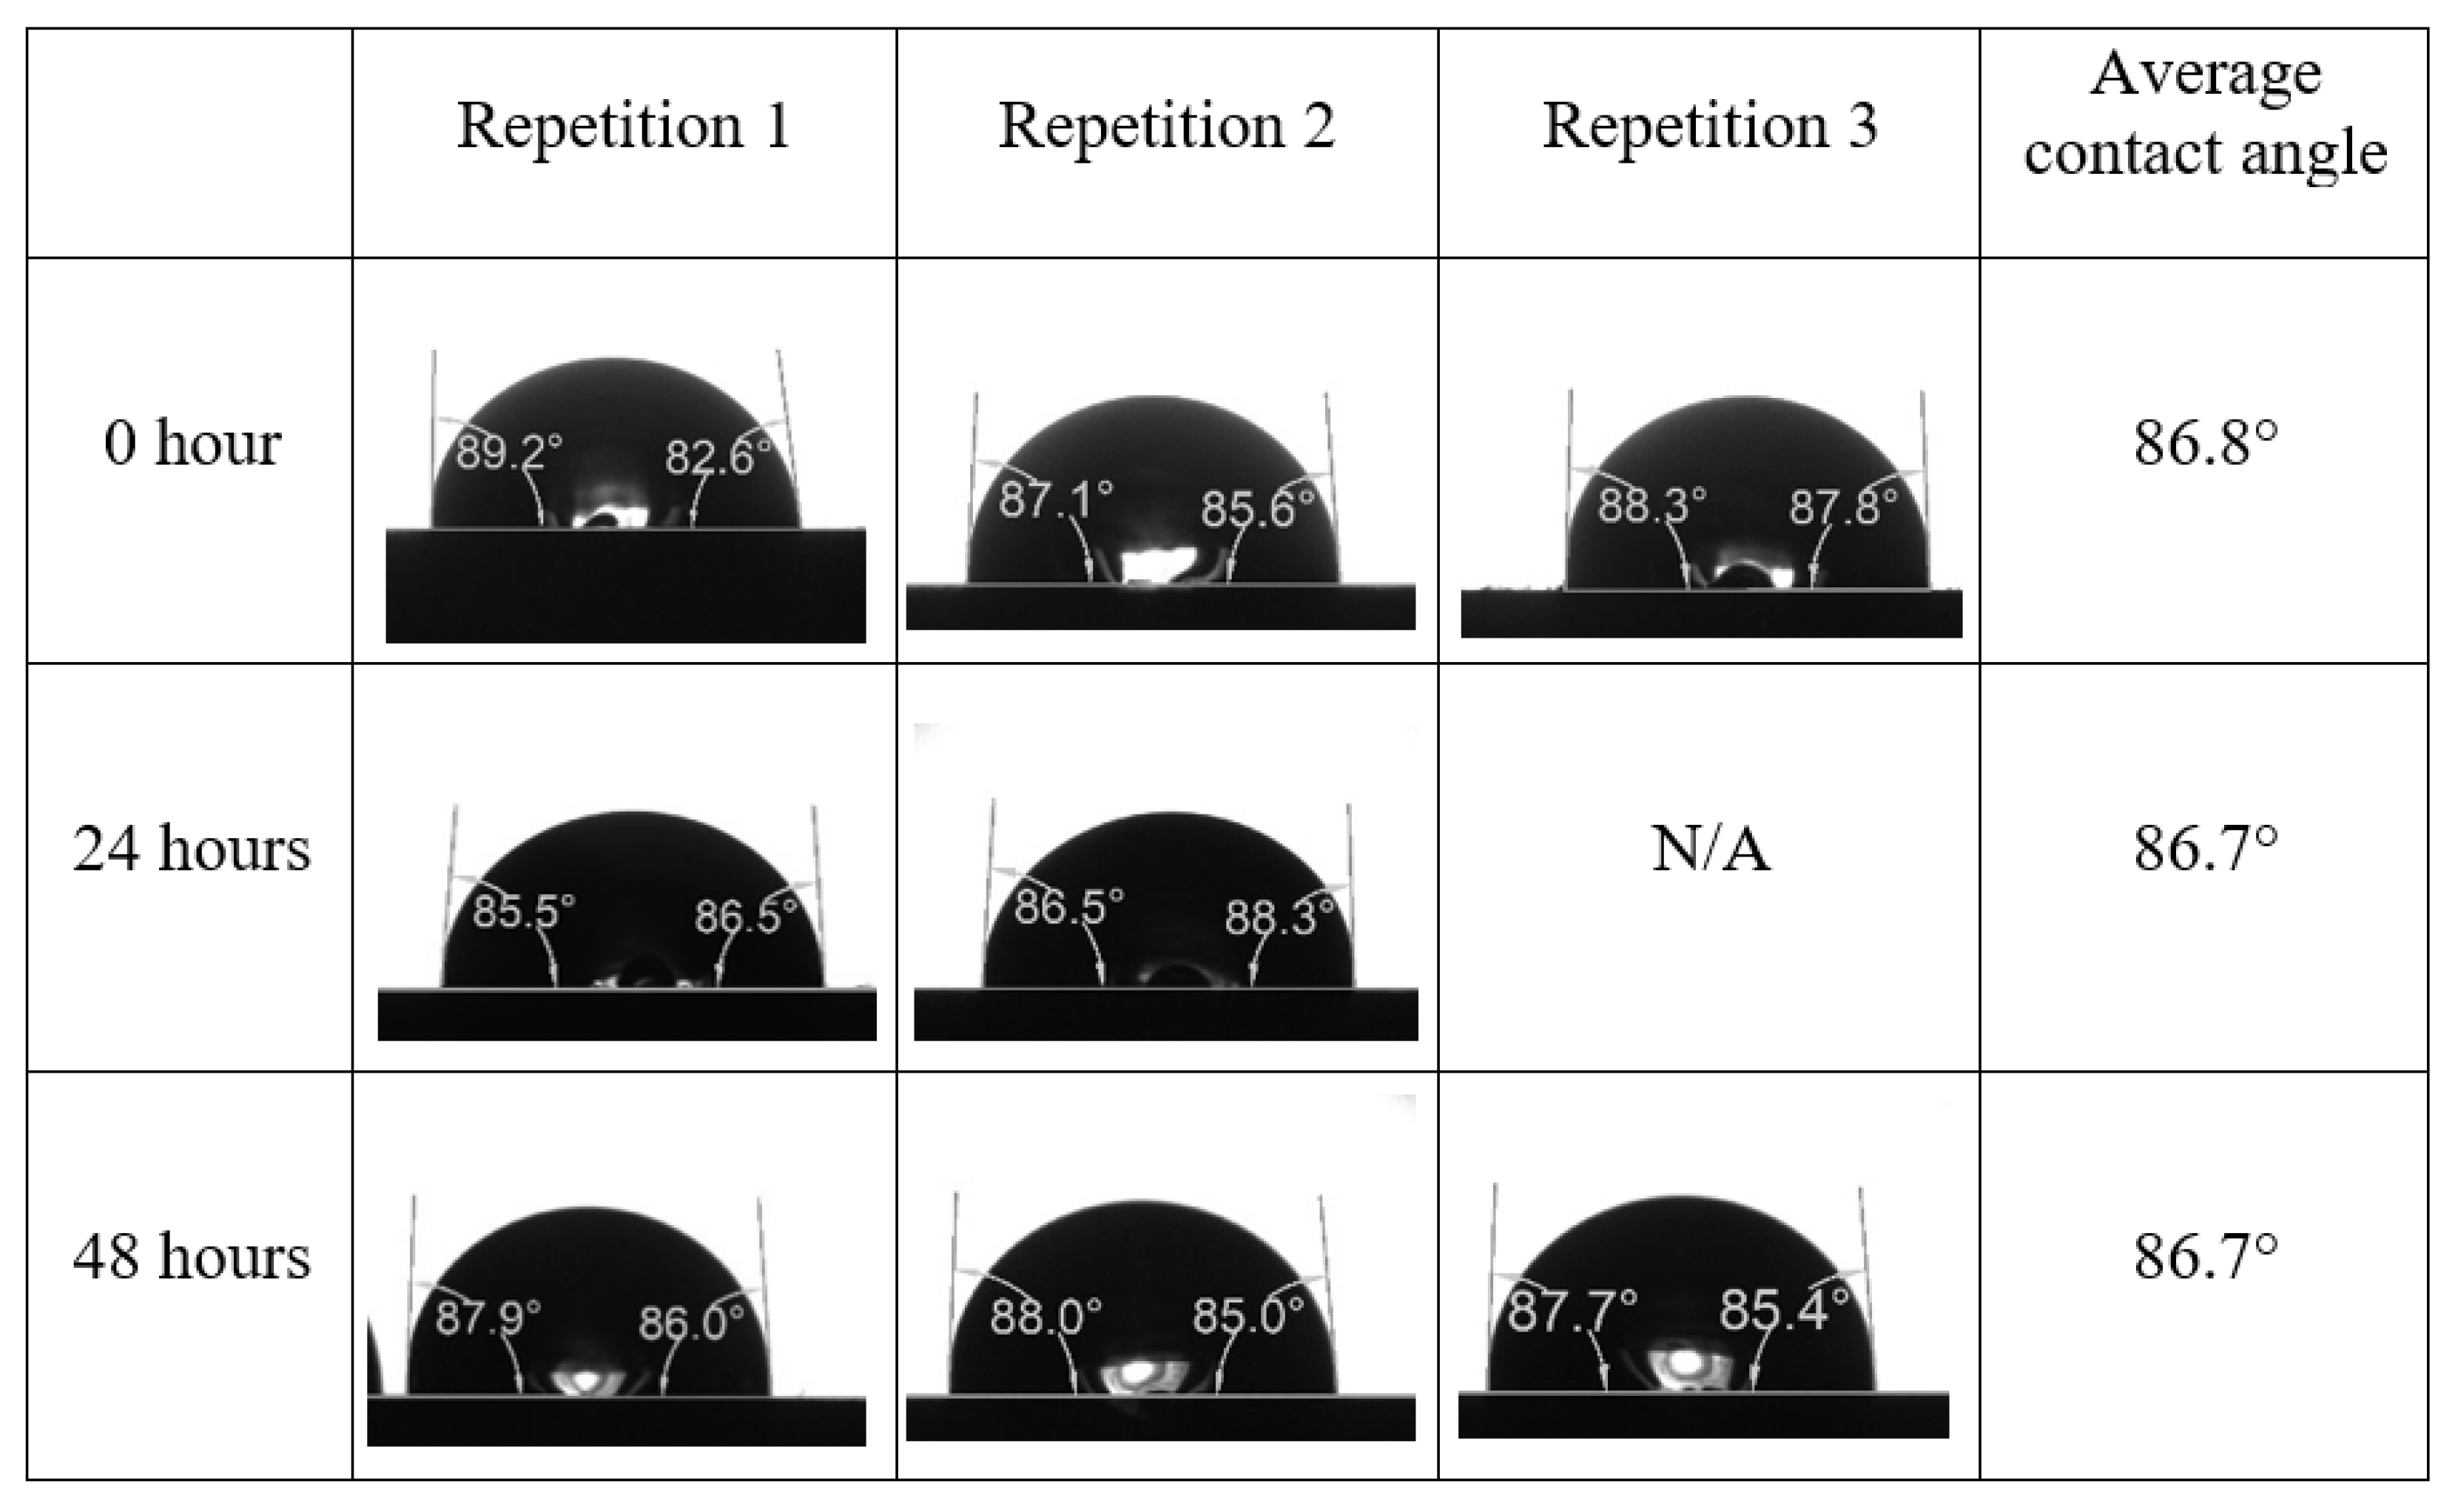
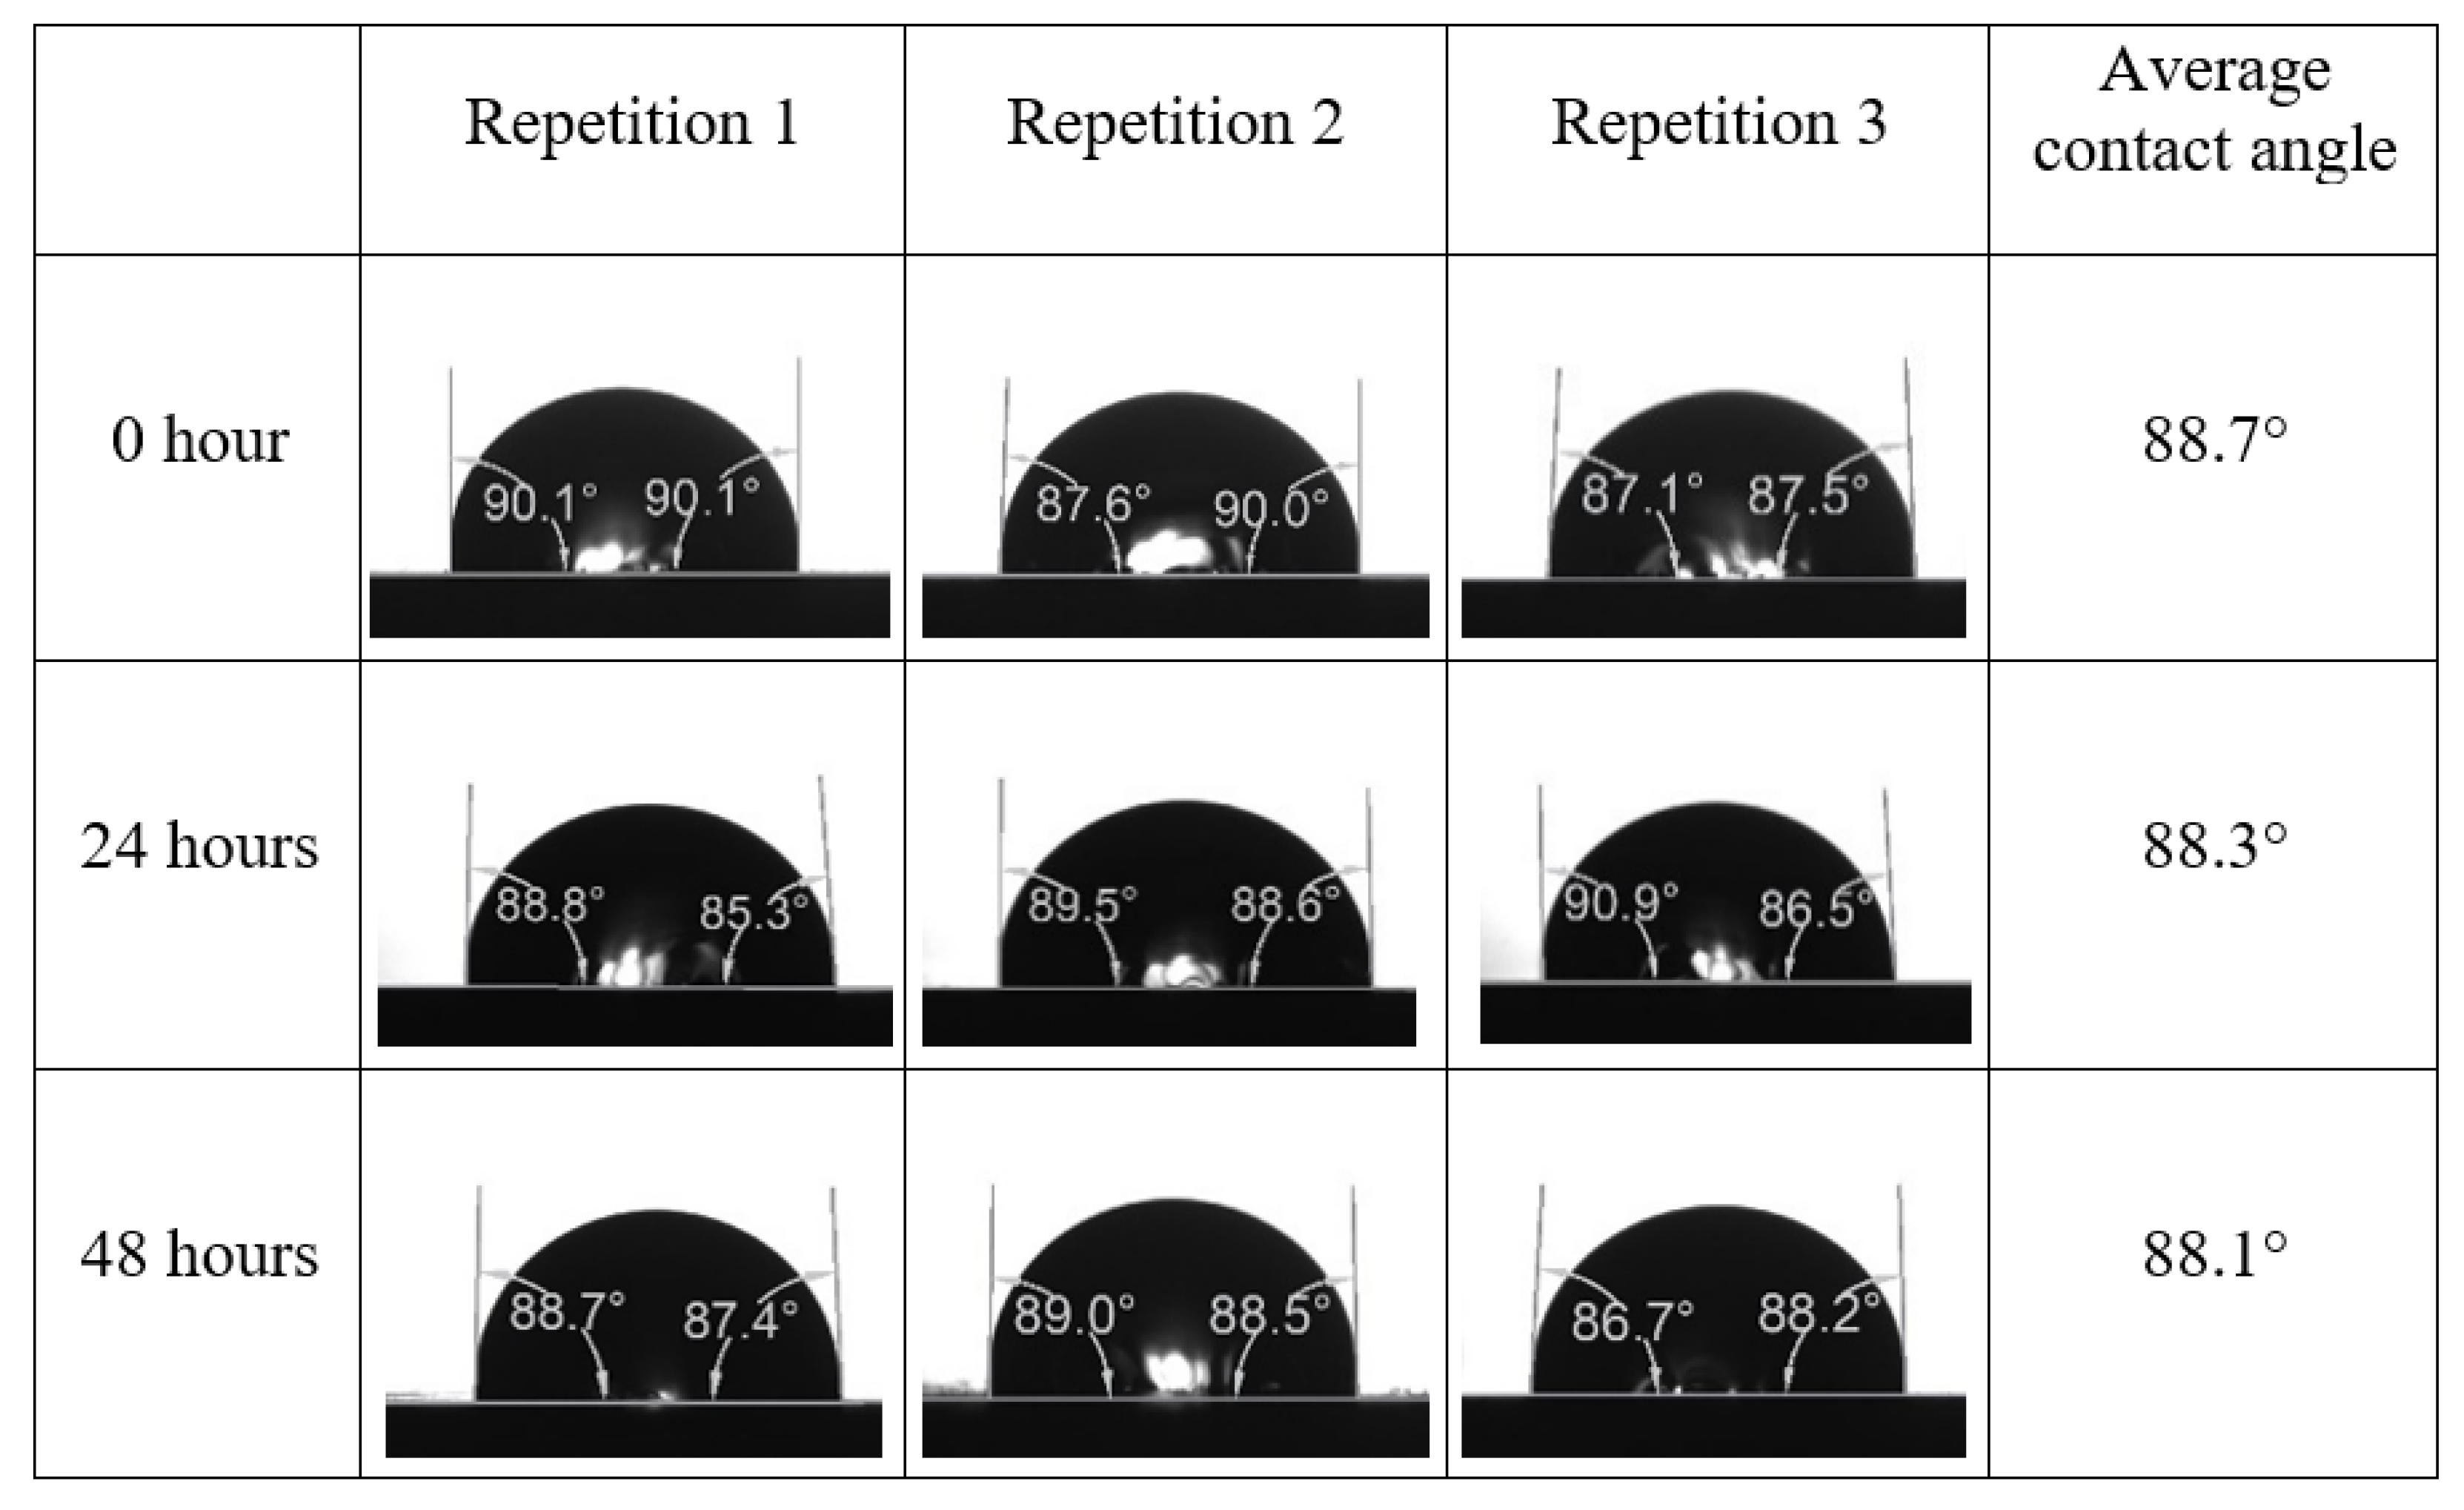
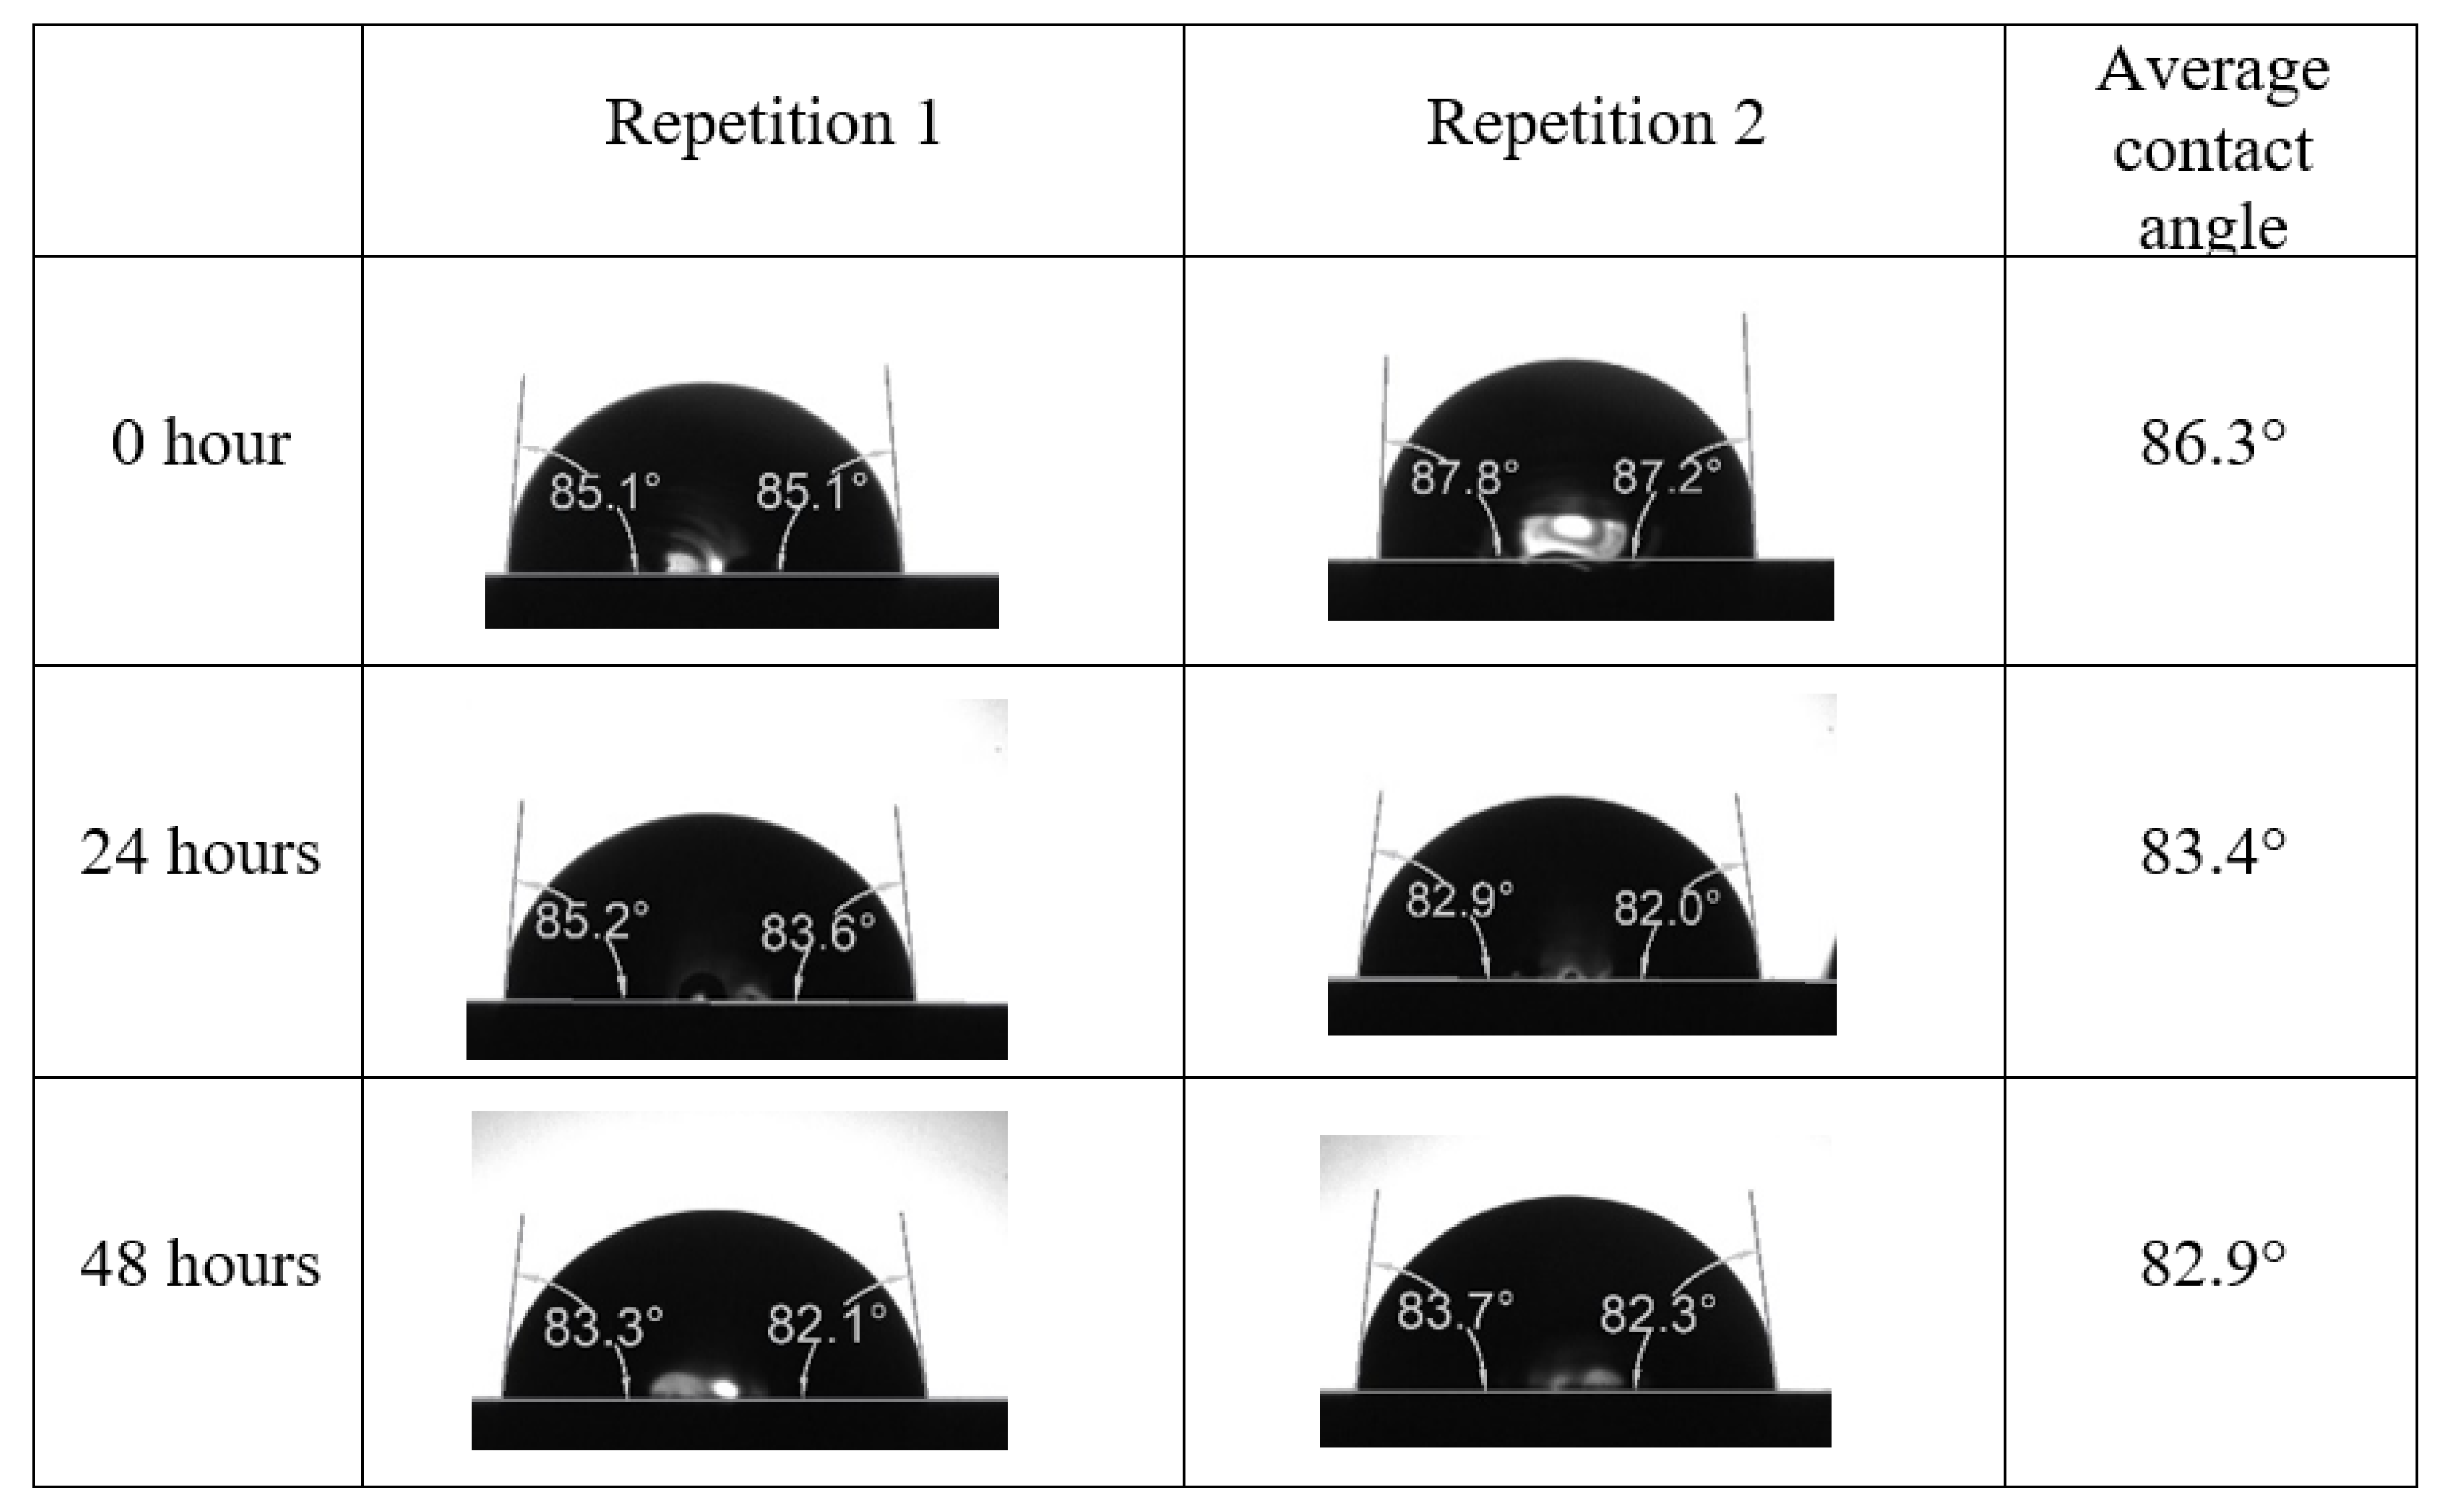
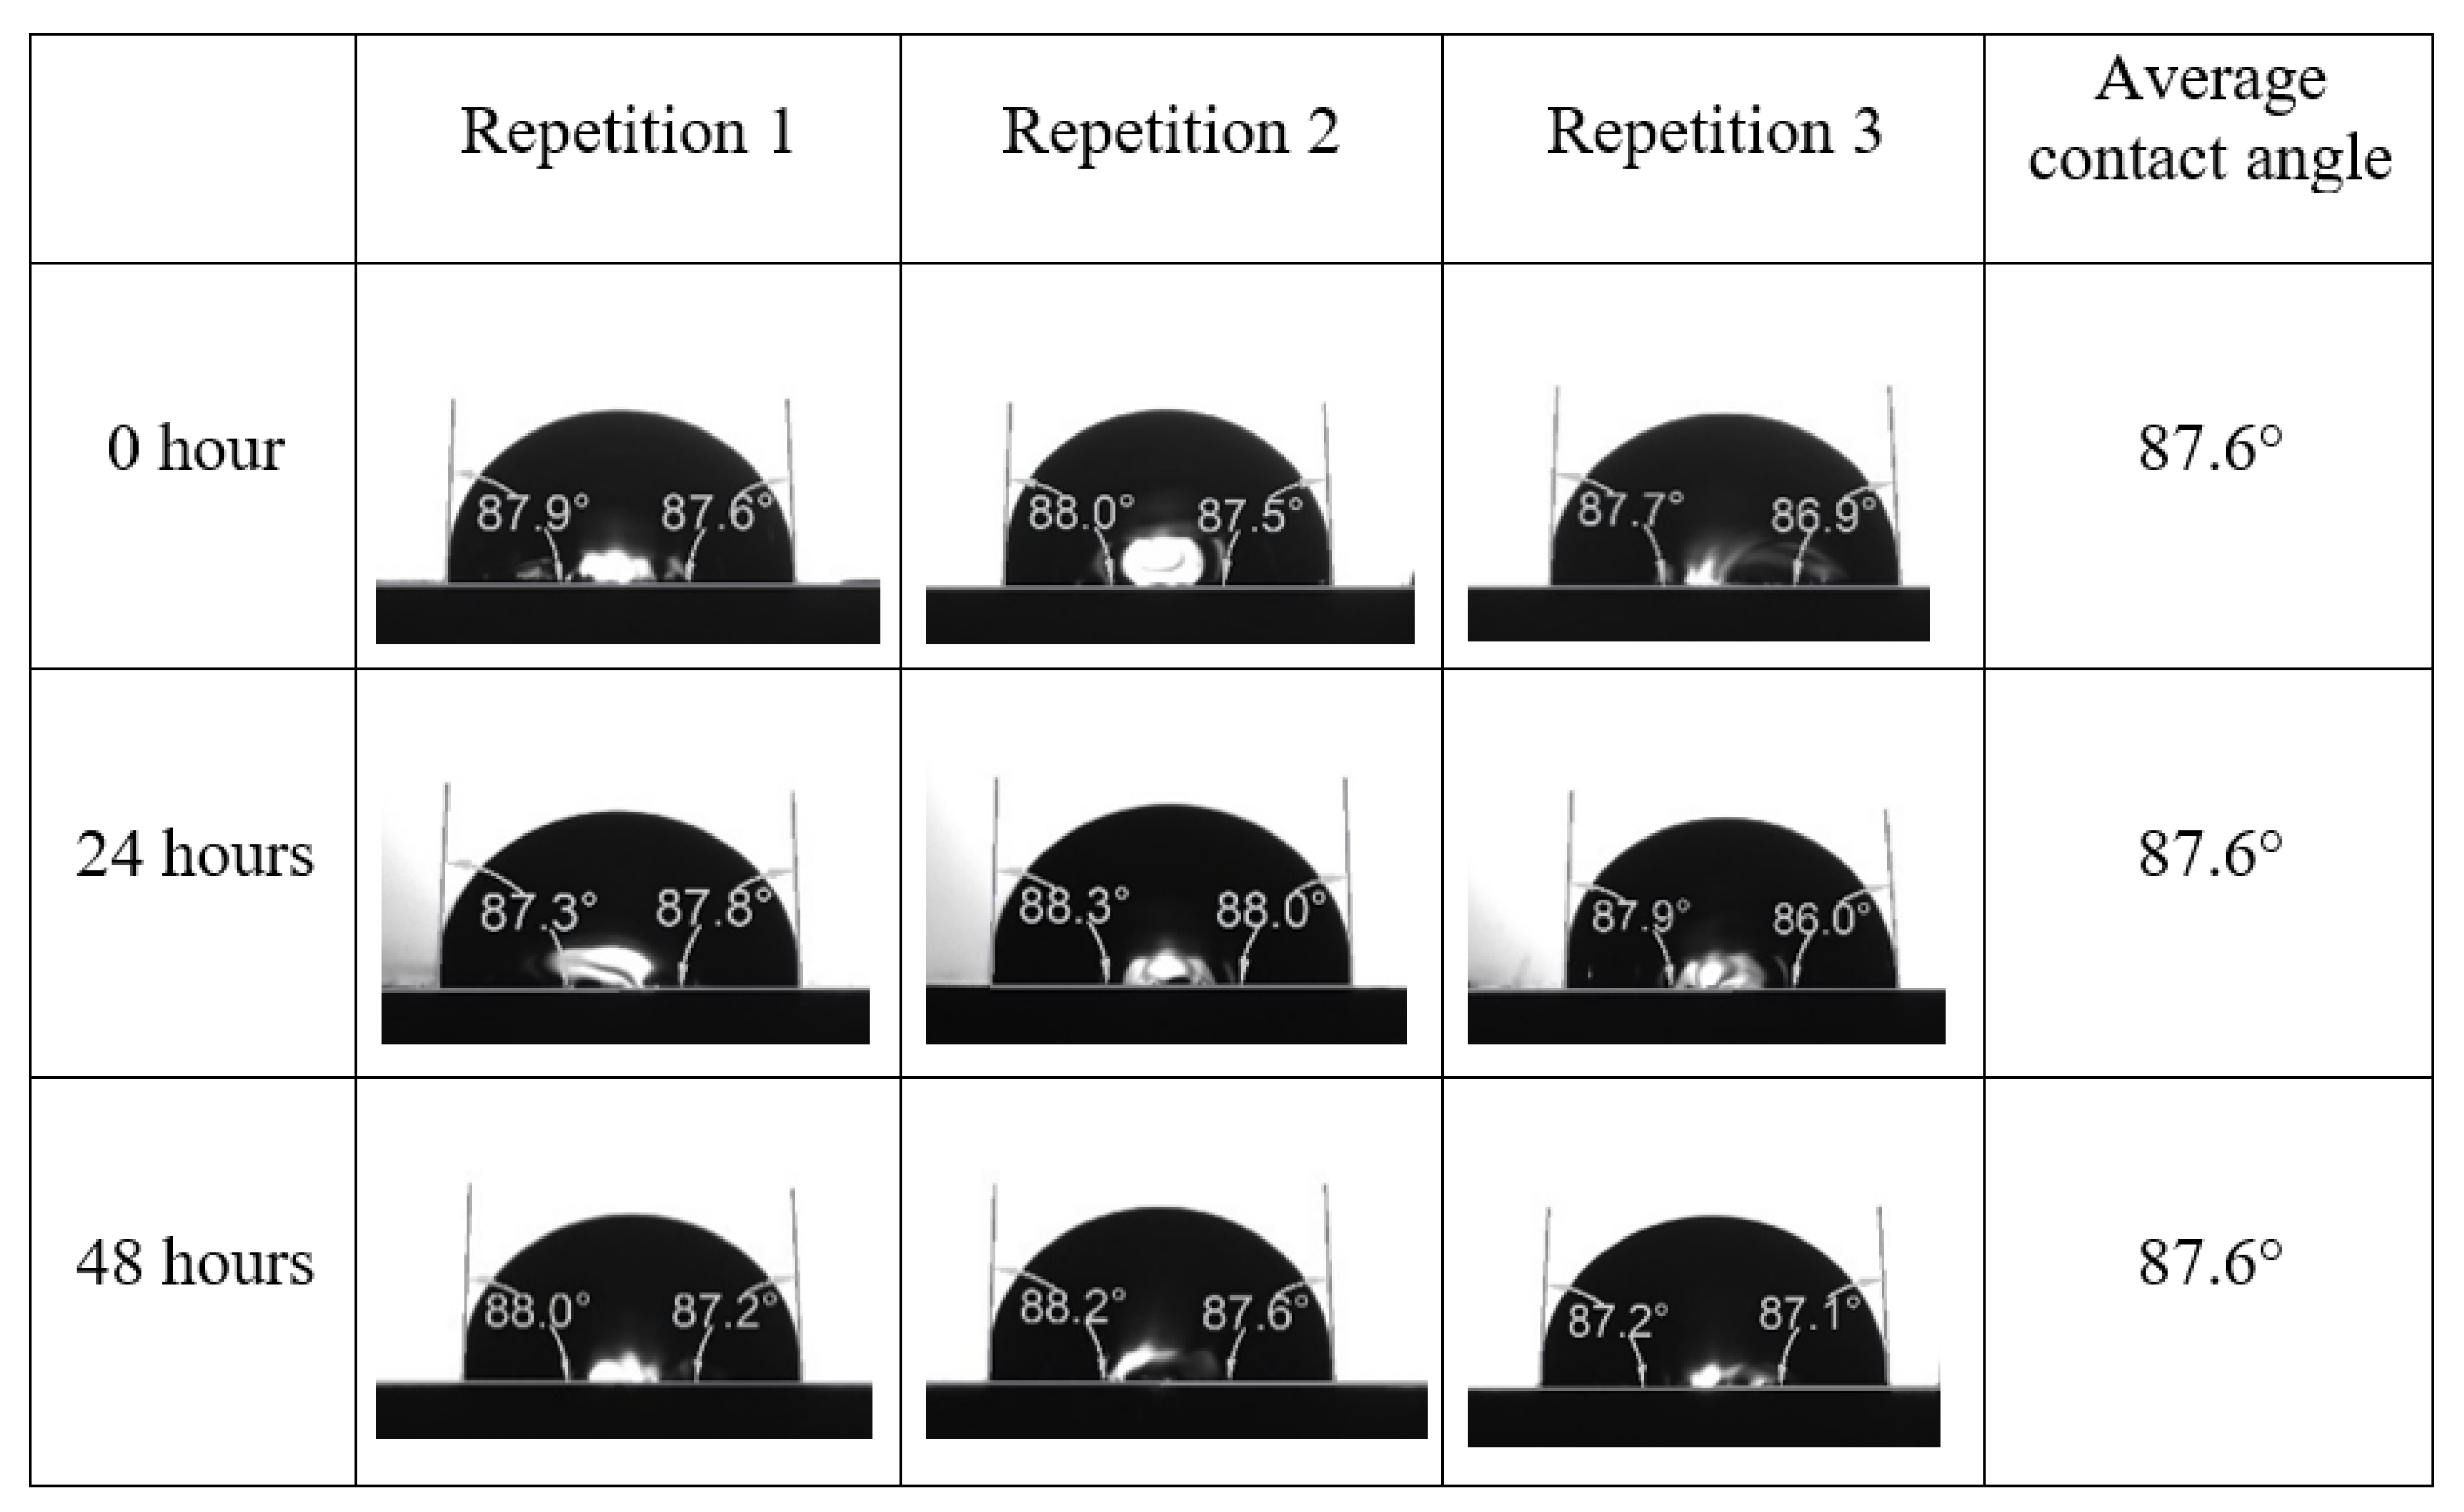
Appendix A. Contact Angle Measurements


References
- British Petroleum. BP Statistical Review of World Energy; BP: London, UK, 2020. [Google Scholar]
- Global, BP. BP Energy Outlook; Technical Report; 2018. Available online: https://www.bp.com (accessed on 18 January 2022).
- Bai, G.; Xu, Y. Giant fields retain dominance in reserves growth. Oil Gas J. 2014, 122, 44–51. [Google Scholar]
- Alvarado, V.; Manrique, E. Enhanced oil recovery: An update review. Energies 2010, 3, 1529–1575. [Google Scholar] [CrossRef]
- Akbar, M.; Vissapragada, B.; Alghamdi, A.H.; Allen, D.; Herron, M.; Carnegie, A.; Dutta, D.; Olesen, J.R.; Chourasiya, R.; Logan, D. A snapshot of carbonate reservoir evaluation. Oilfield Rev. 2000, 12, 20–21. [Google Scholar]
- Roehl, P.O.; Choquette, P.W. Carbonate Petroleum Reservoirs; Springer Science & Business Media: Berlin/Heidelberg, Germany, 2012. [Google Scholar]
- Kokal, S.; Al-Kaabi, A. Enhanced oil recovery: Challenges & opportunities. World Pet. Counc. Off. Publ. 2010, 64, 64–69. [Google Scholar]
- Taber, J.; Martin, F.; Seright, R. EOR Screening Criteria Revisited-P1: Introduction to Screening and EOR Field Projects. Part 2: Applications and Impact of Oil Prices. SPE Reserv. Eng. 1997, 189–220. [Google Scholar] [CrossRef] [Green Version]
- Sheng, J.J. Enhanced Oil Recovery Field Case Studies; Gulf Professional Publishing; Elsevier: Amsterdam, The Netherlands, 2013; Available online: www.elsevier.com/permissions (accessed on 18 January 2022).
- Moreno-Arciniegas, L.; Babadagli, T. Experimental analysis of optimal thermodynamic conditions for heavy-oil/bitumen recovery considering effective solvent retrieval. SPE Reserv. Eval. Eng. 2017, 20, 149–160. [Google Scholar] [CrossRef]
- Hartono, A.; Hakiki, F.; Syihab, Z.; Ambia, F.; Yasutra, A.; Sutopo, S.; Efendi, M.; Sitompul, V.; Primasari, I.; Apriandi, R. Revisiting EOR Projects in Indonesia through Integrated Study: EOR Screening, Predictive Model, and Optimisation; OnePetro; The Society of Petroleum Engineers (SPE): Richardson, TX, USA, 2017. [Google Scholar]
- Lake, L.W.; Johns, R.; Rossen, W.R.; Pope, G.A. Fundamentals of Enhanced Oil Recovery; The Society of Petroleum Engineers (SPE): Richardson, TX, USA, 2014. [Google Scholar]
- Lee, J.; Nikolov, A.; Wasan, D. Stability of aqueous foams in the presence of oil: On the importance of dispersed vs solubilized oil. Ind. Eng. Chem. Res. 2013, 52, 66–72. [Google Scholar] [CrossRef]
- Lee, S.; Kam, S. Enhanced Oil Recovery Field Case Studies: Chapter 2. Enhanced Oil Recovery by Using CO2 Foams: Fundamentals and Field Applications; Elsevier Inc.: Amsterdam, The Netherlands, 2013. [Google Scholar]
- Cuiec, L. Rock/crude-oil interactions and wettability: An attempt to understand their interrelation. In SPE Annual Technical Conference and Exhibition; OnePetro; The Society of Petroleum Engineers (SPE): Richardson, TX, USA, 1984. [Google Scholar]
- Al-Shalabi, E.W. A New Insight into Modeling of Polymer Flooding in Carbonate Reservoirs. In SPE Latin American and Caribbean Petroleum Engineering Conference; OnePetro; The Society of Petroleum Engineers (SPE): Richardson, TX, USA, 2020. [Google Scholar]
- Xu, Z.X.; Li, S.Y.; Li, B.F.; Chen, D.Q.; Liu, Z.Y.; Li, Z.M. A review of development methods and EOR technologies for carbonate reservoirs. Pet. Sci. 2020, 17, 990–1013. [Google Scholar] [CrossRef]
- Lake, L.W. Enhanced Oil Recovery; Book, OCLC Number: 18134781; Prentice Hall: Englewood Cliffs, NJ, USA, 1989. [Google Scholar]
- Rossen, W.R. Foams in enhanced oil recovery. Foam. Theory Meas. Appl. 1996, 57, 413–464. [Google Scholar]
- Hassan, A.; Ayoub, M.; Eissa, M.; Bruining, H.; Al-Mansour, A.; Al-Quraishi, A. A New Hybrid Improved and Enhanced Oil Recovery IOR/EOR Process Using Smart Water Assisted Foam SWAF Flooding in Carbonate Rocks; A Laboratory Study Approach. In International Petroleum Technology Conference; OnePetro; The Society of Petroleum Engineers (SPE): Richardson, TX, USA, 2021. [Google Scholar]
- Yuncong, G.; Mifu, Z.; Jianbo, W.; Chang, Z. Performance and gas breakthrough during CO2 immiscible flooding in ultra-low permeability reservoirs. Pet. Explor. Dev. 2014, 41, 88–95. [Google Scholar]
- Masalmeh, S.K.; Wei, L.; Blom, C. Mobility control for gas injection in heterogeneous carbonate reservoirs: Comparison of foams versus polymers. In SPE Middle East Oil and Gas Show and Conference; OnePetro; The Society of Petroleum Engineers (SPE): Richardson, TX, USA, 2011. [Google Scholar]
- Dullien, F.; Chatzis, I.; Kantzas, A. Laboratory studies of macroscopic and microscopic mechanisms of immiscible gas drive-gravity drainage recovery. In Proceeding of the 3rd International Symposium on Enhanced Oil Recovery and III Simposio International Sobre Recuperation Mejorada de Crudo, Maracaibo, Venezuela, February 1989; Volume 1, pp. 424–437. [Google Scholar]
- Tunio, S.Q.; Chandio, T.A.; Memon, M.K. Comparative study of FAWAG and SWAG as an effective EOR technique for a Malaysian field. Res. J. Appl. Sci. Eng. Technol. 2012, 4, 645–648. [Google Scholar]
- Aarra, M.; Skauge, A.; Martinsen, H. FAWAG: A Breakthrough for EOR in the North Sea. In SPE Annual Technical Conference and Exhibition; OnePetro; The Society of Petroleum Engineers (SPE): Richardson, TX, USA, 2002. [Google Scholar]
- Blaker, T.; Aarra, M.G.; Skauge, A.; Rasmussen, L.; Celius, H.K.; Martinsen, H.A.; Vassenden, F. Foam for gas mobility control in the Snorre field: The FAWAG project. SPE Reserv. Eval. Eng. 2002, 5, 317–323. [Google Scholar] [CrossRef]
- Simjoo, M.; Rezaei, T.; Andrianov, A.; Zitha, P. Foam stability in the presence of oil: Effect of surfactant concentration and oil type. Colloids Surfaces A Physicochem. Eng. Asp. 2013, 438, 148–158. [Google Scholar] [CrossRef]
- Farajzadeh, R.; Andrianov, A.; Krastev, R.; Hirasaki, G.; Rossen, W.R. Foam–oil interaction in porous media: Implications for foam assisted enhanced oil recovery. Adv. Colloid Interface Sci. 2012, 183, 1–13. [Google Scholar] [CrossRef]
- Hassan, A.; Ayoub, M.; Eissa, M.; Bruining, H.; Al-Mansour, A.; Al-Guraishi, A. A Novel Hybrid Enhanced Oil Recovery Method by Smart Water-Injection and Foam-Flooding in Carbonate Reservoirs. In SPE/IATMI Asia Pacific Oil & Gas Conference and Exhibition; OnePetro; The Society of Petroleum Engineers (SPE): Richardson, TX, USA, 2019. [Google Scholar]
- Hassan, A.M.; Ayoub, M.; Eissa, M.; Bruining, H.; Zitha, P. Study of surface complexation modeling on a novel hybrid enhanced oil recovery (EOR) method; smart-water assisted foam-flooding. J. Pet. Sci. Eng. 2020, 195, 107563. [Google Scholar] [CrossRef]
- Hassan, A.; Ayoub, M.; Eissa, M.; Bruining, H.; Al-Mansour, A.; Al-Guraishi, A. A Study of Combined Low Salinity Foam Injection Using DLVO Theory and Surface Complexation Modeling. In Offshore Technology Conference Asia. Offshore Technology Conference; OnePetro; The Society of Petroleum Engineers (SPE): Richardson, TX, USA, 2020. [Google Scholar]
- Hassan, A.M.; Ayoub, M.; Eissa, M.; Musa, T.; Bruining, H.; Farajzadeh, R. Exergy return on exergy investment analysis of natural-polymer (Guar-Arabic gum) enhanced oil recovery process. Energy 2019, 181, 162–172. [Google Scholar] [CrossRef] [Green Version]
- Bera, A.; Belhaj, H. Application of nanotechnology by means of nanoparticles and nanodispersions in oil recovery-A comprehensive review. J. Nat. Gas Sci. Eng. 2016, 34, 1284–1309. [Google Scholar] [CrossRef]
- Nazari Moghaddam, R.; Bahramian, A.; Fakhroueian, Z.; Karimi, A.; Arya, S. Comparative study of using nanoparticles for enhanced oil recovery: Wettability alteration of carbonate rocks. Energy Fuels 2015, 29, 2111–2119. [Google Scholar] [CrossRef]
- Manan, M.; Farad, S.; Piroozian, A.; Esmail, M. Effects of nanoparticle types on carbon dioxide foam flooding in enhanced oil recovery. Pet. Sci. Technol. 2015, 33, 1286–1294. [Google Scholar] [CrossRef]
- Olayiwola, S.O.; Dejam, M. A comprehensive review on interaction of nanoparticles with low salinity water and surfactant for enhanced oil recovery in sandstone and carbonate reservoirs. Fuel 2019, 241, 1045–1057. [Google Scholar] [CrossRef]
- Sagala, F.; Montoya, T.; Hethnawi, A.; Vitale, G.; Nassar, N.N. Nanopyroxene-based nanofluids for enhanced oil recovery in sandstone cores at reservoir temperature. Energy Fuels 2019, 33, 877–890. [Google Scholar] [CrossRef]
- Norrman, J.; Solberg, A.; Sjoblom, J.; Paso, K. Nanoparticles for waxy crudes: Effect of polymer coverage and the effect on wax crystallization. Energy Fuels 2016, 30, 5108–5114. [Google Scholar] [CrossRef]
- Franco, C.A.; Nassar, N.N.; Ruiz, M.A.; Pereira-Almao, P.; Cortés, F.B. Nanoparticles for inhibition of asphaltenes damage: Adsorption study and displacement test on porous media. Energy Fuels 2013, 27, 2899–2907. [Google Scholar] [CrossRef]
- Hou, B.; Jia, R.; Fu, M.; Wang, Y.; Jiang, C.; Yang, B.; Huang, Y. Wettability alteration of oil-wet carbonate surface induced by self-dispersing silica nanoparticles: Mechanism and monovalent metal ion’s effect. J. Mol. Liq. 2019, 294, 111601. [Google Scholar] [CrossRef]
- Jang, H.; Lee, W.; Lee, J. Nanoparticle dispersion with surface-modified silica nanoparticles and its effect on the wettability alteration of carbonate rocks. Colloids Surfaces A Physicochem. Eng. Asp. 2018, 554, 261–271. [Google Scholar] [CrossRef]
- Hassan, A.M.; Ayoub, M.; Eissa, M.; Al-Shalabi, E.W.; Almansour, A.; Alquraishi, A. Foamability and Foam Stability Screening for Smart Water Assisted Foam Flooding: A New Hybrid EOR Method. In International Petroleum Technology Conference; OnePetro; The Society of Petroleum Engineers (SPE): Richardson, TX, USA, 2022. [Google Scholar]
- Keller, S.J.; Becker, L.E. Subsurface stratigraphy and oil fields in the Salem Limestone and associated rocks in Indiana. In Technical Report, Indiana Geological Survey; Indiana Geological Survey, Department of Natural Resources: Indianapolis, IN, USA, 1980. [Google Scholar]
- Buckley, E.R.; Buehler, H.A. The Quarrying Industry of Missouri; Volume 2; Tribune Printing Company, State Printers and Binders: California, CA, USA, 1904. [Google Scholar]
- Castro, P.; Huber, M. Marine Biology Ed ke-5; Mc Graw HillInternational: New York, NY, USA, 2005; pp. 119–125. [Google Scholar]
- Manshad, A.K.; Nowrouzi, I.; Mohammadi, A.H. Effects of water soluble ions on wettability alteration and contact angle in smart and carbonated smart water injection process in oil reservoirs. J. Mol. Liq. 2017, 244, 440–452. [Google Scholar] [CrossRef]
- Purswani, P.; Tawfik, M.S.; Karpyn, Z.T. Factors and mechanisms governing wettability alteration by chemically tuned waterflooding: A review. Energy Fuels 2017, 31, 7734–7745. [Google Scholar] [CrossRef]
- Abdallah, W.; Buckley, J.S.; Carnegie, A.; Edwards, J.; Herold, B.; Fordham, E.; Graue, A.; Habashy, T.; Seleznev, N.; Signer, C.; et al. Fundamentals of wettability. Technology 1986, 38, 268. [Google Scholar]
- Chilingar, G.V.; Yen, T. Some notes on wettability and relative permeabilities of carbonate reservoir rocks, II. Energy Sources 1983, 7, 67–75. [Google Scholar] [CrossRef]
- Anderson, W.G. Wettability literature survey-part 1: Rock/oil/brine interactions and the effects of core handling on wettability. J. Pet. Technol. 1986, 38, 1125–1144. [Google Scholar] [CrossRef]
- Donaldson, E.C.; Thomas, R.D.; Lorenz, P.B. Wettability determination and its effect on recovery efficiency. Soc. Pet. Eng. J. 1969, 9, 13–20. [Google Scholar] [CrossRef]
- Donaldson, E.C.; Alam, W. Wettability; Elsevier: Amsterdam, The Netherlands, 2013. [Google Scholar]
- Ding, H.; Rahman, S. Experimental and theoretical study of wettability alteration during low salinity water flooding-an state of the art review. Colloids Surfaces A Physicochem. Eng. Asp. 2017, 520, 622–639. [Google Scholar] [CrossRef]
- Zhang, P.; Austad, T. Waterflooding in Chalk–Relationship between Oil Recovery, New Wettability Index, Brine Composition and Cationic Wettability Modifier (SPE94209). In Proceedings of the 67th EAGE Conference & Exhibition. European Association of Geoscientists & Engineers, Madrid, Spain, 13–16 June 2005; OnePetro. The Society of Petroleum Engineers (SPE): Richardson, TX, USA, 2005. [Google Scholar]
- Purswani, P.; Karpyn, Z.T. Laboratory investigation of chemical mechanisms driving oil recovery from oil-wet carbonate rocks. Fuel 2019, 235, 406–415. [Google Scholar] [CrossRef]
- Shabib-Asl, A.; Ayoub, M.; Elraies, K. Laboratory investigation into wettability alteration by different low salinity water compositions in sandstone rock. In SPE/IATMI Asia Pacific Oil & Gas Conference and Exhibition; OnePetro; The Society of Petroleum Engineers (SPE): Richardson, TX, USA, 2015. [Google Scholar]
- Hirasaki, G. Wettability: Fundamentals and Surface Forces; OnePetro; The Society of Petroleum Engineers (SPE): Richardson, TX, USA, 1991; Volume 6, pp. 217–226. [Google Scholar]
- Mahani, H.; Keya, A.L.; Berg, S.; Bartels, W.B.; Nasralla, R.; Rossen, W.R. Insights into the mechanism of wettability alteration by low-salinity flooding (LSF) in carbonates. J. Energy Fuels 2015, 29, 1352–1367. [Google Scholar] [CrossRef]
- Zhang, D. Surfactant-Enhanced Oil Recovery Process for a Fractured, Oil-Wet Carbonate Reservoir; School Rice University: Santiago, Region Metropolitana, 2005. [Google Scholar]
- Lunkenheimer, K.; Malysa, K. Simple and generally applicable method of determination and evaluation of foam properties. J. Surfactants Deterg. 2003, 6, 69–74. [Google Scholar] [CrossRef]
- Małysa, K.; Miller, R.; Lunkenheimer, K. Relationship between foam stability and surface elasticity forces: Fatty acid solutions. Colloids Surfaces 1991, 53, 47–62. [Google Scholar] [CrossRef]
- Lunkenheimer, K.; Małysa, K.; Wienskol, G.; Barańska, M. Method and Procedure for Swift Characterization of Foamability and Foam Stability. Patent (EP1416261A3), 16 January 2008. [Google Scholar]
- Chandrasekhar, S.; Sharma, H.; Mohanty, K.K. Wettability alteration with brine composition in high temperature carbonate rocks. In SPE Annual Technical Conference and Exhibition; OnePetro; The Society of Petroleum Engineers (SPE): Richardson, TX, USA, 2016. [Google Scholar]
- Yousef, A.A.; Al-Saleh, S.; Al-Kaabi, A.U.; Al-Jawfi, M.S. Laboratory investigation of novel oil recovery method for carbonate reservoirs. In Canadian Unconventional Resources and International Petroleum Conference; OnePetro; The Society of Petroleum Engineers (SPE): Richardson, TX, USA, 2010. [Google Scholar]
- Yousef, A.A.; Al-Saleh, S.H.; Al-Kaabi, A.; Al-Jawfi, M.S. Laboratory investigation of the impact of injection-water salinity and ionic content on oil recovery from carbonate reservoirs. SPE Reserv. Eval. Eng. 2011, 14, 578–593. [Google Scholar] [CrossRef]
- Alameri, W.; Teklu, T.; Graves, R.; Kazemi, H.; AlSumaiti, A. Low-salinity water-alternate-surfactant in Low-permeability Carbonate Reservoirs. In IOR 2015–18th European Symposium on Improved Oil Recovery; European Association of Geoscientists & Engineers: De Molen 42, 3994 DB Houten, The Netherlands, 2015; p. 445. [Google Scholar] [CrossRef]
- Fathi, S.J.; Austad, T.; Strand, S. “Smart water” as a wettability modifier in chalk: The effect of salinity and ionic composition. Energy Fuels 2010, 24, 2514–2519. [Google Scholar] [CrossRef] [Green Version]
- Fathi, S.J.; Austad, T.; Strand, S. Water-based enhanced oil recovery (EOR) by “smart water”: Optimal ionic composition for EOR in carbonates. Energy Fuels 2011, 25, 5173–5179. [Google Scholar] [CrossRef] [Green Version]
- Fathi, J. Water-Based Enhanced Oil Recovery (EOR) in Carbonate Reservoirs: Initial Wetting Condition and Wettability Alteration by Smart Water. Ph.D. Thesis, University of Stavanger, Stavanger, Norway, 2012. [Google Scholar]
- Su, W.; Liu, Y.; Pi, J.; Chai, R.; Li, C.; Wang, Y. Effect of water salinity and rock components on wettability alteration during low-salinity water flooding in carbonate rocks. Arab. J. Geosci. 2018, 11, 260. [Google Scholar] [CrossRef]
- Karimi, M.; Al-Maamari, R.S.; Ayatollahi, S.; Mehranbod, N. Mechanistic study of wettability alteration of oil-wet calcite: The effect of magnesium ions in the presence and absence of cationic surfactant. Colloids Surfaces A Physicochem. Eng. Asp. 2015, 482, 403–415. [Google Scholar] [CrossRef]
- Karimi, M.; Al-Maamari, R.S.; Ayatollahi, S.; Mehranbod, N. Wettability alteration and oil recovery by spontaneous imbibition of low salinity brine into carbonates: Impact of Mg2+, SO42− and cationic surfactant. J. Pet. Sci. Eng. 2016, 147, 560–569. [Google Scholar] [CrossRef]
- Gomari, K.R.; Hamouda, A.; Denoyel, R. Influence of sulfate ions on the interaction between fatty acids and calcite surface. Colloids Surfaces A Physicochem. Eng. Asp. 2006, 287, 29–35. [Google Scholar] [CrossRef]
- Zhang, P.; Austad, T. Wettability and oil recovery from carbonates: Effects of temperature and potential determining ions. Colloids Surfaces A Physicochem. Eng. Asp. 2006, 279, 179–187. [Google Scholar] [CrossRef]
- Zhang, P.; Tweheyo, M.T.; Austad, T. Wettability alteration and improved oil recovery by spontaneous imbibition of seawater into chalk: Impact of the potential determining ions Ca2+, Mg2+, and SO42−. Colloids Surfaces A Physicochem. Eng. Asp. 2007, 301, 199–208. [Google Scholar] [CrossRef]
- Rashid, S.; Mousapour, M.S.; Ayatollahi, S.; Vossoughi, M.; Beigy, A.H. Wettability alteration in carbonates during “Smart Waterflood”: Underlying mechanisms and the effect of individual ions. Colloids Surfaces A Physicochem. Eng. Asp. 2015, 487, 142–153. [Google Scholar] [CrossRef]
- Shehata, A.M.; Alotaibi, M.B.; Nasr-El-Din, H.A. Waterflooding in carbonate reservoirs: Does the salinity matter. SPE Reserv. Eval. Eng. 2014, 17, 304–313. [Google Scholar] [CrossRef]
- Romanuka, J.; Hofman, J.; Ligthelm, D.J.; Suijkerbuijk, B.; Marcelis, F.; Oedai, S.; Brussee, N.; van der Linde, H.; Aksulu, H.; Austad, T. Low salinity EOR in carbonates. In SPE Improved Oil Recovery Symposium; OnePetro; The Society of Petroleum Engineers (SPE): Richardson, TX, USA, 2012. [Google Scholar]
- Al-Attar, H.H.; Mahmoud, M.Y.; Zekri, A.Y.; Almehaideb, R.; Ghannam, M. Low-salinity flooding in a selected carbonate reservoir: Experimental approach. J. Pet. Explor. Prod. Technol. 2013, 3, 139–149. [Google Scholar] [CrossRef] [Green Version]
- Austad, T.; Strand, S.; Høgnesen, E.; Zhang, P. Seawater as IOR fluid in fractured chalk. In SPE International Symposium on Oilfield Chemistry; OnePetro; The Society of Petroleum Engineers (SPE): Richardson, TX, USA, 2005. [Google Scholar]
- Austad, T.; Strand, S.; Madland, M.V.; Puntervold, T.; Korsnes, R.I. Seawater in chalk: An EOR and compaction fluid. In International Petroleum Technology Conference; OnePetro; The Society of Petroleum Engineers (SPE): Richardson, TX, USA, 2007. [Google Scholar]
- Austad, T. Water-based EOR in carbonates and sandstones: New chemical understanding of the EOR potential using “Smart Water”. In Enhanced Oil Recovery Field Case Studies; Elsevier: Amsterdam, The Netherlands, 2013; pp. 301–335. [Google Scholar]
- Yousef, A.A.; Al-Saleh, S.; Al-Jawfi, M.S. Improved/enhanced oil recovery from carbonate reservoirs by tuning injection water salinity and ionic content. In SPE Improved Oil Recovery Symposium; OnePetro; The Society of Petroleum Engineers (SPE): Richardson, TX, USA, 2012. [Google Scholar]
- Sari, A.; Xie, Q.; Chen, Y.; Saeedi, A.; Pooryousefy, E. Drivers of low salinity effect in carbonate reservoirs. Energy Fuels 2017, 31, 8951–8958. [Google Scholar] [CrossRef]
- Alroudhan, A.; Vinogradov, J.; Jackson, M. Zeta potential of intact natural limestone: Impact of potential-determining ions Ca, Mg and SO4. Colloids Surfaces A Physicochem. Eng. Asp. 2016, 493, 83–98. [Google Scholar] [CrossRef] [Green Version]
- Song, J.; Zeng, Y.; Wang, L.; Duan, X.; Puerto, M.; Chapman, W.G.; Biswal, S.L.; Hirasaki, G.J. Surface complexation modeling of calcite zeta potential measurements in brines with mixed potential determining ions (Ca2+, CO32−, Mg2+, SO42−) for characterizing carbonate wettability. J. Colloid Interface Sci. 2017, 506, 169–179. [Google Scholar] [CrossRef] [PubMed] [Green Version]
- Awolayo, A.; Sarma, H.; AlSumaiti, A.M. A laboratory study of ionic effect of smart water for enhancing oil recovery in carbonate reservoirs. In lSPE EOR Conference at Oil and Gas West Asia; OnePetro; The Society of Petroleum Engineers (SPE): Richardson, TX, USA, 2014. [Google Scholar]
- Alotaibi, M.B.; Nasr-El-Din, H.A.; Fletcher, J.J. Electrokinetics of limestone and dolomite rock particles. SPE Reserv. Eval. Eng. 2011, 14, 594–603. [Google Scholar] [CrossRef]
- Alotaibi, M.B.; Cha, D.; Alsofi, A.M.; Yousef, A.A. Dynamic interactions of inorganic species at carbonate/brine interfaces: An electrokinetic study. Colloids Surfaces A Physicochem. Eng. Asp. 2018, 550, 222–235. [Google Scholar] [CrossRef]
- Jackson, M.D.; Al-Mahrouqi, D.; Vinogradov, J. Zeta potential in oil-water-carbonate systems and its impact on oil recovery during controlled salinity water-flooding. Sci. Rep. 2016, 6, 37363. [Google Scholar] [CrossRef] [Green Version]
- Suarez-Rivera, R.; Stenebråten, J.; Gadde, P.B.; Sharma, M.M. An Experimental Investigation of Fracture Propagation during Water Injection. In International Symposium and Exhibition on Formation Damage Control; OnePetro; The Society of Petroleum Engineers (SPE): Richardson, TX, USA, 2002. [Google Scholar]
- Vikingstad, A.K.; Skauge, A.; Høiland, H.; Aarra, M. Foam–oil interactions analyzed by static foam tests. Colloids Surfaces A Physicochem. Eng. Asp. 2005, 260, 189–198. [Google Scholar] [CrossRef]
- Vikingstad, A.K.; Aarra, M.G.; Skauge, A. Effect of surfactant structure on foam–oil interactions: Comparing fluorinated surfactant and alpha olefin sulfonate in static foam tests. Colloids Surfaces A Physicochem. Eng. Asp. 2006, 279, 105–112. [Google Scholar] [CrossRef]
- Vikingstad, A.K.; Aarra, M.G. Comparing the static and dynamic foam properties of a fluorinated and an alpha olefin sulfonate surfactant. J. Pet. Sci. Eng. 2009, 65, 105–111. [Google Scholar] [CrossRef]
- Shabib-Asl, A.; Ayoub, M.A.; Saaid, I.M.; Valentim, P.P.J. Experimental investigation into effects of crude oil acid and base number on wettability alteration by using different low salinity water in sandstone rock. J. Jpn. Pet. Inst. 2015, 58, 228–236. [Google Scholar] [CrossRef] [Green Version]
- Babadagli, T. Development of mature oil fields—A review. J. Pet. Sci. Eng. 2007, 57, 221–246. [Google Scholar] [CrossRef]


| Formation (Type) | Rock Porosity (%) | Rock Permeability (mD) | UCS (psi) | Homogeneous (Yes or No) |
|---|---|---|---|---|
| Salem | 14–19 | 50–100 | 4000–5000 | Yes |
| Properties | Unit | Crude-Oil Type A | Crude-Oil Type B |
|---|---|---|---|
| Density at (25 °C) | g/cm | 0.8848 | 0.8747 |
| Density at (80 °C) | g/cm | 0.8694 | 0.8415 |
| Viscosity at (25 °C) | cP | 14.02 | 10.05 |
| Viscosity at (80 °C) | cP | 2.23 | 1.79 |
| Total Acid Number (TAN) | mg KOH/g | 1.17 | 0.81 |
| Total Base Number (TBN) | mg KOH/g | 0.23 | 0.59 |
| Total Sulfur Content | % | 2.51 | 2.24 |
| API | Degrees | 28.42 | 30.26 |
| Composition | Na+ (mg/L) | Ca2+ (mg/L) | Mg2+ (mg/L) | K+ (mg/L) | (SO4)2− (mg/L) | (HCO3)− (mg/L) | Cl− (mg/L) | TDS (mg/L) | Ionic Strength (mol/L) | Density @ 25 °C (g/cm3) | Density @ 80 °C (g/cm3) |
|---|---|---|---|---|---|---|---|---|---|---|---|
| FW | 49,933.0 | 14,501.0 | 3248.0 | 0.0 | 234.0 | 0.0 | 111,947.0 | 179,863 | 3.6605 | 1.1228 | 1.0949 |
| Seawater | 10,669.0 | 420.0 | 1330.0 | 385.0 | 2730.0 | 142.0 | 19,324.0 | 35000 | 0.6979 | 1.0241 | 0.9988 |
| Seawater/5 | 2133.8 | 84.0 | 266.0 | 77.0 | 546.0 | 28.4 | 3864.8 | 7000 | 0.1396 | 1.0024 | 0.9777 |
| Seawater/10 | 1066.9 | 42.0 | 133.0 | 38.5 | 273.0 | 14.2 | 1932.4 | 3500 | 0.0698 | 1.0003 | 0.9752 |
| Seawater/20 | 533.5 | 21.0 | 66.5 | 19.3 | 136.5 | 7.1 | 966.2 | 1750 | 0.0349 | 0.9988 | 0.9738 |
| Seawater/50 | 213.4 | 8.4 | 26.6 | 7.7 | 54.6 | 2.8 | 386.5 | 700 | 0.0140 | 0.9979 | 0.9729 |
| NaCl | 1376.9 | 0.0 | 0.0 | 0.0 | 0.0 | 0.0 | 2123.1 | 3500 | 0.0599 | 0.9999 | 0.9749 |
| CaCl | 0.0 | 1264.0 | 0.0 | 0.0 | 0.0 | 0.0 | 2236.0 | 3500 | 0.0946 | 1.0002 | 0.9754 |
| MgCl | 0.0 | 0.0 | 893.7 | 0.0 | 0.0 | 0.0 | 2606.3 | 3500 | 0.1103 | 1.0002 | 0.9755 |
| KCl | 0.0 | 0.0 | 0.0 | 1835.7 | 0.0 | 0.0 | 1664.3 | 3500 | 0.0469 | 0.9997 | 0.9747 |
| NaSO | 1133.0 | 0.0 | 0.0 | 0.0 | 2367.0 | 0.0 | 0.0 | 3500 | 0.0739 | 1.0006 | 0.9761 |
| 25% MgCl + 75% NaCl | 1032.7 | 0.0 | 223.4 | 0.0 | 0.0 | 0.0 | 2243.9 | 3500 | 0.0725 | 1.0003 | 0.9751 |
| 50% MgCl + 50% NaCl | 688.4 | 0.0 | 446.8 | 0.0 | 0.0 | 0.0 | 2364.7 | 3500 | 0.0851 | 1.0004 | 0.9752 |
| 75% MgCl + 25% NaCl | 344.2 | 0.0 | 670.3 | 0.0 | 0.0 | 0.0 | 2485.5 | 3500 | 0.0977 | 1.0005 | 0.9753 |
| 25% MgCl + 75% KCl | 0.0 | 0.0 | 223.4 | 1376.8 | 0.0 | 0.0 | 1899.8 | 3500 | 0.0628 | 1.0001 | 0.9751 |
| 50% MgCl + 50% KCl | 0.0 | 0.0 | 446.8 | 917.8 | 0.0 | 0.0 | 2135.3 | 3500 | 0.0786 | 1.0003 | 0.9752 |
| 75% MgCl + 25% KCl | 0.0 | 0.0 | 670.3 | 458.9 | 0.0 | 0.0 | 2370.8 | 3500 | 0.0944 | 1.0004 | 0.9754 |
| 25% MgCl + 75% NaSO | 849.8 | 0.0 | 223.4 | 0.0 | 1775.3 | 0.0 | 651.6 | 3500 | 0.0830 | 1.0008 | 0.9756 |
| 50% MgCl + 50% NaSO | 566.5 | 0.0 | 446.8 | 0.0 | 1183.5 | 0.0 | 1303.2 | 3500 | 0.0921 | 1.0008 | 0.9756 |
| 75% MgCl + 25% NaSO | 283.3 | 0.0 | 670.3 | 0.0 | 591.8 | 0.0 | 1954.8 | 3500 | 0.1012 | 1.0007 | 0.9756 |
| 25% MgCl + 75% CaCl | 0.0 | 948.0 | 223.4 | 0.0 | 0.0 | 0.0 | 2328.6 | 3500 | 0.0985 | 1.0006 | 0.9754 |
| 50% MgCl + 50% CaCl | 0.0 | 632.0 | 446.8 | 0.0 | 0.0 | 0.0 | 2421.2 | 3500 | 0.1024 | 1.0006 | 0.9755 |
| 75% MgCl + 25% CaCl | 0.0 | 316.0 | 670.3 | 0.0 | 0.0 | 0.0 | 2513.8 | 3500 | 0.1064 | 1.0006 | 0.9755 |
| 25% NaSO + 75% KCl | 1315.9 | 0.0 | 0.0 | 0.0 | 591.8 | 0.0 | 1592.3 | 3500 | 0.0634 | 1.0003 | 0.9751 |
| 50% NaSO + 50% KCl | 1254.9 | 0.0 | 0.0 | 0.0 | 1183.5 | 0.0 | 1061.6 | 3500 | 0.0669 | 1.0005 | 0.9753 |
| 75% NaSO + 25% KCl | 1194.0 | 0.0 | 0.0 | 0.0 | 1775.3 | 0.0 | 530.8 | 3500 | 0.0704 | 1.0007 | 0.9755 |
| 25% NaSO + 75% KCl | 283.3 | 0.0 | 0.0 | 1376.8 | 591.8 | 0.0 | 1248.2 | 3500 | 0.0537 | 1.0001 | 0.9749 |
| 50% NaSO + 50% KCl | 566.5 | 0.0 | 0.0 | 917.8 | 1183.5 | 0.0 | 832.2 | 3500 | 0.0604 | 1.0004 | 0.9752 |
| 75% NaSO + 25% KCl | 849.8 | 0.0 | 0.0 | 458.9 | 1775.3 | 0.0 | 416.1 | 3500 | 0.0672 | 1.0006 | 0.9754 |
| 25% NaSO + 75% CaCl | 283.3 | 948.0 | 0.0 | 0.0 | 591.8 | 0.0 | 1677.0 | 3500 | 0.0894 | 1.0006 | 0.9754 |
| 50% NaSO + 50% CaCl | 566.5 | 632.0 | 0.0 | 0.0 | 1183.5 | 0.0 | 1118.0 | 3500 | 0.0843 | 1.0007 | 0.9755 |
| 75% NaSO + 25% CaCl | 849.8 | 316.0 | 0.0 | 0.0 | 1775.3 | 0.0 | 559.0 | 3500 | 0.0791 | 1.0008 | 0.9755 |
| Type | CTAB | DTAB | AOS | Alpha-Foamer |
|---|---|---|---|---|
| Chemical Group | Ammonium Bromide | Ammonium Bromide | Alpha Olefin Sulfonate | Alkyl Ether Sulfates |
| Formula | C19H42BrN | C15H34BrN | CnH2n-1SO3Na (n = 14−16) | Sodiun C12-C14 Layreth Sulfate |
| Form at 25 °C | White powder | White powder | Liquid | Liquid |
| Boiling Point, [°C] | 235 | 239 | 100 | 88 |
| Flash Point, [°C] | 244 | 246 | >94 | 28 |
| Specific Gravity at 25 °C, [-] | 1.11 | 1.05 | 1.06 | 1.03 |
| Density at 25 °C, [g/cm] | 1.11 | 1.05 | 1.06 | 1.03 |
| Molecular Weight. [g/mole] | 364.45 | 308.34 | 315.00 | <300.00 |
| Viscosity at 25 °C, [cp] | [-] | [-] | 122.00 | 20.00 |
| CMC, [mg/L] | 346 [1 mM] | 4200 [14 mM] | 301.00 | 2.20 |
| Surface Tension (SFT), [mN/m] | 31.7 | 49.1 | 31.6 | 29.9 |
| Contact Angle | Wettability |
|---|---|
| 0° to 80° | Water-Wet |
| 80° to 100° | Intermediate Wettability |
| 100° to 160° | Oil-Wet |
| 160° to 180° | Strongly Oil-Wet |
| Formation (Type) | Permeability (mD) | Porosity (%) | Length (cm) | Diameter (cm) | Area (cm) | Bulk Volume (cm) |
|---|---|---|---|---|---|---|
| Salem | 50–100 | 14–19 | 30.48 | 3.81 | 11.40 | 347.50 |
| Core-Sample (Number) | Permeability (mD) | Porosity (Gas) | Length (cm) | Diameter (cm) | Area (cm) | Bulk Volume (cm) | Dray-Weight (gram) | Wet-Weight (gram) | Pore Volume (PV in cm) | Porosity (Saturation) |
|---|---|---|---|---|---|---|---|---|---|---|
| 1 | 50–100 | 19.40 | 7.66 | 3.82 | 11.46 | 87.79 | 191.51 | 208.31 | 16.79 | 0.1912 |
| 2 | 50–100 | 18.30 | 7.30 | 3.82 | 11.46 | 83.66 | 182.04 | 197.72 | 15.67 | 0.1873 |
| 3 | 50–100 | 18.50 | 7.35 | 3.82 | 11.46 | 84.24 | 184.61 | 200.10 | 15.48 | 0.1838 |
| 4 | 50–100 | 17.93 | 7.32 | 3.82 | 11.46 | 83.89 | 183.92 | 199.25 | 15.32 | 0.1826 |
| 5 | 50–100 | 15.85 | 7.33 | 3.82 | 11.46 | 84.01 | 184.27 | 197.25 | 12.97 | 0.1544 |
| 6 | 50–100 | 17.94 | 7.48 | 3.82 | 11.46 | 85.73 | 189.73 | 204.88 | 15.14 | 0.1766 |
| 7 | 50–100 | 17.59 | 7.40 | 3.82 | 11.46 | 84.81 | 190.88 | 205.76 | 14.87 | 0.1753 |
| 8 | 50–100 | 14.71 | 7.45 | 3.82 | 11.46 | 85.38 | 189.72 | 202.14 | 12.41 | 0.1454 |
| 9 | 50–100 | 15.30 | 7.50 | 3.82 | 11.46 | 85.96 | 190.96 | 204.61 | 13.64 | 0.1608 |
| 10 | 50–100 | 16.20 | 7.49 | 3.82 | 11.46 | 85.84 | 190.95 | 205.19 | 14.23 | 0.1658 |
| Components | pH Value | Temperature (°C) |
|---|---|---|
| Seawater (35,000 ppm) | 7.80 | 23.7 |
| 20 times diluted seawater (1750 ppm) | 7.70 | 23.9 |
| NaSO + CaCl (3500 ppm) | 6.69 | 24.0 |
| MgCl (3500 ppm) | 6.83 | 24.4 |
| 25% MgCl + 75% NaCl (3500 ppm) | 6.45 | 24.3 |
| 50% MgCl + 50% KCl (3500 ppm) | 6.70 | 23.8 |
Publisher’s Note: MDPI stays neutral with regard to jurisdictional claims in published maps and institutional affiliations. |
© 2022 by the authors. Licensee MDPI, Basel, Switzerland. This article is an open access article distributed under the terms and conditions of the Creative Commons Attribution (CC BY) license (https://creativecommons.org/licenses/by/4.0/).
Share and Cite
Hassan, A.M.; Ayoub, M.; Eissa, M.; Al-Shalabi, E.W.; Al-Mansour, A.; Al-Quraishi, A. Increasing Reservoir Recovery Efficiency through Laboratory-Proven Hybrid Smart Water-Assisted Foam (SWAF) Flooding in Carbonate Reservoirs. Energies 2022, 15, 3058. https://doi.org/10.3390/en15093058
Hassan AM, Ayoub M, Eissa M, Al-Shalabi EW, Al-Mansour A, Al-Quraishi A. Increasing Reservoir Recovery Efficiency through Laboratory-Proven Hybrid Smart Water-Assisted Foam (SWAF) Flooding in Carbonate Reservoirs. Energies. 2022; 15(9):3058. https://doi.org/10.3390/en15093058
Chicago/Turabian StyleHassan, Anas M., Mohammed Ayoub, Mysara Eissa, Emad W. Al-Shalabi, Abdullah Al-Mansour, and Abdulrahman Al-Quraishi. 2022. "Increasing Reservoir Recovery Efficiency through Laboratory-Proven Hybrid Smart Water-Assisted Foam (SWAF) Flooding in Carbonate Reservoirs" Energies 15, no. 9: 3058. https://doi.org/10.3390/en15093058
APA StyleHassan, A. M., Ayoub, M., Eissa, M., Al-Shalabi, E. W., Al-Mansour, A., & Al-Quraishi, A. (2022). Increasing Reservoir Recovery Efficiency through Laboratory-Proven Hybrid Smart Water-Assisted Foam (SWAF) Flooding in Carbonate Reservoirs. Energies, 15(9), 3058. https://doi.org/10.3390/en15093058