Abstract
There are many gaseous substances that need to be monitored for possible damage to health or the environment. This requires many sensors. The solution to reducing the number of sensors is to use one sensor to detect several gaseous substances simultaneously. Efforts to simplify sensor systems thus lead to the use of a sensor with a suitable sensitive layer and to finding a suitable method of detecting individual gaseous substances within one sensor. The aim is to find a suitable method to detect various gaseous substances acting on the sensor. For this purpose, modified impedance spectroscopy in the high-frequency range is applied, where the scattering parameters of the sensor based on carbon nanotubes are measured under the action of NO2 and NH3 gases. For this method of detection of gaseous substances, a suitable sensor platform structure was designed to enable the measurement of the electrical properties of the sensor in the GHz range. Based on the obtained results, it is possible to use one sensor to detect different types of gaseous substances.
1. Introduction
In the industrial environment, but also in households, the number of different types of gas sensors needed to ensure the safety or comfort of people is constantly increasing. Communication technologies enable information sharing of monitored types of gases and their concentration values. The development trend of gas sensors follows the idea of multi-sensor systems, where the multi-sensor field uses the sensitivity of individual sensors to a specific gas. In the case of individual sensors, the chemical analyte is chemically bound to the sensitive layer. This chemical bond causes a change in the electrical parameters of the sensor, which are then evaluated, and based on them, the concentration of the acting gas can be determined. From the point of the view of the simplicity of the sensor’s response evaluation, the effort is to use mainly chemoresistive sensors, when the impedance of the sensitive layer changes under the action of gas [1]. Simple measurement of the resistance or impedance of the sensitive layer is possible with chemoresistive sensors designed to detect a single analyte. However, in the case of multi-sensor systems, it is necessary to implement complex measuring and evaluation circuits. Sensors may have specific cross-sensitivities across the sensor array, which may increase the range of detectable gaseous substances at each sensor, but thus create requirements for more complex evaluation methods [2]. Another approach leading to the same goal is to identify a typical frequency domain response and to identify a substance or groups of substances based on a known signal pattern at a certain frequency. The resolution of the signals in the sensor array is the reason for looking for signal patterns for different substances.
One of the basic parameters of gas detection sensors is the size of the sensitive layer’s contact area with the surrounding gas mixture. Therefore, emphasis is placed on the structure of the sensitive layer, especially on the ratio between the sensor’s construction area and the actual surface of the sensitive layer [3]. This requirement is met, for example, by the application of various modifications of nanocarbon (tubes, fullerenes, graphene).
Modified carbon nanotubes can be used as sensitive layers of gas sensors, which can show different impedance responses for different gases and at the same time have a large surface area [4,5,6]. To identify gases and determine the level of their concentration, it is necessary to analyze the signal responses of these sensors in a wide range of frequencies. Although this is a complex method, it can obtain more information about the sensor’s behavior, where it is possible to identify individual analytes based on one sensitive layer.
For these purposes, the method resulting from impedance spectroscopy was applied, where the frequency dependence of impedance was not measured directly, but the scattering parameters of the sensor [7,8]. Based on these measurements, changes in the transmitted and reflected signals caused by a change in impedance under the action of different gases were searched. However, commonly used impedance spectroscopy is used in sensors only in the range of a few megahertz. At these frequencies, the frequency response of the sensor may not change with different analytes. Changes in the frequency response start to appear in the gigahertz band; therefore, the scattering parameters are used to detect gases instead of impedance.
Currently, some sensors use a change in the real and imaginary components of impedance to detect temperature, relative humidity, and gas substances [9,10]. The evaluation of impedance at different frequencies of the measuring signal can be considered as impedance spectroscopy. In the case of detecting and evaluating the concentration of various gases using one sensor, it is realized by measuring the change in the impedance value only at one frequency in the frequency band from hertz to megahertz [11,12,13].
Impedance spectroscopy is a known method used for various gas sensors to determine the concentration of the acting gas from the amplitude impedance frequency spectrum [14,15,16]. The change of the sensor impedance depending on the frequency is caused by the frequency dependence of the complex permittivity of the whole sensor platform (Figure 1). In the case of absorption of a certain analyte by the sensor, the complex permittivity of the whole sensor changes at a certain frequency [17]. These changes may be different at different frequencies depending on the absorbed analyte [18]. The result of the spectral analysis of impedance is thus dependent on the change of the frequency-dependent complex permittivity [19]. By applying different analytes to the same sensitive layer, smaller or larger impedance changes can occur depending on the frequency.
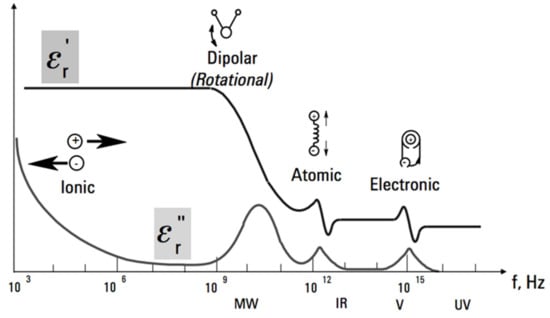
Figure 1.
Frequency dependence of complex permittivity (ε’, ε”) [18].
The parameters of the sensors depend on the structure and materials used in the construction of the sensor elements. The application of multi-sensor systems or sensors designed to detect interference components, in which it would be possible to detect changes in the concentration or type of absorbed gases by differences in the frequency spectrum of signals, requires a suitable design and material composition of the sensor element. Therefore, the main goal is to achieve a reliable identification of the change in the composition of the tested atmosphere (gas) based on the sensor’s frequency response by measuring the reflected and transmitted frequency spectrum to analyze these changes and find characteristic behaviors related to a change in the monitored gas presence or concentration. Frequency spectrum measurement allows an overview of the sensor response in a wide range of frequencies for different gases, which is a new view and way to detect gases. From the measured frequency responses, a suitable sensor (structure and material composition) can be found to detect the required gas and define a specific frequency or frequency band in which the most significant changes in the measurement signal under the action of the gas are achieved.
2. Materials and Methods
The electrical parameters of the sensor are affected by the geometric structure of the sensor. The electrode’s area and thickness, the thickness of the support substrate, and the sensitive layer fundamentally influence the resulting value of the sensor impedance. The sensor element contains several material transitions between different materials, which start to apply when the frequency of the measuring signal changes.
Figure 2 shows a simplified equivalent circuit of a measuring chain containing electronic elements with concentrated parameters [19]. The part between the indicated gates 1 and 2 represents a sensor platform connected to an impedance matched line. The impedance response of the measured sensor depends on several interrelated components. An integral part is the substrate response shown by the Csub capacity. The influence of the geometric shape of the electrode system and the thickness of the sensitive layer represents a series connection of Csen and Cair capacities. The sensitive layer’s capacity (Csen) and resistance (Rsen) depend on the concentration and type of gas acting. Therefore, these components are the most important in describing the sensor’s functionality and behavior in the high-frequency range. However, in the high-frequency range, the sensor’s response at specific frequencies may be more affected by the supporting substrate, i.e., the Csub capacity.
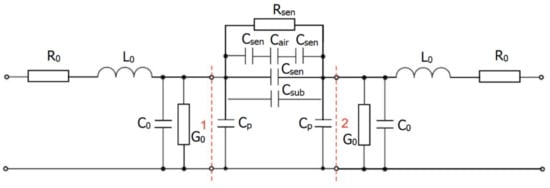
Figure 2.
Equivalent circuit of the measuring chain.
Figure 3 shows a frequent form of interdigital electrodes of a sensor platform on the ceramic substrate for chemoresistive gas detection sensors [19]. However, this electrode arrangement and ceramic substrate are unsuitable for impedance spectroscopy above 100 MHz. For thin-film applications of sensitive materials, the influence of surface roughness enters the replacement circuit of the sensor [20]. Sensor platforms for impedance spectroscopy should have a symmetrical shape and a low value of relative permittivity; therefore, this sensor platform on a ceramic support substrate is unsuitable.
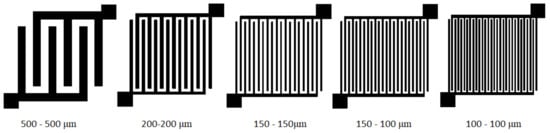
Figure 3.
Design of sensor interdigital electrodes for polymeric substrate (gap width-electrode width).
Since the modified impedance spectroscopy applied to the gas sensors uses measurements in the high-frequency range, more suitable topologies and material compositions of the sensor platforms were used. Polyethene terephthalate (PET) with a relative permittivity of εr = 3.6 was used as the supporting substrate of the electrode system and the sensitive layer, its advantage being mechanical flexibility and stability and suitable properties for high frequency measurements. The interdigital structure electrode system was screen-printed on a carrier substrate (PET). The influence of the roughness of these materials can also be ruled out in comparison with ceramic substrates.
With commonly used interdigital electrodes, not all signal paths have the same geometric length from the contact points. This limits the use of interdigital electrodes when measuring high-frequency signals, as signal phase shifts occur at different lengths of the electrode system. For this reason, a new interdigital electrode topology was designed, where the contact points on the collecting electrodes are diagonally placed on the electrode pattern (Figure 3). The designed topology considers the requirements for increased symmetry and uniform geometric length of the signal paths of the entire sensor platform and is suitable for measuring signal responses at frequencies of the order of tens of GHz. Coaxial SMA (Sub-Miniature version A) connectors were used to connect the sensor platform to the measuring instrument that is suitable for high-frequency measurements. The individual sensors were connected to a network vector analyzer (VNA) as a two-port system. The VNA principle consists in measuring the reflected and transmitted signals at the tested sensor in a defined frequency band. The shields of the connectors and the connecting cables were interconnected together. The electrode system was made by screen printing method. Graphene Ink carbon paste, C2131121D3 purchased from GWENT Group (Borough, UK) with sheet resistance of 10 ohms/sq at a 25 μm and content of solid particles 41%, was used. Subsequently, printed electrodes were curried at 130 °C. The resulting interdigital electrode has a resistance from 32 to 40 Ω along the entire length of the path.
The advantage of a carbon electrode is removing the metal-sensitive layer junction and the suppression of catalytic electrode contributions (e.g., Pt). Carbon electrodes ensure a sufficiently high conductivity for impedance spectroscopy compared to the expected conductivity of sensitive materials.
Proven procedures for applying sensitive layers of sensors with the conductivity principle were used in the deposition of sensitive material [21]. An important property is the thickness and homogeneity of the layer. This affects the basic measurable electrical parameters and the rate of their changes when the concentration of the acting gases changes. The thickness of the sensitive layer is proportional to the number of individually applied layers, and the homogeneity is influenced by the evaporation rate of the solvent or the application method. The Aerosol JET deposition system was used for the selective application of sensitive material to interdigital electrodes. The advantage of the selective application is the reduction in the real part of the impedance of the sensor element. The reason for this procedure is to maximize the sensor response.
Functionalized carbon nanotube (CNT) used for sensitive layers marked CNTRENE C 100 LM was purchased in disperse form from Brewer Science company (BS, Rolla, MI, USA). The dispersion contains 75% of Single wall carbon nanotubes (SWCNT) and 25% of multi-wall carbon nanotubes (MWCNT). These CNTs are functionalized with pyrene which is covalently decorated by three sulfonic (SO3H) groups and one amino (NH2). Pyrene molecules with the side groups are noncovalently attached to surface of the nanotubes via ᴨ-ᴨ bonds. Due to the CNTs functionalization, the sensitive layer is much more suitable for detecting NO2 and NH3 gases, than raw SWCNT [6]. In general, raw CNTs without structural defects are insensitive to gases. The gas molecules can bind either at the site of defects in the nanotube structure or at suitably selected functional groups. The functional groups, typically carboxyl (COOH) and sulfonic (SO3H), contain oxygen at their ends where the interaction between the gas molecule and the functional group can occur [22]. Carbon nanotubes are essentially P-type semiconductors. Any reducing or oxidizing gas bound (through a functional group) on their surface changes the concentration of free charge carriers depending on their nature. In this case, the interaction of the gases with the sensitive layer results in a change in impedance. Ammonia is a reducing gas and serves as an electron donor and therefore the impedance of the sensor increases. In contrast, nitrogen dioxide is an electron acceptor, and the impedance of the sensor decreases [23].
Measurement of scattering parameters depending on the frequency (spectral response) of the sensors was performed using a network vector analyzer LECROY SPARQ-3002. Individual sensors were connected to the analyzer using coaxial cables and SMA connectors. The sensors were placed in a stainless-steel chamber, which allowed the flow of clean air or gas of the required concentration. At the same time, the chamber acted as a shield against external interfering signals.
Due to the action of the gas on the sensor, the gas molecules are absorbed, and thus, the electrical parameters, such as the impedance of the sensitive layer, change. These impedance changes result in a difference in the signal response of the sensor (S-parameters), such as the attenuation of the passed (S12 or S21) and reflected signal (S11 or S22). These signal responses were analyzed using a network vector analyzer. The sensor connected to the measuring circuit behaves as a passive symmetrical structure, then S11 = S22 and S12 = S21. For this reason, only parameters S11 and S12 were measured and analyzed. The input conditions of the experiment (Figure 4) are the sampling pulses of the excitation generator (upper left graph) and the time series of changes in the test gas concentration (c (ppm)), (upper right graph). In the central part, a sensor platform with an excitation wave input and measured responses S11 and S21 is schematically shown. The resulting spectral response in the frequency domain (middle graph) covers the entire measured spectrum.
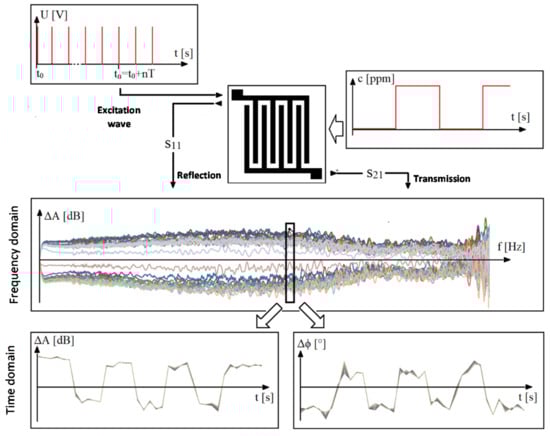
Figure 4.
Context visualization of the experiment.
The components of the complex attenuation can be transformed into a time response in the selected frequency band (change of the attenuation amplitude at the bottom left and change of the phase angle at the bottom right). The corresponding time frame of the components of the change of the complex attenuation proves the dependence of the sensor response on the change of the concentration of the monitored gas.
Testing was performed in the frequency band 0–30 GHz. The test gas mixture consisted of synthetic air in the first five-minute exposure and a mixture of synthetic air with NH3 (50 ppm) or NO2 (10 ppm) for the next five minutes. These selected values of test gas concentrations were chosen concerning the permissible exposure limits. From the measured values, difference spectra were created to determine the frequencies at which the signal attenuation changes in connection with the change in gas concentration.
3. Results and Discussion
In the first phase, the influence of geometric dimensions, i.e., different distances of interdigital electrodes, on the signal response was determined. Sensors with electrode spacings of 500 µm, 200 µm, 150 µm and 100 µm were created and tested. The resulting measured frequency dependences of the scattering parameters are shown in Figure 5 and Figure 6.
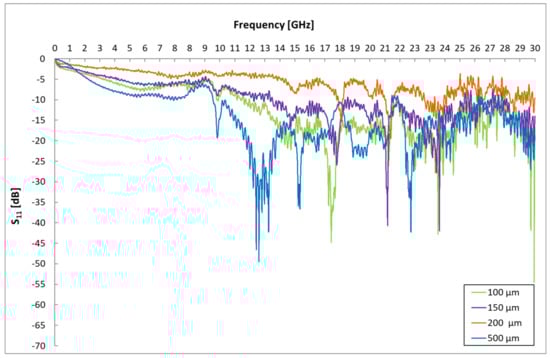
Figure 5.
Influence of IDE gap on S11 parameters.
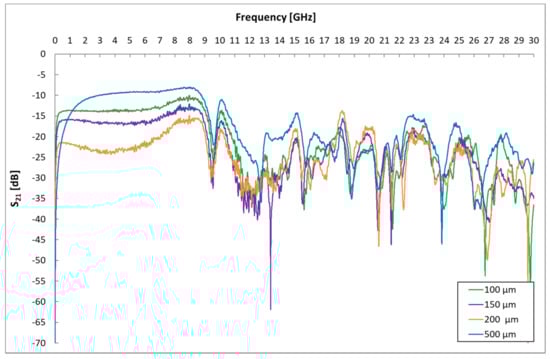
Figure 6.
Influence of IDE gap on S21 parameters.
These spectral responses of scattering parameters show the dependence of the change in the transmission and reflection of the excitation signal of the sensor platform. The measurement of the frequency response of a sensor without a sensitive layer with different electrode distances was performed due to the need to determine a suitable frequency band for gas detection that is not affected by the geometry of the sensor element. The influence of different dimensions (gap) of interdigital electrodes is visible in both mentioned graphs and is mainly caused by the different capacities of the sensor element at different electrode distances. These changes are particularly evident at 9 GHz. From these graphs, the frequency range was localized for a given geometry of the sensor element, in which the signals are not attenuated by the geometry of the sensor element, and it is, therefore, possible to identify changes in this band caused by the analyte.
The application of sensitive material will cause further changes in the spectral response for the sensor platforms (Figure 7). The sensitive layer changes the course of the spectral response in accordance with its change in resistivity and permittivity (capacitance) of the whole sensor platform. Due to the action of the gas, changes in the electrical parameters of the sensitive layer can be expected, and again, changes in the spectral response of the sensor.
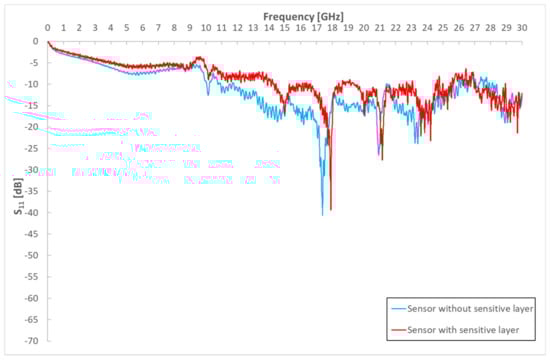
Figure 7.
Influence of sensitive layer on S11 parameters for sensor with space between electrodes of 100 µm.
The performed experiments show significant sensor responses to the acting gas only in certain frequency bands. Frequency changes occur within narrow frequency bands. Figure 8 shows the apparent change in amplitude and frequency in response to NO2 gas absorption and desorption. The response to 10 ppm NO2 is characterized by a change in the resonant frequency (shift from point 1 to points 2 and 3) and a difference in the amplitude of the scattering parameter at a given resonant frequency. To detect a certain gas, resonance at a particular frequency is crucial to identify. Resonance causes a change in the amplitude values of the scattering parameters. Generally, during the action of NO2 and NH3 gases on the sensitive layer, the resonant frequencies shift and the amplitude values change in the spectrum of the reflected (S11) and transmitted (S12) signal.
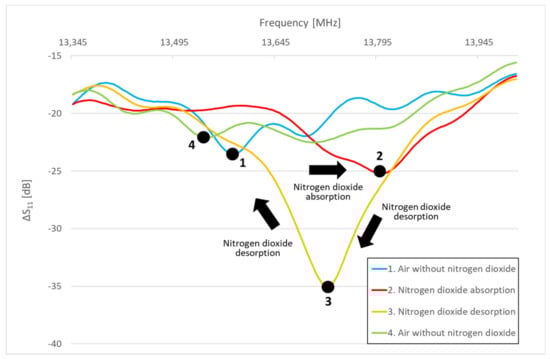
Figure 8.
Frequency and amplitude shift in response to the composition of the tested gas mixture.
The measured values of the scattering parameters are not very legible, and it is complicated to identify any changes from them. Therefore, difference spectra were created, from which changes in the scattering parameters at individual frequencies are noticeable. These difference spectra were determined as the difference between the frequency response of the sensor without the active gas and the frequency response of the sensor exposed to NO2 and NH3. Only frequencies where there are significant differences in the values of scattering parameters were selected. The resulting difference spectra are shown for the change in attenuation in the reflected part of the spectrum S11 in Figure 9. The change in attenuation in parameter S21 is presented in Figure 10. These figures show the most significant differences in the scattering parameters in the frequency spectrum (signal attenuation or transmission), obtained as the difference between the measured scattering parameters of sensors located in the gas chamber with continuous NO2 or NH3 gas flow and measured values under air flow. A change in the electrical parameters of the sensitive layer, particularly a change in the relative permittivity, causes these differences in the scattering parameters. Some differences in scattering parameters are positive (solid line), while some are negative (dashed line). This means that the signal is attenuated at a given frequency for specific frequencies, while for some frequencies, the signal passes through the sensor structure. The individual measurements were repeated (10 cycles), and the given difference values were determined from the average of the measured values at the frequencies. From the above difference spectra, the scattering parameters change at different frequencies for different types of gases. This result, therefore, allows the use of one sensor with the same sensitive layer to detect various gases.
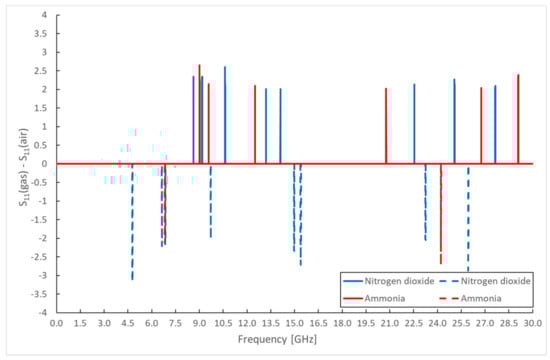
Figure 9.
Differential spectrum of sensor response for monitored gases—S11 parameter amplitude.
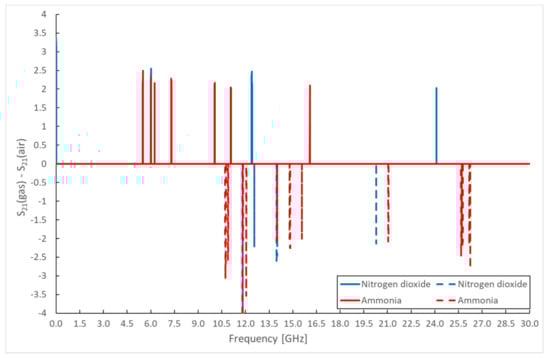
Figure 10.
Differential spectrum of sensor response for monitored gases—S21 parameter amplitude.
Another possible method of evaluation based on spectral measurements is the realization of difference spectra of the phase angle of scattering parameters (Figure 11). The results of the changes in the amplitude and phase angle of the measured scattering parameters are not identical, despite possible expectations. The dynamics of the change of the phase angle and the amplitude of the scattering parameters are different; the stabilization of the phase angle is achieved in the order of seconds; the stabilization of the amplitude is in the order of minutes. The moment of sampling during the measurement thus occurs for both quantities in different transient phases.
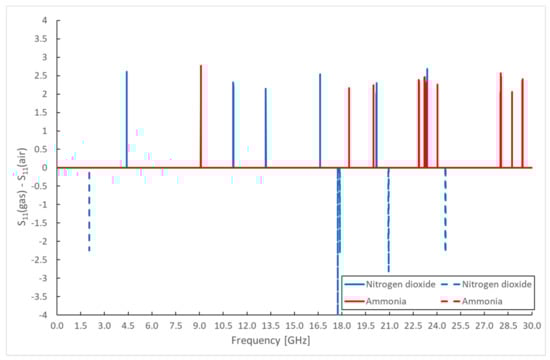
Figure 11.
Differential spectrum of sensor response for monitored gases—S11 parameter phase.
When the gas acts on the sensitive layer, the polarization of the sensitive layer changes, which is the main component for the most significant sensor response in the frequency or time domain. The response of the sensor is composed of the contributions of the events taking place in the volume, on the surface, at the interfaces of the electrodes and the sensor pad. In the volume of the sensitive layer and the substrate, the migration of charge carriers, the orientation of the permanent dipoles and the formation of induced dipoles can be assumed. The manifestations of all components of polarization are frequency dependent. The influence of slower events decreases with increasing frequency; they cease to affect polarization.
The spectra shown in the overview graphs are an approximate representation of the most significant changes in the response in spectral measurements to the presence of the tested gases. This is only a fraction of the information about the changes taking place on the exposed sensor element. This method provides initial information on frequency domains suitable for more detailed investigation. These must be performed in a narrower frequency band with a shorter sampling period.
Verification of the gas-detection method using one sensor has only been performed for NO2 and NH3. However, it can be assumed that the described methodology can be used to detect other gases absorbed by a sensitive layer based on carbon nanotubes with the described modification. This could include other gases of reducing and oxidizing nature. Practical verification will be part of the continuation of research in this area. In the case of other gas sensors, it will be necessary to solve the sensitivity adjustment by another modification of the carbon nanotubes.
4. Conclusions
Frequency-dependent properties of materials and electronic components are often determined using impedance spectroscopy. In this work, modified impedance spectroscopy was applied to detect different gaseous analytes on a sensor with the same sensitive layer. This detection method analyzes changes in the scattering parameters of the measured sensors in the frequency domain. Based on the specific frequency response to a certain gas, different types of acting gases can be detected using the same sensor. The transmitted and reflected high-frequency signals are affected by the topology and dimensions of the electrode structure of the sensor. Nevertheless, using modified carbon nanotubes as sensitive layers, it is possible to detect NO2 and NH3 gases from the measured signal spectra. The evaluation of changes in scattering parameters in the entire frequency band for individual gases was performed using differential spectra. From these difference spectra, the action of individual gases changes the attenuation or phase angle at different frequencies.
Detectable changes are significant in certain frequency bands. In the spectral responses, it is possible to identify changes caused by monitored gases even at low concentrations. Thus, the research work confirmed the suitability of impedance spectroscopy as a possible way to monitor changes in the composition of the gas mixture using one sensor with a suitable sensitive layer. One sensor can thus detect different gases, as each gas causes a specific frequency response of the sensor.
Author Contributions
Conceptualization, T.B., V.S. and J.S.; methodology, T.B. and V.S.; validation, T.B. and J.S.; formal analysis, V.S. and J.S.; investigation, V.S. and M.B.; resources, M.B.; data curation, V.S.; writing—original draft preparation, T.B.; writing—review and editing, T.B. and J.S.; visualization, V.S.; supervision, T.B.; project administration, T.B. All authors have read and agreed to the published version of the manuscript.
Funding
This work was supported and funded by the European Regional Development Fund; OP RDE; Project: “Carbon allotropes with rationalized nanointerfaces and nanolinks for environmental and biomedical applications” (no. CZ.02.1.01/0.0/0.0/16_026/0008382). This research was also supported by the Student Grant Agency of the University of West Bohemia in Pilsen, grant No. SGS-2021-003 “Materials, technologies and diagnostics in electrical engineering”.
Institutional Review Board Statement
Not applicable.
Informed Consent Statement
Not applicable.
Data Availability Statement
Not applicable.
Conflicts of Interest
The authors declare no conflict of interest.
References
- Rheaume, J.M.; Pisano, A.P. A review of recent progress in sensing of gas concentration by impedance change. Ionics 2011, 17, 99–108. [Google Scholar] [CrossRef] [Green Version]
- Abdelhalim, A.; Abdellah, A.; Lugli, P. Complex impedance characterization of highly sensitive carbon nanotube gas sensors. In Proceedings of the IEEE SENSORS 2014 Proceedings, Valencia, Spain, 2–5 November 2014; pp. 47–50. [Google Scholar] [CrossRef]
- Cui, L.; Murray, E. Effect of electrode configuration on nitric oxide gas sensor behavior. Sensors 2015, 15, 24573–24584. [Google Scholar] [CrossRef] [PubMed] [Green Version]
- Wong, H.-S.P.; Akinwande, D. Carbon Nanotube and Graphene Device Physics; Cambridge University Press: Cambridge, UK, 2010. [Google Scholar] [CrossRef] [Green Version]
- Korotcenkov, G. Handbook of Gas Sensor Materials: Properties, Advantages and Shortcomings for Applications Volume 1: Conventional Approaches; Springer: New York, NY, USA, 2013. [Google Scholar] [CrossRef]
- Stulik, J.; Blecha, T. Modified CNTs for NO2 detection. In Proceedings of the 2018 7th Electronic System-Integration Technology Conference (ESTC), Dresden, Germany, 18–21 September 2018; pp. 1–4. [Google Scholar] [CrossRef]
- Bryant, G.H. Principles of Microwave Measurements; P. Peregrinus Ltd. on behalf of the Institution of Electrical Engineers: London, UK, 1993. [Google Scholar]
- Eisenstadt, W.R.; Eo, Y. S-parameter-based IC interconnect transmission line characterization. IEEE Trans. Comp. Hybrids Manufact. Technol. 1992, 15, 483–490. [Google Scholar] [CrossRef]
- Milovanov, Y.S.; Skryshevsky, V.A.; Slobodian, O.M.; Pustovyi, D.O.; Tang, X.; Raskin, J.P.; Nazarov, A.N. Influence of gas adsorption on the impedance of graphene oxide. In Proceedings of the 2019 IEEE 39th International Conference on Electronics and Nanotechnology (ELNANO), Kyiv, Ukraine, 16–18 April 2019; pp. 155–158. [Google Scholar] [CrossRef]
- Schütze, A.; Reimann, G.; Darsch, S.; Schüler, M.; Gillen, T. A1.3—Electrical impedance spectroscopy combined with temperature cycled operation for semiconductor gas sensors. In Proceedings of the SENSOR 2011, Nürnberg, Germany, 7–9 June 2011. pp. 40–45. [CrossRef]
- Balasubramani, V.; Sureshkumar, S.; Rao, T.S.; Sridhar, T.M. Impedance spectroscopy-based reduced graphene oxide-incorporated ZnO composite sensor for H2S investigations. ACS Omega 2019, 4, 9976–9982. [Google Scholar] [CrossRef] [PubMed] [Green Version]
- Sekhar, P.K.; Sarraf, H.; Mekonen, H.; Mukundan, R.; Brosha, E.L.; Garzon, F.H. Impedance spectroscopy based characterization of an electrochemical propylene sensor. Sens. Actuators B Chem. 2013, 177, 111–115. [Google Scholar] [CrossRef]
- Labidi, A.; Jacolin, C.; Bendahan, M.; Abdelghani, A.; Guerin, J.; Aguir, K.; Maaref, M. Impedance spectroscopy on WO gas sensor. Sens. Actuators B Chem. 2005, 106, 713–718. [Google Scholar] [CrossRef]
- Balasubramani, V.; Chandraleka, S.; Rao, T.S.; Sasikumar, R.; Kuppusamy, M.R.; Sridhar, T.M. Review—Recent advances in electrochemical impedance spectroscopy based toxic gas sensors using semiconducting metal oxides. J. Electrochem. Soc. 2020, 167, 037572. [Google Scholar] [CrossRef]
- Schipani, F.; Miller, D.R.; Ponce, M.A.; Aldao, C.M.; Akbar, S.A.; Morris, P.A. Electrical characterization of semiconductor oxide-based gas sensors using impedance spectroscopy: A review. Rev. Adv. Sci. Eng. 2016, 5, 86–105. [Google Scholar] [CrossRef]
- Lvovich, V.F. Impedance Spectroscopy: Applications to Electrochemical and Dielectric Phenomena; Wiley: Hoboken, NJ, USA, 2012. [Google Scholar]
- Schmidt, J.W.; Moldover, M.R. Dielectric permittivity of eight gases measured with cross capacitors. Int. J. Thermophys. 2003, 24, 375–403. [Google Scholar] [CrossRef]
- Kremer, F. Broadband Dielectric Spectroscopy. 2002. Available online: https://doi.org/10.1007/978-3-642-56120-7 (accessed on 16 February 2021). [CrossRef]
- Mamishev, A.V.; Sundara-Rajan, K.; Yang, F.; Du, Y.; Zahn, M. Interdigital sensors and transducers. Proc. IEEE 2004, 92, 808–845. [Google Scholar] [CrossRef] [Green Version]
- Yang, C.-N.; Lee, Y.-C. Surface roughness improvement of alumina substrates coated using aluminum nitride sol gel. J. Ceram. Processing Res. 2017, 18, 628–633. [Google Scholar]
- Stulik, J.; Kroupa, M.; Blecha, T.; Hamacek, A. Carbon nanotube dispersion preparation and deposition of thin layers for gas sensors. In Proceedings of the 2015 38th International Spring Seminar on Electronics Technology (ISSE), Eger, Hungary, 6–10 May 2015; pp. 1–4. [Google Scholar] [CrossRef]
- Kumar, P.; Park, J.-S.; Randhawa, P.; Sharma, S.; Shin, M.-S.; Sekhon, S.S. A study on the effect of different chemical routes on functionalization of MWCNTs by various groups (-COOH, -SO3H, -PO3H2). Nanoscale Res. Lett. 2011, 6, 583. [Google Scholar] [CrossRef] [PubMed] [Green Version]
- Li, Y.; Hodak, M.; Lu, W.; Bernholc, J. Mechanisms of NH3 and NO2 detection in carbon-nanotube-based sensors: An ab initio investigation. Carbon 2016, 101, 177–183. [Google Scholar] [CrossRef] [Green Version]
Publisher’s Note: MDPI stays neutral with regard to jurisdictional claims in published maps and institutional affiliations. |
© 2022 by the authors. Licensee MDPI, Basel, Switzerland. This article is an open access article distributed under the terms and conditions of the Creative Commons Attribution (CC BY) license (https://creativecommons.org/licenses/by/4.0/).