Abstract
The production, storage, and use of hydrogen for energy purposes will become increasingly important during the energy transition. One way to use hydrogen is to apply it to power vehicles. This green technological solution affects low-emissions transport, which is beneficial and important, especially in cities. The authors of this article analyzed the use of hydrogen production infrastructure for bus propulsion in the city of Katowice (Poland). The methods, used in the study, included a greedy algorithm and cost methods, which were applied for the selection of vehicles and identification of the infrastructure for the production, storage and refueling of hydrogen, as well as to conduct the economic analysis during this term. The article presented the complexity of the techno-economic analysis of the infrastructure and its installation. The key element was the selection of the number of vehicles to the hydrogen production possibilities of an electrolyser and capabilities of the storage and charging infrastructure.
1. Introduction
Poland is a country where fossil fuels are the main source of energy [1]. Due to the extensive natural deposits of hard coal and lignite, mining remains one of the most important industries. Poland has one of the largest deposits of these raw materials in Europe, and they play an important role in the country’s energy safety [2]. Lignite and hard coal have been crucial to Poland’s energy system for years. Generally, all the lignite extracted in surface mining systems is used in power stations. Hard coal is an important element in the power industry, the metallurgical industry (coke production) and is used by individual households for heating purposes [3]. The total hard coal production in Poland in November 2021 amounted to 4,632,868 tons [4]. However, the significant use of traditional energy sources has a strong environmental impact. Air, water, and soil pollution are just some of the effects of the use of coal in industry, and by individual customers. Deterioration of the environment is noticeable, especially during the heating seasons. The combustion of hard coal has a negative impact on the natural environment. The products of coal combustion are released into the air in the form of hydrocarbons, carbon oxides, sulfur oxides, nitrogen oxides, and others. The combustion of coal in households and small heating plants poses a particular threat and is the cause of so-called low-stack emissions [5]. Although the mining industry strives to apply new clean technologies and adopt activities towards greener production [6,7], a sensible direction in the energy sector is the usage of renewables. The opportunity to strive for sustainable development should be researched not only in the energy sector but also in other sectors. An example of a sector that is also a source of environmental pollution is transport. One of the green solutions in the field of transport is to replace mostly diesel/petrol-powered cars and buses with electric or hydrogen-powered ones.
In the first part of this research, the authors of the paper conducted a literature analysis of research on electric and hydrogen buses around the world and also in Poland. Based on this part of the research, which is presented in the next section named State of the Art, the authors identified the research gap. This gap was described as a lack of techno-economic analysis on the investment in hydrogen buses, using the example of a selected Polish city. It should be noted that none of the reviewed papers presented a techno-economic analysis of investing in hydrogen-powered buses for a specific city in Poland. Based on this conclusion, the authors decided to conduct research on the issue of the application of buses powered by hydrogen fuel in a selected Polish city—Katowice. The analysis concerns technical and economic aspects. The authors present a potential investment in the infrastructure that allows for the supply of hydrogen to buses to conduct the proposed investment.
2. State of the Art
The European Union policy, which assumes decarbonization by moving away from energy from conventional sources, includes a set of environmental goals that must be achieved by the members states. The EU has set climate and energy targets for 2030: reducing greenhouse gas emissions by at least 40%; increasing energy efficiency by at least 32.5%; and increasing the share of renewable energy to at least 32% of EU energy use and guaranteeing at least 15% electricity interconnection levels between neighboring Member States [8]. According to Poland’s National Energy and Climate Plan for 2021–2030 (NECP PL), the reduction target for Poland in terms of greenhouse gas emissions in sectors not covered by the Emissions Trading System (ETS) system was established at −7% in 2030 compared to the level in 2005. Poland aims to achieve 21–23% of the renewable energy sources (RES) share in the gross final energy consumption by 2030. The goal of improving energy efficiency was set at the level of a 23% reduction of primary energy consumption compared to the 2007 forecast of the price-induced market equilibrium system (PRIMES). In 2030 the share of coal in electricity generation will reach a level of 56–60%, and then, the downward trend will continue [9]. Due to these targets, both Poland and the European Union strongly support and finance investments in modern clean technologies and new zero-emissions solutions in almost every field of human activity. The use of solar, wind, hydro, geothermal, hydrogen, and biomass energy is a great opportunity and an indispensable direction for activities.
Many studies refer to and discuss the topic of ecological and sustainable transport. According to [10] electric cars are the cars of the future. The harmful effects of electric cars on the environment are significantly lower. The authors of [10] demonstrated that the Netherlands is the world leader in the operation of electric vehicles. However, electric cars also have flaws. One of the biggest problems is the rapid wear of the battery [11,12], and partially related to this matter, the high cost [13]. In addition, for now, there not many stations at which to charge electric cars [14]. According to [15], home charging is and will be the most important charging option in most countries, and what is more, will remain so in many countries with a high home charging opportunity for users beyond current early adopters. Public charging infrastructure will be important as a substitute in countries with low potential home charging availability. In addition, electric cars, and electric buses, as a part of public transport, are being introduced. There are many papers on electric buses in specific countries and cities, for example: Stockholm [16], Davis [17], Stuttgart [18], Paris [19], Berlin [20], and Prague [21]. When it comes to eco-friendly buses, there are also hydrogen buses. In the literature, there is some research on those buses. Logan et al. [22] presented the problem of shifting from conventionally fueled cars to hydrogen and electric buses in the UK. Sayer et al. [23] focused on the economics of a hydrogen bus fleet powered by a wind park in Austria. Hensher et al. [24] carried out a comparative analysis on electric and hydrogen buses in Australia. Zhou et al. [25] studied safety issues related to hydrogen buses. Iannuzzi et al. [26] compared a life cycle assessment (LCA) for use on renewably sourced hydrogen fuel cell buses with diesel engines buses in Rosario, Argentina. LCAs are the subject of other studies as well. For example, in Taiwan, Chang et al. [27] studied the LCA of alternative energy types, including hydrogen, for their public city buses. Gunawan et al. [28] presented the results of the techno-economic modelling of a nationwide hydrogen fuel supply chain, including renewable hydrogen production, transportation, and dispensing systems for electric fuel cell buses in Ireland. Zhang et al. [29] provided a case study for Zhangjiakou in North China, in which they discussed a solution to renewable hydrogen economy for fuel cell buses. De Miranda et al. [30] conducted research on improving the energy management system in Brazilian hybrid electric-hydrogen fuel cell buses. Research is also being conducted on the safety of the use of a hydrogen bus fuel system, due to its use in urban conditions and the location of the hydrogen tank [31].
The simplest and most popular method of hydrogen production is the electrolysis of water using electricity (including from renewable energy sources). In this regard, there are three hydrogen production technologies: proton exchange membrane electrolysis with an acid ionomer, alkaline electrolysis with a liquid electrolyte, and high-temperature steam electrolysis with a solid oxide as the electrolyte [32].
In reference to Poland, there are only a few papers that discuss the topic of hydrogen public buses. Bednarczyk et al. [33] present opportunities and limitations of hydrogen energy in Poland, also referring to buses. Dzikuć et al. [34] focus on the problem of modernization of the public transport bus fleet in the context of low-carbon development in Poland. In [35,36] Gis and Gis characterize the current state and prospects for hydrogenisation of transport in Poland. Małek et al. [37] conduct research on optimization of energy management in a city bus powered by hydrogen fuel cells. Gis et al. [38] present, among others, the production technologies and hydrogen production in Poland and the assumptions for the development of the hydrogen-powered vehicle fleet in Poland by 2050. Sołtysik et al. [39] indicate the legitimacy and possibilities of producing and storing hydrogen in the local area as part of energy clusters. Gis and Schaap [40] provided a comparative analysis of hydrogenation of road transport in Poland and Sweden. There are also more papers on hydrogenization in Poland for now and for the future [41,42,43].
None of the papers presented a techno-economic analysis of investing in hydrogen-powered buses with for the specific city in Poland. Based on the analyzed literature, a research gap was found, which inspired the authors to conduct the research. The research gap can be described as a lack of techno-economic analysis on hydrogen buses investment in the example of the selected Polish city, which includes infrastructure, costs and courses of the buses in terms of the maximum use of the produced hydrogen.
3. Materials and Methods
In this article, a technical and economic analysis of hydrogen fuel-powered buses was carried out. Hydrogen-powered vehicles are the type of electric vehicles that are equipped with a fuel cell instead of a battery or in combination with a battery or a supercapacitor to provide an onboard electric motor [44]. The subject of the analysis were city buses that traveled through the city of Katowice and reached other cities in Silesia (Poland). Currently, Katowice city buses are powered by conventional energy sources (usually diesel fuel). Hence, the research shows how potentially green energy-powered city buses could be used, i.e.:
- infrastructure necessary to produce hydrogen and power buses, and its costs;
- costs of hydrogen production;
- the method of selecting city bus lines in Katowice, where hydrogen could be used instead of diesel oil.
The analysis focused on maximizing the use of infrastructure, including buses, in terms of the use of hydrogen produced and the number of kilometers driven. For this reason, an important element of the research was to select such lines and the number of buses that allowed the use of the necessary infrastructure at nearly 100%. The article proposed one of the solutions to the problem of effective use of hydrogen infrastructure.
The process of producing hydrogen fuel to supply the buses with fuel is shown in Figure 1. The research assumed that a hydrogen supply station for buses should be built, because there is no such station in the city. The infrastructure of the station consisted of an electrolyser, a compressor, fueling and supply storage, and a dispenser. To produce hydrogen, electricity is necessary, whose sources may be different [45]. In the study, two cases were considered: energy consumption from the grid and energy generation from photovoltaics.
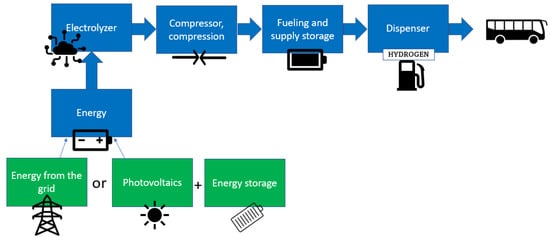
Figure 1.
The process of generating hydrogen energy to supply buses with fuel [own elaboration].
The analysis was aimed at showing the costs of investment in a new pro-ecological solution, aimed at replacing selected buses with diesel engines with hydrogen-powered buses. The analysis may be helpful for local governments of cities similar in size to Katowice to consider the application of the form of investment in green technology presented in the article, which will translate into the reduction of urban pollution from road transport. It should be emphasized that in Poland, fuel consumption in road transport increased by 42.9% between 2009 and 2019 (the annual growth rate was 3.6%). The share of transport in final energy consumption in Poland increased from 25.8% in 2009 to 31.8% in 2019 [46]. Therefore, it is reasonable to look for solutions that will contribute to reducing exhaust gas emissions on a national scale, and also locally because especially in cities, each additional emission can be a nuisance for residents.
It should be emphasized that replacing traditional solutions with clean solutions will have a positive impact on the environment, the quality of life of residents and is a step towards sustainable development. In other words, it makes a given city more “smart”, which nowadays is the aspiration of many Polish cities, e.g., Katowice [47,48].
Figure 2 shows a diagram of components of the total investment costs. The cost of the project consists mainly of infrastructure investment expenditures—namely hydrogen installation. Data from the hydrogen installations manufacturer were used here. Capital expenditures included, among others, the costs of the electrolyser, compressor, compressed hydrogen storage and others. Then, subsidies for hydrogen installations were taken into account, which reduced the cost of the entire investment. Another cost was the purchase of buses, as well as other costs. A very important element of the analysis was the calculation of the hydrogen production costs. In this study, two cases were considered: the use of energy on the grid, as well as the generation of energy from photovoltaics.
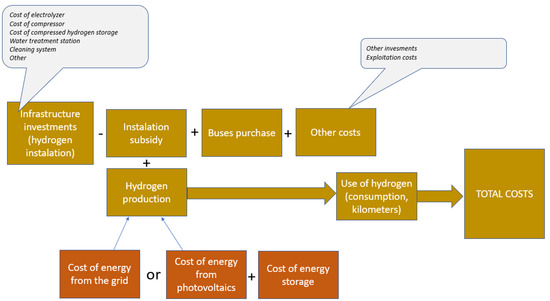
Figure 2.
Total investment (with and without) costs without labor cost [own elaboration].
The total costs of using a hydrogen bus without labor cost can be calculated as follows:
- OPEXwL—operational expenditures without labor costs, euro/km
- EC—electricity energy costs per kg of hydrogen based on LCOE and energy consumption, euro/kg
- HC—hydrogen consumption, kg/km
- iHC—infrastructure Hydrogen Cost, euro
- NB—number of buses
- BP—Bus purchase cost, euro
- ED—estimated distance of bus for lifetime [23], km
An important stage of the analysis was the selection of buses lines. The selection was based on the greedy algorithm method. A greedy algorithm makes a locally optimal choice, assuming that this will lead to a globally optimal solution. For a wide range of important problems, the greedy algorithm is quite efficient. A variety of applications of this method can be found in the literature—in the past [49,50], as well as present research [51,52]. The greedy algorithm helps to make the most favorable decision at each step. It is a type of heuristic algorithm and at the same time a deterministic algorithm—there is no randomness in it. A natural weighting w [53] of the partially ordered set P is a function w: P → R such that for all x, y ϵ P, x ≤ y implies w(x) ≥ w(y) ≥ 0; w extends to a non-negative function on the independence system C(P) in an obvious manner: for all I ϵ C(P),
If I = (x1, …, xk) ϵ C(P) so that w(I) = max {w(J): J ϵ C(P)}, then I is optimal. I is w-feasible if w(x1) ≥ w(x2) ≥ … ≥ w(xk).
The greedy algorithm is a procedure that determines a w-feasible element of the independence system C = C(P) as follows [53]:
step 1: choose x1 ϵ P so that w(x1) is maximal and (x1) ϵ C. If such choice is not possible, stop. Otherwise, continue.
step 2: choose x2 ϵ P − x1 so that (x1, x2) ϵ C and w(x2) is maximal among those w(x) with w(x) ≤ w(x1) and (x, x1) ϵ C. If such choice is not possible, stop. Otherwise, continue.
step k: choose xk ϵ P − {x1, …, xk−1} so that (x1, …, xk−1, xk) ϵ C and w(xk) is maximal among those w(x) with w(x) ≤ w(xk−1) and (x1, …, xk−1, x) ϵ C. If such choice is not possible, stop. Otherwise, continue.
Therefore, the greedy algorithm will always exhibit a w-feasible element of C [53].
3.1. Capital Expenditures for the Hydrogen Installation
To estimate the cost of investment in the hydrogen installation, an offer from one of the global dedicated hydrogen companies delivering solutions to produce, store and distribute hydrogen from renewable energy, was used. The Nel Hydrogen company serves industries, energy, and gas companies with leading technology. It provides hydrogen electrolysers and fueling equipment designed for market opportunities [54].
The cost of the investment in the hydrogen system was calculated based on the data from the producer. This cost included the purchase of the H2Station including all components for fueling about 10 buses, which was approx. 1,000,000 EUR—approximately 4,571,500 PLN. The H2Station is an all-integrated module, and includes all equipment required for hydrogen fueling, including compression capacity, cooling, and the required control system. Together with a fuel storage and dispenser, the system allows for fueling of the vehicle. The H2Station uses Nel’s own internal compressor technology developed for hydrogen fuel, providing a high capacity and operational dynamic that provides effective and contamination-free compression [54].
Another cost was the building facilities, estimated at approx. 200,000 EUR—approx. 914,300 PLN. In summary, the cost of the hydrogen installation in total was approximately 1,200,000 EUR—approximately 5,485,800 PLN.
3.2. Subsidy
Currently, solutions in the field of alternative energy sources receive support from national and EU funds. EU funds support innovation in clean technologies that will help achieve greenhouse gas neutrality. Support programs for clean energy sources are addressed both to individual clients, entrepreneurs, and local government units.
It is assumed that the solution proposed in the article for the purchase and hydrogen installation will receive a 90% subsidy from these funds. This will mean that at the cost of 5,485,800 PLN (approx. 1,200,000 EUR) the subsidy will amount to 4,937,220 PLN (approx. 1,080,000 EUR), and the own expenditure will be 548,580 PLN (approx. 120,000 EUR).
4. Results
4.1. Hydrogen Production Costs
According to the technical specification of the Nel C150 electrolyser, received from the manufacturer, the device produces 50–150 Nm3 of hydrogen per hour. For the calculations, we assumed the value of 150 Nm3. The density of gaseous hydrogen is 0.09 kg/Nm3. Thus, the device produces 150 Nm3 × 0.09 kg/Nm3 = 13.5 kg of hydrogen per hour. Per day, this value is 324 kg in the case of a 24-h operation.
Typical power consumption during electrolyser operation is 3.8–4.4 kWh/Nm3. The upper value of 4.4 kWh/Nm3 was assumed. So, 4.4 kWh/0.09 kg = 48.9 kWh/kg—this is the amount of energy used to produce hydrogen.
In this study, we assumed that energy can be obtained from the power grid or solar energy. In the case of energy from the grid, the average electricity price in Poland (September 2022) is PLN 0.6/kWh (approx. EUR 0.13/kWh). Thus, the cost of producing 1 kg of hydrogen is (48.9 kWh × 0.6 PLN/kWh)/kg = 29.3 PLN/kg (approx. 6.41 EUR). The price of energy is increasing drastically, which can result in the lack of economic viability of the proposed solution without, for example, without the use of renewable energy sources.
Total energy needs are 15.8 MWh/day and approx. 5.8 GWh/year. Under Polish conditions, such an amount of energy would be provided by a photovoltaic farm with an area of approx. 6 ha and a capacity of 6 MWp, investment outlays of EUR 5 million. However, only part of the energy production would be used on an ongoing basis, no more than 12% of the power if the photovoltaic installation reaches its maximum power. The size of the photovoltaic (PV) installation, which does not result in the outflow of generated energy to the grid, is approx. 700 kWp, and its energy productivity would cover approx. 10% of the energy needs of the hydrogen infrastructure.
4.2. Calculation of Hydrogen Consumption (Combustion), Kilometers
Selection of Bus Lines—Assumptions
In the research, it was assumed that a 12-m bus (buses of this length are often found in public transport) needs 8 kg of hydrogen to travel 100 km. Sources of assumptions: [55,56,57].
Tanks in hydrogen-powered buses in Poland have different capacities: 40–50 kg [58], 38.5 kg [55], 37.5 kg. The full charging time is approximately 9 min [59]. The short loading time allows these data to be omitted from the analysis. If a larger number of buses, e.g., 50, were analyzed, the refueling process could be a bottleneck. Refueling 50 buses would require 7.5 h (excluding arrival and departure times and other refueling activities) per day, which would require a meticulous process of planning and organizing the refueling process. In this analysis, the above aspect is not a barrier, therefore the analysis and organization of refueling time have been omitted.
For this analysis, the capacity of the bus fuel tank was assumed to be 38.5 kg.
For a given 0.08 kg/km, 5% of the used fuel reserve was added, which gives: 0.084 kg/km.
Thus, it is assumed that a fully loaded bus can travel a maximum of 458 km.
As part of the selection of the transit line, the parameters of the city bus line in Katowice were used. These parameters included, among others: number of buses, number of courses, and route length for each bus line. The analysis began with the ordering of the data in descending order according to the number of kilometers traveled by one bus from a given line per working day. Table 1 presents a fragment of the table with the parameters of the city bus line, which are important from the point of view of the analysis.

Table 1.
A part of the table with selected parameters of the city busline, ordered in descending order by the number of kilometers traveled by one bus from a given line per working day.
The bus line 49 travels the most kilometers a day on weekdays—it is 438 km, and the bus line 959—30 km—the least. The length of the route covered by bus number 49 is 29.2 km, and the daily number of trips is 15. There are two buses on this route. After organizing the data, the following conclusion was drawn: all buses are able to cover the planned daily distances per day on a single refueling, bearing in mind that a full load is enough to travel 458 km. Therefore, all buses were subjected to further analysis.
The Nel C150 electrolyzer produces a maximum of 150 Nm3 of hydrogen per hour. With a hydrogen density of 0.09 kg/Nm3, this gives 13.5 kg of hydrogen per hour, or 324 kg of hydrogen per day.
The assumed value of the hydrogen consumption of 0.08 kg/km increased by 5% as a reserve value. The maximum number of kilometers to drive per day provided by hydrogen production (electrolyser) was then calculated. Calculating 324 kg: 0.084 kg/km gives 3857 km per day. This value had to be distributed to the buses in the next step of the research, on a daily basis.
However, the route lengths of individual lines were not the final values to be analyzed, because the buses actually traveled more kilometers due to commuting to the starting point of the routes, returning to the depot, as well as other trips (access to a service point or other). For this reason, the next assumption adopted was to add the value of 1/3 of a given route for each line.
Then, the bus lines and the number of buses were selected with the total number of kilometers driven per day closest to 3857 km.
4.3. Selection of Bus Lines and Calculated Mileage
Bus lines were selected based on the greedy algorithm method. In practice, this meant that the buses travelling the most kilometers per day (on working days) were selected in such a way that the total sum of kilometers (vehicle-kilometers) was less than or equal to 3857 km. However, it should be noted that if there was more than one bus on a given line, the selected number of buses could not be equal to the maximum number of buses on a given line—this was the assumption made by the authors. For the sum of 3857 km, the components were selected from the largest, and when it was not possible, the smaller number that was possible was selected.
Therefore, the spreadsheet was extended with the following columns: “selected number of buses” and “vehicle kilometers”. In addition, the columns “refueling 1 bus [kg]” and “refueling [kg] 1 bus—safety” were added. The last column showed the refueling values, increased by 10%, which were taken as a reserve—it was assumed that a given bus must be refueled with more kilograms to avoid the problem of running out of fuel before the next refueling, caused by variable combustion and random situations. Therefore, buses for which it was not possible to refuel with the planned reserve were excluded from further analysis. In the case of traditional drives, increased fuel consumption was observed in the winter, because the power system needs more energy from the moment of start until it reaches the optimal temperature. It should also be emphasized that part of the energy is lost as heat. This undesirable side effect in winter is used to heat the passenger compartment and the driver’s cabin. As a result, the overall efficiency is significantly increased. In the case of buses using hydrogen propulsion, the situation will be similar, but on a smaller scale. It should also be taken into account that in the winter, the bus will require heating, and in the summer—the use of air conditioning. This is related to the increased use of energy, hence the need to “refuel” with a reserve.
As a result of this stage of research, two buses of line no. 850 out of three running, the only bus of line no. 250, one bus of line no. 603 out of two running, the only bus on line no. 220, three buses of line no. 860 out of four running and one bus from line no. 937 of the two runs. A total of nine buses were selected to run on hydrogen as a result of this analysis. Table 2 shows an extensive table—a fragment with a selected number of bus lines.
Table 2.
A part of the table with detailed data for the selected numbers of bus lines on their courses, routes and refueling—data for working days.
Summing up the above analysis, it can be stated that it is possible to distribute 323.6 kg of hydrogen per day. It should be noted here that, in reality, it is difficult to refuel a bus with an exact value of kilograms in two decimal places. Due to this, the values given in the last column of the table should be rounded down to full kg, resulting in the following respective fueling values for line numbers 850, 250, 603, 220, 860 and 937: 37 kg, 37 kg, 37 kg, 36 kg, 36 kg and 25 kg. Thus, the final adopted safety limit for individual buses was, respectively, 7.87%, 8.95%, 8.28%, 7.24%, 7.49% and 6.93%. Ultimately, a total of 317 kg will be distributed daily. In total, the buses will travel 3501.72 km per day.
For the buses selected in the previous stage of the research, the number of kilometers traveled on Saturdays and Sundays was also counted. In most cases, the schedule for buses of individual lines differed in terms of the number of trips. On weekends, buses generally traveled less kilometers than on weekdays. Individual calculations were made in the same way as in the case of working days. On Saturdays, selected buses will travel a total of 2782.53 km, and on Sundays—2424.20 km. This is, respectively, 80% (Saturday) and 69% (Sunday) of routes covered on working days. The total number of kilograms of hydrogen refueled on Saturday is 251 kg, on Sunday—217 kg.
In total, the buses (proposed nine buses) were able to cover 3501.72 km per day on weekdays, 2782.53 km on Saturdays and 2424.20 km on Sundays, equal to a distance of 1,175,360 km/year. The calculations focused on maximizing the possible use of the hydrogen storage and refueling production infrastructure. The number of buses and routes were selected iteratively to the size of the hydrogen devices.
In order to provide “fuel”, the buses must be filled with hydrogen in the amount of 317 kg on working days, 251 kg on Saturdays and 217 kg on Sundays. Considering the hydrogen production cost of 29.3 PLN/kg (approx. 6.41 EUR), the hydrogen production cost was calculated for the selected nine buses. Table 3 shows the results of these calculations, which included the daily costs and the total annual cost for 2022. The total operational cost for hydrogen fueling was 3,111,865.10 PLN/year (approx. 680,709.85 EUR/year).
Table 3.
Results of calculations of hydrogen generation costs to ensure scheduled bus journeys on weekdays, Saturdays and Sundays with holidays for 2022.
The results presented in the table above refer to the operational cost (without human work) of covering 1 km at the level of EUR 0.58.
5. Discussion of the Results
Sayer et al. [23] compared fuel cell electric bus (FCEB) costs with diesel bus costs. He considered the total cost of use (TCU, per year) which included not only the investment costs but also the cost structure of the buses (for entire lifetime) in Austria. FCEB TCU was obtained as 128,415 euros/year (including distance 45,000 km/year) and 61,512 euros/year for the diesel bus. The main part of the FCEB costs was the investment cost. He assumed a lower maintenance cost for FCEB (0.20 euros/km) than for the diesel bus (0.27 euros/km). Hydrogen costs of 9.5 EUR per kilogram were equal to 0.86 euros/km [23], and were much higher than the obtained value in our work.
According to Kim et al. [60] hydrogen buses until 2030 still have a 15.4% higher total cost of ownership (TCO) than a diesel bus system. The authors claim that hydrogen buses can be competitive in small to medium-sized cities, even with limited routes. For H2 buses, the body of the bus and fuel cost make up a large part of the TCO. Reducing the fuel cost will be a crucial aspect in reducing the total TCO of the hydrogen bus.
The topic of the introduction of hydrogen buses was also analyzed in a paper by Pamucar et al. [61], using Romania as an example. The paper presented a case study for a city, in which a fleet of 20 hydrogen buses, as part of a program to modernize the public transport fleet, was developed. However, the study method is difficult to compare with ours, as [61] eight technical alternatives were analyzed. The ranking was based on the final values of the utility functions. The evaluation criteria and sub-criteria were analyzed especially in terms of economic weight. The authors noticed that, although green and decarbonized alternatives are more desired by people, progressive groups or public institutions, the investment and operation costs with technical issues, as well as the need for overproduction in short periods of time or high hydrogen storage capacity, make them less competitive. The assumption in this study, which was similar to ours, was a limited number of hydrogen buses.
Hua et al. [62] conducted a similar research study for fuel cell electric buses (FCEBs) in North America and Europe. The study presented the miles accumulated, availability, fuel economy, fuel cost, road calls, and hydrogen fueling for hydrogen buses and their infrastructure. It is worth noting that the authors also focused on the main barriers for FCEBs compared to conventional diesel buses. They discussed the lack of infrastructure for refueling, the high bus capital cost, and meeting a fuel cost of $5–7 per kg of H2, at which price the fuel cost per mile will be competitive with conventional buses. As the authors noted, these challenges are being addressed in projects around the world. According to Kim et al. [60], the total costs of ownership (TCO) results for electric buses showed a strong decrease in costs until 2030, reaching 23.5% lower TCOs compared to conventional diesel buses. In the case of electric buses for the year 2020, the parameter that most influenced TCO was the battery cost, which was opposite to the year 2030 in which the bus body cost and fuel cost parameters dominate the TCO due to the learning rate of the batteries.
In terms of the studied topic, the attitude of the society toward hydrogen buses is also important. O’Garra et al. [63] presented results from an international study of acceptability and preferences for hydrogen fuel cell (FC) buses. The paper compared public willingness to pay (WTP) for the air pollution reductions associated with the scenario of large-scale introduction of hydrogen buses in four cities: Berlin, London, Luxembourg, and Perth. The results indicated that bus users in all cities have a positive WTP for hydrogen buses. Furthermore, the values are similar in geographical locations (ranging from WTP an extra €0.29 to €0.35 per single bus fare). The study confirms that, generally, residents of these cities are willing to pay extra (in taxes) to support the introduction of hydrogen buses.
6. Conclusions
The constant increase in fuel consumption in road transport in Poland (as well as the increase in the share of transport in final energy consumption) means that local governments in Poland are increasingly interested in new pro-ecological solutions that have a positive impact on the environment. Various green technologies that reduce urban pollution and improve the quality of life of residents are the subject of analyses around the world in the interest of developing sustainable solutions in the field of energy and transport itself. In this context, the analysis of replacing selected diesel engine buses with hydrogen-powered buses may be helpful for city governments to undertake new pro-ecological investments to reduce emissions that are burdensome for the inhabitants of urban agglomerations.
The article presented a method of selecting hydrogen-fueled buses for the buses of the Katowice agglomeration (the bus fleet runs both in the city of Katowice and in other cities in Silesia). The potential of city buses powered by green energy was presented for the infrastructure necessary to produce hydrogen and fuel buses—the analysis included its costs as well as the costs of hydrogen production. The study presents a method of selecting the number of city buses in Katowice, in which hydrogen could be used instead of diesel oil. The research assumed that a hydrogen supply station for buses should be built, because there is no such station in Katowice. The infrastructure of the station should consist of an electrolyser, a compressor, fueling and supply storage, and a dispenser. To produce hydrogen, electricity is necessary, of which there can be different sources. In the study, two cases were considered: energy consumption from the grid and energy generation from photovoltaics.
The analysis focused on the maximum use of infrastructure, including buses under the penalty of using hydrogen and the number of kilometers driven. This method was based on technical and economic indicators—for this purpose, e.g., a greedy algorithm. The analysis considered the adaptation of vehicles, i.e., buses (number and routes) to the hydrogen production infrastructure. Specific routes and bus lines (9 buses) were calculated for the Katowice agglomeration in order to make maximum use of the proposed infrastructure. The results of the analysis showed that a total of 317 kg of hydrogen can be distributed daily for the nine studied buses. In total, the buses will travel 3501.72 km per day. On Saturdays, the selected buses will travel a total of 2782.53 km, and on Sundays—2424.20 km. Hence, the total number of kilograms of hydrogen refueled on Saturday is 251 kg, on Sunday—217 kg. Taking into account the annual distance and costs related to hydrogen without human labor: the cost of covering 1 km for a bus was EUR 0.58. This is a lower unit cost than those reported in the literature.
One of the areas that has not been developed in this study but showed excellent potential for research in the future, is the organization of charging. As it was shown, the full bus charging time is approximately 9 min. Due to the small number of buses, these data were omitted as they did not affect the analysis. However, a larger number of buses will demand a detailed analysis in terms of charging organization; the refueling process could prove to be a bottleneck. Therefore, the area of bus refueling planning and organization has a broad research potential, which the authors plan to carry out in the next study. This area is in the range of infrastructure management. The research has the potential to be extended. The development of the study can include detailed analyses of the use of renewable sources for implementation in the production of hydrogen (especially green hydrogen), and for the use of cost optimization in this area. Such analyses are important for cities in Poland, as Poland faces an energy transformation, and local governments are in need of new solutions for renewables as well as for analyses of investments in alternative energy. Investing in renewable energy sources, especially for transport, is not only problematic from a technical and cost point of view, but it should be noted that the political aspects are crucial in this area. The attitudes of national authorities and local governments towards renewable energy sources are very important. However, in the case of Katowice, which aspires to be a Smart City, the implementation of the presented solution has promising opportunities.
Author Contributions
Conceptualization, P.O., K.S. and D.M.; methodology, P.O. and K.S.; software, P.O., K.S., D.M. and P.K.; validation, K.S., P.O., D.M., P.K. and H.D.D.; formal analysis, P.O. and K.S.; investigation, P.O., K.S. and D.M.; resources, K.S., P.O., D.M., P.K. and H.D.D.; data curation, P.O. and K.S.; writing—original draft preparation, K.S., P.O. and D.M.; writing—review and editing, K.S., P.O. and D.M.; visualization, K.S. and D.M.; supervision, P.O. and P.K.; project administration, K.S. and P.O.; funding acquisition, K.S., P.O., D.M., P.K. and H.D.D. All authors have read and agreed to the published version of the manuscript.
Funding
This research was funded by the statutory research performed at Silesian University of Technology (Department of Production Engineering, Faculty of Organization and Management), and KOMAG Institute of Mining Technology.
Data Availability Statement
Not applicable.
Acknowledgments
Not applicable.
Conflicts of Interest
The authors declare no conflict of interest.
References
- Komorowska, A. Can Decarbonisation and Capacity Market Go Together? The Case Study of Poland. Energies 2021, 14, 5151. [Google Scholar] [CrossRef]
- Dyczko, A. Thin coal seams, their role in the reserve base of Poland technical, technological and economic aspects of thin-seams coal mining. Int. Min. Forum 2007, 8, 81–87. [Google Scholar]
- Stecuła, K.; Brodny, J. Role and meaning of coal mining in poland. International Multidiscip. Sci. GeoConference SGEM 2018, 18, 801–808. [Google Scholar]
- ARP Katowice Polski Rynek Węgla. Available online: https://polskirynekwegla.pl/ (accessed on 5 November 2021).
- Stecuła, K.; Tutak, M. Causes and effects of low-stack emission in selected regions of Poland. Int. Multidiscip. Sci. GeoConference SGEM 2018, 18, 357–364. [Google Scholar]
- Stecuła, K. Decision-making Dilemmas in Mining Enterprise and Environmental Issues, i.e. Green Thinking in Mining. In Proceedings of the 18th International Multidisciplinary Scientific GeoConference SGEM, Albena, Bulgaria, 2–8 July 2018; Volume 18, pp. 357–364. [Google Scholar]
- Stecuła, K.; Brodny, J. Decision-making possibilities in the field of excavated material quality shaping in terms of environmental protection, I.E. how to be greener in mining. In Proceedings of the 18th International Multidisciplinary Scientific GeoConference SGEM, Albena, Bulgaria, 2–8 July 2018; Volume 18, pp. 243–250. [Google Scholar]
- European Comission. 2019 Summary of the Commission assessment of the draft National Energy and Climate Plan 2021–2030. Available online: https://ec.europa.eu/ (accessed on 3 November 2021).
- Ministry of Climate and Environment. Executive Summary of Poland’s National Energy and Climate Plan for the Years 2021–2030 (NECP PL); Ministry of Climate and Environment: Warsaw, Poland, 2019.
- Omonov, F.A.; Dehqonov, Q.M. Electric Cars as the Cars of the Future. Eurasian J. Eng. Technol. 2022, 4, 128–133. [Google Scholar]
- Gelmanova, Z.S.; Zhabalova, G.G.; Sivyakova, G.A.; Lelikova, O.N.; Onishchenko, O.N.; Smailova, A.A.; Kamarova, S.N. Electric cars. Advantages and disadvantages. J. Phys. Conf. Ser. 2018, 1015, 52029. [Google Scholar] [CrossRef]
- Łapko, A. The use of auxiliary electric motors in boats and sustainable development of nautical tourism–cost analysis, the advantages and disadvantages of applied solutions. Transp. Res. Procedia 2016, 16, 323–328. [Google Scholar] [CrossRef]
- Jochem, P.; Doll, C.; Fichtner, W. External costs of electric vehicles. Transp. Res. Part D Transp. Environ. 2016, 42, 60–76. [Google Scholar] [CrossRef]
- Das, H.S.; Rahman, M.M.; Li, S.; Tan, C.W. Electric vehicles standards, charging infrastructure, and impact on grid integration: A technological review. Renew. Sustain. Energy Rev. 2020, 120, 109618. [Google Scholar] [CrossRef]
- Funke, S.Á.; Sprei, F.; Gnann, T.; Plötz, P. How much charging infrastructure do electric vehicles need? A review of the evidence and international comparison. Transp. Res. Part D Transp. Environ. 2019, 77, 224–242. [Google Scholar] [CrossRef]
- Xylia, M.; Leduc, S.; Patrizio, P.; Kraxner, F.; Silveira, S. Locating charging infrastructure for electric buses in Stockholm. Transp. Res. Part C Emerg. Technol. 2017, 78, 183–200. [Google Scholar] [CrossRef]
- Wang, Y.; Huang, Y.; Xu, J.; Barclay, N. Optimal recharging scheduling for urban electric buses: A case study in Davis. Transp. Res. Part E Logist. Transp. Rev. 2017, 100, 115–132. [Google Scholar] [CrossRef]
- Laib, F.; Braun, A.; Rid, W. Modelling noise reductions using electric buses in urban traffic. A case study from Stuttgart, Germany. Transp. Res. Procedia 2019, 37, 377–384. [Google Scholar] [CrossRef]
- Basma, H.; Haddad, M.; Mansour, C.; Nemer, M.; Stabat, P. Evaluation of the techno-economic performance of battery electric buses: Case study of a bus line in paris. Res. Transp. Econ. 2022, 95, 101207. [Google Scholar] [CrossRef]
- Al-Ogaili, A.S.; Al-Shetwi, A.Q.; Al-Masri, H.M.K.; Babu, T.S.; Hoon, Y.; Alzaareer, K.; Babu, N.V.P. Review of the Estimation Methods of Energy Consumption for Battery Electric Buses. Energies 2021, 14, 7578. [Google Scholar] [CrossRef]
- Bartłomiejczyk, M.; Połom, M. The road to the development of electromobility in the Czech’s Prague: From electric buses to... trolleybuses? AUTOBUSY–Tech. Eksploat. Syst. Transp. 2019, 24, 22–28. [Google Scholar] [CrossRef]
- Logan, K.G.; Nelson, J.D.; Hastings, A. Electric and hydrogen buses: Shifting from conventionally fuelled cars in the UK. Transp. Res. Part D Transp. Environ. 2020, 85, 102350. [Google Scholar] [CrossRef]
- Sayer, M.; Ajanovic, A.; Haas, R. On the economics of a hydrogen bus fleet powered by a wind park–A case study for Austria. Int. J. Hydrog. Energy 2022, 47, 33153–33166. [Google Scholar] [CrossRef]
- Hensher, D.A.; Wei, E.; Balbontin, C. Comparative assessment of zero emission electric and hydrogen buses in Australia. Transp. Res. Part D Transp. Environ. 2022, 102, 103130. [Google Scholar] [CrossRef]
- Zhou, P.; Gao, S.; Wang, B.; Wang, Y.; Li, C.; Wang, Y.; Sun, B. Influence of hydrogen fuel cell temperature safety on bus driving characteristics and stack heating mode. Int. J. Hydrog. Energy 2022, in press. [Google Scholar] [CrossRef]
- Iannuzzi, L.; Hilbert, J.A.; Lora, E.E.S. Life Cycle Assessment (LCA) for use on renewable sourced hydrogen fuel cell buses vs diesel engines buses in the city of Rosario, Argentina. Int. J. Hydrog. Energy 2021, 46, 29694–29705. [Google Scholar] [CrossRef]
- Chang, C.-C.; Liao, Y.-T.; Chang, Y.-W. Life cycle assessment of alternative energy types–including hydrogen–for public city buses in Taiwan. Int. J. Hydrog. Energy 2019, 44, 18472–18482. [Google Scholar] [CrossRef]
- Gunawan, T.A.; Williamson, I.; Raine, D.; Monaghan, R.F.D. Decarbonising city bus networks in Ireland with renewable hydrogen. Int. J. Hydrog. Energy 2021, 46, 28870–28886. [Google Scholar] [CrossRef]
- Zhang, G.; Zhang, J.; Xie, T. A solution to renewable hydrogen economy for fuel cell buses–A case study for Zhangjiakou in North China. Int. J. Hydrog. Energy 2020, 45, 14603–14613. [Google Scholar] [CrossRef]
- De Miranda, P.E.V.; Carreira, E.S.; Icardi, U.A.; Nunes, G.S. Brazilian hybrid electric-hydrogen fuel cell bus: Improved on-board energy management system. Int. J. Hydrog. Energy 2017, 42, 13949–13959. [Google Scholar] [CrossRef]
- Shin, J.; Kim, K.; Han, K.; In, J.M.; Chang, H.-J.; Shim, S.; Kim, S. Crashworthiness Evaluation of a Hydrogen Bus Fuel System. Int. J. Automot. Technol. 2022, 23, 1483–1490. [Google Scholar] [CrossRef]
- Smolinka, T.; Ojong, E.T.; Garche, J. Chapter 8-Hydrogen Production from Renewable Energies—Electrolyzer Technologies. In Electrochemical Energy Storage for Renewable Sources and Grid Balancing; Elsevier: Amsterdam, The Netherlands, 2015; pp. 103–128. ISBN 978-0-444-62616-5. [Google Scholar]
- Bednarczyk, J.L.; Brzozowska-Rup, K.; Luściński, S. Opportunities and Limitations of Hydrogen Energy in Poland against the Background of the European Union Energy Policy. Energies 2022, 15, 5503. [Google Scholar] [CrossRef]
- Dzikuć, M.; Miśko, R.; Szufa, S. Modernization of the Public Transport Bus Fleet in the Context of Low-Carbon Development in Poland. Energies 2021, 14, 3295. [Google Scholar] [CrossRef]
- Gis, M.; Gis, W. The current state and prospects for hydrogenisation of motor transport in Northwestern Europe and Poland. Combust. Engines 2022, 61, 61–71. [Google Scholar] [CrossRef]
- Gis, W.; Gis, M. Overview of the method and state of hydrogenization of road transport in the world and the resulting development prospects in Poland. Open Eng. 2021, 11, 570–583. [Google Scholar] [CrossRef]
- Małek, A.; Taccani, R.; Kasperek, D.; Hunicz, J. Optimization of energy management in a city bus powered by the hydrogen fuel cells. Commun. Lett. Univ. Zilina 2021, 23, E56–E67. [Google Scholar] [CrossRef]
- Gis, W.; Kruczynski, S.; Menes, M.; Waskiewicz, J. Motor transport in Poland–hydrogenization. MATEC Web Conf. 2017, 118, 19. [Google Scholar] [CrossRef]
- Sołtysik, M.; Mucha-Kuś, K.; Kamiński, J. The New Model of Energy Cluster Management and Functioning. Energies 2022, 15, 6748. [Google Scholar] [CrossRef]
- Gis, W.; Schaap, G. Hydrogenation of road transport on the example of Sweden and Poland. IOP Conf. Ser. Mater. Sci. Eng. 2018, 421, 42024. [Google Scholar] [CrossRef]
- Gis, W.; Menes, E.; Waśkiewicz, J. Hydrogenization of road transport in Poland, now and in the future. IOP Conf. Ser. Earth Environ. Sci. 2019, 214, 12017. [Google Scholar] [CrossRef]
- Gis, W.; Menes, E.; Waśkiewicz, J. Forecasts for the development of hydrogen technology in the road transport in Poland against the background of global and European trends. J. KONES 2016, 23, 109–115. [Google Scholar]
- Orczyk, M.; Gis, W.; Tomaszewski, F. Circumstances of Railway Transport Hydrogenization in Poland; SAE Technical Paper; SAE International: Warrendale, PA, USA, 2020. [Google Scholar]
- Shin, J.; Hwang, W.-S.; Choi, H. Can hydrogen fuel vehicles be a sustainable alternative on vehicle market?: Comparison of electric and hydrogen fuel cell vehicles. Technol. Forecast. Soc. Chang. 2019, 143, 239–248. [Google Scholar] [CrossRef]
- Benalcazar, P.; Komorowska, A. Prospects of green hydrogen in Poland: A techno-economic analysis using a Monte Carlo approach. Int. J. Hydrog. Energy 2021, 47, 5779–5796. [Google Scholar] [CrossRef]
- Statistical Analyses. Energy Efficiency in Poland in Years 2009–2019. 2021. Available online: https://stat.gov.pl/en/topics/environment-energy/energy/energy-efficiency-in-poland-2009-2019,5,17.html (accessed on 28 November 2021).
- MojeKatowice.pl Moje Katowice. Available online: https://mojekatowice.pl/is,inteligentne-miasto-co-to-jest,270925,897467.html (accessed on 3 November 2021).
- Dziennik Zachodni Katowice Chcą Być Inteligentnym Miastem. Co Oznacza Smart City? Available online: https://dziennikzachodni.pl/katowice-chca-byc-inteligentnym-miastem-co-oznacza-smart-city-dyskusja-jest-punktem-jubileuszu-25-lat-slaskiej-lozy-bcc/ar/c1-15834909 (accessed on 3 November 2021).
- Bellman, R.E.; Eugene, L. Lawler, Combinatorial optimization: Networks and matroids. Bull. Am. Math. Soc. 1978, 84, 461–463. [Google Scholar] [CrossRef][Green Version]
- Papadimitriou, C.H.; Steiglitz, K. Combinatorial Optimization: Algorithms and Complexity; Dover Publications, INC: Mineola, New York, USA, 1998; ISBN 0486402584. [Google Scholar]
- Azad, M.; Chikalov, I.; Hussain, S.; Moshkov, M. Entropy-based greedy algorithm for decision trees using hypotheses. Entropy 2021, 23, 808. [Google Scholar] [CrossRef]
- Chen, S.; Pan, Q.-K.; Gao, L. Production scheduling for blocking flowshop in distributed environment using effective heuristics and iterated greedy algorithm. Robot. Comput. Integr. Manuf. 2021, 71, 102155. [Google Scholar] [CrossRef]
- Faigle, U. The greedy algorithm for partially ordered sets. Discret. Math. 1979, 28, 153–159. [Google Scholar] [CrossRef][Green Version]
- Nel Electrolysers Nel. Available online: www.nelhydrogen.com (accessed on 6 November 2021).
- GASHD Ile Wodoru na 100 Kilometrow Potrzebuje Autobus w Wuppertal. Available online: http://gashd.eu/2020/10/02/ile-wodoru-na-100-kilometrow-potrzebuje-autobus-w-wuppertal/ (accessed on 28 November 2021).
- Green Projects Wodorowe Autobusy-Zero Emisji, Dużo Korzyści. Available online: https://www.green-projects.pl/wodorowe-autobusy-zero-emisji/ (accessed on 28 November 2021).
- Money.pl Autobus Wodorowy to Przyszlosc Juz Niedlugo. Available online: https://www.money.pl/sekcja/impactmobility2018/autobus-wodorowy-to-przyszlosc-juz-niedlugo,174,0,2409646.html (accessed on 28 November 2021).
- Jawny Lublin Czemu Lublin Inwestuje w Autobusy na Wodór? Available online: https://gazeta.jawnylublin.pl/czemu-lublin-inwestuje-w-autobusy-na-wodor/?utm_source=rss&utm_medium=rss&utm_campaign=czemu-lublin-inwestuje-w-autobusy-na-wodor (accessed on 28 November 2021).
- Toyota Autobus z Wodorowym Napedem Toyoty. Available online: https://www.toyota.pl/articles/2019/autobus-z-wodorowym-napedem-toyoty-zadebiutuje-w-brukseli (accessed on 28 November 2021).
- Kim, H.; Hartmann, N.; Zeller, M.; Luise, R.; Soylu, T. Comparative TCO Analysis of Battery Electric and Hydrogen Fuel Cell Buses for Public Transport System in Small to Midsize Cities. Energies 2021, 14, 4384. [Google Scholar] [CrossRef]
- Pamucar, D.; Iordache, M.; Deveci, M.; Schitea, D.; Iordache, I. A new hybrid fuzzy multi-criteria decision methodology model for prioritizing the alternatives of the hydrogen bus development: A case study from Romania. Int. J. Hydrog. Energy 2021, 46, 29616–29637. [Google Scholar] [CrossRef]
- Hua, T.; Ahluwalia, R.; Eudy, L.; Singer, G.; Jermer, B.; Asselin-Miller, N.; Wessel, S.; Patterson, T.; Marcinkoski, J. Status of hydrogen fuel cell electric buses worldwide. J. Power Sources 2014, 269, 975–993. [Google Scholar] [CrossRef]
- O’Garra, T.; Mourato, S.; Garrity, L.; Schmidt, P.; Beerenwinkel, A.; Altmann, M.; Hart, D.; Graesel, C.; Whitehouse, S. Is the public willing to pay for hydrogen buses? A comparative study of preferences in four cities. Energy Policy 2007, 35, 3630–3642. [Google Scholar] [CrossRef]
Publisher’s Note: MDPI stays neutral with regard to jurisdictional claims in published maps and institutional affiliations. |
© 2022 by the authors. Licensee MDPI, Basel, Switzerland. This article is an open access article distributed under the terms and conditions of the Creative Commons Attribution (CC BY) license (https://creativecommons.org/licenses/by/4.0/).