1. Introduction
The paper defines an agile power system as a system whose physical structure can change due to the connection/disconnection of subsystems such as microgrids. With the integration of renewable resources into the power system, the flexibility of the grid is defined as the capability of the system to provide the demand [
1] by utilizing these resources. These systems face serious difficulties in their operation and control. An overview of these challenges is presented in this paper. The control of such systems is essential for their operation. It needs to take into account or take advantage of the newly available computing and communication technologies. The handling of the physical constraints and the large amount of data available will require novel control design methodologies and rules of operation. Topics that will be of interest in addressing some of these concerns include, but are not limited to:
Data driven control;
Artificial Intelligent system control;
Multi-agent Control;
Hierarchical and Decentralized Control;
Control of Interconnected Smart Grids.
There are many challenging control problems, such as low inertia issues [
2] and voltage control. These two problems are addressed here.
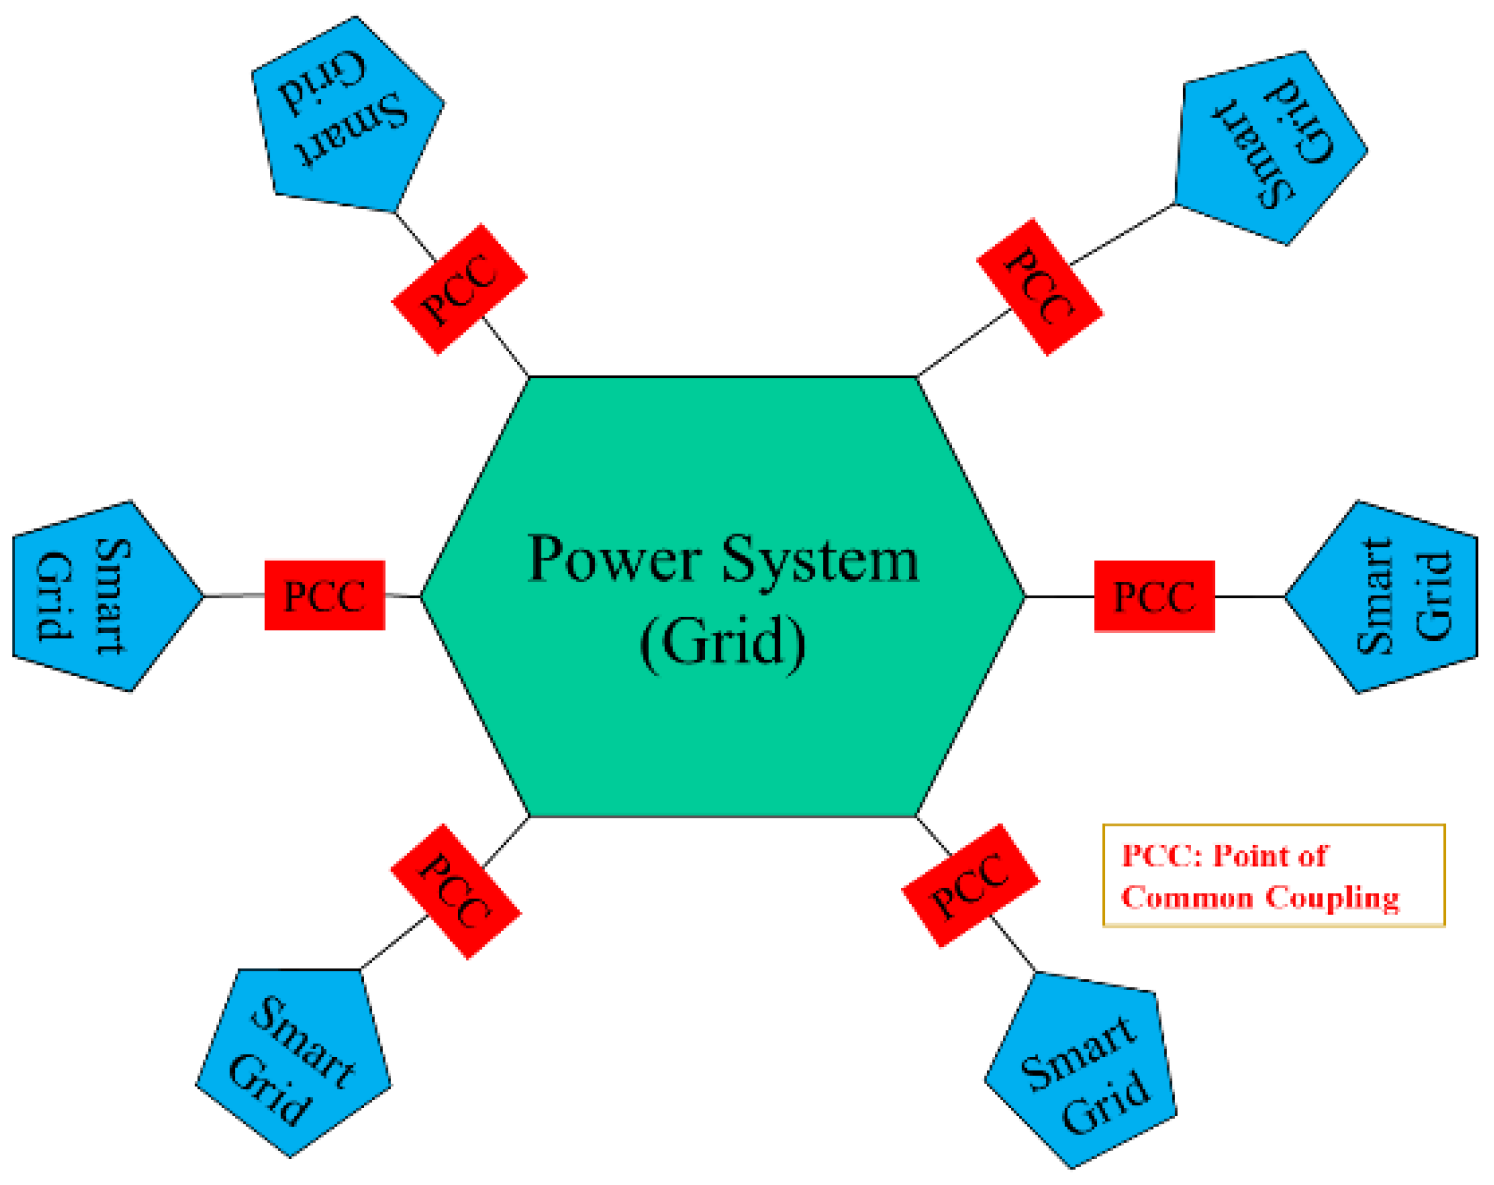
A flexible or agile system, illustrated in
Figure 1, is a system that comprises the main grid to which other subsystems such as microgrids or electric vehicles or storage can “come and go” due to several factors including weather, cyber or physical attacks, resource availability or depletion, or malfunctions. It can be one agile “grid” or multiple islanded smaller grids or microgrids, with the possibility of morphing back into the agile system. The abundant amount of information provided by the communication infrastructure can be utilized to improve the control and operation of these systems.
The paper is organized as follows. In
Section 2, following this brief introduction, an overview of the challenges facing agile systems is presented. In
Section 3, an operation problem that is affected by the interconnection of microgrids with low inertia is the energy balance or the load frequency control problem. The objective of this section is to demonstrate that new rules of operation and interconnection might be needed. In
Section 4, the voltage control design in microgrids or other subsystems in the agile system is presented. Both decentralized and data-driven voltage control approaches are proposed that take into consideration the usage of the large amount of data provided by the proliferation of sensors throughout the system due to their decreasing costs.
3. Effect of Inertia on the Load Frequency Control Problem
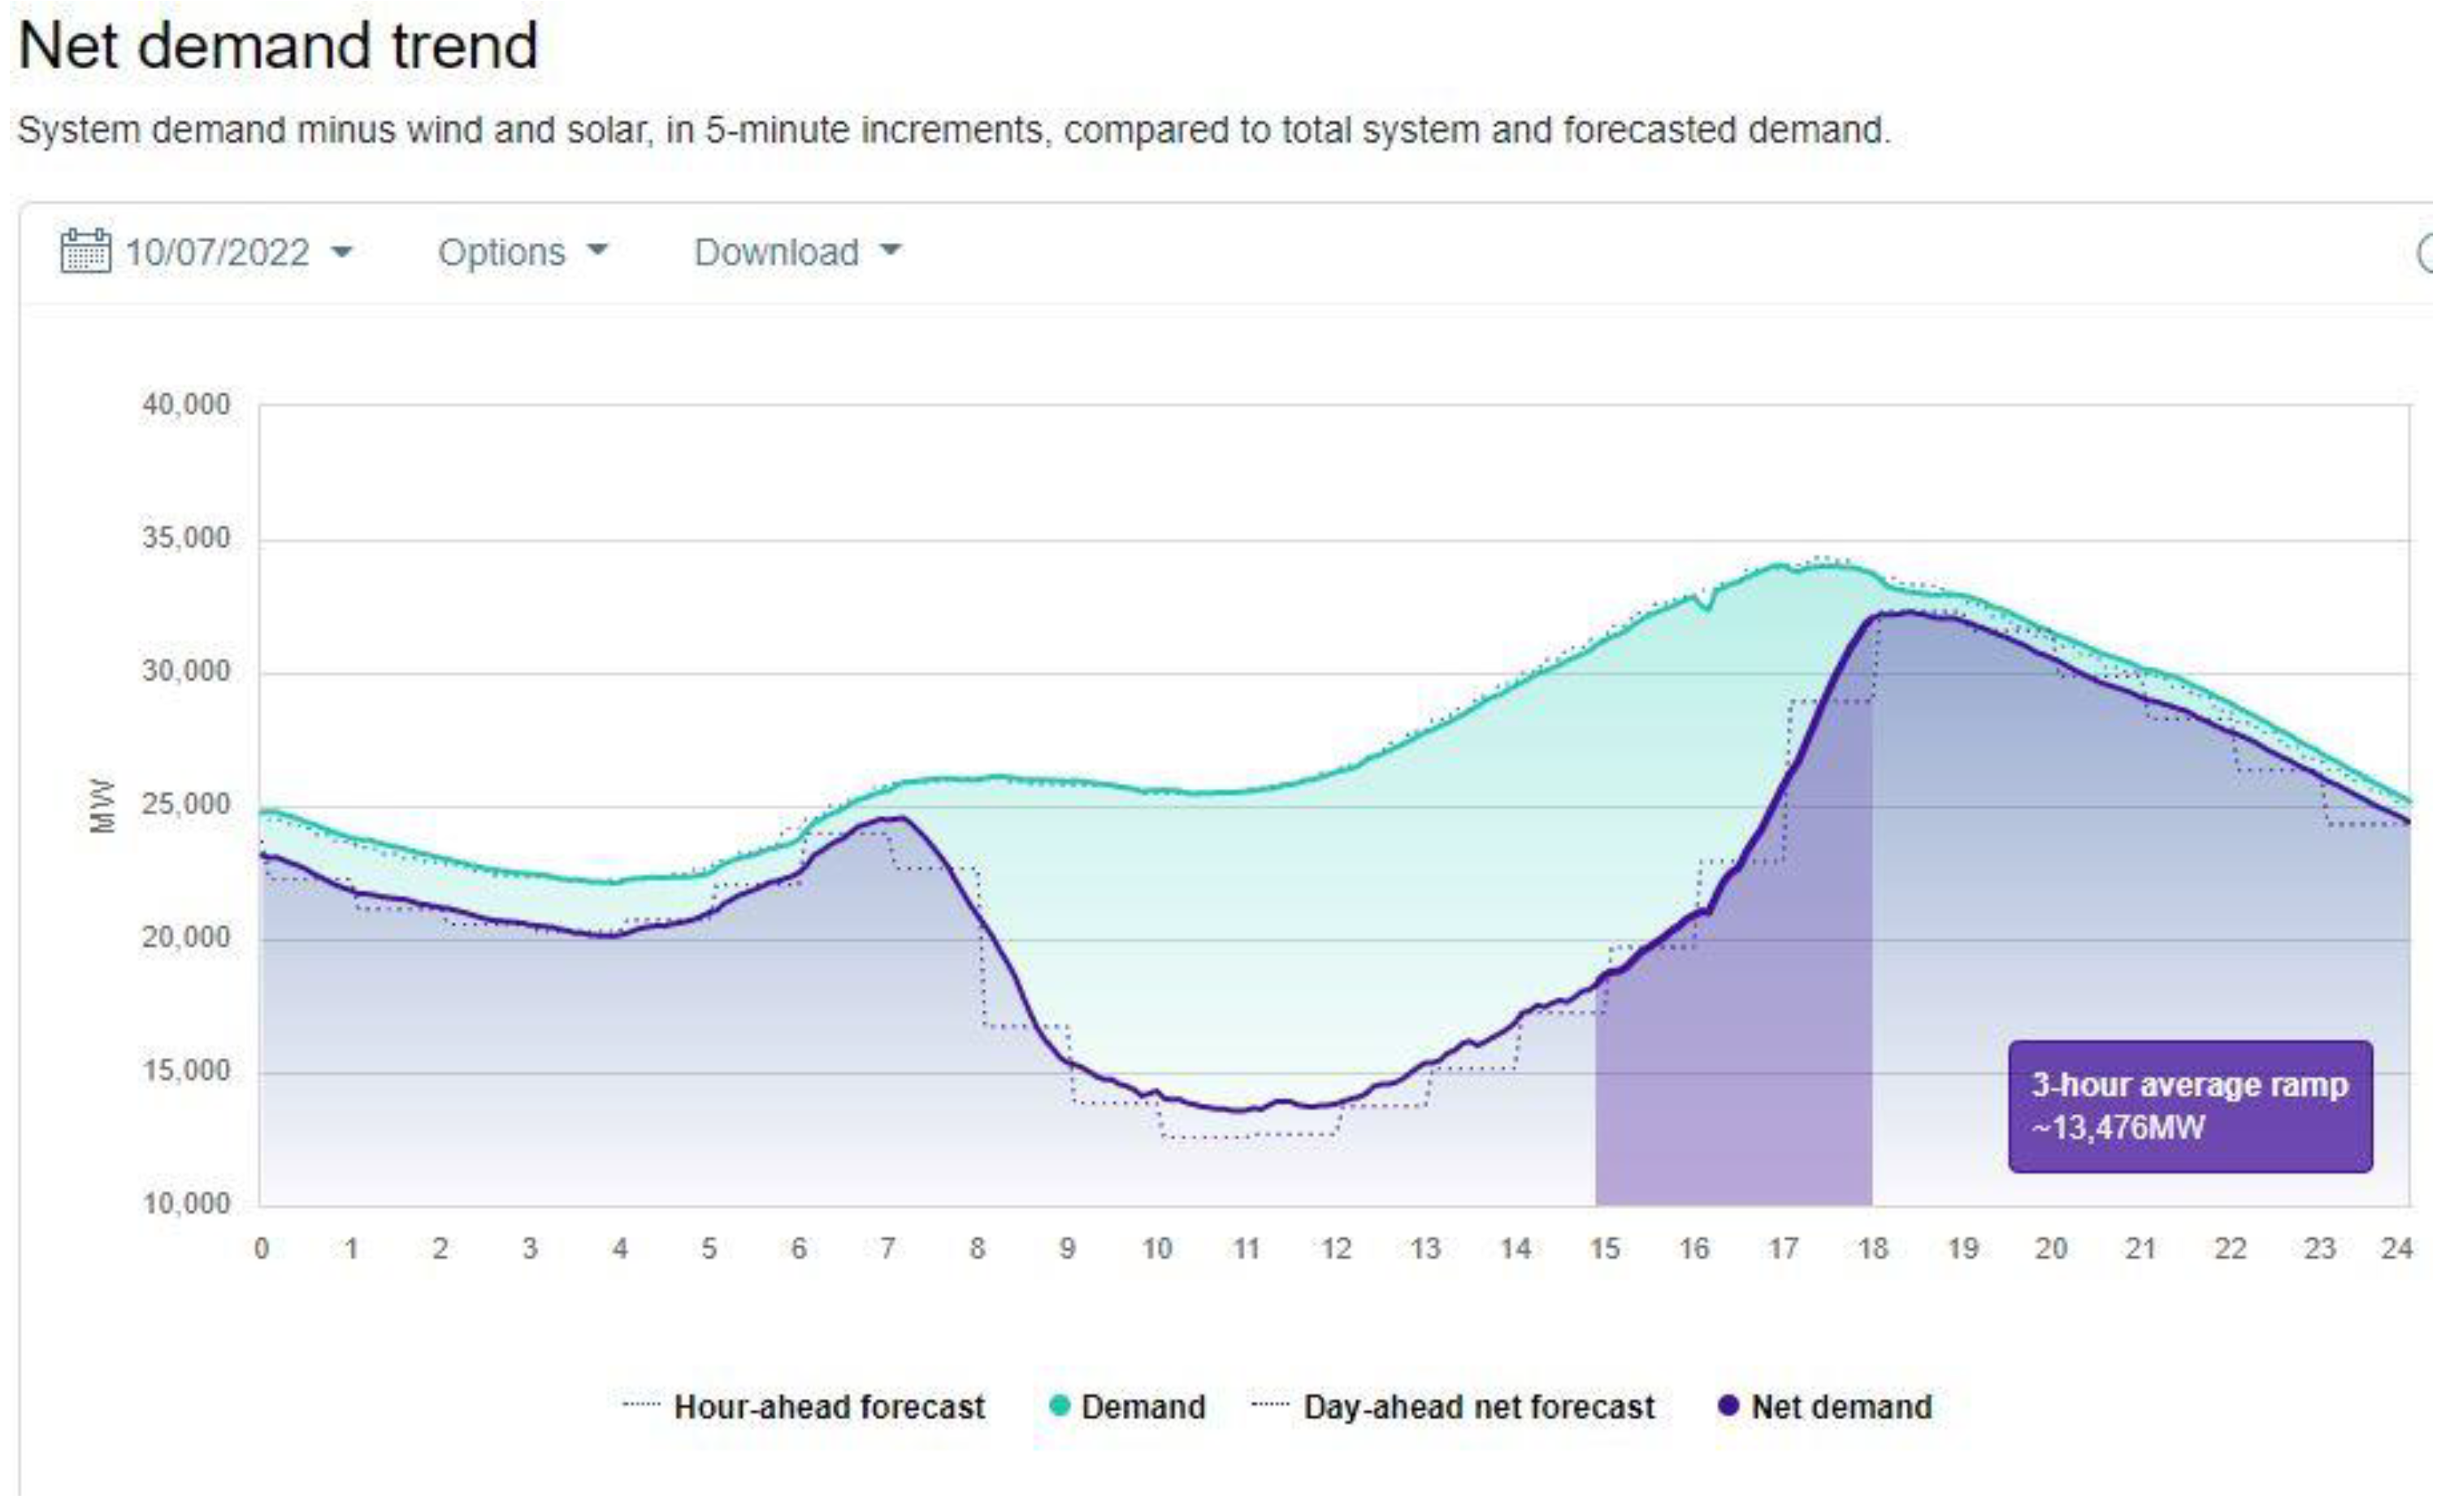
The proliferation of inverter-based renewable generation resources, as sketched in
Figure 4, results in low-inertia systems. The control and management of the system including stability and load frequency control are challenging [
9,
10,
11,
12,
13,
14].
Specifically, for the load frequency control problem the systems analyzed have either two control-areas as shown in
Figure 5 or three control-areas. For the two-area system, the areas are classified as Red or Green Areas. These colors are adapted in the figures; red for Area 1 and green for Area 2. The purple color is also used to represent the interchange tie-line power. The tie-line power is a line that connect the control areas and the power flow on this line is preset, based on an agreement between the areas.
A Simulink model of a typical control area is shown in
Figure 6.
Four cases are analyzed to demonstrate the effect of low inertia, each of them with the presence, or a lack of, an area with limited large synchronous generators. In Case 1, Area 1 (Red Area) has a large inertia and Area 2 (Green Area) has a small inertia. In Case 2, both areas have similar inertias. In the second case, the data of Area 3 (Blue Area) in the Table below are used for Area 2. The scenario under study is the effect of a 10% load increase in Area 1. In Cases 3 and 4, a third area (Blue Area) is added. The data used in the simulation are provided in
Table 1.
Figure 7a shows that the frequency deviations, are unstable in both areas, while the frequency goes back to its nominal value for Case 2, as shown in
Figure 7b.
Similarly, the area control errors one and two (ACE 1 and ACE 2) for the two case studies are shown in
Figure 8a,b. In Case 1, the area control errors do not return to their pre-fault values, i.e., they do not go back to zero following the disturbance, while in Case 2 the results are as expected and show that the energy balance is restored in both areas.
The Area Control Error for area (
i) is defined [
15] as follows:
where
is the deviation from the nominal value of the power flow over the tie-line connecting area
i to area
j,
is a bias or the frequency characteristic of area
i, and
is the deviation from the nominal value of the frequency in area
i. To illustrate the issues associated with low inertia, a simple decentralized proportional-integral controller is designed:
Figure 9 shows the deviation in the power exchange between the areas
For Case 1 (
Figure 9a), the tie-line power deviation is unstable while for Case 2 (
Figure 9b) the tie-line power goes back to its scheduled value.
Finally, the incremental mechanical power outputs of both areas are shown in
Figure 10.
Figure 10a shows that the mechanical power deviations do not reach zero for Case 1, while in
Figure 10b the mechanical power deviation in area 2 falls zero since the disturbance is in Area 1.
The challenge then is to reconsider the expectations when different-sized or inertia systems are interconnected. Traditional measures and expectations for the area frequency errors and control areas statistics need to be revisited, challenging the existing compliance performance measures set by NERC [
16]. In this particular case 1 scenario, the solution might be to separate the two areas and each area will be constrained to satisfy its own energy balance. In the case where a microgrid is a DC microgrid, an expensive DC link might be needed to connect it to the system and the frequency control problem will not be an issue.
To analyze this problem further, a third area is added to the previous model using the data provided in
Table 1. The following two cases are analyzed: Case 3 uses three areas, Area 1, Area 2 and Area 3 data. Area 2 is the small area. Case 4 uses the three areas, but Area 2 is replaced by the data of Area 3. In Case 3, Area 2 has a small inertia compared to the other two areas. The results obtained are similar to the ones observed for the two-area system. Case 4, where all areas are similar in size, the system is stable; however, Case 3 is unstable. The simulation is performed when a 0.1 pu load increase affects Area 1.
Figure 11 shows the frequency deviations in all three areas. In
Figure 11a, the frequencies are unstable due to the low inertia area, while in
Figure 11b, with all the three areas of comparable inertia, the frequency deviations return to zero.
Figure 12,
Figure 13 and
Figure 14 show the frequency deviations in all areas, the area control errors, the tie-line power deviations and the mechanical power changes, respectively.
Figure 12 shows the three control-area errors ACE1, ACE2 and ACE3. In
Figure 12a, these errors are unstable due to the presence of a low inertia control area, while
Figure 12b, with the three areas of comparable size, the three control-area errors return to zero.
Figure 13 shows the tie-line power deviations
In
Figure 13a, for Case 3, these deviations are unstable, meaning that the power exchanges between areas are increasing. However, in
Figure 13b, corresponding to Case 4, the three areas are helping each other during the disturbance by sending power to the area that is in difficulty, which is area 1 that has an increase in power demand. After area 1 has increased its own generation, the tie-line powers return to their scheduled values.
Figure 14 shows mechanical power deviations following the disturbance. This corresponds to the change in generation output in the three areas. In
Figure 14a, for Case 3, these deviations are unstable, meaning that the generated power in all three areas is increasing. However, in
Figure 14b, corresponding to Case 4, the three areas help each other during the disturbance by generating power and sending it to the distressed area, which is area 1 that faces an increase in power demand. After area 1 has increased its own generation, the other two areas reset their output to their scheduled levels and only Area produces additional power to supply its new demand.
In this section, an issue is raised when operating a system that includes small control areas with small inertias. If these small areas are to be considered as contributors to the load frequency control problem, then the interconnection rules need to reflect these new scenarios.
4. Decentralized and Data-Driven Voltage Controls of Microgrids
The integration of numerous renewable resources to the power system via inverters provides high flexibility along with a complexity in solving the voltage control problem [
9]. In this section, decentralized and data-driven-based voltage controllers are developed and compared. It is shown that the performance measures will be improved by incorporating a data-driven-based voltage controller, however, it also leads to the possibility of various types of data failures and cyber-attacks to the infrastructure of the microgrid communication layer [
17,
18,
19].
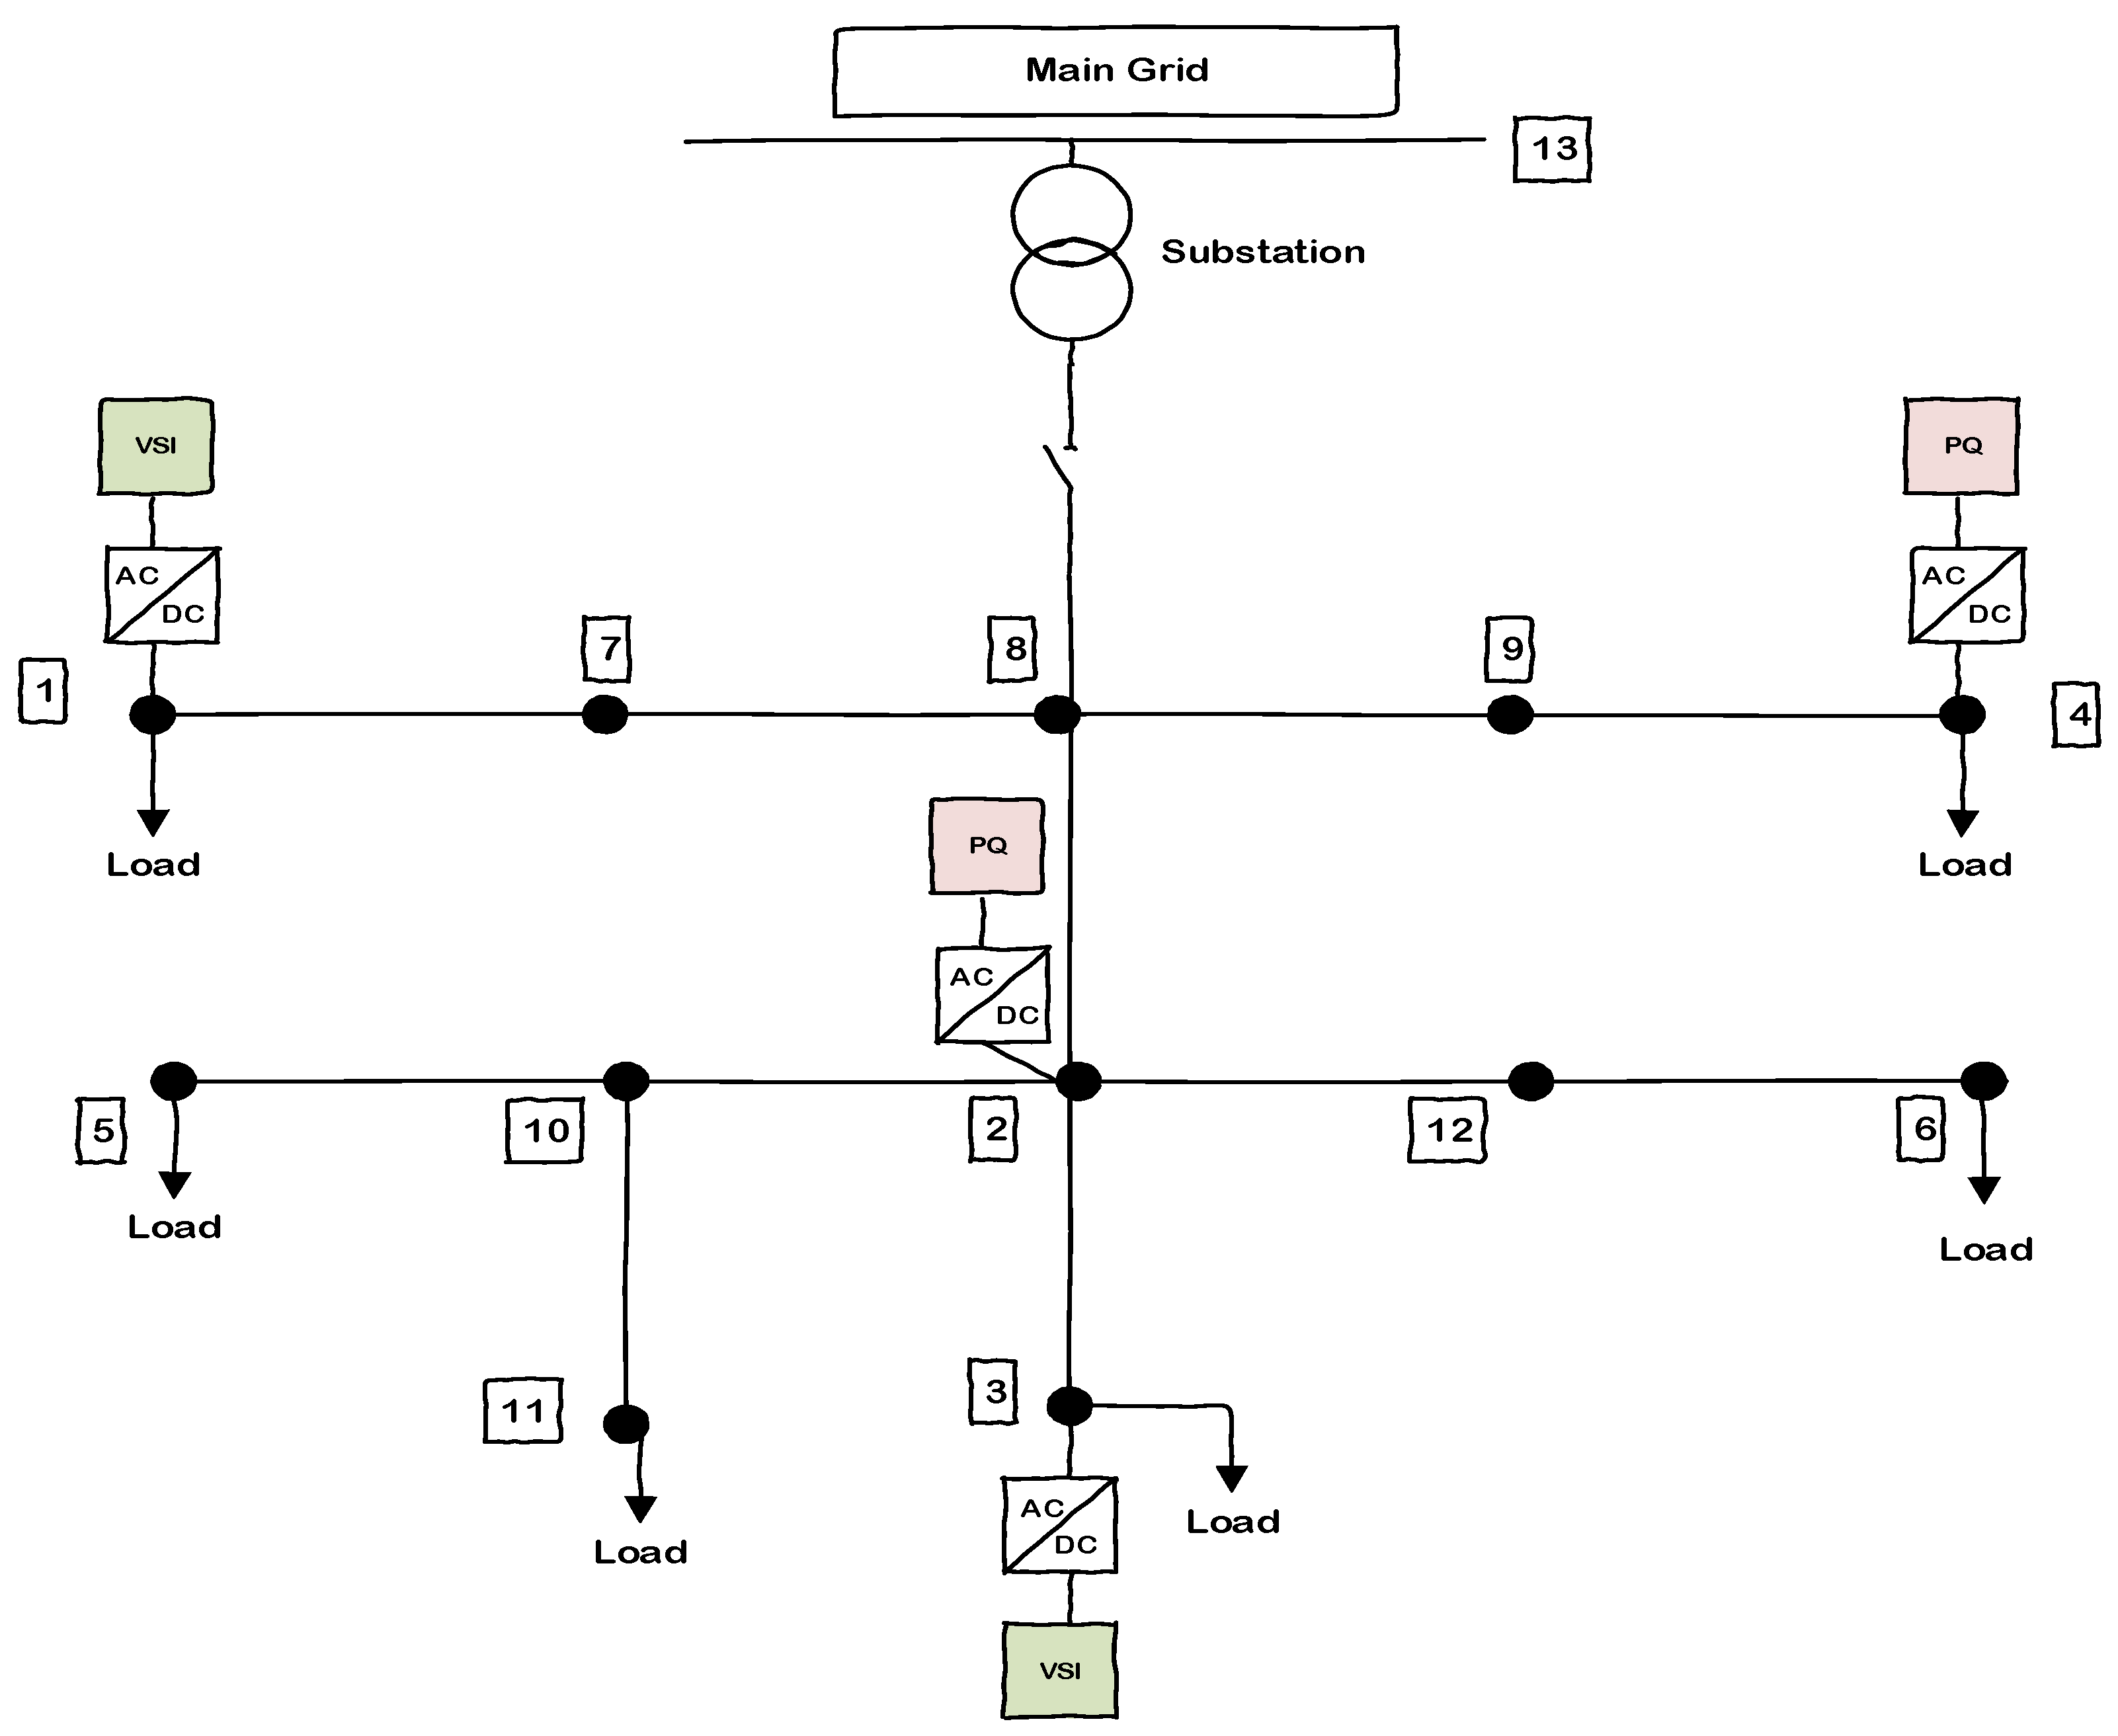
For illustration, a data-driven controller (secondary voltage control) is designed for a 12-bus test system, as shown in
Figure 15. This system has four inverters connected to buses 1–4, where two of them operate in a Voltage Source Inverter (VSI) mode and the other two are controlled as PQ inverters. Regardless of the chosen secondary voltage control method, the voltage will be controlled by the VSI inverters. In other words, VSI inverters act as the actuators of this control system [
10].
In order to discuss the details of the data-driven voltage control method, first, a brief background on the Average Consensus Algorithm (ACA) is provided. Then, the operation of the utilized microgrid with and without the ACA algorithm for the purpose of voltage control is investigated. Finally, the fragilities related to any data-driven control algorithm are discussed. The ACA method, which is implemented as a data-driven approach, is evaluated under some of those weaknesses.
4.1. Background on the Average Consensus Algorithm
In the data-driven voltage control, a multi agent scheme is required where each agent communicates its data to other agents in order to reach a consensus and makes the appropriate control decision. The dynamics of those agents are given in Equation (3) and the applied consensus protocol is described by Equation (4) [
20]. In these equations,
,
, and
represent the control input, the state variables, and the components of the updating (adjacency) matrix, A = [
], respectively [
20].
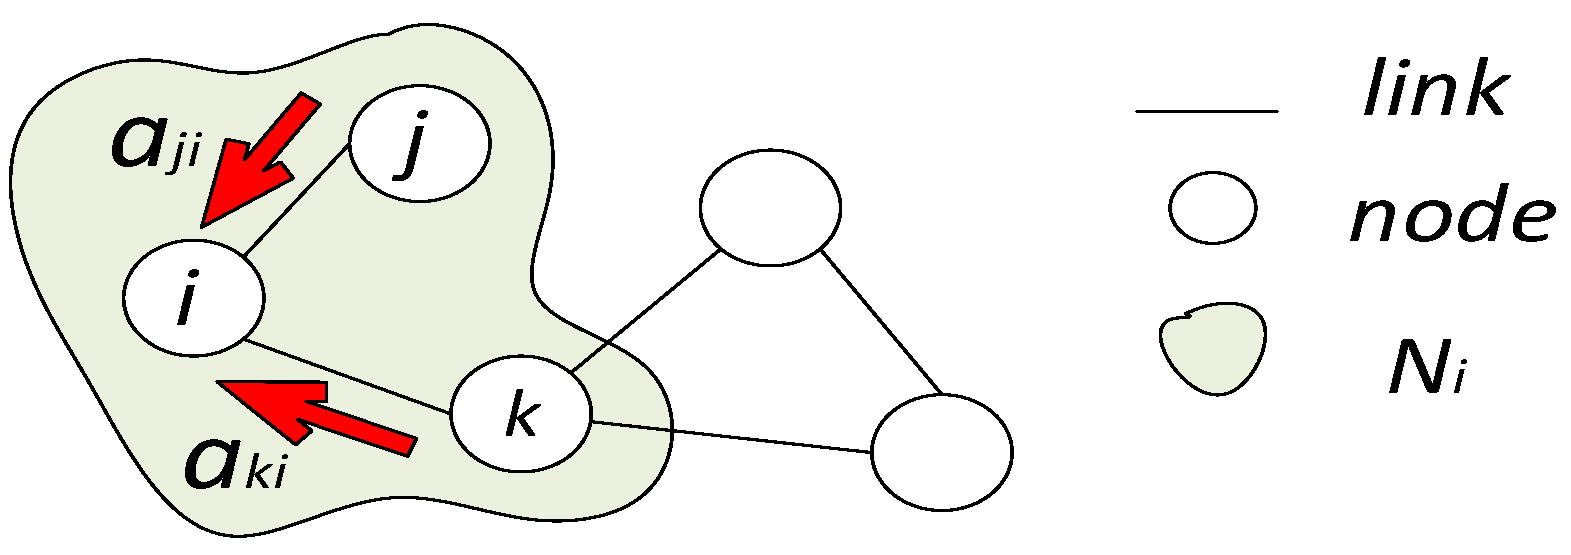
Figure 16 illustrates the definition of the neighbors of node i and the elements of the adjacency matrix such as
and
.
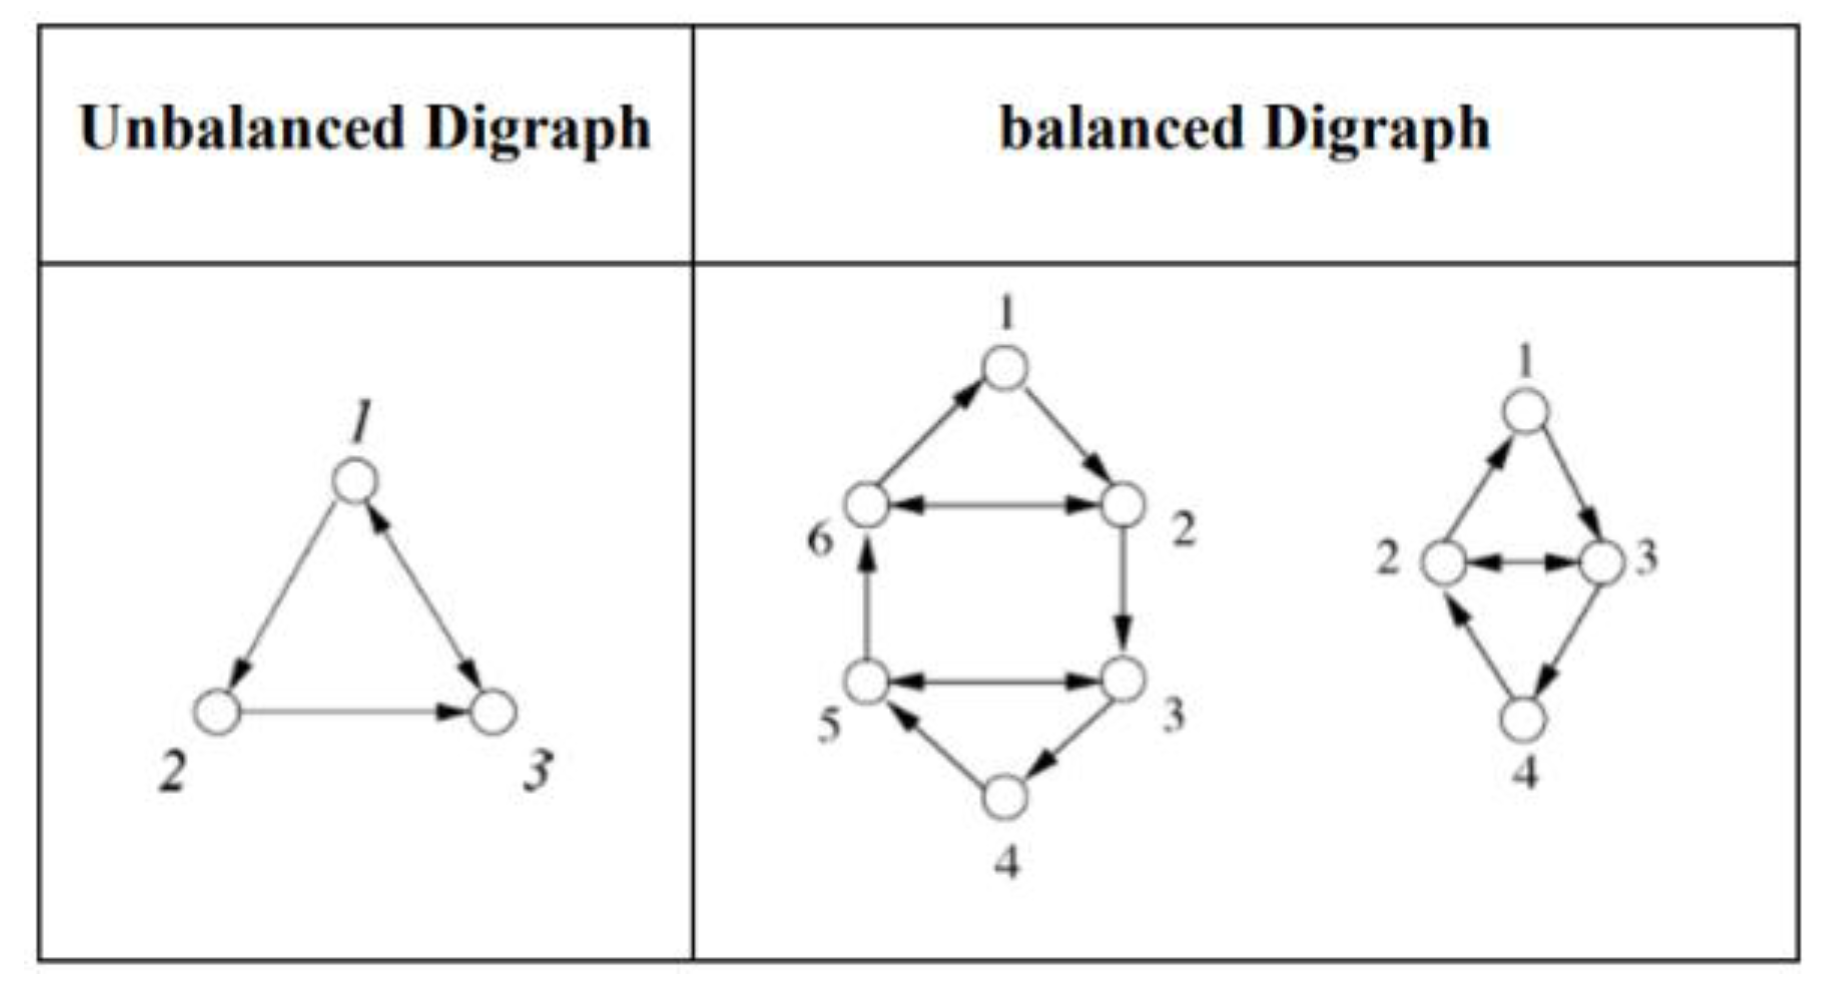
In the average consensus algorithm, reaching an agreement is possible only if the directed graph of agents (also called digraph) is both Balanced and Strongly Connected (SC). A balanced node in a network refers to a node which has equal out-degree and in-degree. If all the nodes included in that network are balanced, the digraph is called balanced. A strongly connected network on the other hand refers to a network in which every node is reachable from every other node through a path with proper direction.
Having a strongly connected digraph ensures an agreement between the agents. However, this group decision value is not necessarily equivalent to the average of the node’s initial data. To achieve the average consensus, where the correct average value is the result of the agreement process, the digraph needs to be balanced as well as strongly connected. Here in
Figure 17, examples of balanced and unbalanced digraphs are shown.
4.2. Optimum Network Structure and Proper Implementation of the ACA
A data-driven control system uses a network of connected nodes to share data from across the network. The shared data will then be utilized for a consensus agreement problem. To satisfy the required constraint on agreement time delay, specific limits need to be considered while designing the communication network. The first constraint is related to the permissible communication expenses, C
max, and the second one is the essential connectivity requirement, K
min. In [
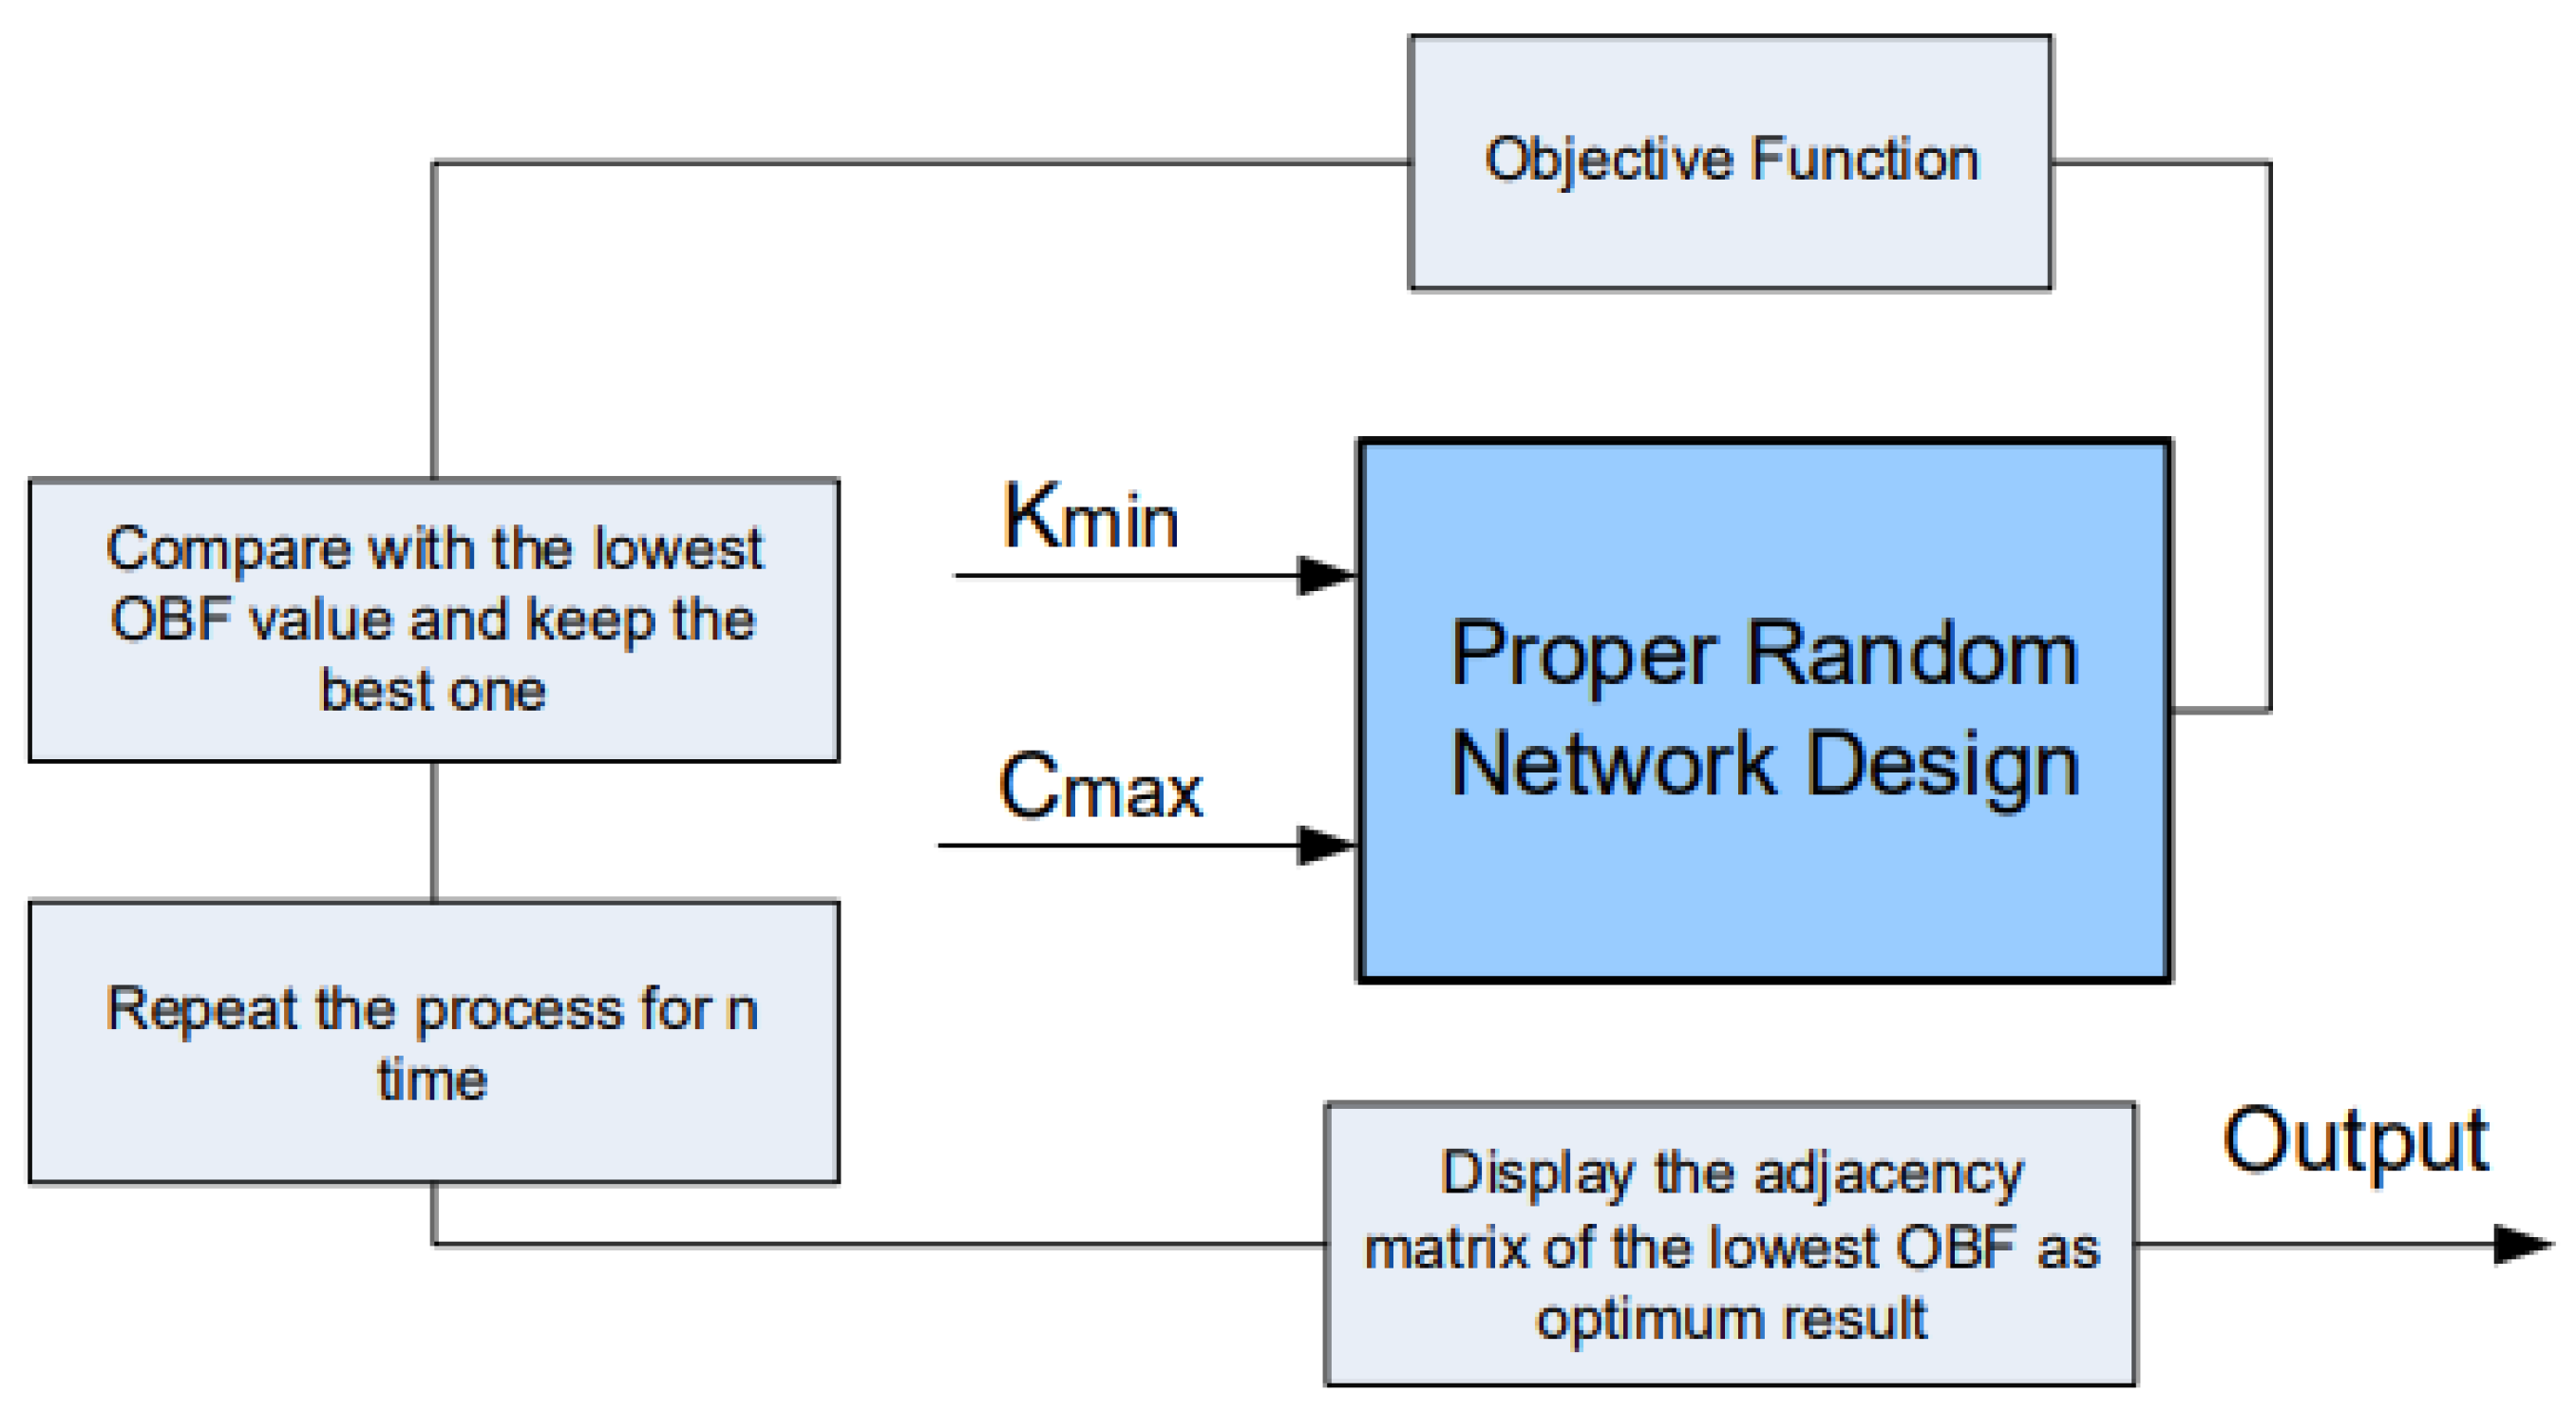
19], an algorithm is suggested for sketching a digraph with n nodes and the optimum number of edges, contingent on the permissible communication expenses, and the essential connectivity requirements. The outlined diagraph will then demonstrate the connections between the nodes and describe the elements of the adjacency matrix only by ones and zeros (zero refers to no communication link). This procedure is shown in
Figure 18, which illustrates the flowchart related to the aforementioned optimum network design.
The next step for the correct implementation of the ACA would be changing those elements of the adjacency matrix which are equal to one into the required updating weight based on various methods listed as updating protocols [
21,
22,
23]. The best updating rule is the one which lessens the length of the agreement time delay. It is worth mentioning that the size of the system does not affect the agreement time of the ACA algorithm. The delay is mostly dependent on the graph structure and the selected adjacency matrix. In order to obtain the highest convergence speed, the adjacency matrix is formed by using the Mean Metropolis matrix [
21].
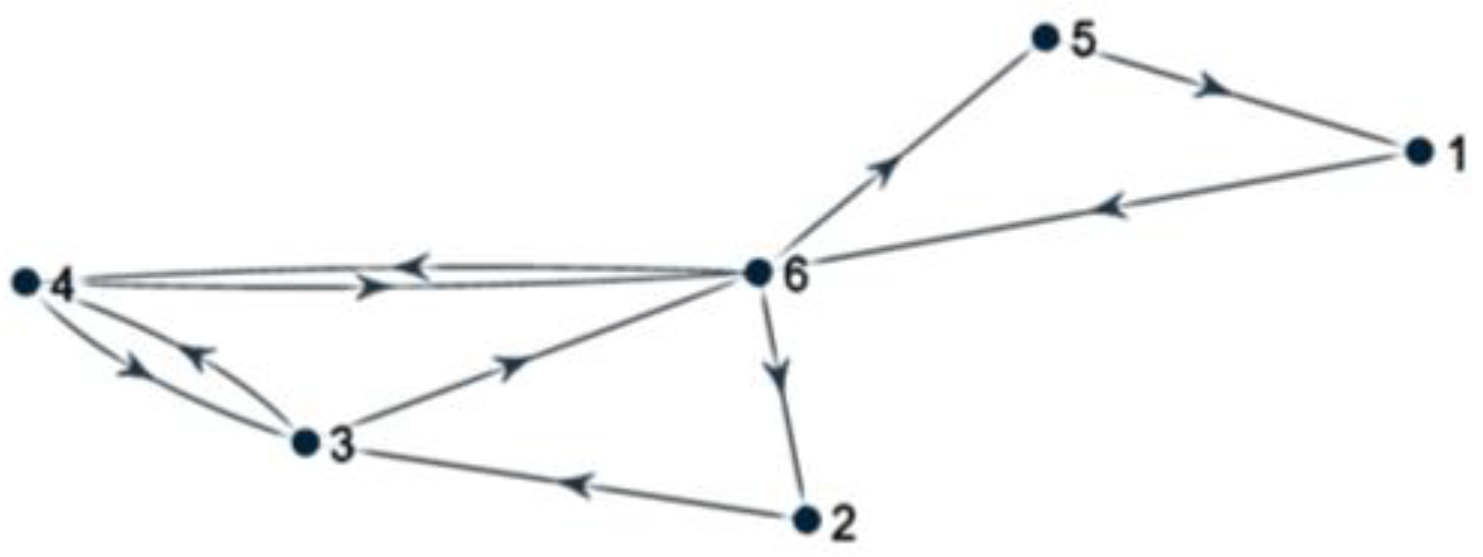
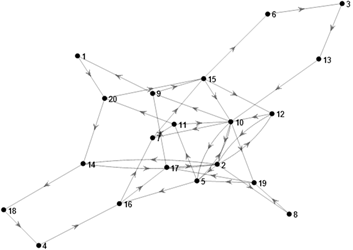
Table 2 describes some of the updating rules along with an illustration of their performance. Based on the illustrated performance in this table, the best rule is selected from the table to be used for the understudied microgrid that has twelve buses, with six of them being pilot buses. Then, an optimum network graph with six nodes is adapted for the understudied microgrid which is shown in
Figure 19, where the graph is both balanced and strongly connected and therefore capable of reaching consensus.
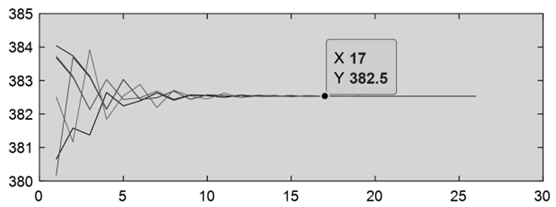
After reaching a decision on the proper updating rule and suitable network graph for the network layer of the microgrid, secondary voltage control is implemented. There are two VSI inverters in this microgrid which are responsible for final actions required for the voltage control. The network of six agents, with each agent located close to one of the critical buses, will provide the opportunity for the nodes to communicate with the neighboring nodes. The data received in each iteration will be then used to update the global consensus value according to the chosen updating rule (which is the mean metropolis weight). After reaching an agreement, the agreed average value will be used by the secondary voltage control of the VSI inverters.
The secondary voltage controller is similar to a traditional droop controller with a major difference. In traditional droop-based secondary voltage control, the VSI inverter will produce active and reactive power until the VSI’s local voltage is back to the predetermined setpoint. In ACA-based secondary voltage control, the set-point is not the local voltage anymore. Instead, the six nodes will agree on the average voltage of the critical buses, and this agreed average voltage value will be used for comparison with the setpoint voltage. Eventually, based on the existing error between the average voltage of critical buses, and the setpoint, proper input for the primary controllers of the VSI will be produced by a PID controller. The primary controllers will then adjust the P (real power) and Q (reactive power) being produced by these inverters. The main benefit of this method is that all critical bus voltages are taken into consideration. Any change in the load can be considered as a disturbance. This load change might be close to VSI controllers; therefore, the VSI will be able to monitor that and adapt quickly. However, if this load change happens in further-away buses, there will not be a major change in the measured voltage by VSI since traditional droop control only uses the local voltage of the VSI inverter and therefore the proper error will not be produced.
4.3. Problem Formulation
This paper compares the operation of a microgrid with and without the discussed data-driven voltage control which is based on the ACA algorithm. The first part shows the effectiveness of the proposed data-driven voltage control method using the ACA for keeping the average voltage of critical buses within desired values no matter how far the bus is from the load change. This data-driven voltage control method provides accuracy and better performance while adding to concerns related to the communication links that are the inevitable part of this data-driven control method. The second part discusses the problem that is related to the delay caused either by the communication channel or agreement process. The third part investigates the issue related to the failure of communication links due to technical malfunction or cyber-attacks [
24,
25,
26].
4.3.1. Normal Operation: Decentralized vs. Data-Driven Voltage Control
There are six critical buses (nodes 1 through 6) in the test system of
Figure 15. The ACA algorithm is applied to control the voltage of these six pilot buses. In a traditional decentralized voltage control, only two of these buses (the ones connected to the VSI inverters) are used to maintain their voltages at a desired level. However, in the data-driven approach, any node that is connected to the network can be considered as a pilot node, which means its voltage must remain within a certain range, even if that bus is far from the VSI inverters.
Figure 20,
Figure 21 and
Figure 22 demonstrate and compare the simulation results related to traditional decentralized and ACA-based voltage control.
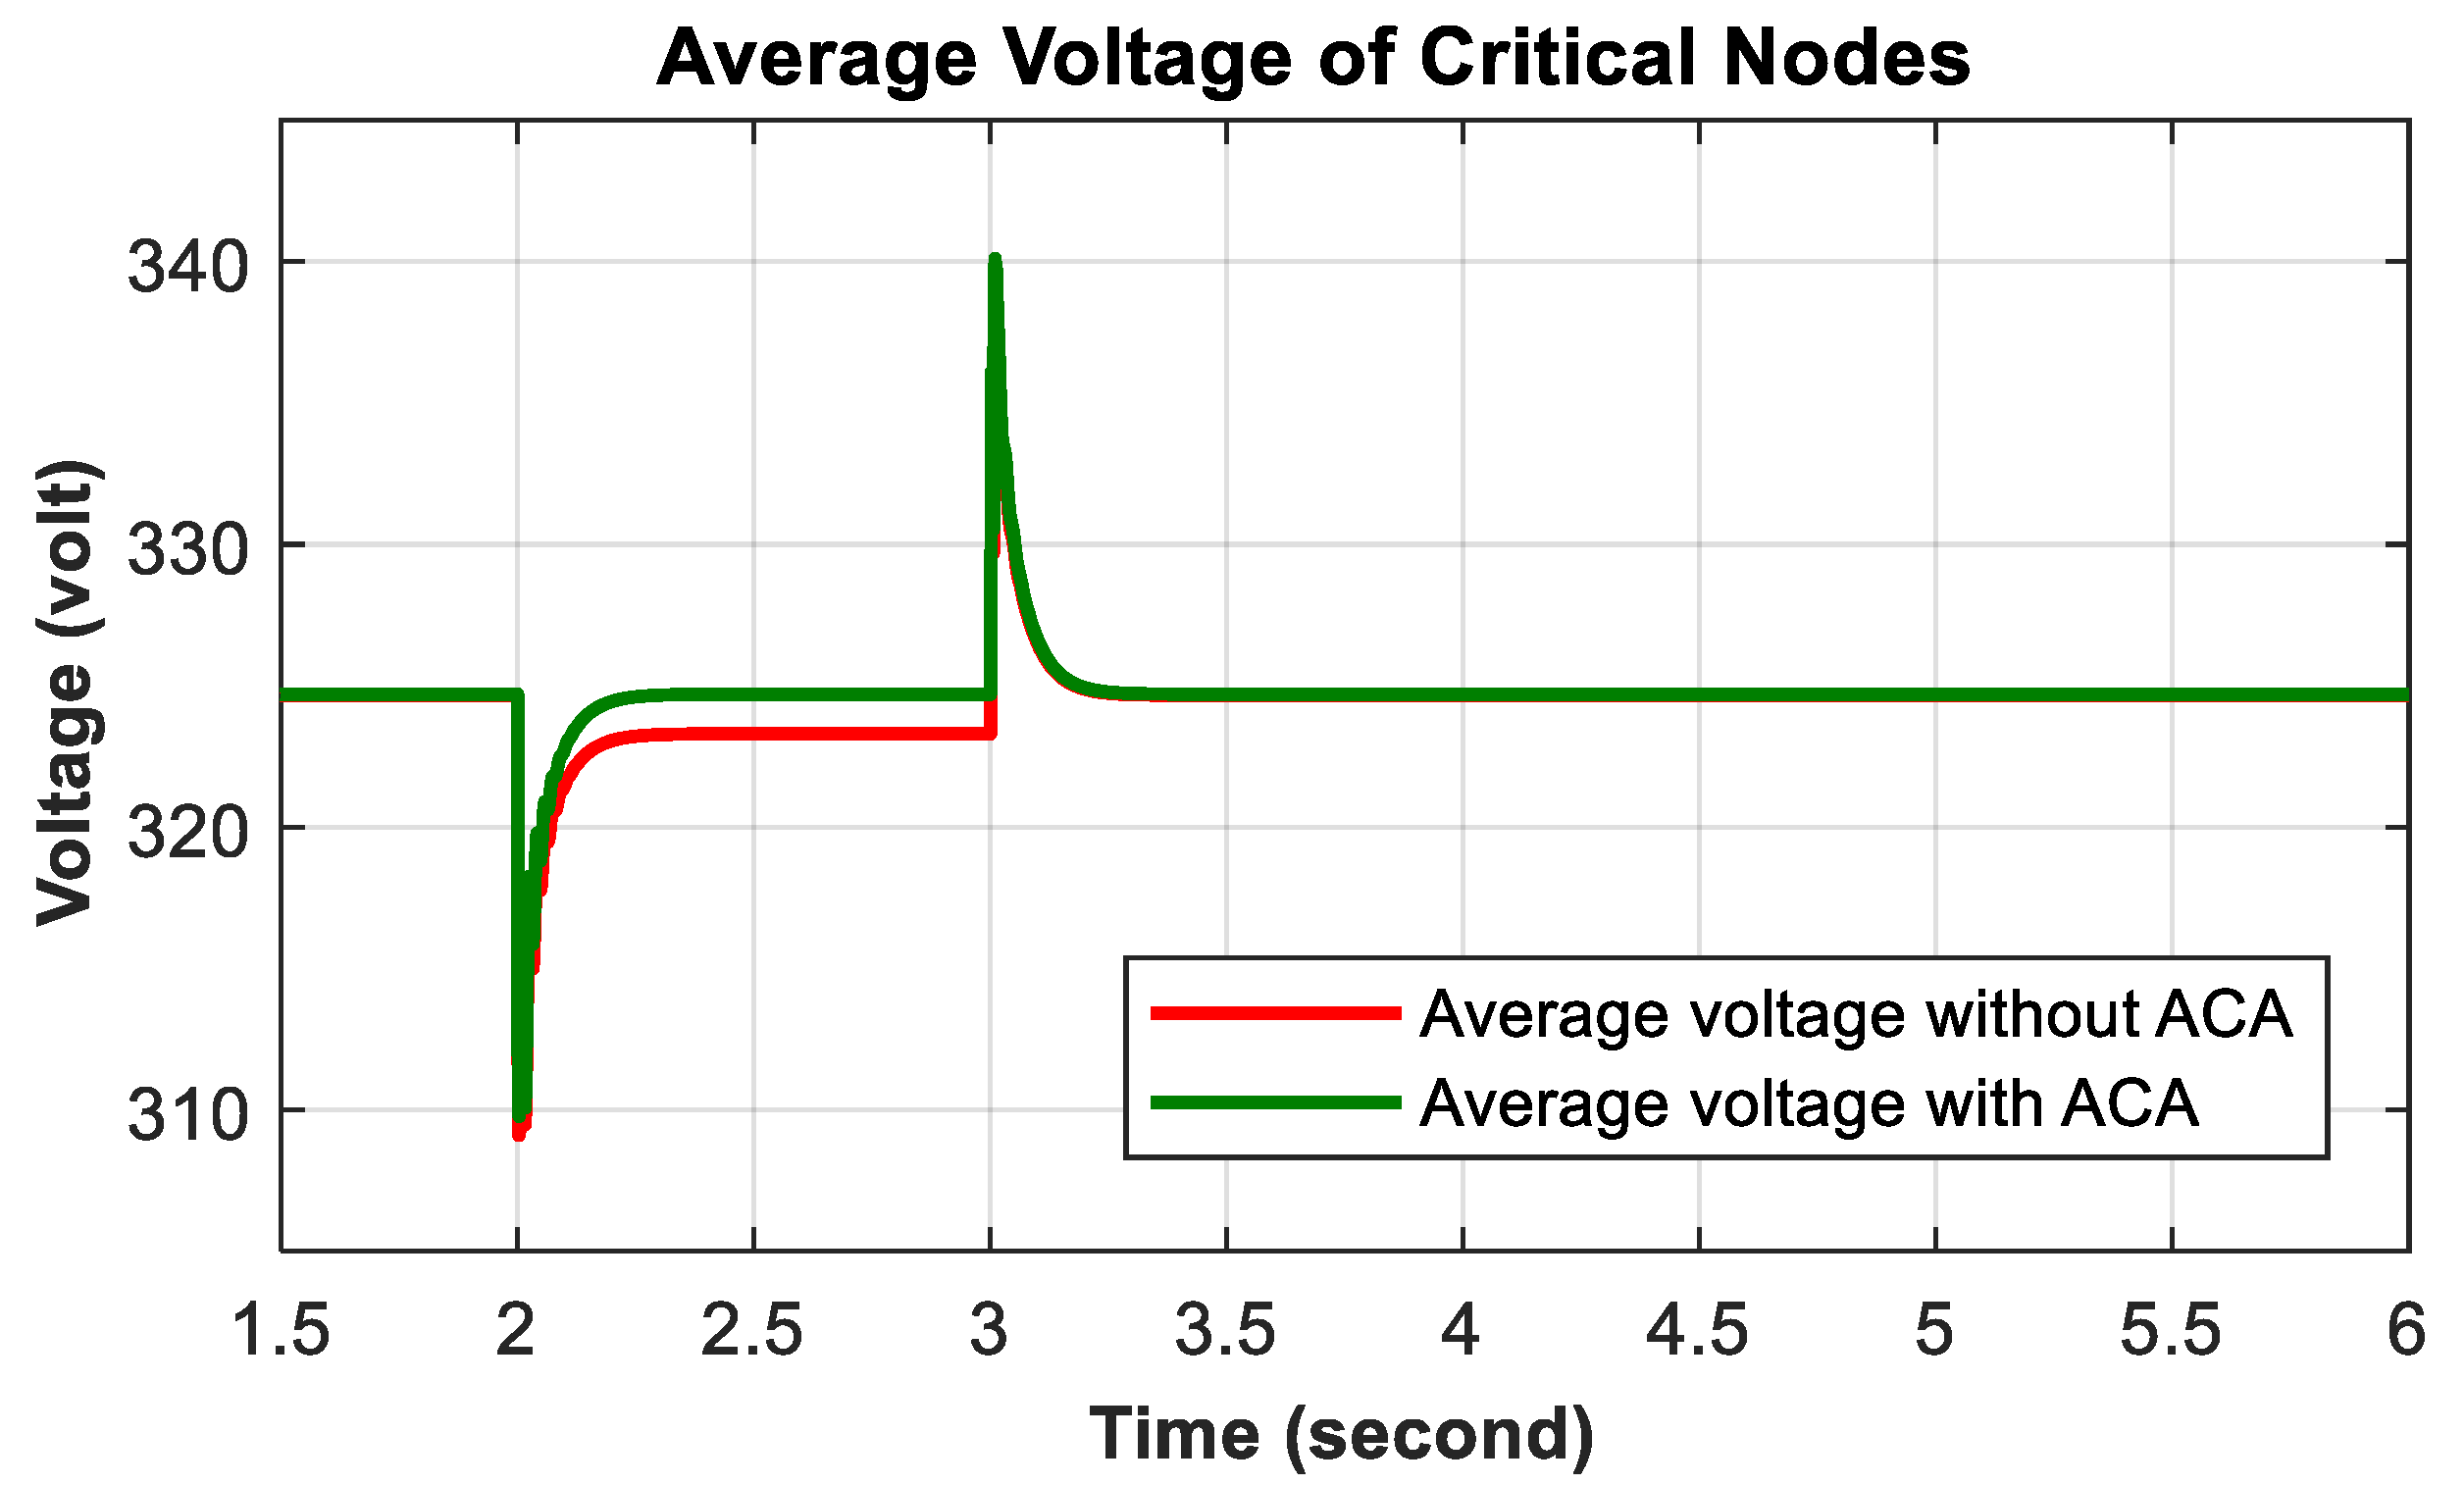
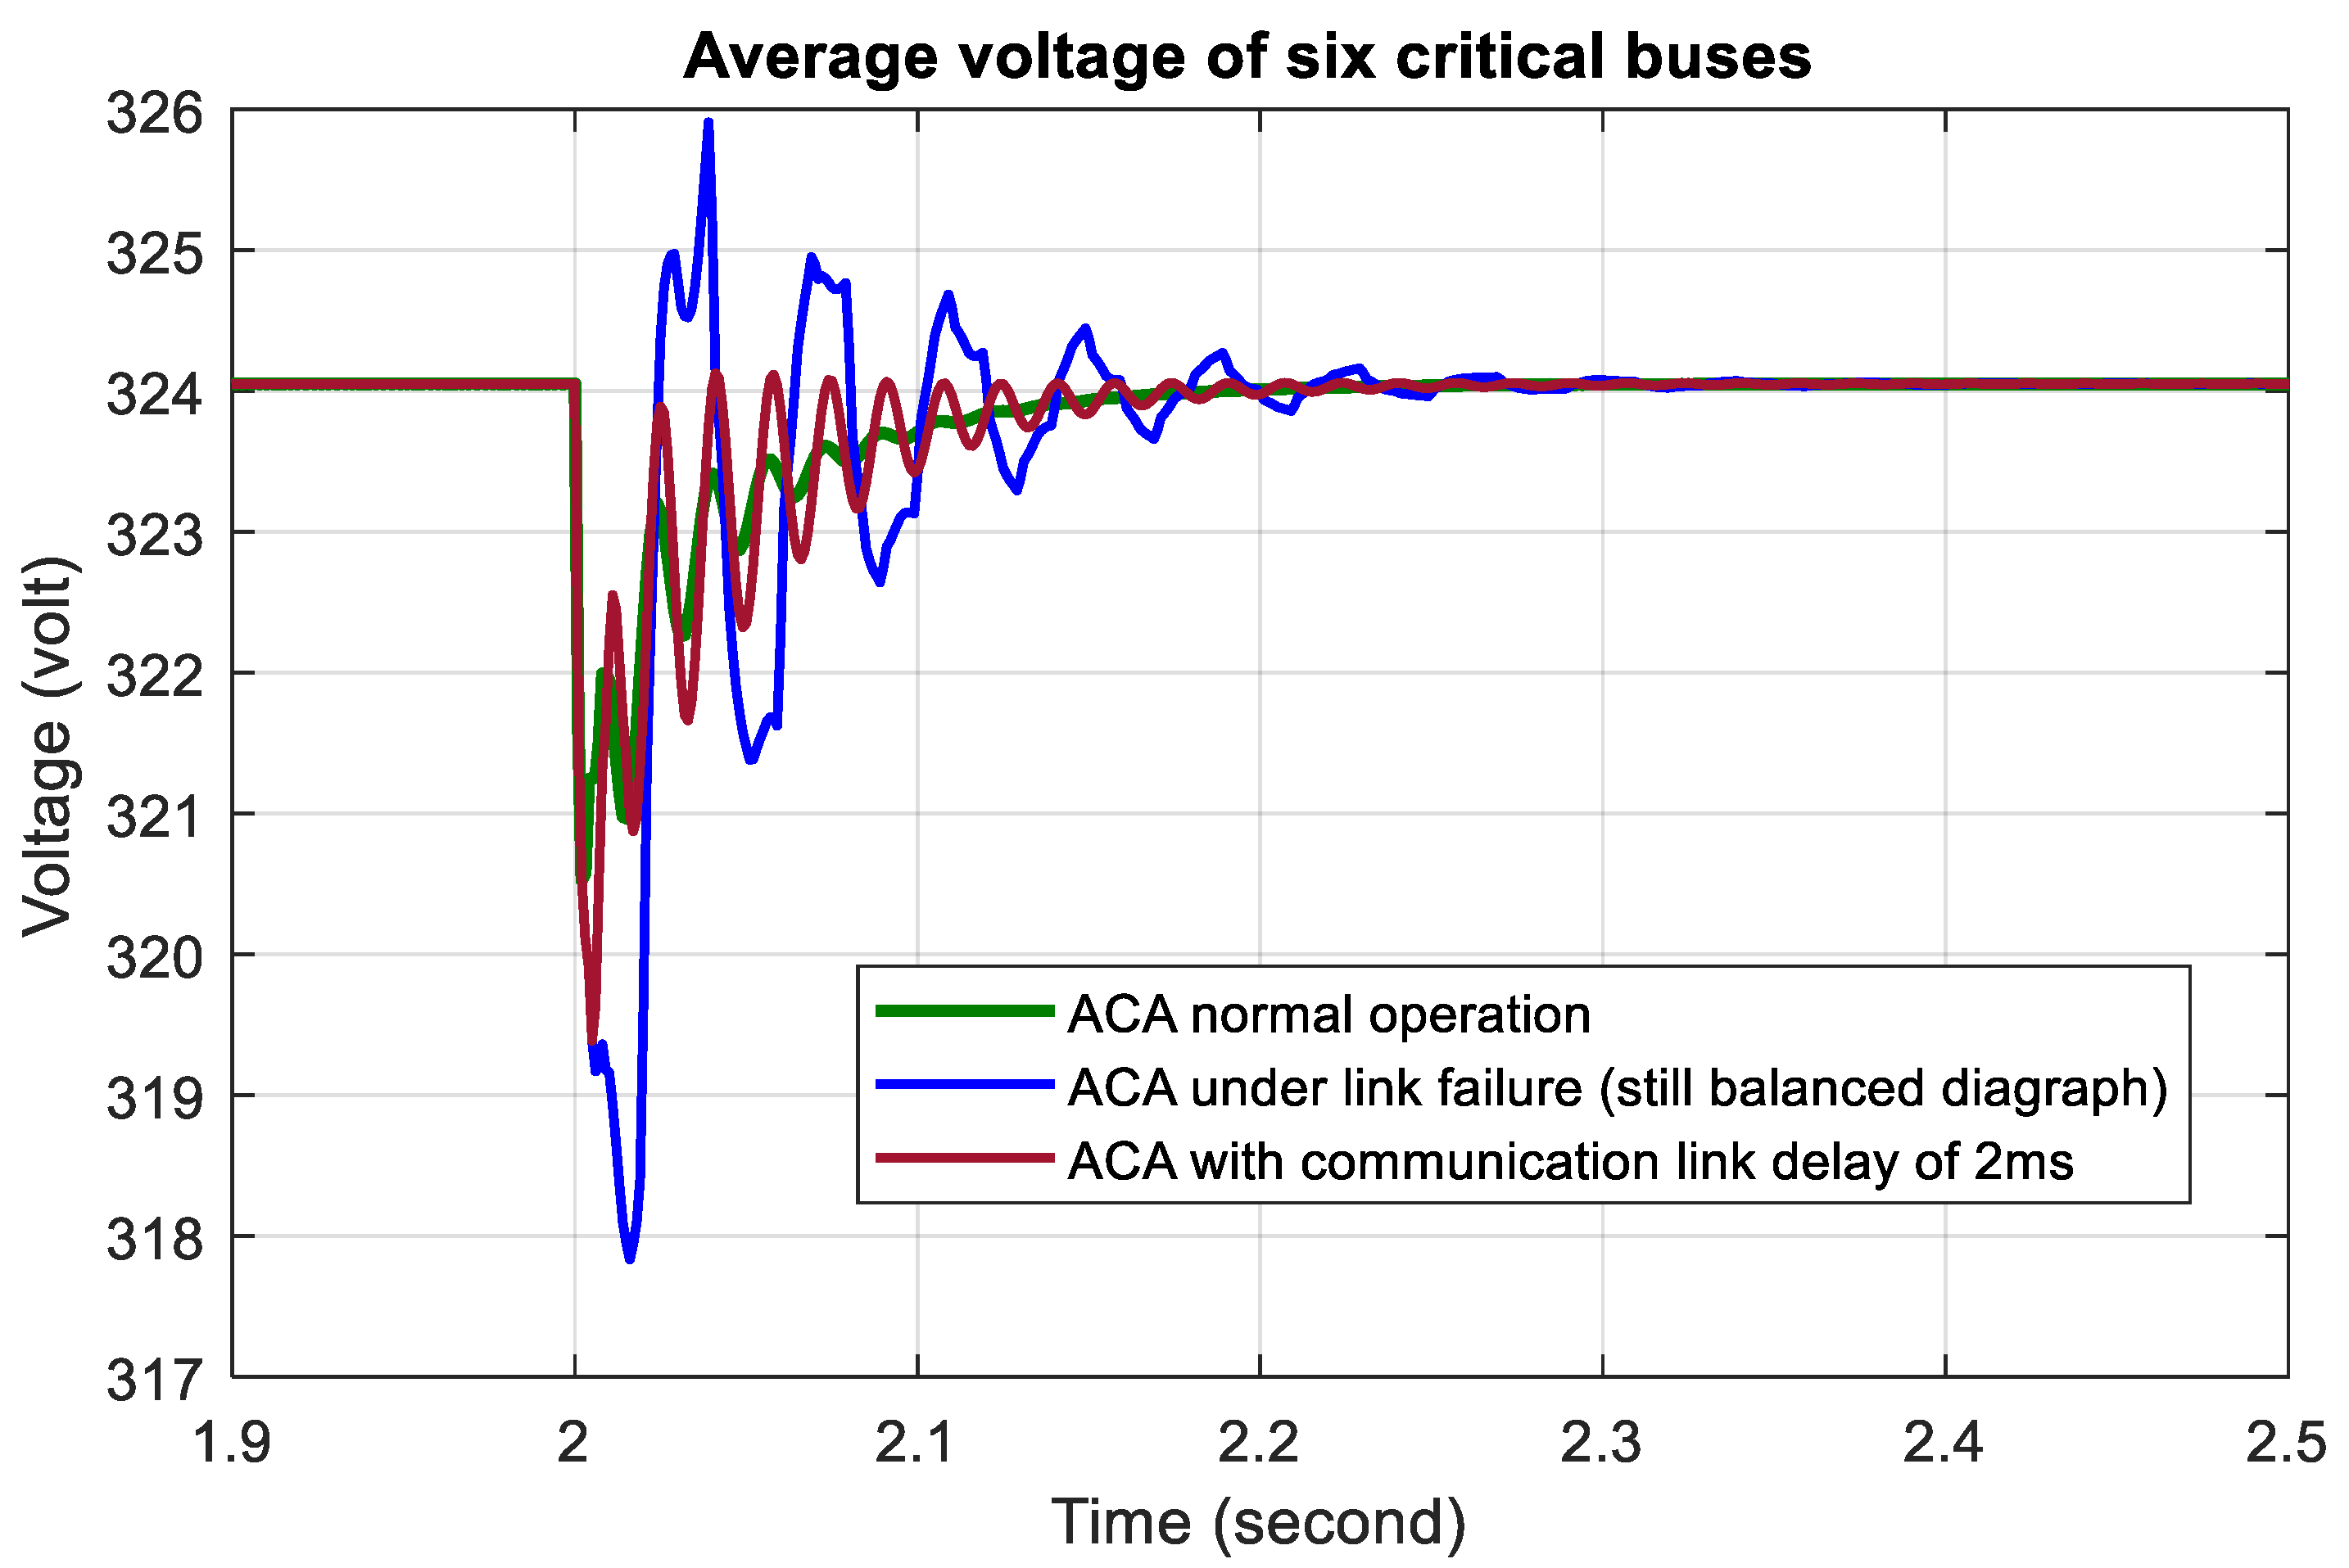
Figure 20 depicts the average voltage of six pilot buses in the presence and absence of ACA. It is confirmed that ACA can keep the average constantly around the selected average setpoint.
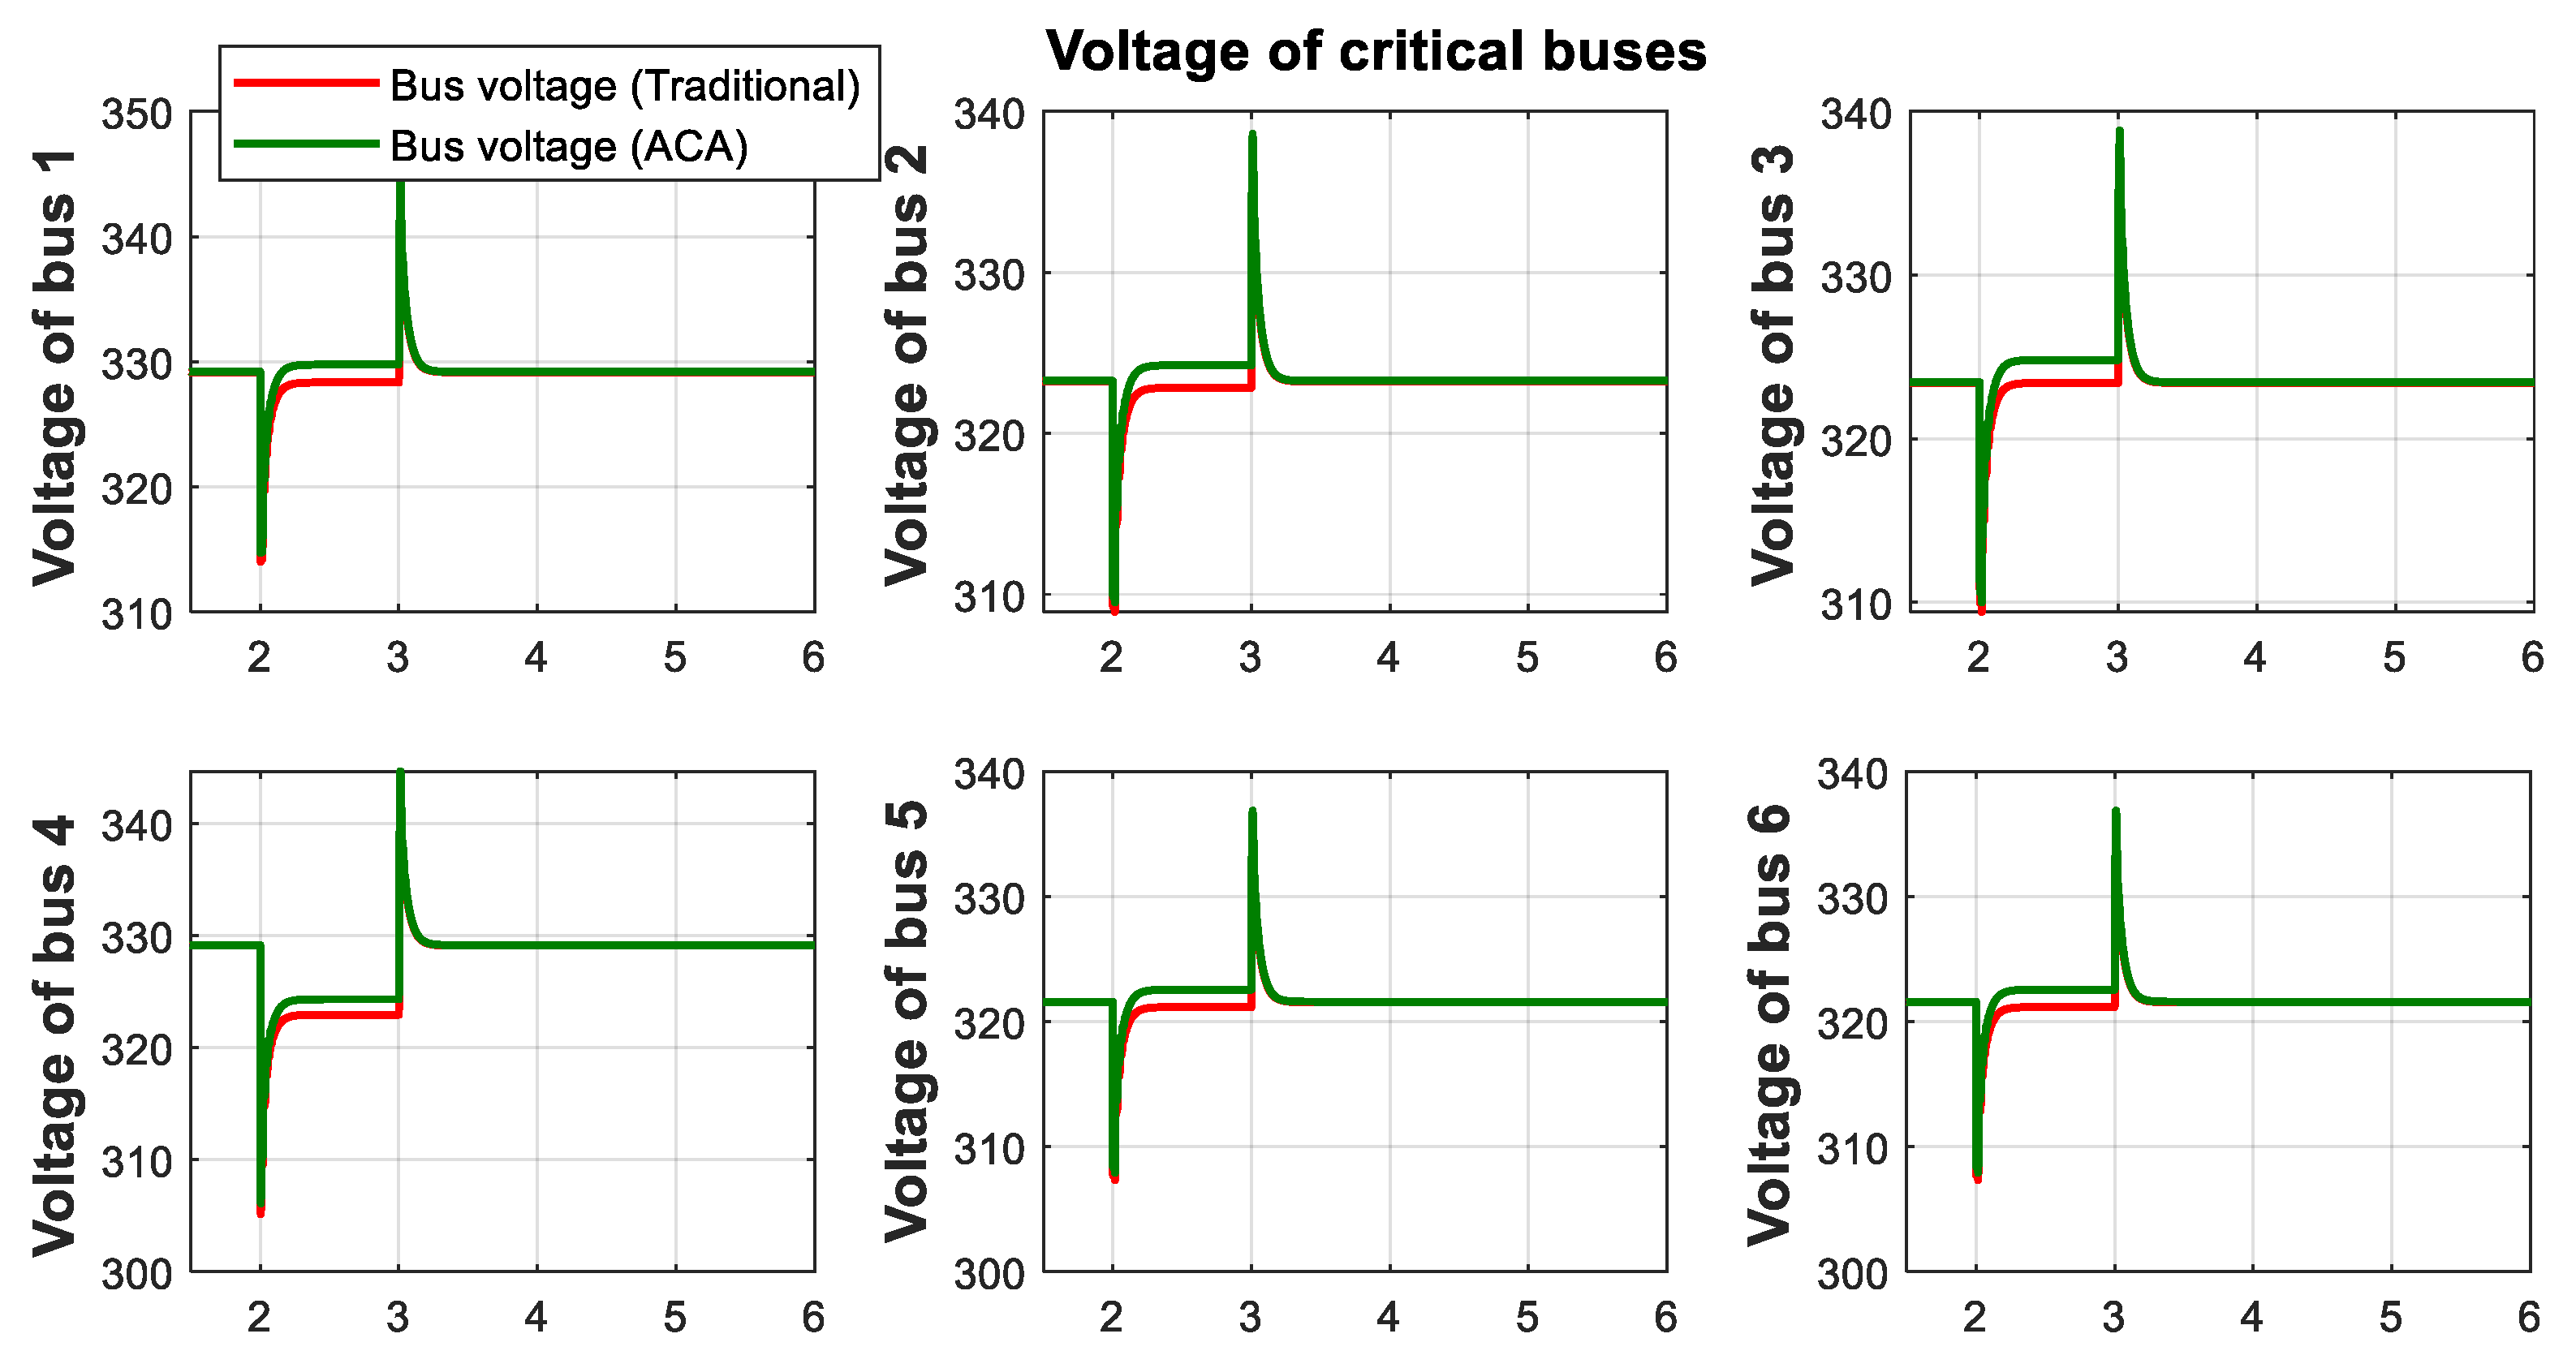
Figure 21 shows the voltage of each pilot bus separately for the decentralized and the ACA-based voltage control when a load change happens at bus 4. In this figure bus 4 has the lowest voltage. However, with ACA it can be better restored as the control system is trying to keep the average voltage at a proper setpoint. Finally, in
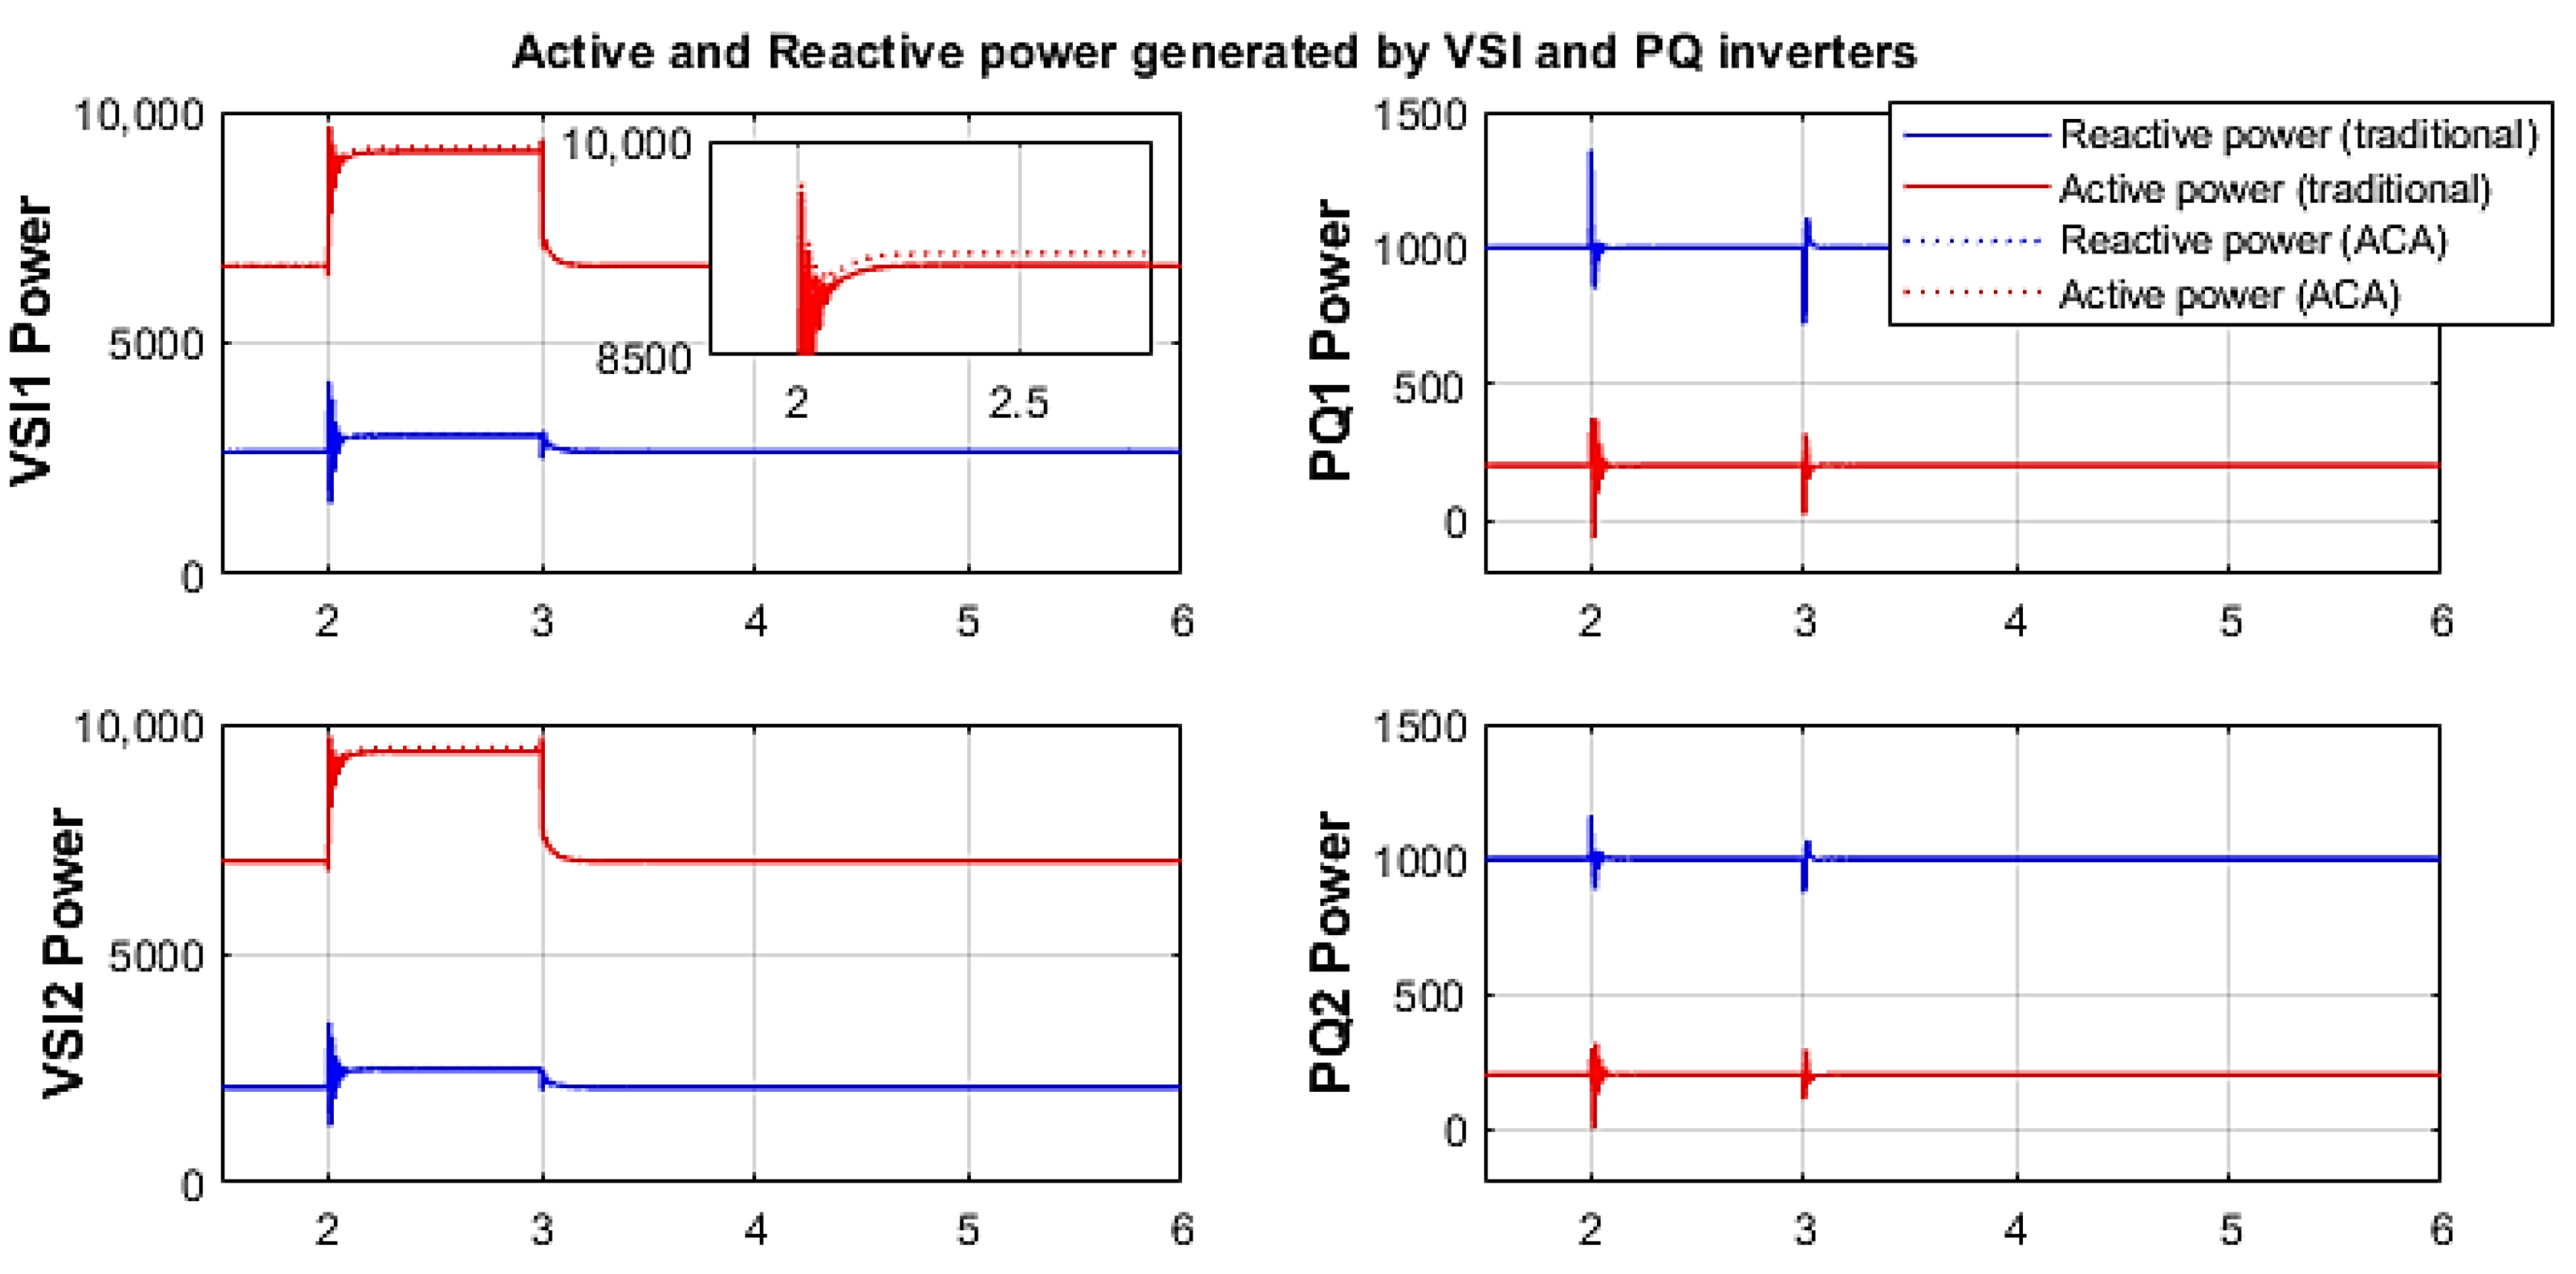
Figure 22, the active and reactive power produced by each inverter are shown separately. It demonstrates the fact that PQs will work the same in both approaches but its VSI’s contribution will be different.
4.3.2. Data-Driven Voltage Control Operation with Delay
The performance of the ACA voltage control of the microgrid is highly related to the rate of data transfer [
27] and the utilized updating matrix rules to reach an agreement quickly. If there is a delay in the communication link, it can lead to oscillations in the response, and eventually, it can lead the system towards instability.
If there are communication links with high delays in the network, one approach to deal with that is to increase the connectivity factor of the system so the agreement time delay is reduced and, therefore, the overall time delay remains at the same level.
4.3.3. Data-Driven Voltage Control Operation with Communication Link Failure
Proper functionality of the ACA algorithm depends on the two previously discussed properties of the digraph of being balanced and strongly connected. If any of these two properties are violated, the required operation will not be obtained [
21].
In case of a cyber-attack or a communication link failure, the balance of the digraph can be deteriorated right away. Therefore, the agreement value will not reflect the average value anymore. In a two-direction communication network, this will only affect the agreement time delay and the agreement value remains around the average value. Consequently, fault detection and isolation are sufficient. That means, in digraph, further action is required. Here are the steps to take when a one-direction communication link has a malfunction:
In order to limit the impact of an attack on the adjacent nodes, the affected link and a non-affected one in the reverse direction are usually removed. However, it is essential to ensure that the communication network of the microgrid reaches an agreement so that the integrity of the microgrid’s network stays strongly connected (SC). This also means that the agreement values of each node will be consistent with the average values of all nodes.
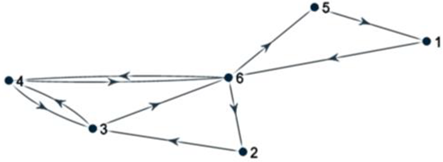
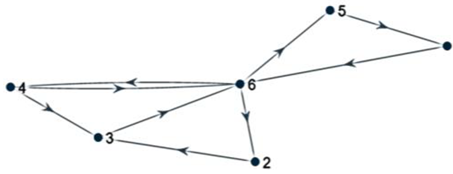
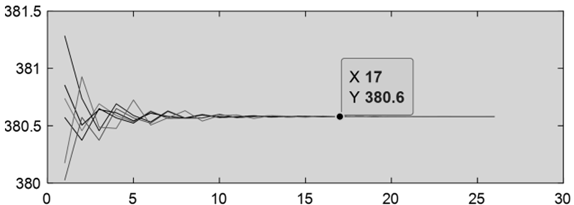
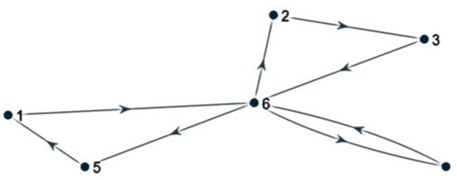
The six-node network structure of the utilized microgrid is shown in
Table 3, and we illustrate how to approach a one-way link failure in order to avoid losing the correct average value.
Table 3 shows the agreement process and the agreement value under different operation scenarios.
In
Figure 23, the effect of both communication delays and one-way communication failure is shown and compared with normal operation. The load change is 2 + j5 kVA and it is added to bus 4 of the microgrid at t = 2 s.
Figure 23 shows that the data-driven voltage control can manage the possible fragilities related to the communication structure such as delays, cyberattacks and malfunctions if proper protocols are implemented for the system to counteract the effect of malfunctions. In other words, there will be more transient response oscillation due to the delays and the link’s failure, but appropriate action can ensure the required operation of the microgrid in terms of steady state response.
5. Conclusions
This paper defines an agile power system as an interconnection of flexible subsystems, including microgrids and electric vehicles, that can connect or disconnect from the main grid. This poses new challenges for their operation and control. Some of these challenges are then presented and two specific operation and control problems are addressed. The inertia provided by large generating units might not always be available. This will affect the energy balance or the load frequency control problem as well as stability. Case studies of two systems, one with two control areas and a second with three control areas, are investigated and show that the rules of interconnection are violated. It is concluded that compliance requirements set for large control areas need to be updated to account for low inertia subsystems. Finally, a data-driven voltage control approach to take advantage of the proliferation of sensors and the communication framework, which are an integral part of agile system is proposed. The data-driven secondary voltage control target is to control all critical bus voltages even if they are far from the actuators of the system (VSI inverters). Taking advantage of the computational and communicational capabilities of the network infrastructure, along with the proposed Average Consensus Algorithm (ACA)-based secondary voltage control, all critical bus voltages can be kept in their desired range. Additionally, the possible fragilities of the communication structure such as delays, cyberattacks and malfunctions are addressed for the proposed data-driven voltage control of microgrids.
Future work will address the effect of low inertia on the dynamic stability of agile systems and the appropriate design of controllers to improve the performance. Another problem might be to solve the economic dispatch through interactions of the power system and the electric transportation system.
