
Energy Simulations of a Building Insulated with a Hemp-Lime Composite with Different Wall and Node Variants


Abstract
1. Introduction
2. Materials and Methods
2.1. Materials Used in Calculations
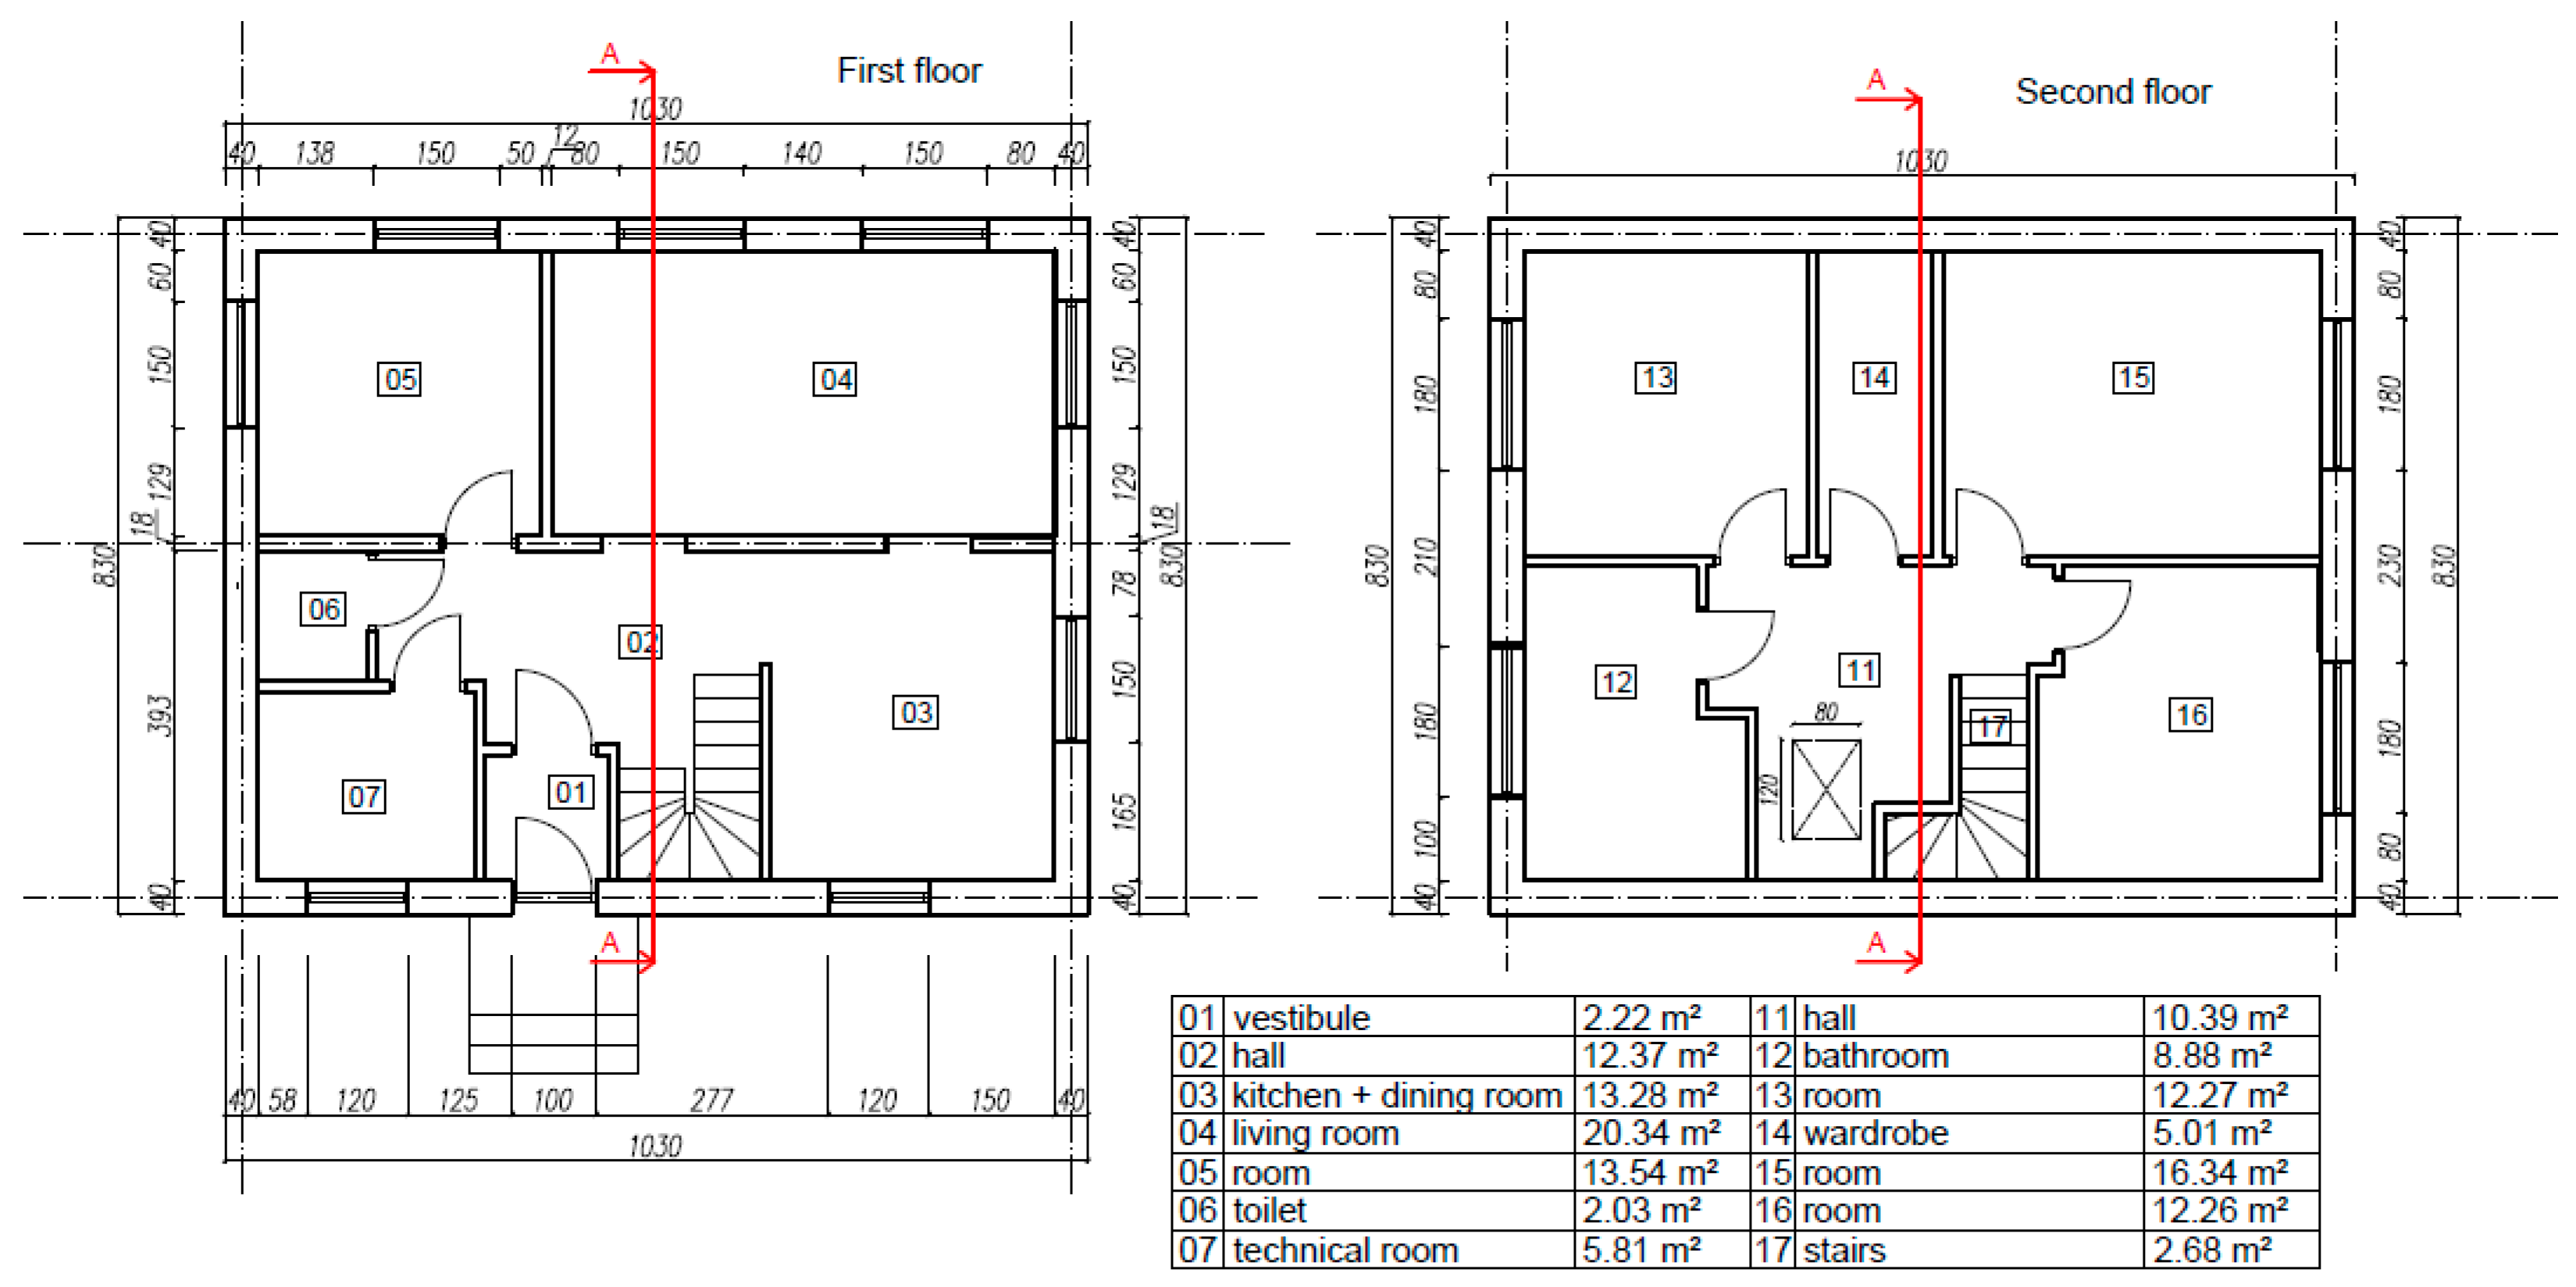
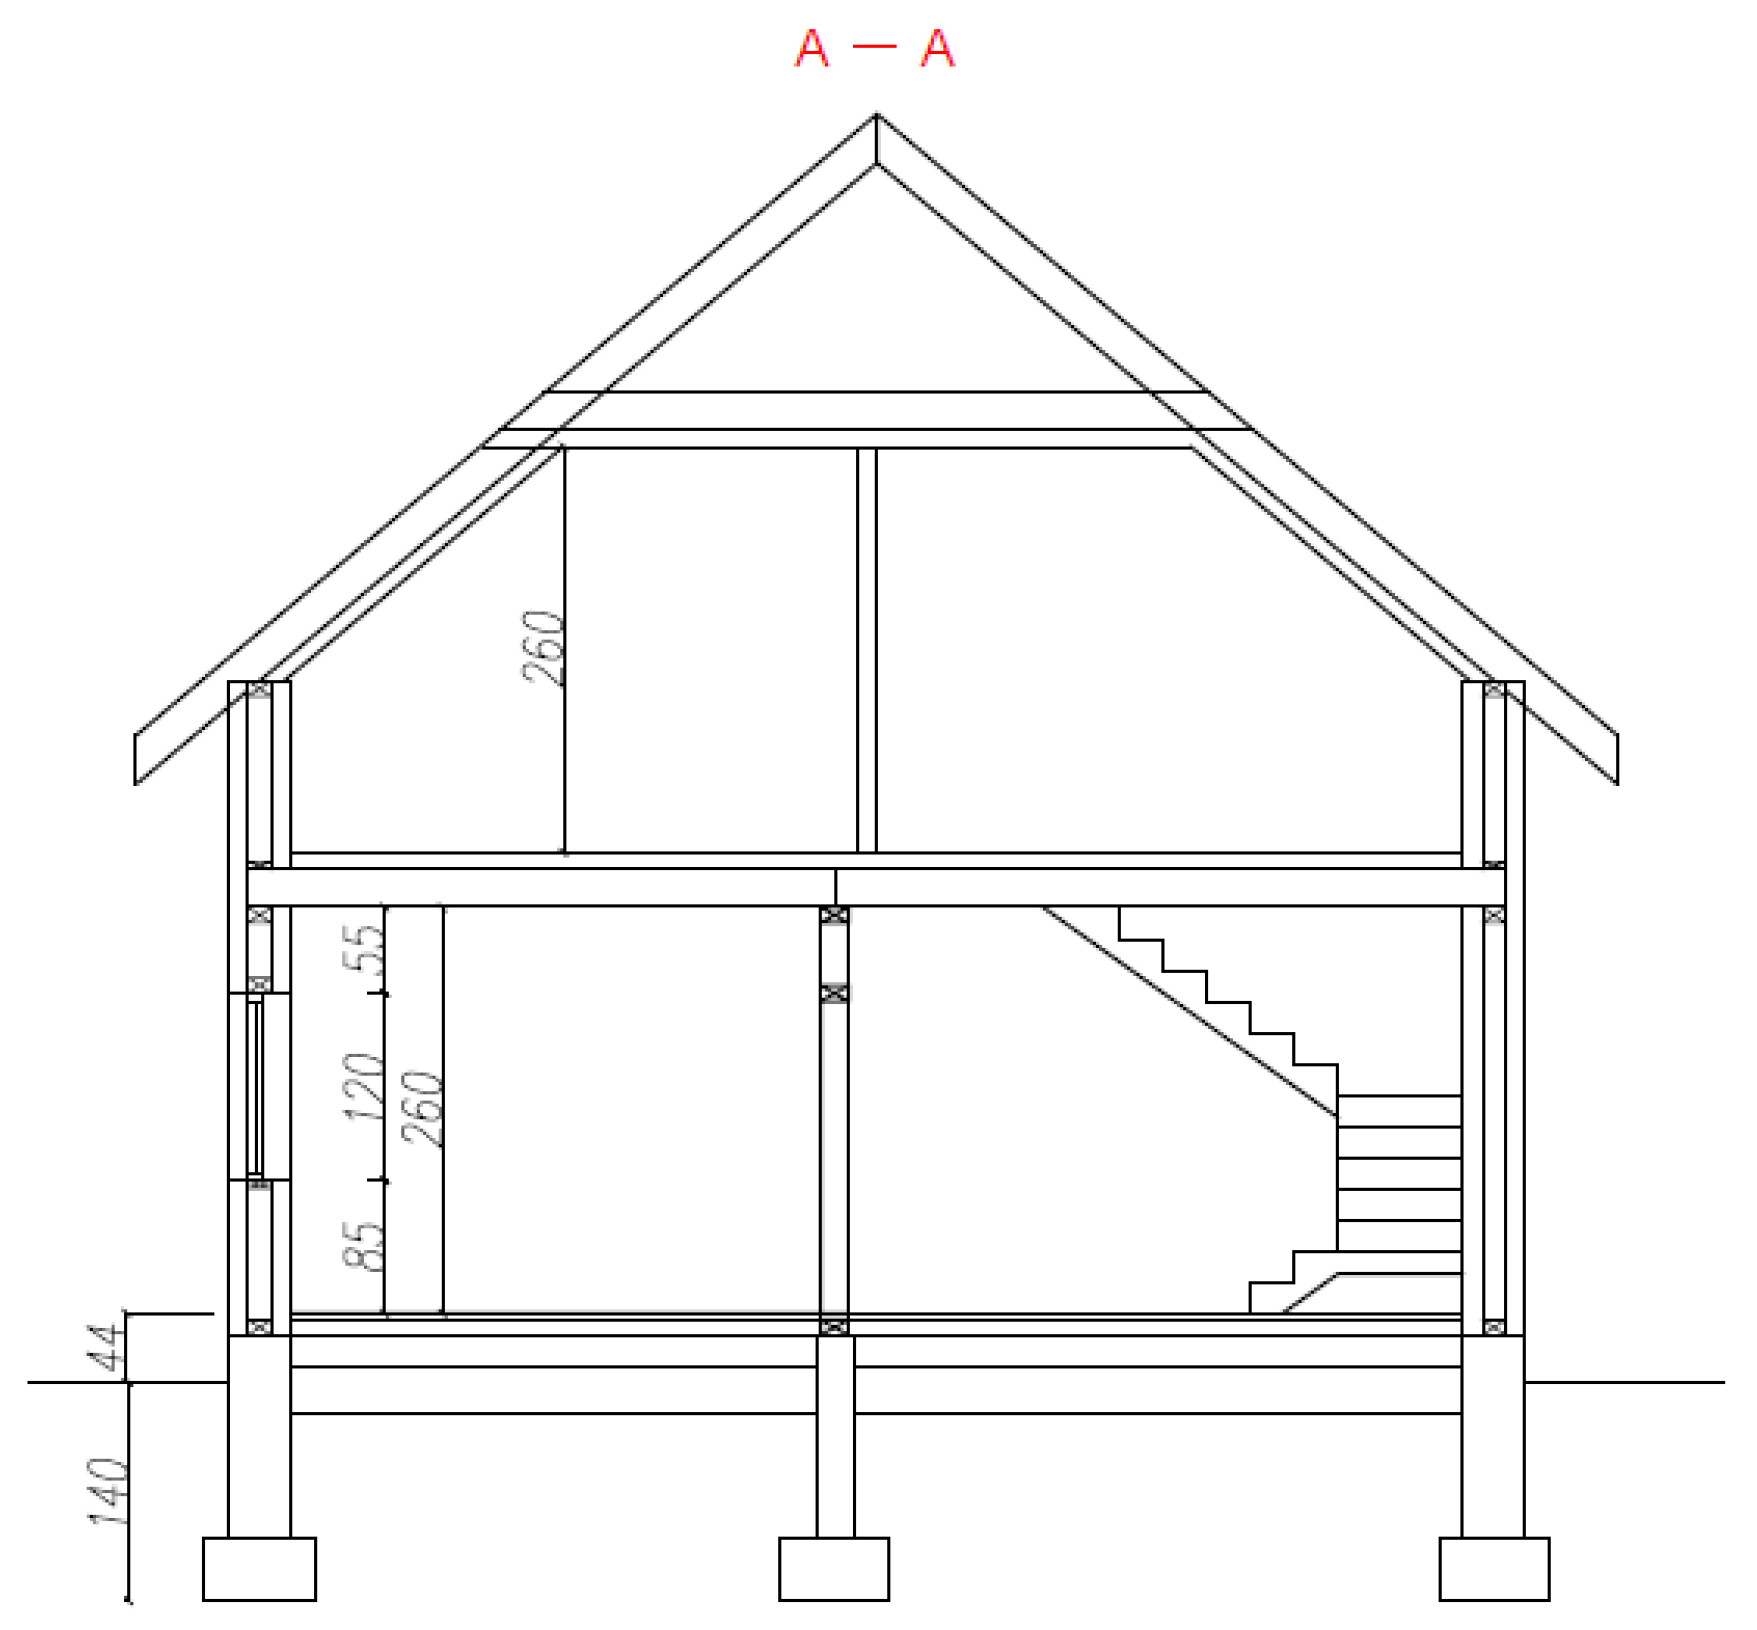
2.2. Building and Junctions Used in Calculations
2.3. Modelling of the Thermal Bridges

| Description | Thermal Bridge Diagram | Length of the Bridge in the Building [m] | Linear Thermal Transmittance [W/(m·K)] |
|---|---|---|---|
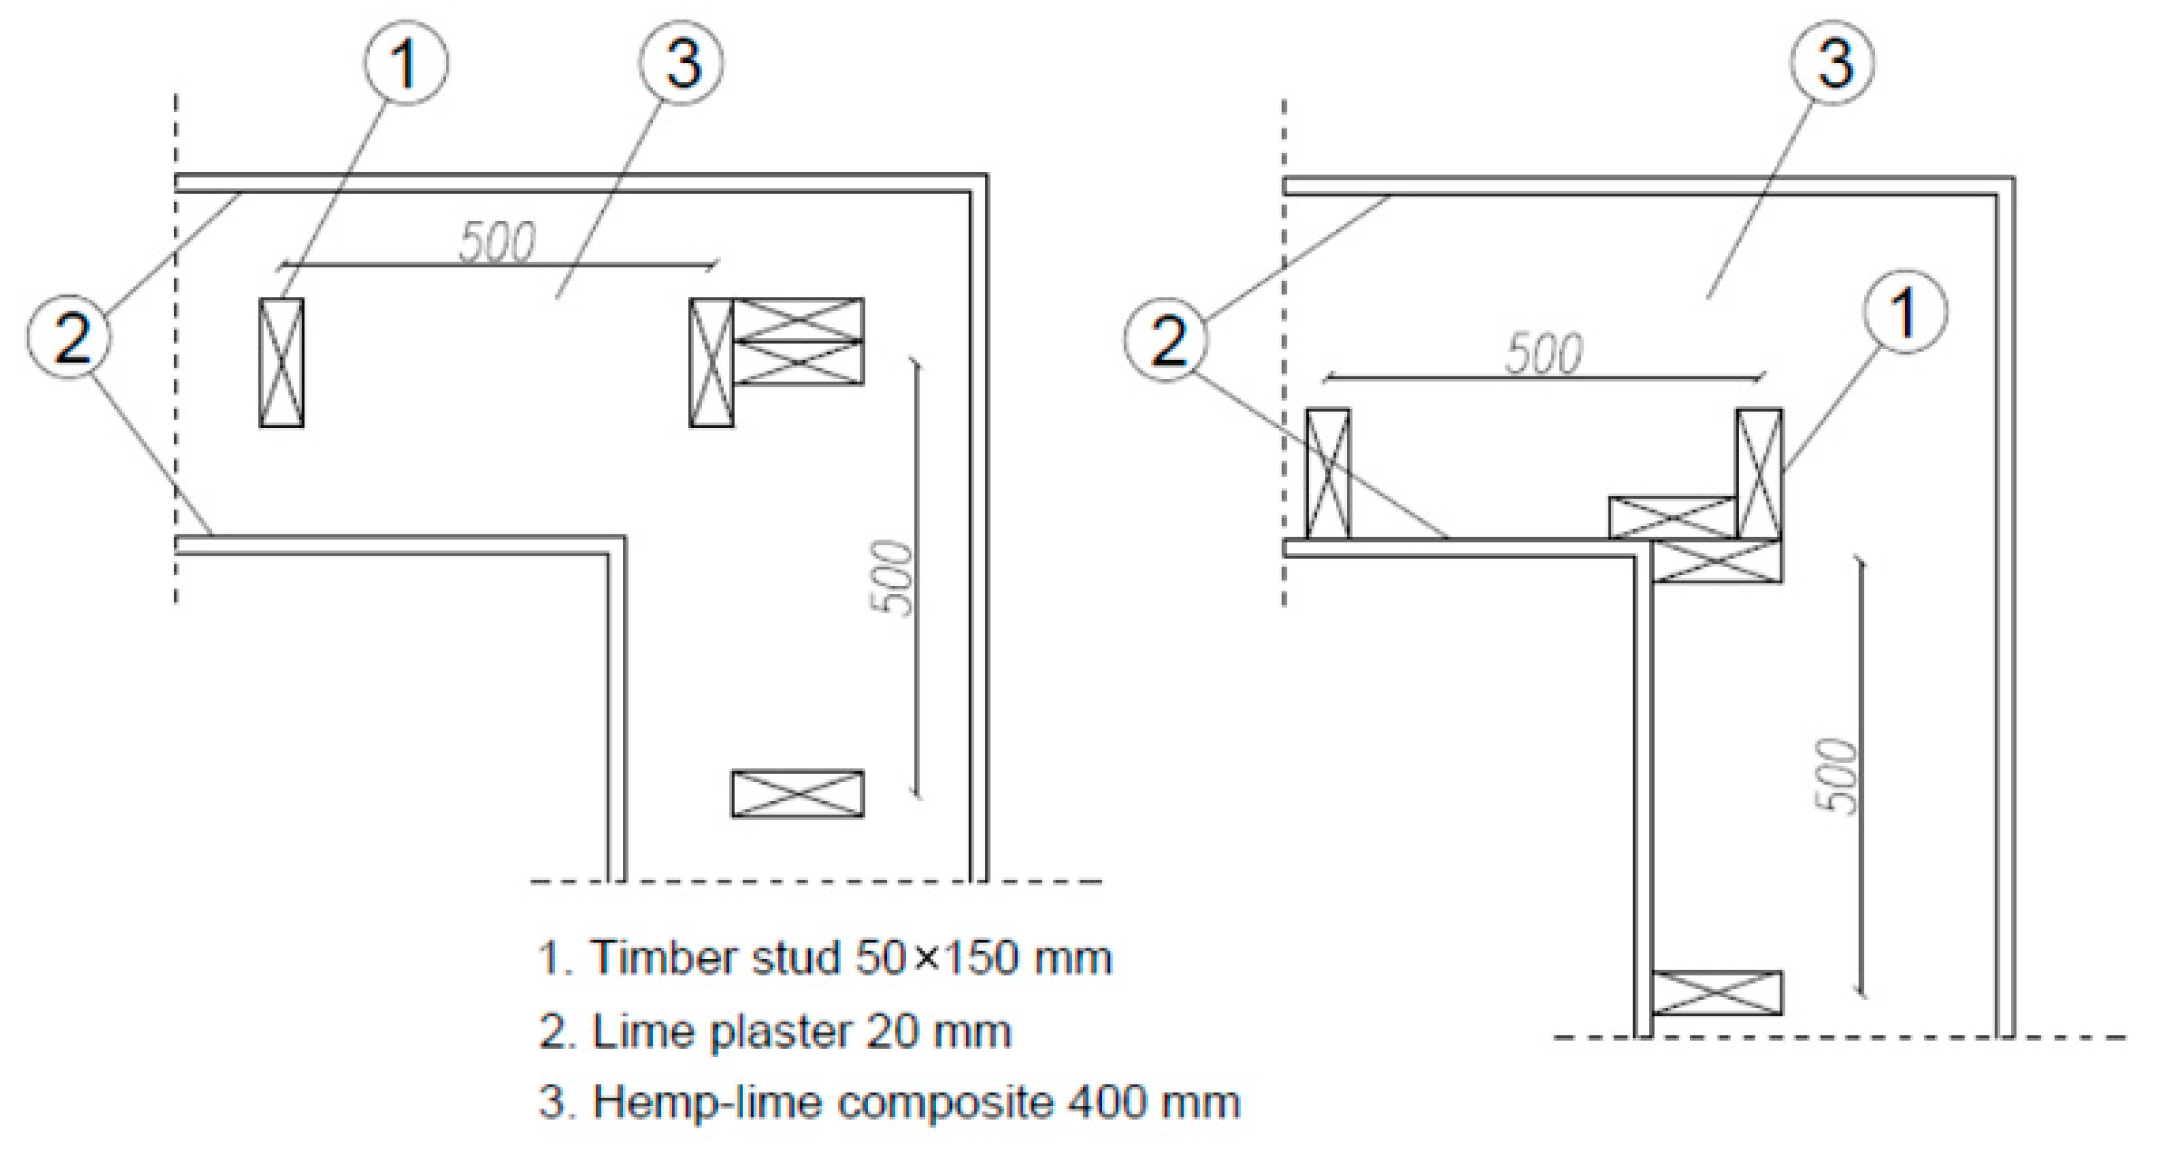
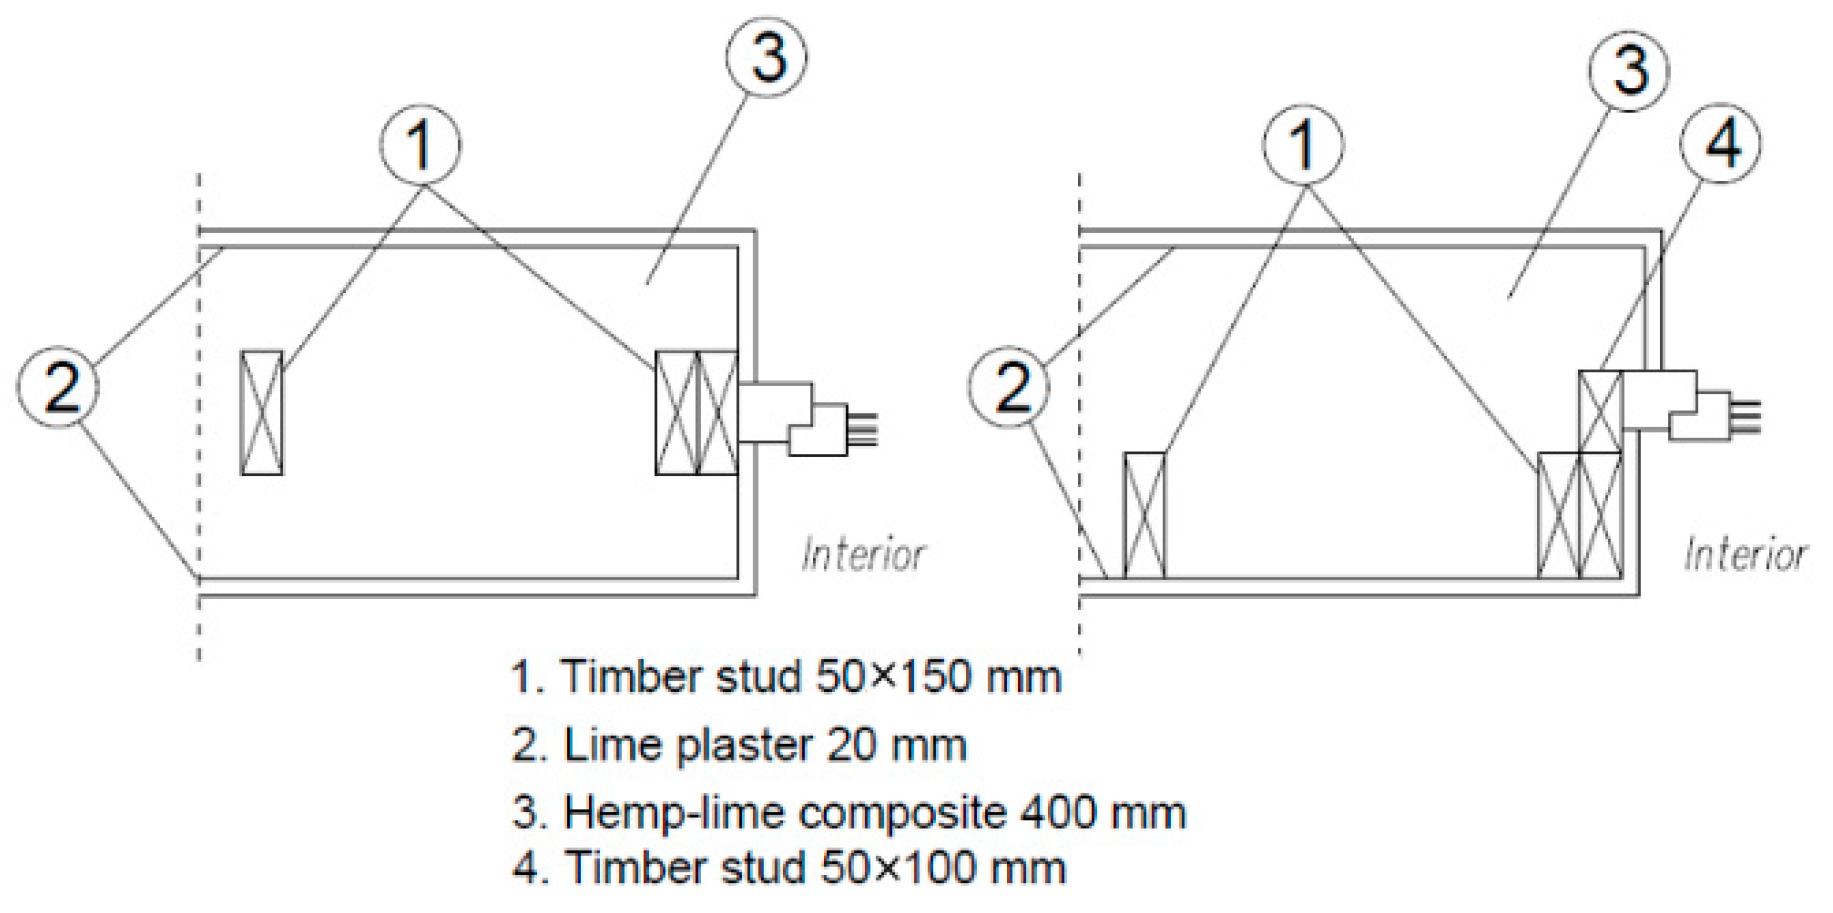
| External corner with a timber frame located centrally in relation to wall thickness |  | 18.12 | −0.1237 |
| External corner with a timber frame located on the inner side of the wall |  | 18.12 | −0.1153 |
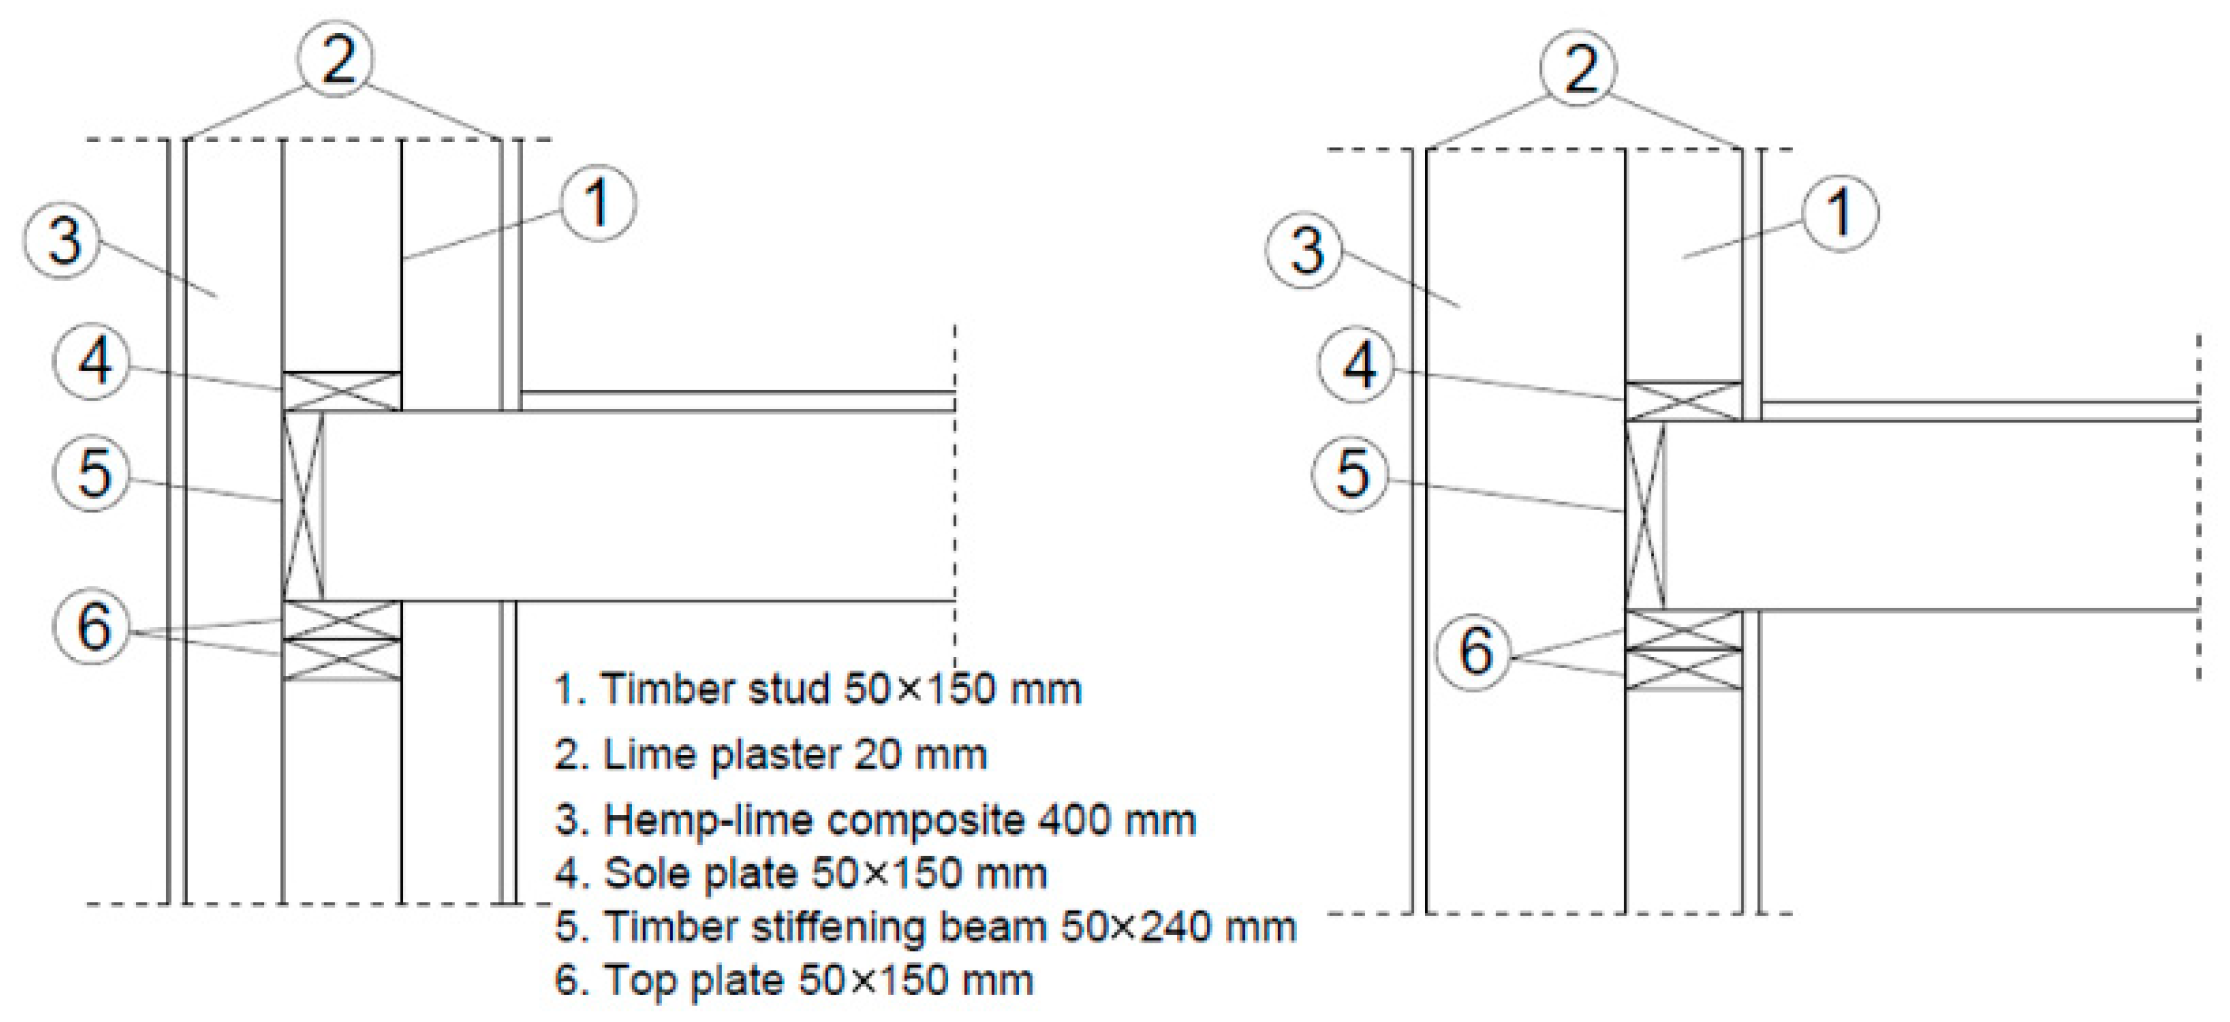
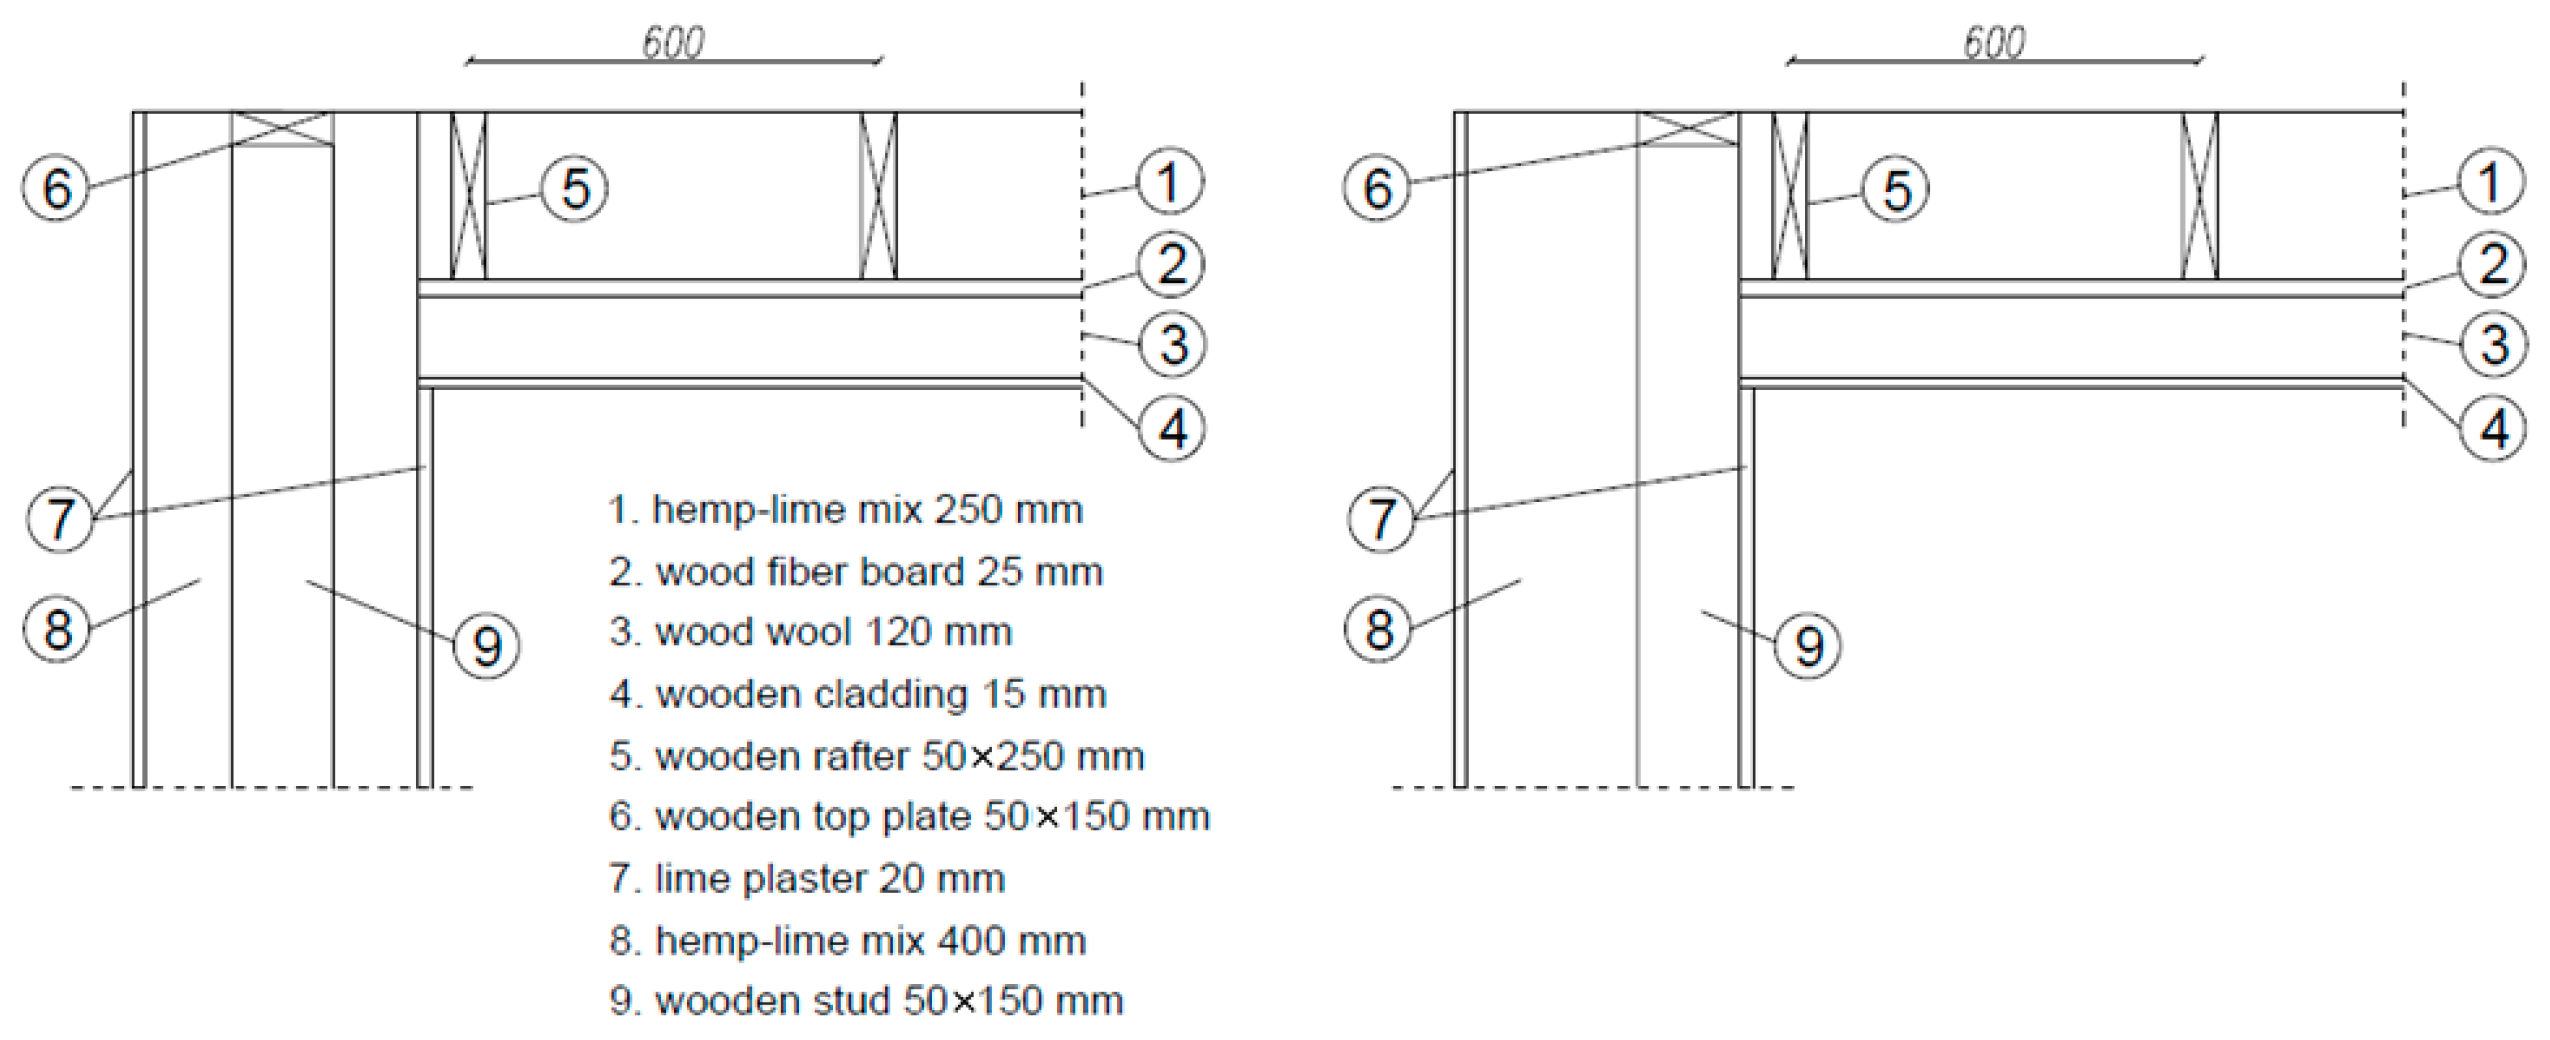
| Connection of a wall and a ceiling with a timber frame located centrally in relation to wall thickness |  | 37.20 | 0.0074 |
| Connection of a wall and a ceiling with a timber frame located on the inner side of the wall |  | 37.20 | 0.0063 |
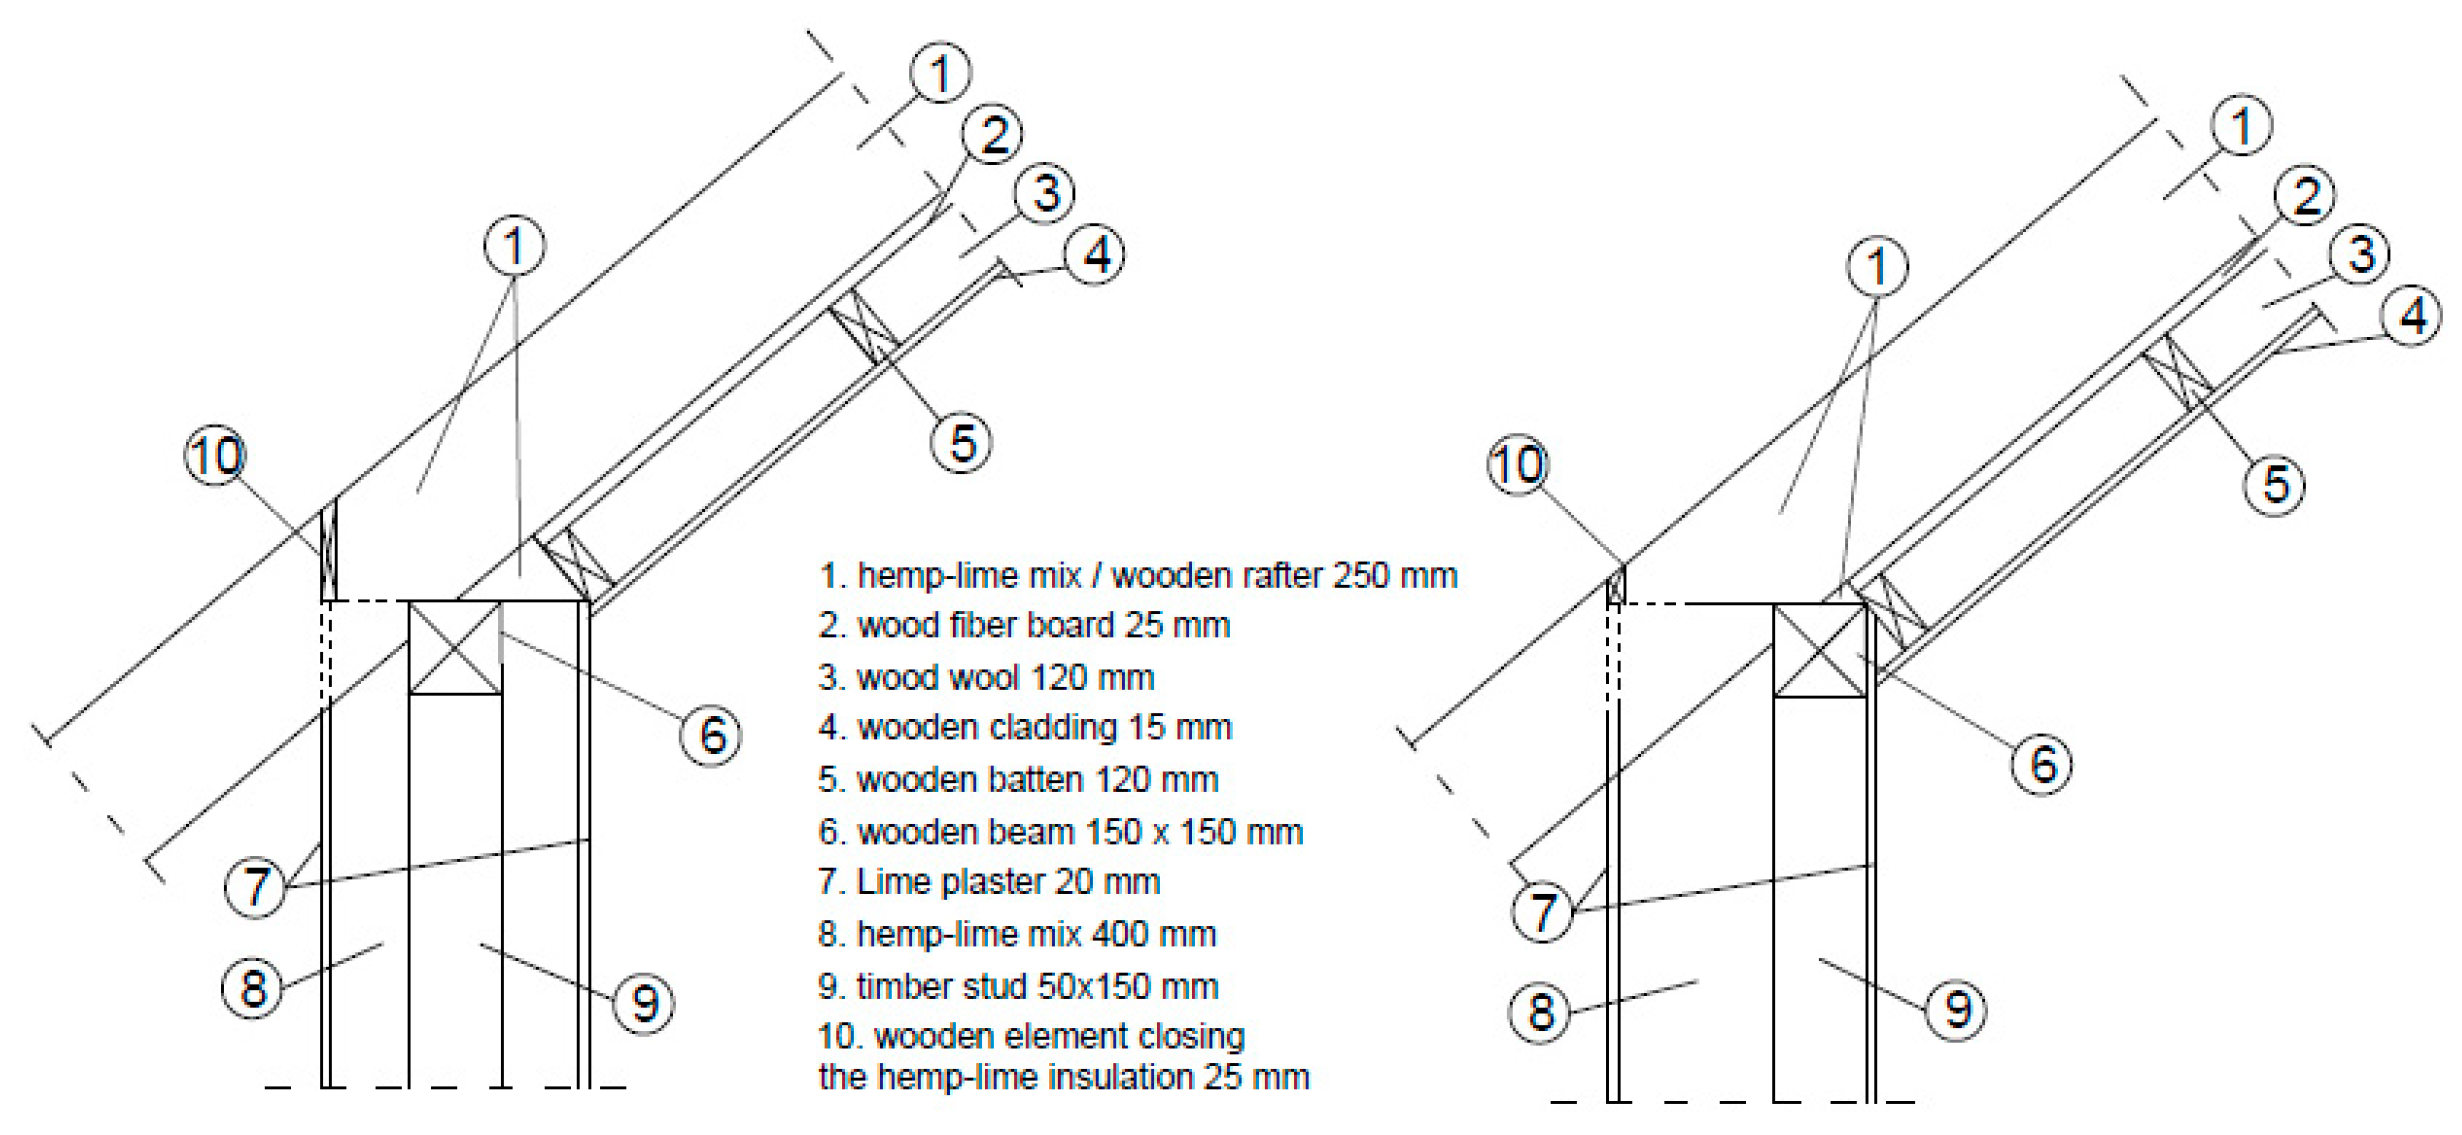
| Connection of a roof and a knee wall with a timber frame located centrally in relation to wall thickness |  | 20.60 | −0.0379 |
| Connection of a roof and a knee wall with a timber frame located on the inner side of the wall |  | 20.60 | −0.0255 |
| Connection of a roof and a gable wall with a timber frame located centrally in relation to wall thickness |  | 10.84 | −0.1044 |
| Connection of a roof and a gable wall with a timber frame located on the inner side of the wall |  | 10.84 | −0.1019 |
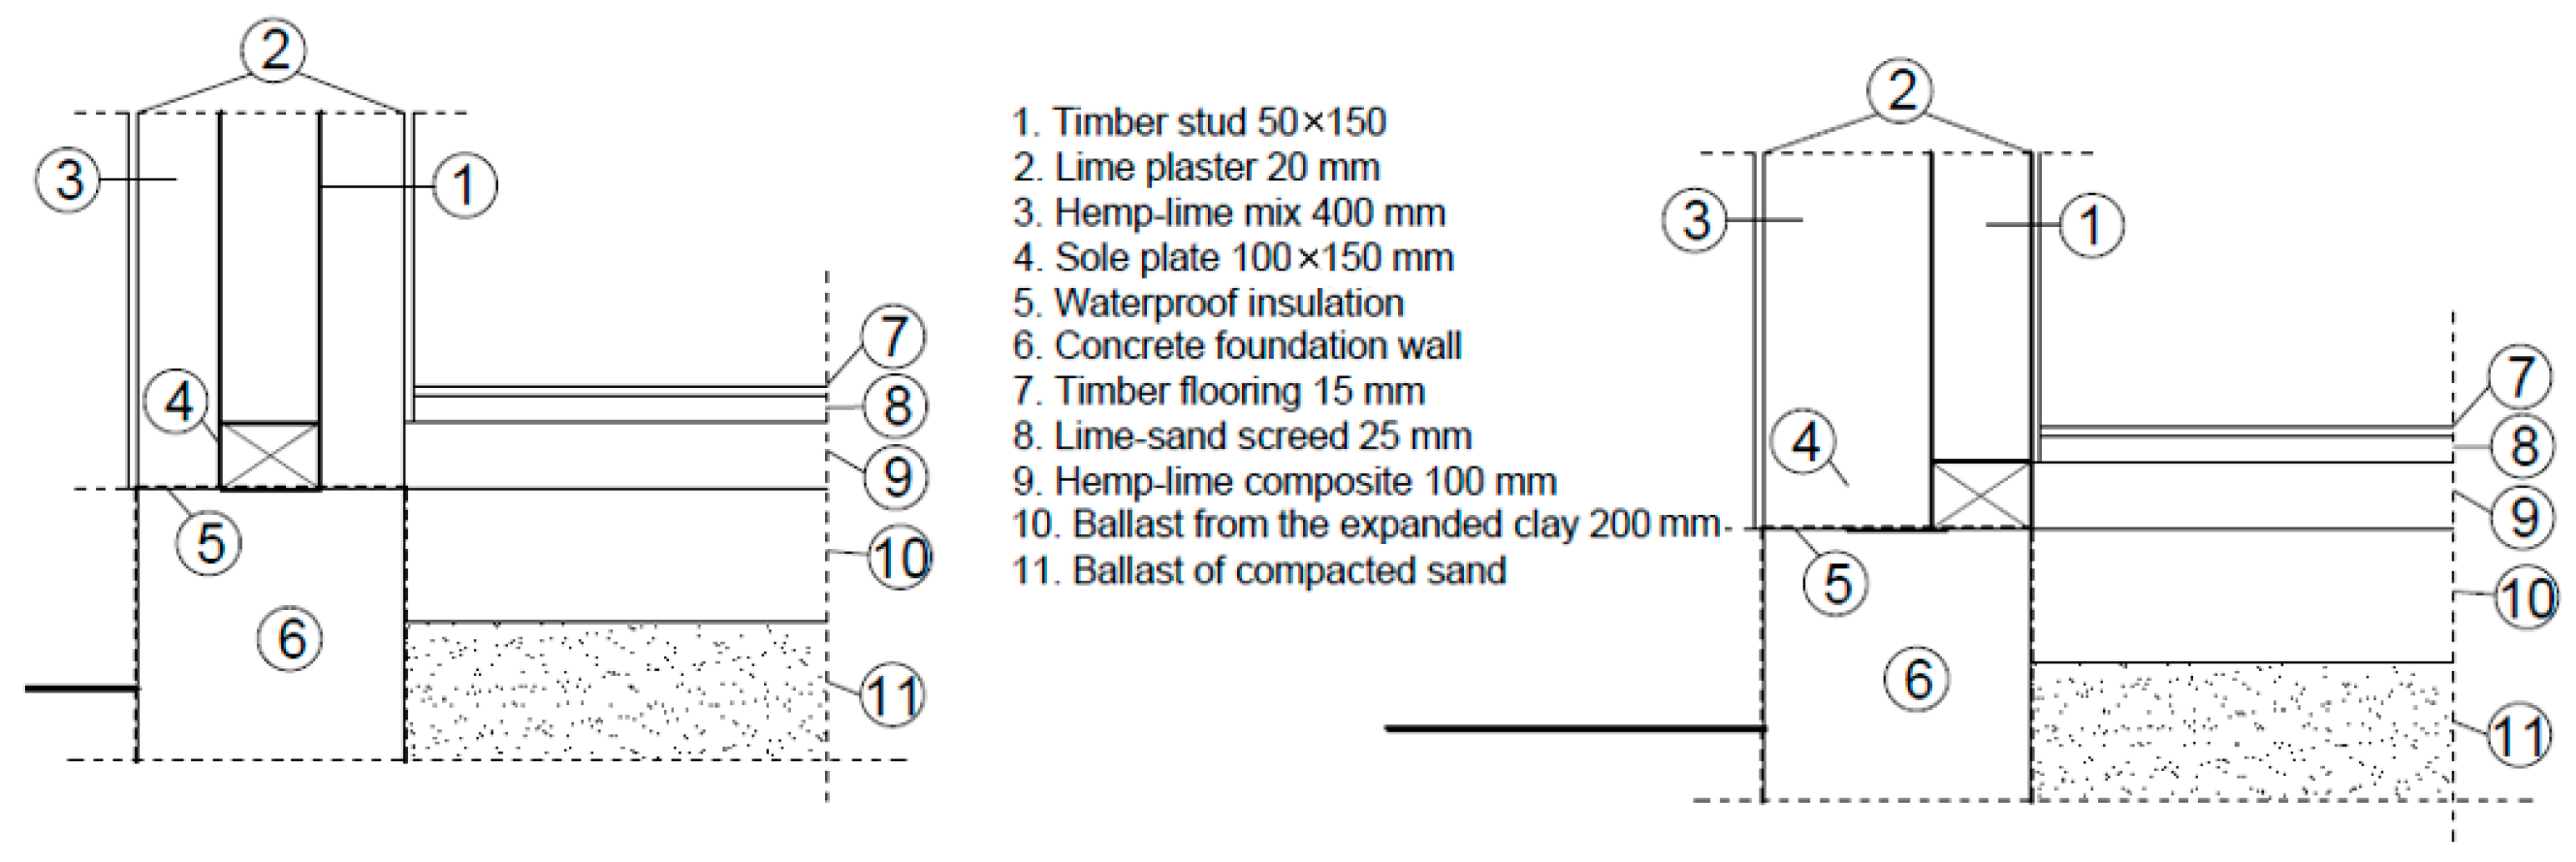
| Connection of a wall and a ground floor with a timber frame located centrally in relation to the wall thickness (fragment of the model) |  | 37.20 | −0.1996 |
| Connection of a wall and a ground floor with a timber frame located on the inner side of the wall (fragment of the model) |  | 37.20 | −0.1969 |
| Window placement in a wall with a timber frame located centrally in relation to wall thickness |  | 55.90 * | 0.0435 |
| Window placement in a wall with a timber frame located on the inner side of the wall |  | 55.90 * | 0.0390 |
| No of Windows | Size of the Window Opening [m] | Area of the Window Opening [m2] | Length of the Thermal Bridge [m] |
|---|---|---|---|
| 3 | 1.20 × 1.50 | 5.40 | 16.20 |
| 3 | 1.50 × 1.50 | 6.75 | 18.00 |
| 3 | 1.80 × 1.50 | 8.10 | 19.80 |
| 4 | 1.20 × 1.50 | 7.20 | 21.60 |
| 4 | 1.50 × 1.50 | 9.00 | 24.00 |
| 4 | 1.80 × 1.50 | 10.90 | 26.40 |
2.4. Simulations
3. Results and Discussion
4. Conclusions
- the percentage share of thermal bridges in heat loss through transmission in the analyzed building was −9.6 to −10.2;
- the greatest absolute share in heat loss through transmission had the connection between the floor on the ground and the outer wall, and the lowest absolute value had the connection between the ceiling and the wall;
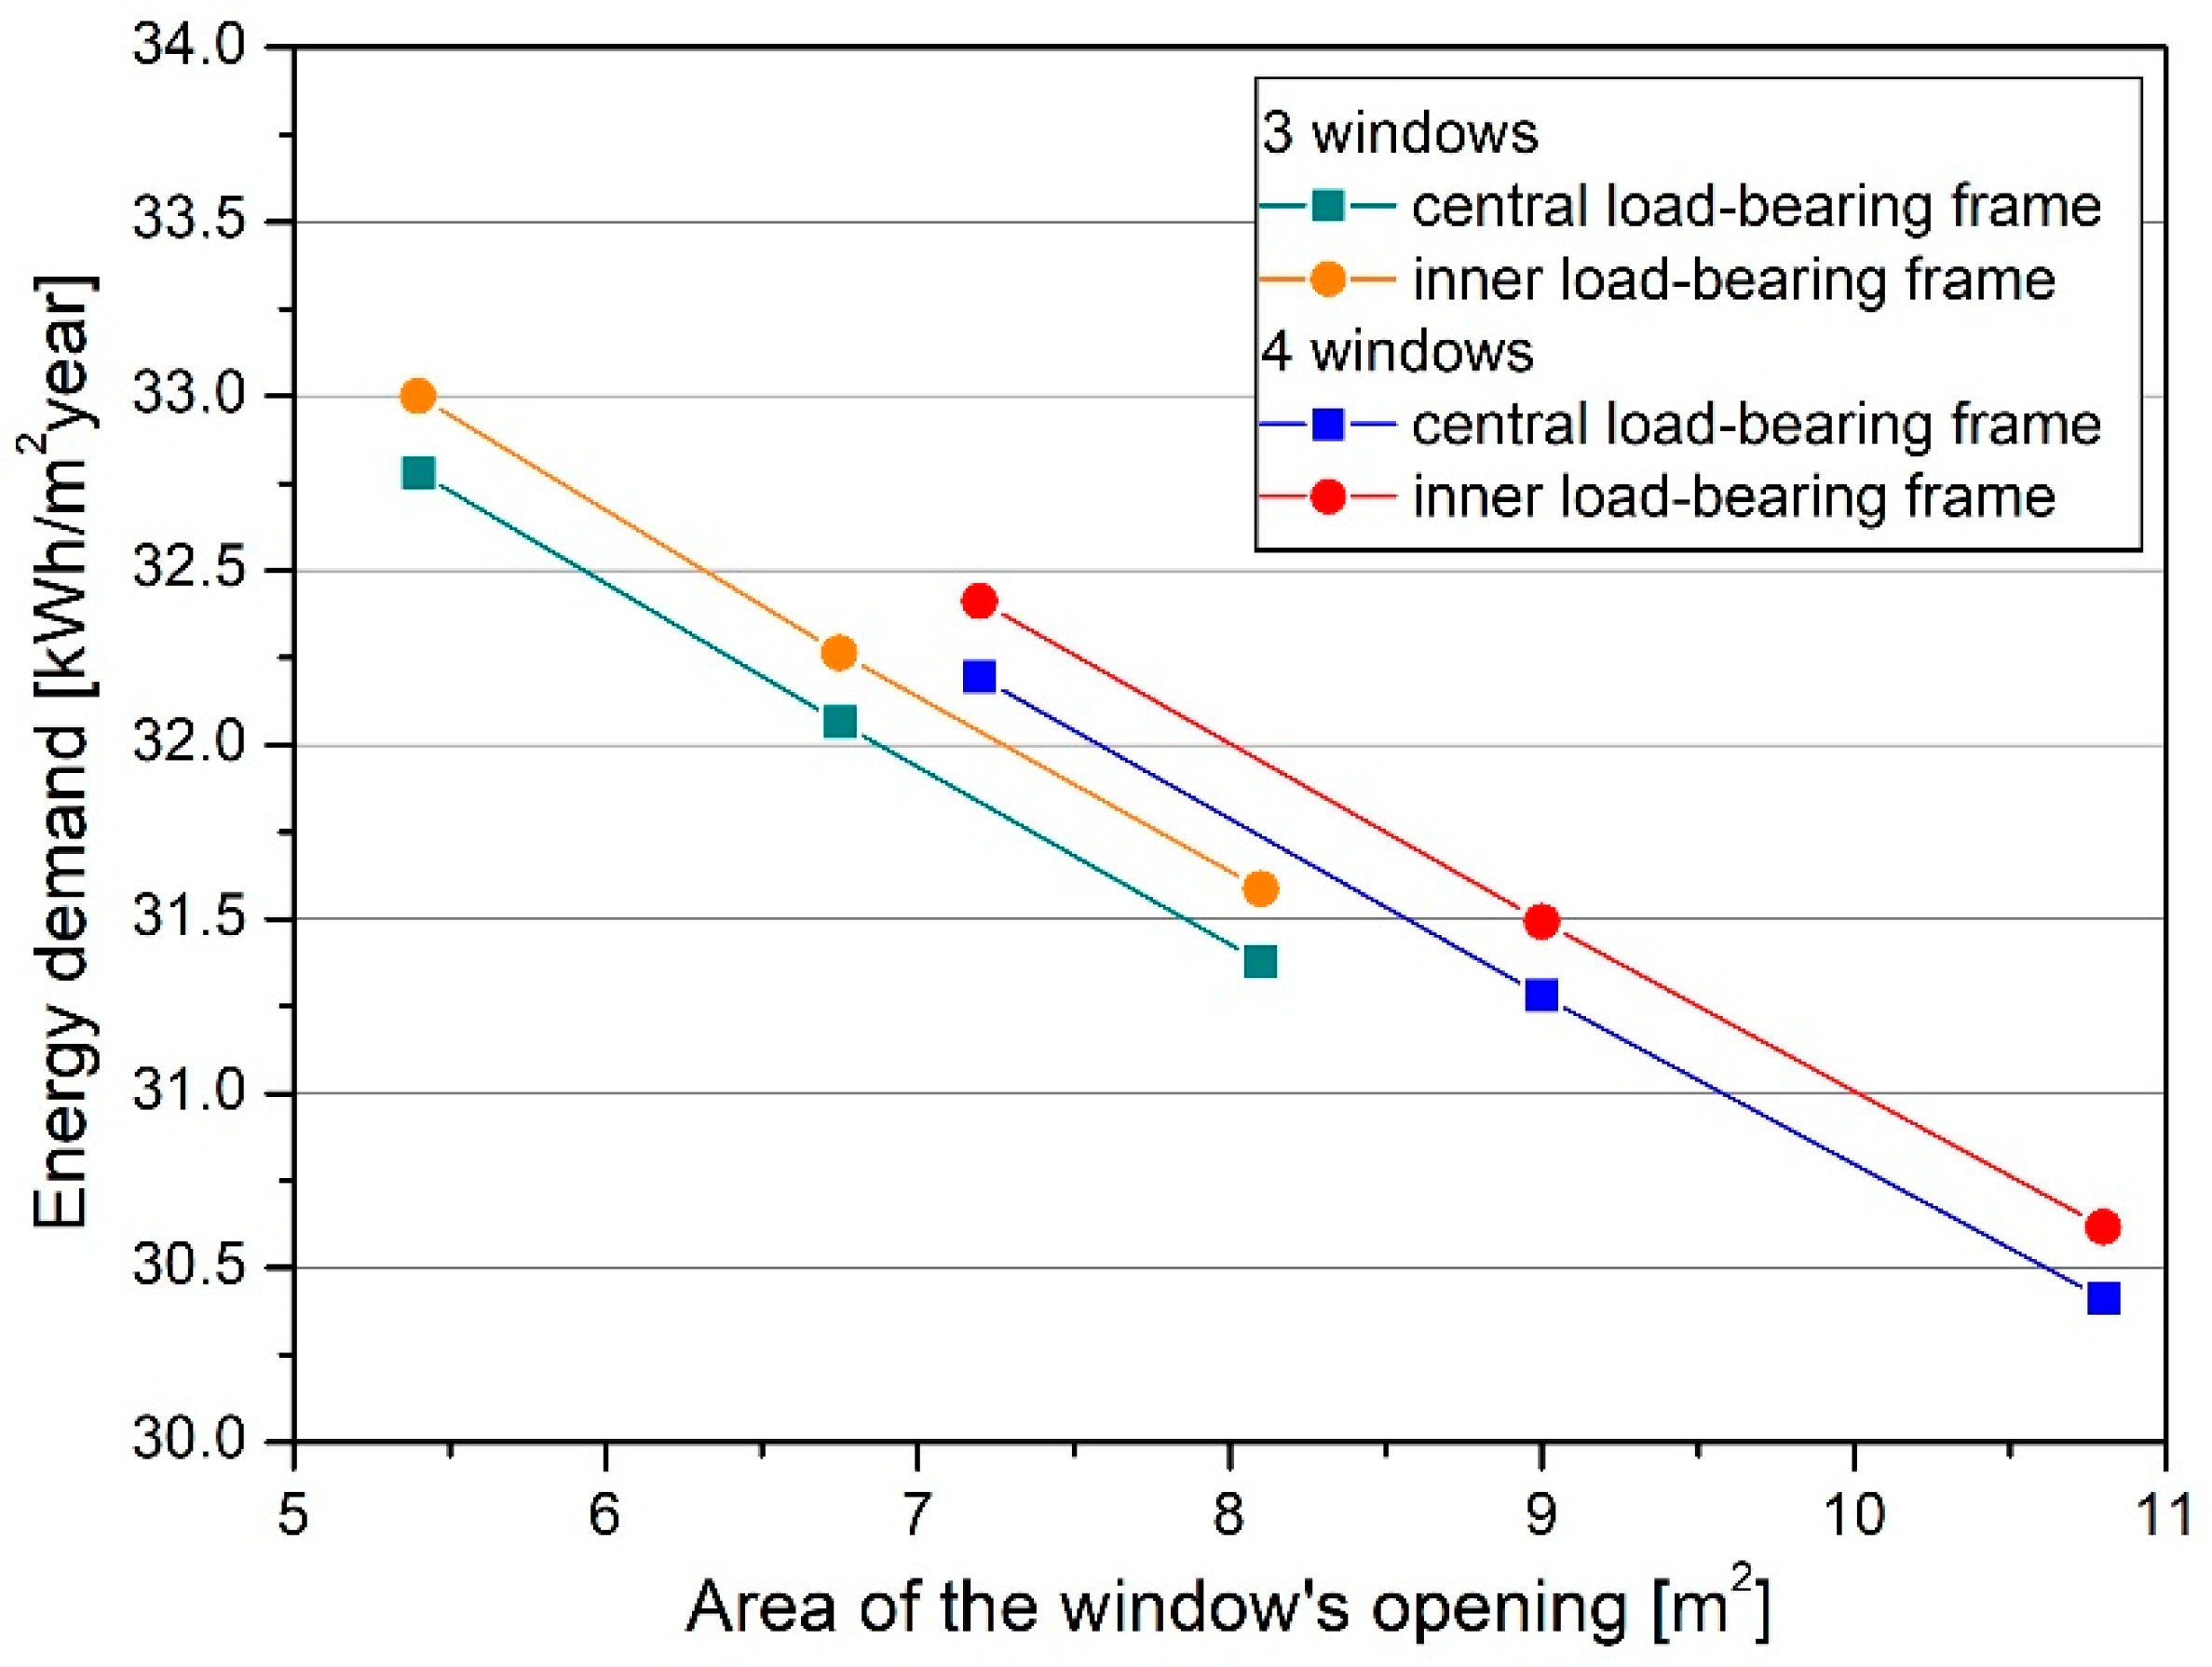
- linear heat transfer coefficient of the window’s placement in a wall had the biggest positive value, so this node could play the decisive role in the choice of the preferred wall type; however, it turned out that the changes in its length did not modify the trend beneficially for the walls with the central location of the timber frame;
- while maintaining a constant glazing area, it was more advantageous to minimize the number of windows, because shorter thermal bridges helped to reduce heat losses.
Author Contributions
Funding
Data Availability Statement
Conflicts of Interest
References
- Yuan, X.; Wang, X.; Zuo, J. Renewable energy in buildings in China—A review. Renew. Sustain. Energy Rev. 2013, 24, 1–8. [Google Scholar] [CrossRef]
- Building Performance Institute Europe (BPIE). Renovation Strategies of Selected EU Countries. A Status Report on Compliance with Article 4 of the Energy Efficiency Directive; BPIE: Brussels, Belgium, 2014; Available online: http://bpie.eu/wp-content/uploads/2015/10/Renovation-Strategies-EU-BPIE-2014.pdf (accessed on 13 October 2022).
- Trotta, G. Assessing energy efficiency improvements, energy dependence, and CO2 emissions in the European Union using a decomposition method. Energy Effic. 2019, 12, 1873–1890. [Google Scholar] [CrossRef]
- Böhm, M.; Beránková, J.; Brich, J.; Polášek, M.; Srba, J.; Nĕmcová, D.; Černy, R. Factors influencing envelope airtightness of lightweight timber-frame houses built in the Czech Republic in the period of 2006–2019. Build. Environ. 2021, 194, 107687. [Google Scholar] [CrossRef]
- Bouchair, A. Steady state theoretical model of fired clay hollow bricks for enhanced external wall thermal insulation. Build. Environ. 2008, 43, 1603–1618. [Google Scholar] [CrossRef]
- Prata, J.; Simões, N.; Tadeu, T. Heat transfer measurements of a linear thermal bridge in a wooden building corner. Energy Build. 2018, 158, 194–208. [Google Scholar] [CrossRef]
- Šadauskienė, J.; Ramanauskas, J.; Krawczyk, D.A.; Klumbytė, E.; Fokaides, P.A. Investigation of Thermal Bridges of a New High-Performance Window Installation Using 2-D and 3-D Methodology. Buildings 2022, 12, 572. [Google Scholar] [CrossRef]
- Bergero, S.; Cavalletti, P.; Chiari, A. Energy refurbishment in existing buildings: Thermal bridge correction according to DM 26/06/2015 limit values. Energy Procedia 2017, 140, 127–140. [Google Scholar] [CrossRef]
- Al-Sanea, S.A.; Zedan, M.F. Effect of thermal bridges on transmission load and thermal resistance of building walls under dynamic conditions. Appl. Energy 2012, 98, 584–593. [Google Scholar] [CrossRef]
- Asdrubali, F.; Baldinelli, G.; Bianchi, F. A quantitative methodology to evaluate thermal bridges in buildings. Appl. Energy 2012, 97, 365–373. [Google Scholar] [CrossRef]
- Ge, H.; Baba, G. Effect of dynamic modeling of thermal bridges on the energy performance of residential buildings with high thermal mass for cold climates. Sustain. Cities Soc. 2017, 34, 250–263. [Google Scholar] [CrossRef]
- Kim, S.; Seo, J.; Jeong, H.; Kim, J. In situ measurement of the heat loss coefficient of thermal bridges in a building envelope. Energy Build. 2022, 256, 111627. [Google Scholar] [CrossRef]
- Kotti, S.; Teli, D.; James, P.A.B. Quantifying Thermal Bridge Effects and Assessing Retrofit Solutions in a Greek Residential Building. Procedia Environ. Sci. 2017, 38, 306–313. [Google Scholar] [CrossRef]
- Ilomets, S.; Kuusk, K.; Paap, L.; Arumagi, E.; Kalamees, T. Impact of linear thermal bridges on thermal transmittance of renovated apartment buildings. J. Civ. Eng. Manag. 2017, 23, 96–104. [Google Scholar] [CrossRef]
- Zhang, X.; Jung, G.-J.; Rhee, K.-N. Performance Evaluation of Thermal Bridge Reduction Method for Balcony in Apartment Buildings. Buildings 2022, 12, 63. [Google Scholar] [CrossRef]
- Evola, G.; Margani, G.; Marletta, L. Energy and cost evaluation of thermal bridge correction in Mediterranean climate. Energy Build. 2011, 43, 2385–2393. [Google Scholar] [CrossRef]
- Martin, K.; Erkoreka, A.; Flores, I.; Odriozola, M.; Sala, J.M. Problems in the calculation of thermal bridges in dynamic conditions. Energy Build. 2011, 43, 529–535. [Google Scholar] [CrossRef]
- Jedidi, M.; Benjeddou, O. Effect of Thermal Bridges on the Heat Balance of Buildings. Int. J. Civ. Eng. 2018, 2, 41–49. [Google Scholar]
- Ilomets, S.; Kalamees, T. Evaluation of the criticality of thermal bridges. J. Build. Pathol. Rehabil. 2016, 1, 11. [Google Scholar] [CrossRef]
- Cox-Ganser, J.M. Indoor dampness and mould health effects—Ongoing questions on microbial exposures and allergic versus nonallergic mechanisms. Clin. Exp. Allergy 2015, 45, 1478–1482. [Google Scholar] [CrossRef]
- Robertson, H.J. Spatial characteristics of southeast australian housing linked with allergic complaint. Build. Environ. 2001, 36, 931–937. [Google Scholar] [CrossRef]
- Coulburn, L.; Miller, W. Prevalence, Risk Factors and Impacts Related to Mould-Affected Housing: An Australian Integrative Review. Int. J. Environ. Res. Public Health 2022, 19, 1854. [Google Scholar] [CrossRef] [PubMed]
- Johansson, S.; Balksten, K.; Strandberg-de Bruijn, P.B. Risk for Mould Growth on Hemp-Lime at Different Relative Humidity. Constr. Technol. Archit. 2022, 1, 588–594. [Google Scholar] [CrossRef]
- Kosiachevskyi, D.; Abahri, K.; Chaouche, M.; Prat, E.; Daubresse, A.; Bousquet, C. Risk assessment of mold growth in hemp concrete. In Proceedings of the SynerCrete’18 International Conference on Interdisciplinary Approachesfor Cement-based Materials and Structural Concrete, Funchal, Portugal, 24–26 October 2018. [Google Scholar]
- Barclay, M.; Holcroft, N.; Shea, A.D. Methods to determine whole building hygrothermal performance of hemp–lime buildings. Build. Environ. 2014, 80, 204–212. [Google Scholar] [CrossRef]
- ISO 10456:2007; Building Materials and Products. Hygrothermal Properties. Tabulated Design Values and Procedures for Determining Declared and Design Thermal Values. International Organization for Standardization: Geneva, Switzerland, 2007.
- Brzyski, P.; Grudzińska, M.; Majerek, D. Analysis of the Occurrence of Thermal Bridges in Several Variants of Connections of the Wall and the Ground Floor in Construction Technology with the Use of a Hemp–Lime Composite. Materials 2019, 12, 2392. [Google Scholar] [CrossRef]
- Grudzińska, M.; Brzyski, P. The Occurrence of Thermal Bridges in Hemp-Lime Construction Junctions. Period. Polytech. Civ. Eng. 2019, 63, 377–387. [Google Scholar] [CrossRef]
- Benfratello, S. Thermal and structural properties of hemp–lime biocomposite. Constr. Build. Mater. 2013, 48, 745–754. [Google Scholar] [CrossRef]
- Shea, A.; Lawrence, M.; Walker, P. Hygrothermal performance of an experimental hemp–lime building. Constr. Build. Mater. 2012, 36, 270–275. [Google Scholar] [CrossRef]
- Walker, R.; Pavia, S. Moisture transfer and thermal properties of hemp–lime concretes. Constr. Build. Mater. 2014, 64, 270–276. [Google Scholar] [CrossRef]
- Bourdot, A.; Moussa, T.; Gacoin, A.; Maalouf, C.; Vazquez, P.; Thomachot-Schneider, C.; Bliard, C.; Merabtine, A.; Lachi, M.; Douzane, O.; et al. Laboratory Characterization of a hemp-based agro-material: Influence of starch ratio and hemp shive size on physical, mechanical, and hygrothermal properties. Energy Build. 2017, 153, 501–512. [Google Scholar] [CrossRef]
- Stevulova, N.; Kidalova, L.; Junak, J.; Cigasova, J.; Terpakova, E. Effect of hemp shive sizes on mechanical properties of lightweight fibrous composites. Procedia Eng. 2012, 42, 496–500. [Google Scholar] [CrossRef]
- Arnaud, L.; Gourlay, E. Experimental study of parameters influencing mechanical properties of hemp concretes. Constr. Build. Mater. 2012, 28, 50–56. [Google Scholar] [CrossRef]
- Kosiński, P.; Brzyski, P.; Tunkiewicz, M.; Suchorab, Z.; Wiśniewski, D.; Palczynski, P. Thermal Properties of Hemp Shives Used as Insulation Material in Construction Industry. Energies 2022, 15, 2461. [Google Scholar] [CrossRef]
- ISO 10211:2017; Thermal bridges in building construction. Heat flows and surface temperatures—Detailed calculations. International Organization for Standardization: Geneva, Switzerland, 2017.
- Mitchell, R.; Kohler, C.; Zhu, L.; Arasteh, D.; Carmody, J.; Huizenga, C.; Curcija, D. Therm 6.3/Window 6.3 NFRC Simulation Manual; Lawrence Berkeley National Laboratory: Berkeley, CA, USA, 2011. [Google Scholar]
- Decree of the Minister of Infrastructure and Development from 27th February 2015 on the Methodology of Determining Energy Characteristics of Buildings or Their Parts and Energy Certificates. J. Laws Repub. Pol. 2015, 376.
- Wittchen, K.B.; Johnsen, K.; Grau, K. BSim User’s Guide; Danish Building Research Institute: Hørsholm, Denmark, 2004. [Google Scholar]
- Lomas, K.J.; Eppel, H.; Martin, C.J.; Bloomfield, D.P. Empirical Validation of Building Energy Simulation Programs Using Test Room Data; Volume 1: Final Report; International Energy Agency: Paris, France, 1994. [Google Scholar]
- Woloszyn, M.; Rode, C. Final Report Annex 41. Whole Building Heat, Air and Moisture Response; Volume 1: Modelling Principles and Common Exercises; IEA Annex 41, Subtask 1; International Energy Agency: Paris, France, 2008. [Google Scholar]
- Roels, S. Final Report Annex 41. Whole Building Heat, Air and Moisture Response; Volume 2: Experimental Analysis of Moisture Buffering; IEA Annex 41, Subtask 2; International Energy Agency: Paris, France, 2008. [Google Scholar]
- EN 15265:2011; Thermal Performance of Buildings. Calculation of Energy Needs for Space Heating and Cooling Using Dynamic Methods. General Criteria and Validation Procedures. European Committee for Standarization: Brussels, Belgium, 2011.
- Grudzińska, M. Glazed Balconies as Passive Greenhouse Systems. Assessment of the Functioning in Polish Climatic Conditions; Lublin University of Technology Publishing House: Lublin, Poland, 2020; ISBN 978-83-7947-447-9. [Google Scholar]
- Grudzińska, M. Validation of a dynamic simulation program according to EN ISO 15265. E3S Web Conf. 2018, 49, 00040. [Google Scholar] [CrossRef]
- Grudzińska, M. Thermal and optical properties of the sunspace casing as factors influencing temperature rise in greenhouse systems. Materials 2021, 14, 7411. [Google Scholar] [CrossRef]
- Thullner, K. Low-Energy Buildings in Europe-Standards, Criteria and Consequences. A Study of Nine European Countries; Rapport TVIT--10/5019, Rapport EBD-R--10/32; Lund University: Lund, Sweden, 2010. [Google Scholar]
- Hoyle, B. Low-Energy Building Engineering; English Press: Delhi, India, 2011. [Google Scholar]


| Composite Symbol | Binder: Hemp Shives Ratio | Binder: Water Ratio | Apparent Density [kg/m3] | Thermal Conductivity Coefficient [W/(m·K)] | Standard Deviation [W/(m·K)] |
|---|---|---|---|---|---|
| Floor mix | 2.1:1 | 1:1.35 | 627.5 | 0.112 | ±0.005 |
| Roof mix | 1:1 | 1:1.5 | 238.0 | 0.065 | ±0.002 |
| Wall mix | 1.4:1 | 1:1.45 | 362.5 | 0.080 | ±0.002 |
| Building Material/Element | Thermal Properties |
|---|---|
| Hemp-lime mix (wall) | λ = 0.08 W/(m·K) |
| Hemp-lime mix (floor) | λ = 0.065 W/(m·K) |
| Timber construction element | λ = 0.16 W/(m·K) |
| OSB board | λ = 0.13 W/(m·K) |
| Lime plaster | λ = 0.70 W/(m·K) |
| Gravelite | λ = 0.1 W/(m·K) |
| Concrete | λ = 1.3 W/(m·K) |
| Surface | Temperature | Surface Resistance | Description |
|---|---|---|---|
| Internal | +21 °C | 0.13 (m2·K)/W | Heat flow horizontal, simplified * |
| Internal | +21 °C | 0.10 (m2·K)/W | Heat flow upwards, simplified * |
| Internal | +21 °C | 0.17 (m2·K)/W | Heat flow downwards, simplified * |
| External | −18 °C | 0.04 (m2·K)/W | Simplified * |
| Cut-off planes | - | - | Adiabatic |
| Thermal Bridge | Share in the Total Heat Transfer [%] | |
|---|---|---|
| Timber Frame Located Centrally in Relation to Wall Thickness | Timber Frame Located on the Inner Side of the Wall | |
| External corner | −2.5 | −2.3 |
| Connection of a wall and a ceiling | 0.3 | 0.3 |
| Connection of a roof and a knee wall | −0.9 | −0.6 |
| Connection of a roof and a gable wall | −2.3 | −2.1 |
| Connection of a wall and a ground floor | −8.3 | −8.2 |
| Window placement in a wall | 3.5 to 3.8 | 3.1 to 3.3 |
| Sum | −10.2 to −9.9 | −9.8 to −9.6 |
Publisher’s Note: MDPI stays neutral with regard to jurisdictional claims in published maps and institutional affiliations. |
© 2022 by the authors. Licensee MDPI, Basel, Switzerland. This article is an open access article distributed under the terms and conditions of the Creative Commons Attribution (CC BY) license (https://creativecommons.org/licenses/by/4.0/).
Share and Cite
Brzyski, P.; Grudzińska, M.; Böhm, M.; Łagód, G. Energy Simulations of a Building Insulated with a Hemp-Lime Composite with Different Wall and Node Variants. Energies 2022, 15, 7678. https://doi.org/10.3390/en15207678
Brzyski P, Grudzińska M, Böhm M, Łagód G. Energy Simulations of a Building Insulated with a Hemp-Lime Composite with Different Wall and Node Variants. Energies. 2022; 15(20):7678. https://doi.org/10.3390/en15207678
Chicago/Turabian StyleBrzyski, Przemysław, Magdalena Grudzińska, Martin Böhm, and Grzegorz Łagód. 2022. "Energy Simulations of a Building Insulated with a Hemp-Lime Composite with Different Wall and Node Variants" Energies 15, no. 20: 7678. https://doi.org/10.3390/en15207678
APA StyleBrzyski, P., Grudzińska, M., Böhm, M., & Łagód, G. (2022). Energy Simulations of a Building Insulated with a Hemp-Lime Composite with Different Wall and Node Variants. Energies, 15(20), 7678. https://doi.org/10.3390/en15207678