1. Introduction
One of the basic elements of the power transformer is the insulation system. The operational reliability of transformers and their service lives is largely determined by the quality of the electrical insulation. Currently, most cellulose materials and petroleum-based mineral oils are used for the production of transformers electrical insulation [
1,
2,
3,
4]. After completion, the transformer is hermetically sealed. Then, a vacuum drying of the insulation is performed. Before mineral oil is poured into the transformer tank, it is treated to reduce the moisture level to about 3–7 ppm and for removing dissolved gases [
5,
6,
7,
8]. Then, also under vacuum, the transformer is filled with heated oil. This improves the insulating properties of the system, accelerates the impregnation of cellulose with oil and removes gas bubbles, which are the source of partial discharges [
9,
10,
11]. After these operations, the moisture level of cellulose in the transformer insulation does not exceed 0.8% by weight. Power transformers are designed to operate for at least 25 years. Due to many years of transformer operations (25 and more years), the moisture content of cellulose may increase to 5% by weight and even higher. The moisture increase usually takes place as follows. Moisture enters the transformer tank and then dissolves into the oil. The oil movement, caused by convection or forced circulation, causes the water molecules to be delivered to the cellulose, where they are absorbed. This is due to the fact that the solubility of water in cellulose is about 1000 times greater than in insulating oil [
12]. The value of 5% by weight is, in a sense, the critical value. Exceeding this value may lead to transformer failure [
13,
14,
15]. Diagnostic methods, often based on nondestructive electrical methods, are used to determine the moisture level and other possible insulation defects that may arise over many years of operation. They are: Return Voltage Measurement (RVM) [
16,
17,
18], Polarization Depolarization Current (PDC) [
19,
20,
21] and Frequency Domain Spectroscopy (FDS) [
22,
23,
24]. The FDS method is currently considered to be the most effective. The meters used in measurements with this method make it possible to determine the electrical parameters of the insulation. Their software can estimate the moisture level of cellulose. In the works [
25,
26], it was established that the cellulose moisture levels estimated by using FDS meters differ from the actual ones. This may be a result from the use of conductivity and dielectric relaxation models that do not accurately describe the processes occurring in cellulose–oil insulation. The models often used to analyze the FDS measurement results are: Debye’s [
27], Cole-Cole [
28,
29], Dawidson-Cole [
30,
31] and Havriliak-Nagami [
32]. These models assume that, when the frequency tends toward zero (constant voltage), the conductivity should also tend toward zero. This is inconsistent with all known test results for which the conductivity at ultra-low frequencies is a constant value. It was also found that, for a moist pressboard impregnated with insulating oil, in the ultra-low frequency region, the DC (Direct Current) and AC (Alternating Current) conductivity values are equal [
33]. The correct determination of the cellulose moisture level in transformers can only be achieved with the use of a physical model that faithfully describes the processes of conduction and dielectric relaxation occurring in the insulation.
Pressboard, impregnated with oil, is a two-phase composite material. Moistening of the pressboard causes the composite to become a three-phase one. Measurements of the DC conductivity dependence on the water content showed that the conductivity of the composite is caused by the presence of water. Conduction in the composite is determined by the quantum mechanical phenomenon of electron tunneling between water molecules. In the works [
34,
35], to analyze the AC conductivity dependence on the moisture content, the DC and AC conductivity model, determined by the quantum mechanical phenomenon of electron tunneling between potential wells with nanometer dimensions proposed in publications [
36,
37,
38], was used. This model has been experimentally verified for semiconductors [
39] and nanocomposites [
40,
41,
42,
43]. Based on the analysis performed in the works [
34,
35], it was found that water is present in the oil-impregnated pressboard in the form of nanodrops with a diameter of about 2.2 nm. Each nanodrop contains, on average, approximately 200 water molecules. In such a system, tunneling of the electron takes place from one nanodrop to the other. As a result of tunneling, an electric current flow and electric dipole creation occurs. This causes additional polarization of the material [
44,
45,
46]. After the relaxation time has elapsed, the electric field of the positively charged nanodrop causes the electron to return to the nanodrop from which it started tunneling. This leads to the dipole vanishing. The value of the relaxation time depends on the average distance between the nanodrops and the temperature [
34].
Usually, in the FDS method, the diagnosis of insulation by the frequency analysis of the loss tangent is used; see, for example, [
47,
48].
As is known, the transformer insulation system is a complex cylindrical system consisting of barriers, spacers and oil channels. CIGRE in publication [
49] proposed a simplified model of transformer insulation. It is a series parallel flat capacitor system with two parameters describing the geometry of the insulation system. Parameter
X describes the contribution of the barriers in the insulation system geometry. Parameter
Y describes the contribution of the spacers in the insulation system geometry. Application of the XY CIGRE model significantly simplifies the analysis of transformer insulation diagnostic results based on the loss tangent measurements. The value of the loss tangent in the CIGRE model is influenced by both the parameters of the moist oil-impregnated pressboard (barriers and spacers) and the parameters of the mineral oil (oil channels). This is most important when the moisture content reaches a limit of about 5% by weight, which may result in the failure of the transformer. The electrical properties of the oil-impregnated pressboard, moistened in a manner identical to the moisturization process in transformers, due to a moisture content of 5 ± 0.2% by weight was examined in the works [
26,
33,
46].
The XY system was investigated in [
26], in which the barriers and spacers were made with pressboard plates with a moisture content of 5 ± 0.2% by weight. The oil channel was filled with factory new mineral insulating oil. It was found that, in order to adjust the loss tangent waveforms for the system made according to CIGRE, the software of the FDS meter introduces gigantic, i.e., more than six orders of magnitude fluctuations of the oil conductivity during the transition from one measuring temperature to the next. Such large, abrupt changes in conductivity are rather impossible. This means that the matching algorithm used in the FDS meter inaccurately reflects the temperature dependence of the AC parameters of the oil.
As it is known [
12], along with the increase of the moisture content in the pressboard, which is a part of the transformer insulation, the oil moisture also increases. Under the conditions of the thermodynamic equilibrium between the moisture in the oil and the pressboard, the moisture content of the oil is several orders lower than the moisture content of the pressboard. As the temperature of the transformer insulation increases, moisture diffuses from the cellulose into the oil, causing an increase of oil moisture content. The time needed to establish a thermodynamic equilibrium depends on the values of the initial and final temperatures. When the temperature is lowered, the process takes place in the opposite direction. Such changes in the moisture level may cause changes in the electrical parameters of the oil. This means that, for the correct determination of the cellulose component moisture content, by measuring the loss tangent of the power transformer insulation, one should take into account the changes in the electrical parameters of the insulating oil, which are related to the oil moisture content increase, caused by changes in the insulation temperature.
The aim of this work was to develop a method of oil moistening identical to the moisturization process in transformers and to measure the frequency and temperature dependencies of the basic electrical parameters of moistened oil. The obtained measurement results were compared with those for brand new oil in order to analyze the influence of moisture on the electrical parameters of the oil.
2. Materials and Methods
The alternating current flow in dielectrics is described by the second Maxwell equation [
50]:
where:
—magnetic field strength vector,
—conduction current density,
—displacement current density,
E0—electric field amplitude, σ(ω)—conductivity, ε′(ω)—relative dielectric permittivity, ε
0—vacuum dielectric permittivity, ω = 2πf—circular frequency and
f—frequency.
Equation (1) shows that the current flow in the dielectric is determined by two material parameters: conductivity and permittivity. Conductivity describes the ability of a material to conduct an electric current. Permittivity characterizes the polarization of the material. Formula (1) shows that the phase shift angle between the conduction current and the displacement current vectors is −90°. This means that, in a real dielectric, the phase shift angle φ takes values in range 0° ≥ φ ≥ −90°.
So-called impedance (admittance) meters are used to measure the AC properties of dielectrics. Determination of the transformer insulation parameters is performed with the use of dedicated meters called FDS (Frequency Domain Spectroscopy) meters. Admittance or FDS meters measure values of two basic parameters, which, in the case of dielectrics, are the admittance Y and the phase shift angle φ. The admittance is equal to the quotient of the current amplitude and supply voltage amplitude [
51]:
where:
Y—admittance,
V—supply voltage amplitude, and
I—electric current amplitude.
The phase shift angle is equal to the difference of the angles at which instantaneous values of the current and voltage cross zero [
51]:
where: φ—phase shift angle, φ(
i = 0)—the angle at which the instantaneous value of the current becomes zero and φ(
v = 0)—the angle at which the instantaneous voltage value is zero.
Based on the admittance
Y value and the phase shift angle φ in the equivalent parallel circuit, the conductance
Gp and capacitance
Cp are determined [
51]:
In the study, a flat capacitor was used, in which the oil was poured between the voltage and measuring electrodes. Conduction and displacement currents flow between the two flat electrodes. A parallel equivalent circuit corresponds to this. The material parameters included in the second Maxwell equation—conductivity and permittivity—are calculated on the basis of the geometrical dimensions of the dielectric and the
Gp and
Cp values [
52]:
where: σ—conductivity,
Gp—conductance,
d—oil layer thickness and
S—measuring the electrode surface area.
where:
Cp—capacity, ε
o—dielectric permittivity of vacuum,
d—oil layer thickness,
S—measuring electrode surface area and ω—circular frequency.
To analyze the results of the transformer insulation tests, a number of publications [
53,
54,
55] use the loss factor ε′′, otherwise known as the imaginary component of the complex permittivity:
Substituting the conductivity value given by Formula (6) into Formula (8) shows:
Formulas (6), (7) and (9) show that the geometrical dimensions of the dielectric are needed to determine the conductivity, permittivity and loss factor. These dimensions are easy to obtain in laboratory tests. However, in the measurements of industrial equipment, such as power transformers, especially those manufactured several decades ago, it may be difficult or even unattainable. Therefore, the loss tangent tanδ is often used to analyze the test results of the devices:
where:
IR—resistance component of the electric current and
IC—capacitive component of the electric current.
Substituting Formulas (7) and (9) into Formula (10), we find:
As can be seen from Formula (11), the value of tanδ does not depend on the geometrical dimensions of the homogeneous material. To determine tanδ, it is enough to specify the phase shift angle φ.
Formulas (4)–(11) show that the values of conductance (resistance), capacitance, conductivity, permittivity, loss factor and loss tangent are functions of basic parameters, such as admittance and phase shift angle, determined by the admittance (impedance) meters.
In this work, the measuring system described in the works [
25,
46,
56,
57,
58] was used for the tests. The electrical parameters of the oil were determined using the DIRANA meter—FDS-PDC dielectric response analyzer (OMICRON Energy Solutions GmbH, Berlin, Germany) [
59]. The measurements were made in a thermostatic chamber at six measuring temperatures from 293.15 K to 333.15 K with steps of 8 K. The uncertainty of measuring and maintaining the temperature during the tests was not worse than ±0.01 K. The frequency range of the Diran meter was from 0.0001 Hz to 5000 Hz. In the frequency range of 0.001 Hz–5000 Hz, the measurements were made at 10 points per decade, while, in the range of 0.0001 Hz–0.001 Hz, they were made at 6 points per decade. The measurement frequencies were chosen in such a way that, on the plot with double logarithmic coordinates, the measurement points were evenly distributed along the
x-axis.
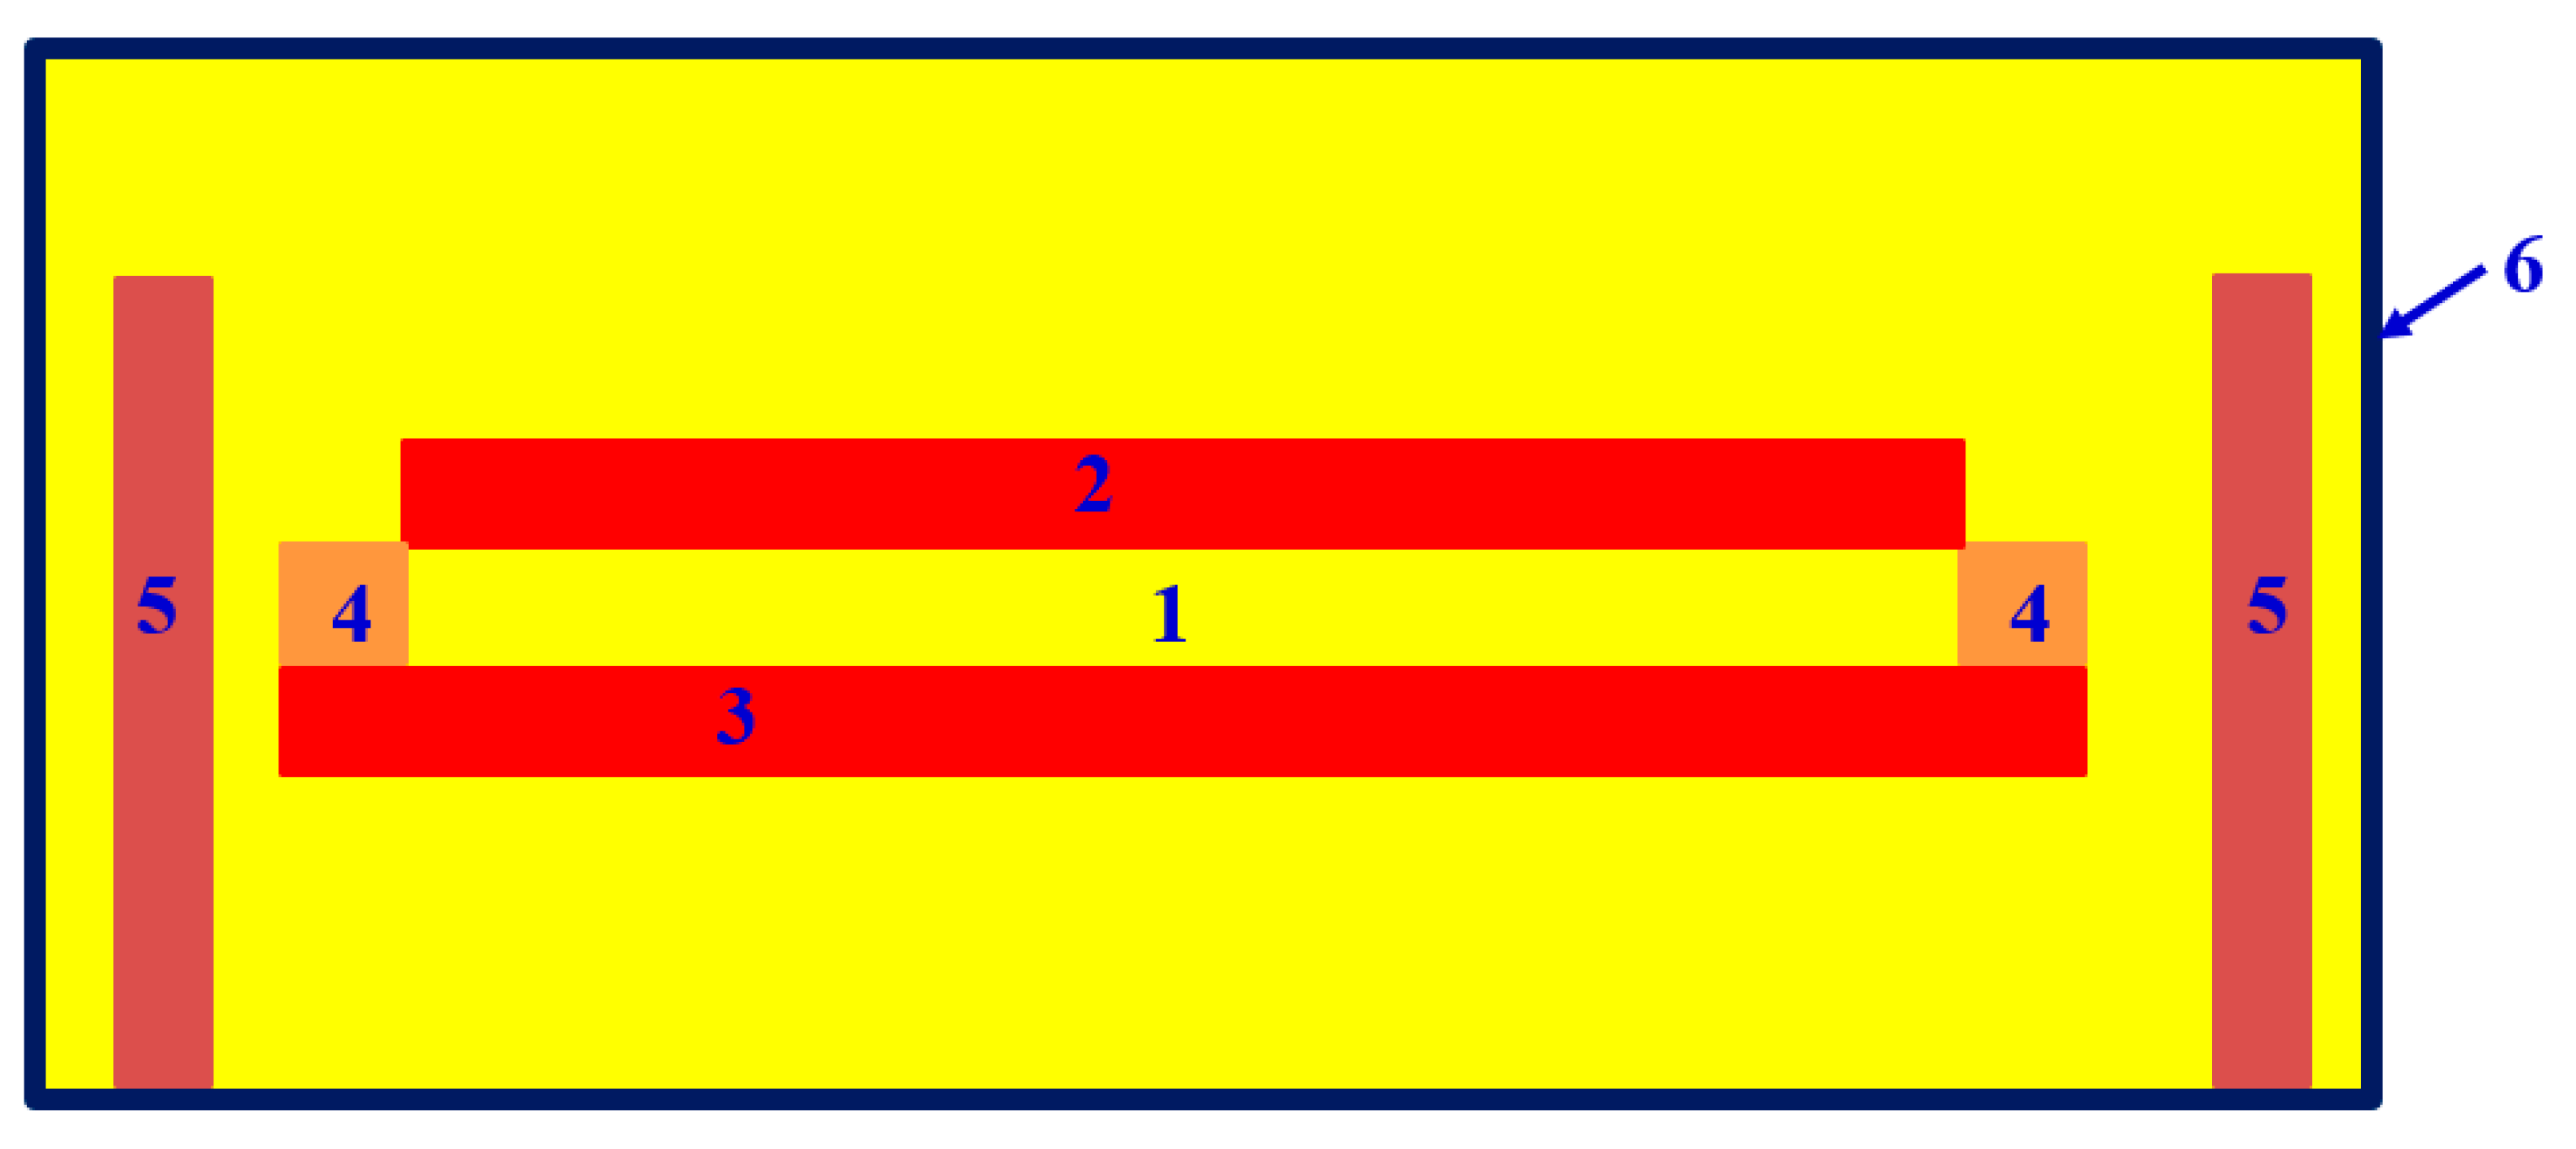
In order to test the dielectric properties of the oil, a measuring capacitor was used, the diagram of which is shown in
Figure 1.
The upper part of the capacitor, which includes the measuring electrode, is separated from the voltage electrode by 6 spacers made of insulating material insoluble in oil. The capacitor was then placed in the glass vessel and filled with factory new insulating oil. After being sealed, the vessel was placed in a thermostatic chamber, and the first series of tests was carried out to measure the AC properties of brand new oil at six temperatures. Factory new mineral-insulating oil produced by the Nynas Company, intended for power transformers, was used in the tests. The moisture content of the oil did not exceed 5 ppm.
In order to investigate the influence of moisture on the oil electrical properties, a second series of tests was performed. This experiment accurately reflected the process of moisture exchange between the oil and pressboard, taking place in a highly moistened transformer. For this purpose, pressboard plates with a moisture content of 5 ± 0.2% by wt. were placed in a vessel with brand new oil (
Figure 1). The volume of the pressboard was about 10 times smaller than the volume of the oil. Such a ratio of pressboard to oil is typical for power transformers with a voltage rating of 110 kV and more. After being sealed, the vessel was placed in a thermostatic chamber and left at a temperature of 293.15 ± 0.01 K for about 100 h. During this period, moisture diffused from the moistened pressboard into the oil until reaching the thermodynamic equilibrium between the oil, water and pressboard, described by Formula (12). The new method of moistening the oil is fundamentally different from those known and described in the literature. It is obvious that the oil moisture in the method developed by us increases, as in the transformers, along with the temperature increase. This causes a temperature variation in the AC parameters, other than when testing the constant moisture oil, for example, taken from a transformer. Then, electrical tests were performed at the temperature of 293.15 K. After the tests were completed, the next temperature was set to 301.15 K, and after it was reached, the oil was left at this temperature for about 15 h. During this time, another thermodynamic equilibrium between the oil and the moistened pressboard was achieved with a higher moisture content in the oil. After the electrical measurements were made, the next temperatures were set, the capacitor with oil was heated in them for 15 h and subsequent measurements were made. In this way, the dependencies of admittance
Y, phase shift angle φ, alternating current conductivity σ
AC, permittivity ε′ and loss tangent tanδ were obtained for brand new oil and for oil moistened by moisture migration from the pressboard.
3. Test Results and Analysis of Mineral Insulating Oil Electrical Properties
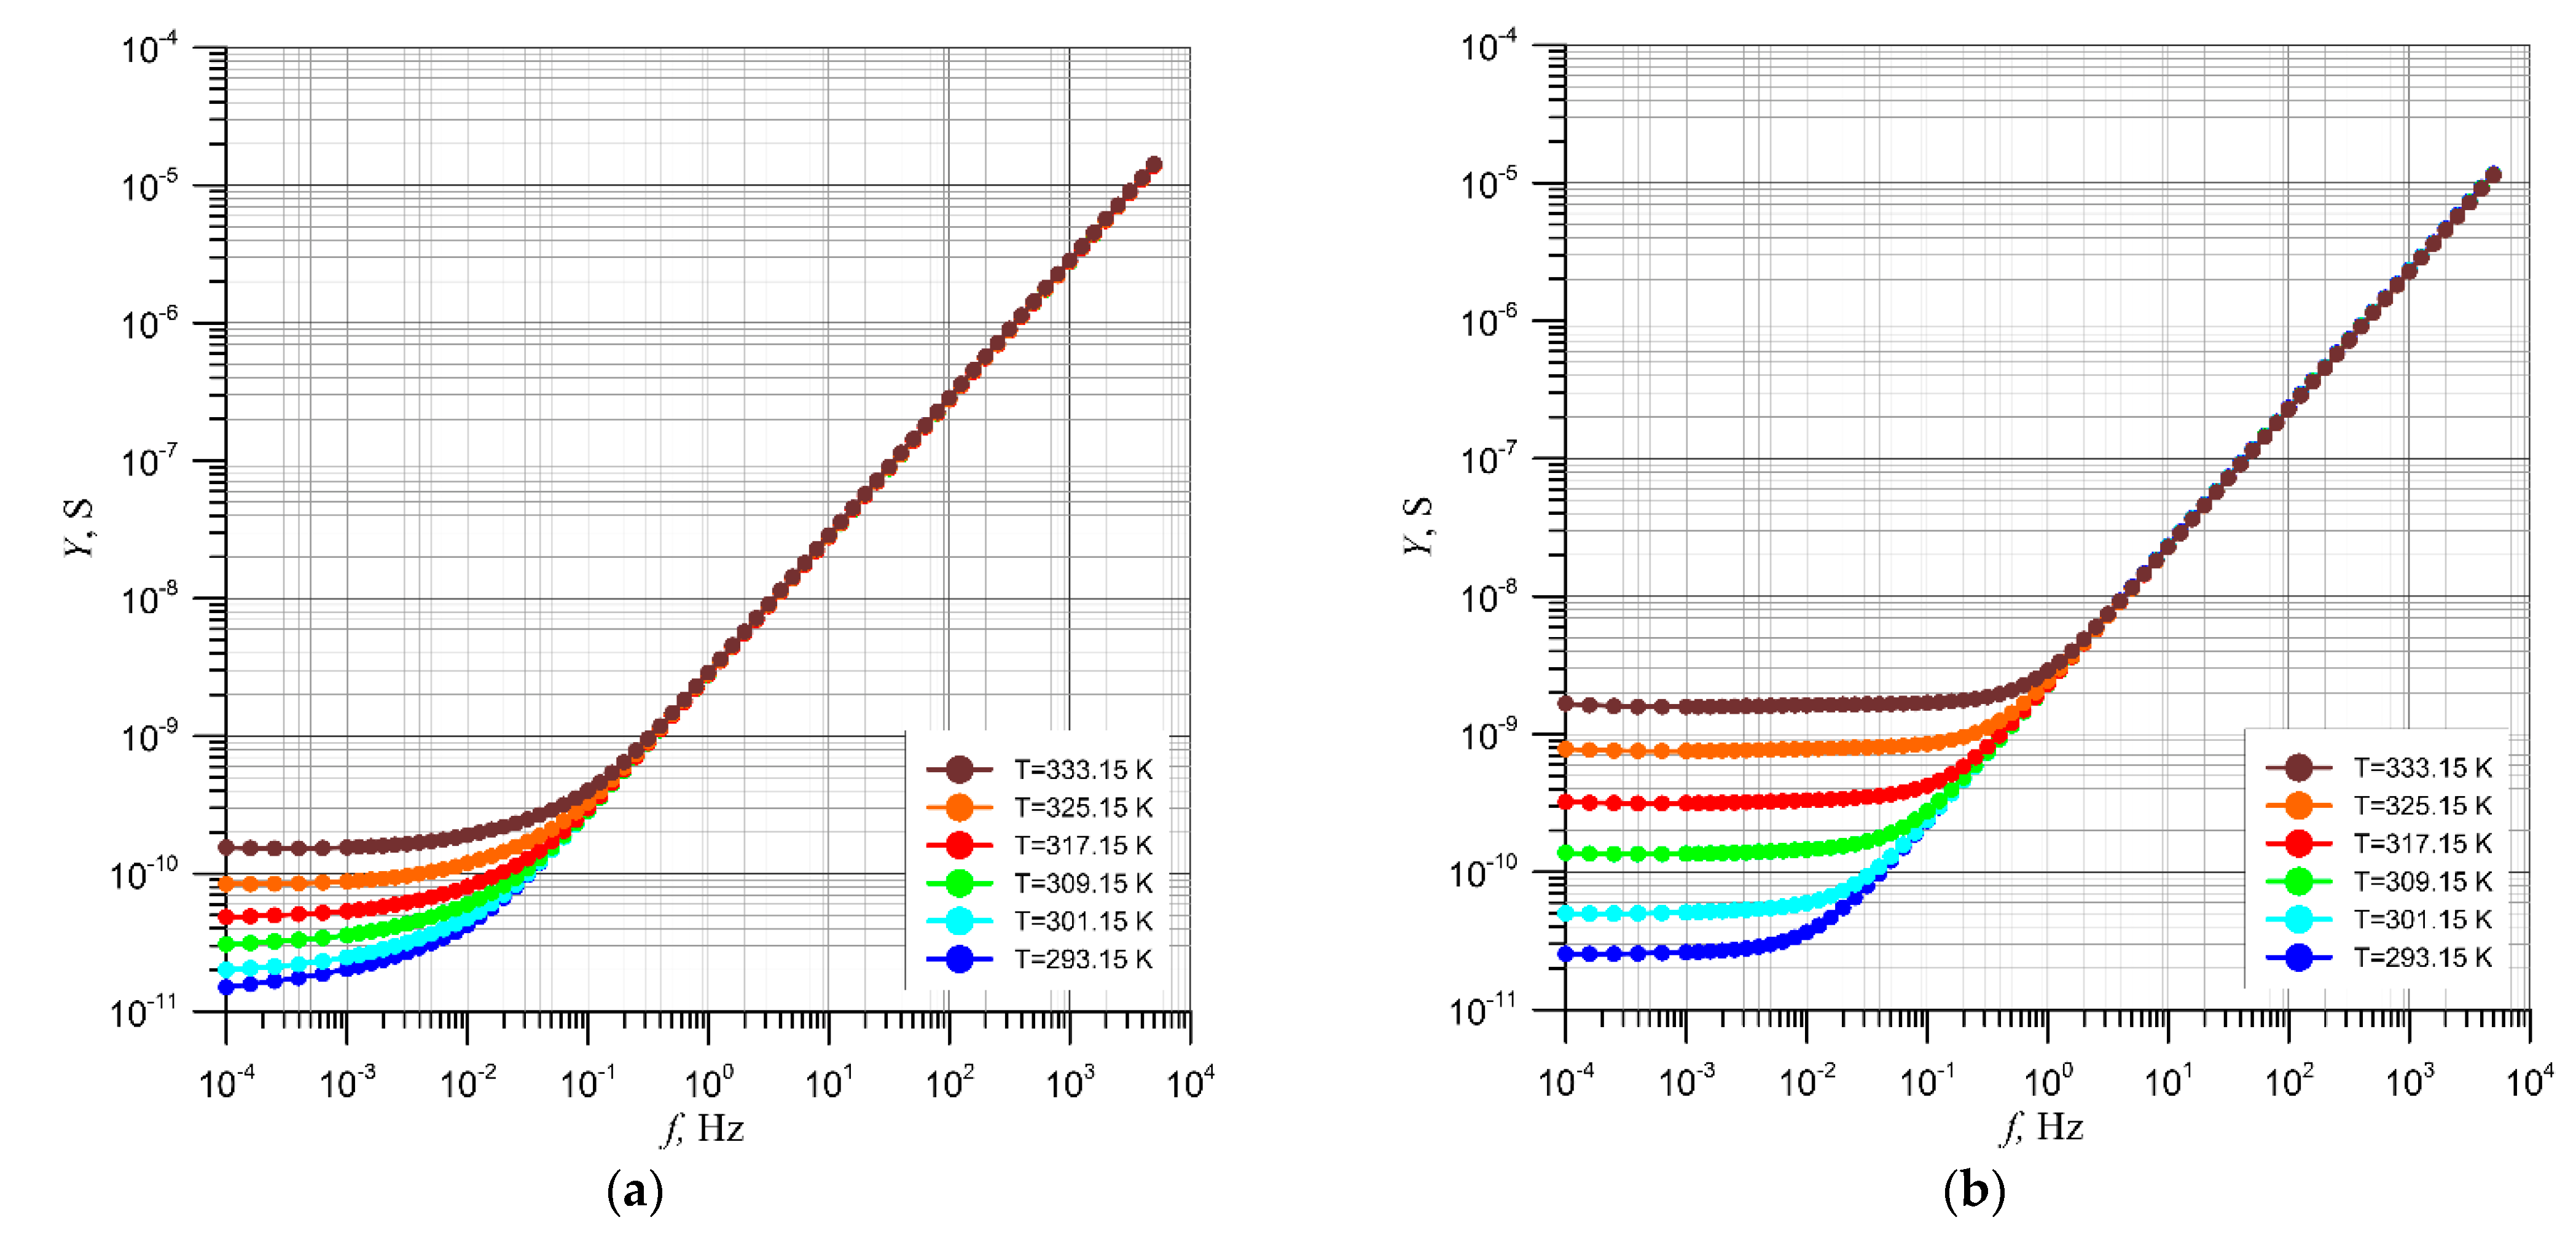
Figure 2 shows the admittance dependencies on the frequency and temperature, determined for a brand new insulating oil and for oil moistened in the same way as the oil moistening process in a power transformer with a high moisture content in cellulose. In the second case, the moisture diffused into the oil from pressboard moistened to 5% by weight. Such a moisture content in pressboard can be achieved after many years of a transformer operation.
The comparison of admittance curves obtained for the brand new and moistened oil shows that oil moistening has a significant impact on the obtained dependencies. In both cases, admittance is practically frequency-independent in the low-frequency region. In this frequency region, however, there is a dependence of admittance on temperature. As the frequency increases, the admittance slowly increases. As it is known [
33], the beginning of the admittance increase occurs close to the frequency defined by the dielectric relaxation time:
where:
f—admittance rise frequency and τ—dielectric relaxation time of oil.
Then, the linear dependence of the admittance on frequency is observed. The temperature dependence of admittance disappears. Significant differences between the admittance values of brand new and moistened oil occur in the low-frequency area. First, in the case of a moistened oil, the length of the constant admittance value section is increased. This means that, according to Formula (12), in the case of a moistened oil, the dielectric relaxation time is lowered. The comparison of the plots in
Figure 2a,b shows that the relaxation time of the moistened oil is about 10 times shorter than that of the brand new one. Secondly, as the temperature increases from 293.15 K to 333.15 K, the differences in the admittance values for the lowest frequency of 10
−4 Hz increase. For brand new oil, the values change about 10 times, and, for moisturized oil, about 100 times. This means that the changes in both the dielectric relaxation time and the low-frequency admittance values are undoubtedly related to the moisturization of the oil.
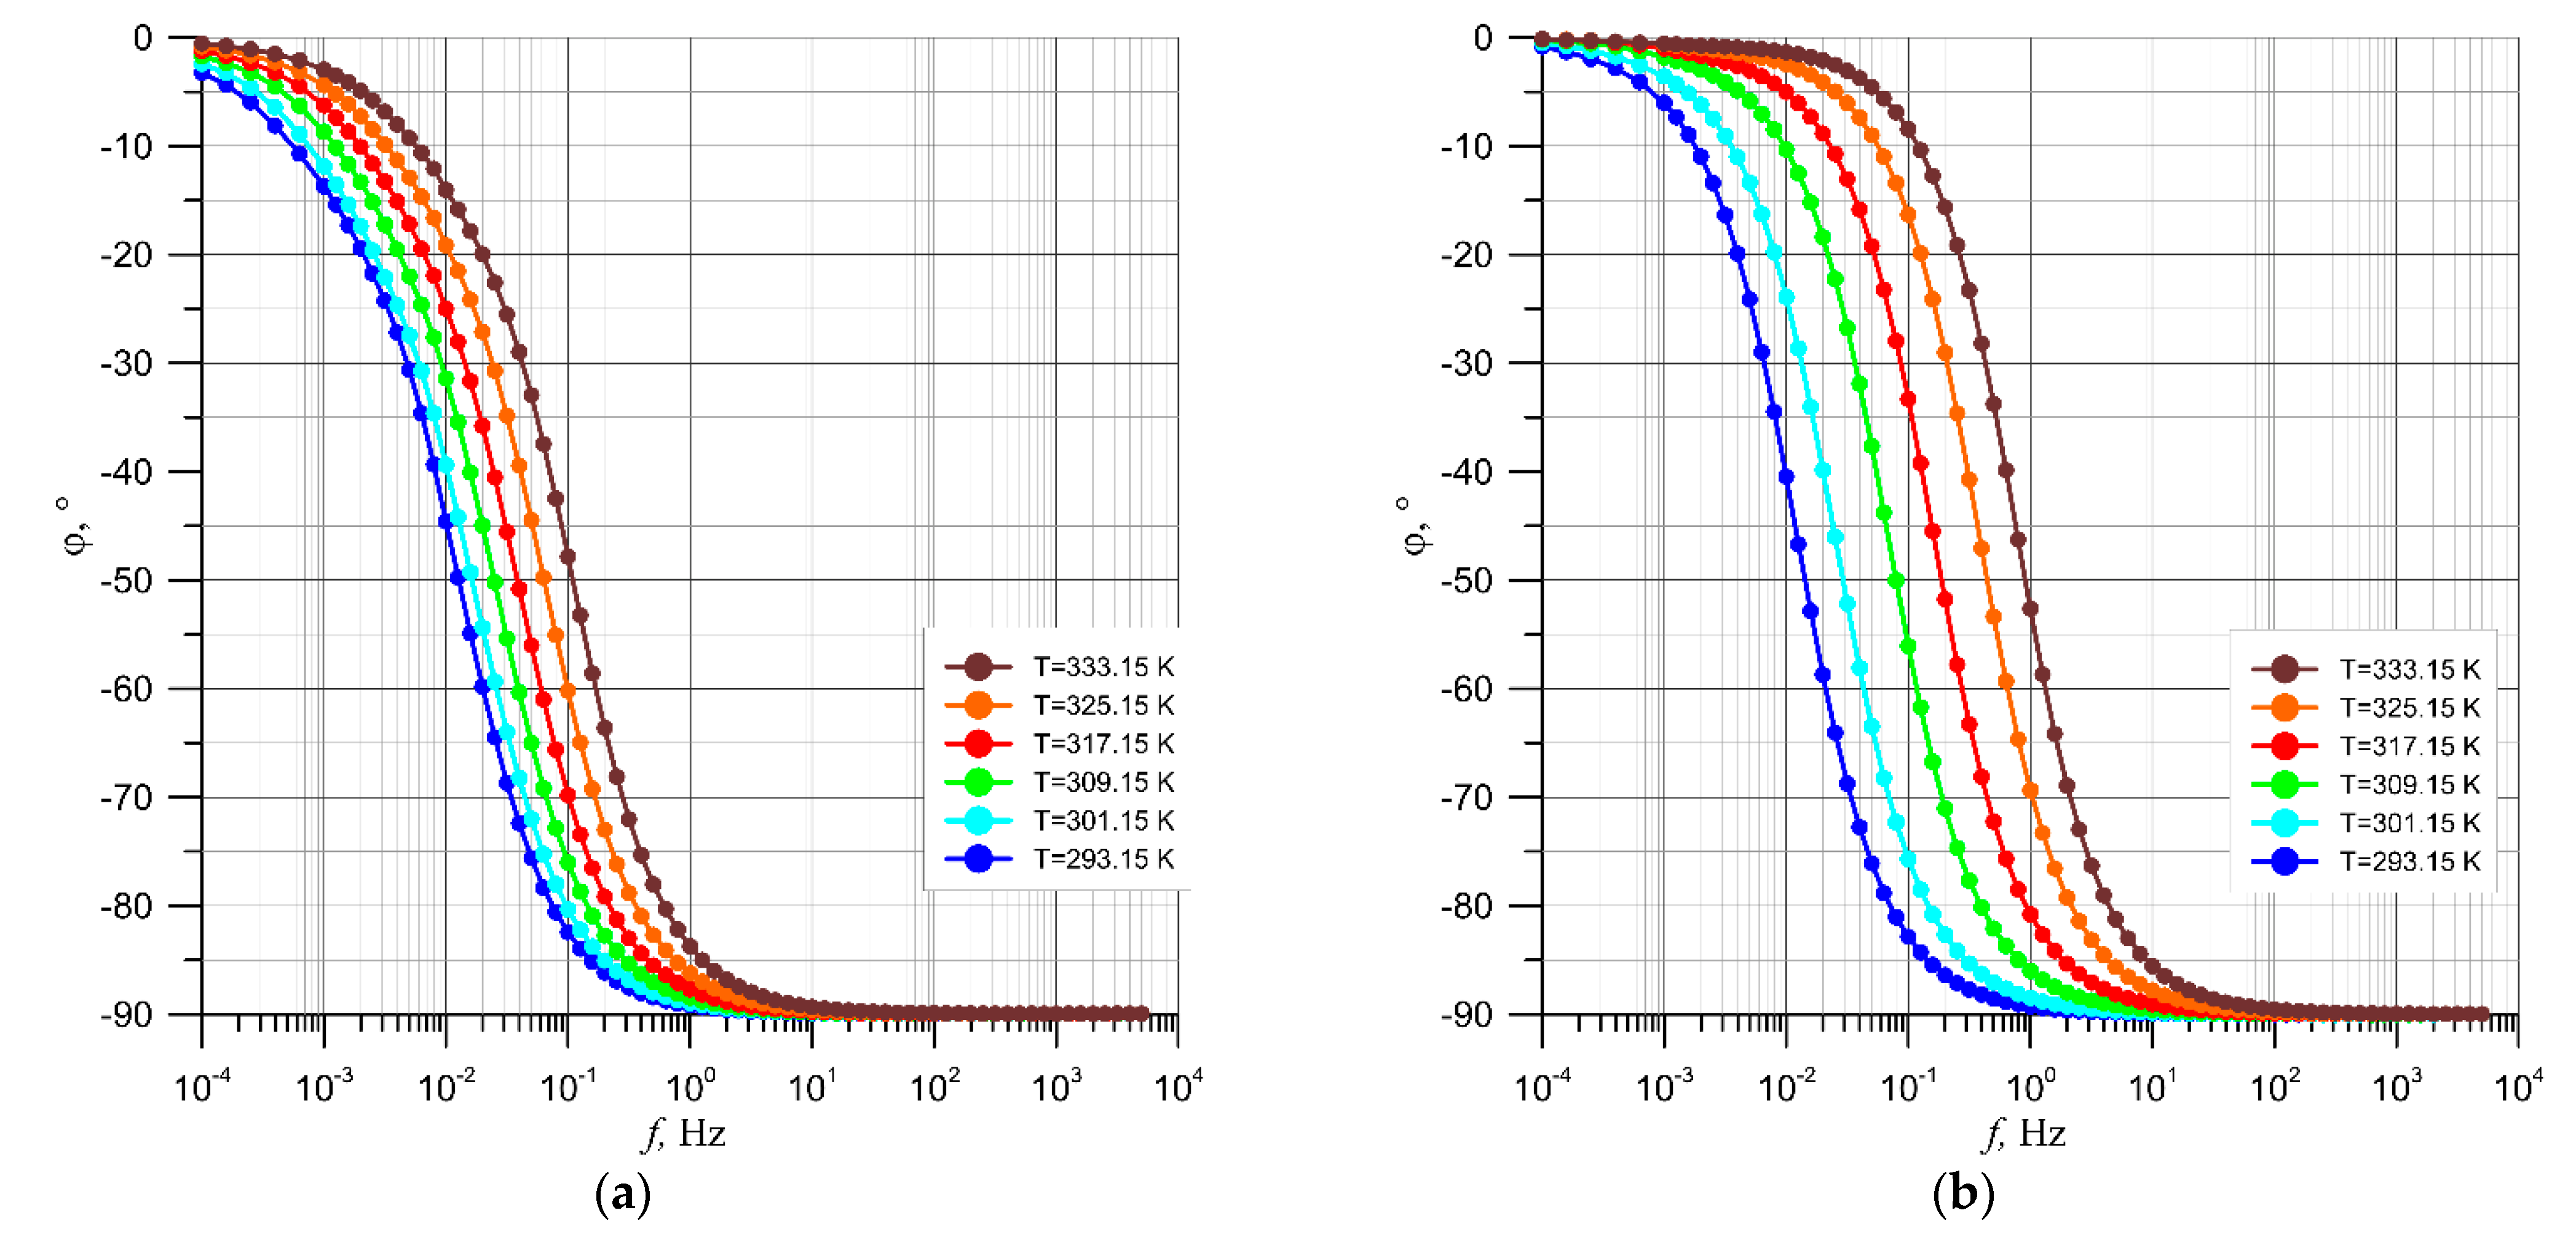
Figure 3 shows the phase shift angle dependencies on frequency and temperature for the brand new oil and for the moistened oil. The comparison of the plots clearly shows that, in the case of the phase shift angle, oil moistening undoubtedly influences the obtained curves. Firstly, in the moistened oil, the length of the segment in which the values of the angle φ are close to zero is lengthened. A value of φ close to zero means that mainly resistive-type conduction occurs in this frequency region. Secondly, in the region of higher frequencies, the rate of the phase shift angle modulus rise increases. Thirdly, due to the decrease in the value of the dielectric relaxation time, the influence of temperature on the plots shift to the area of higher temperatures increases.
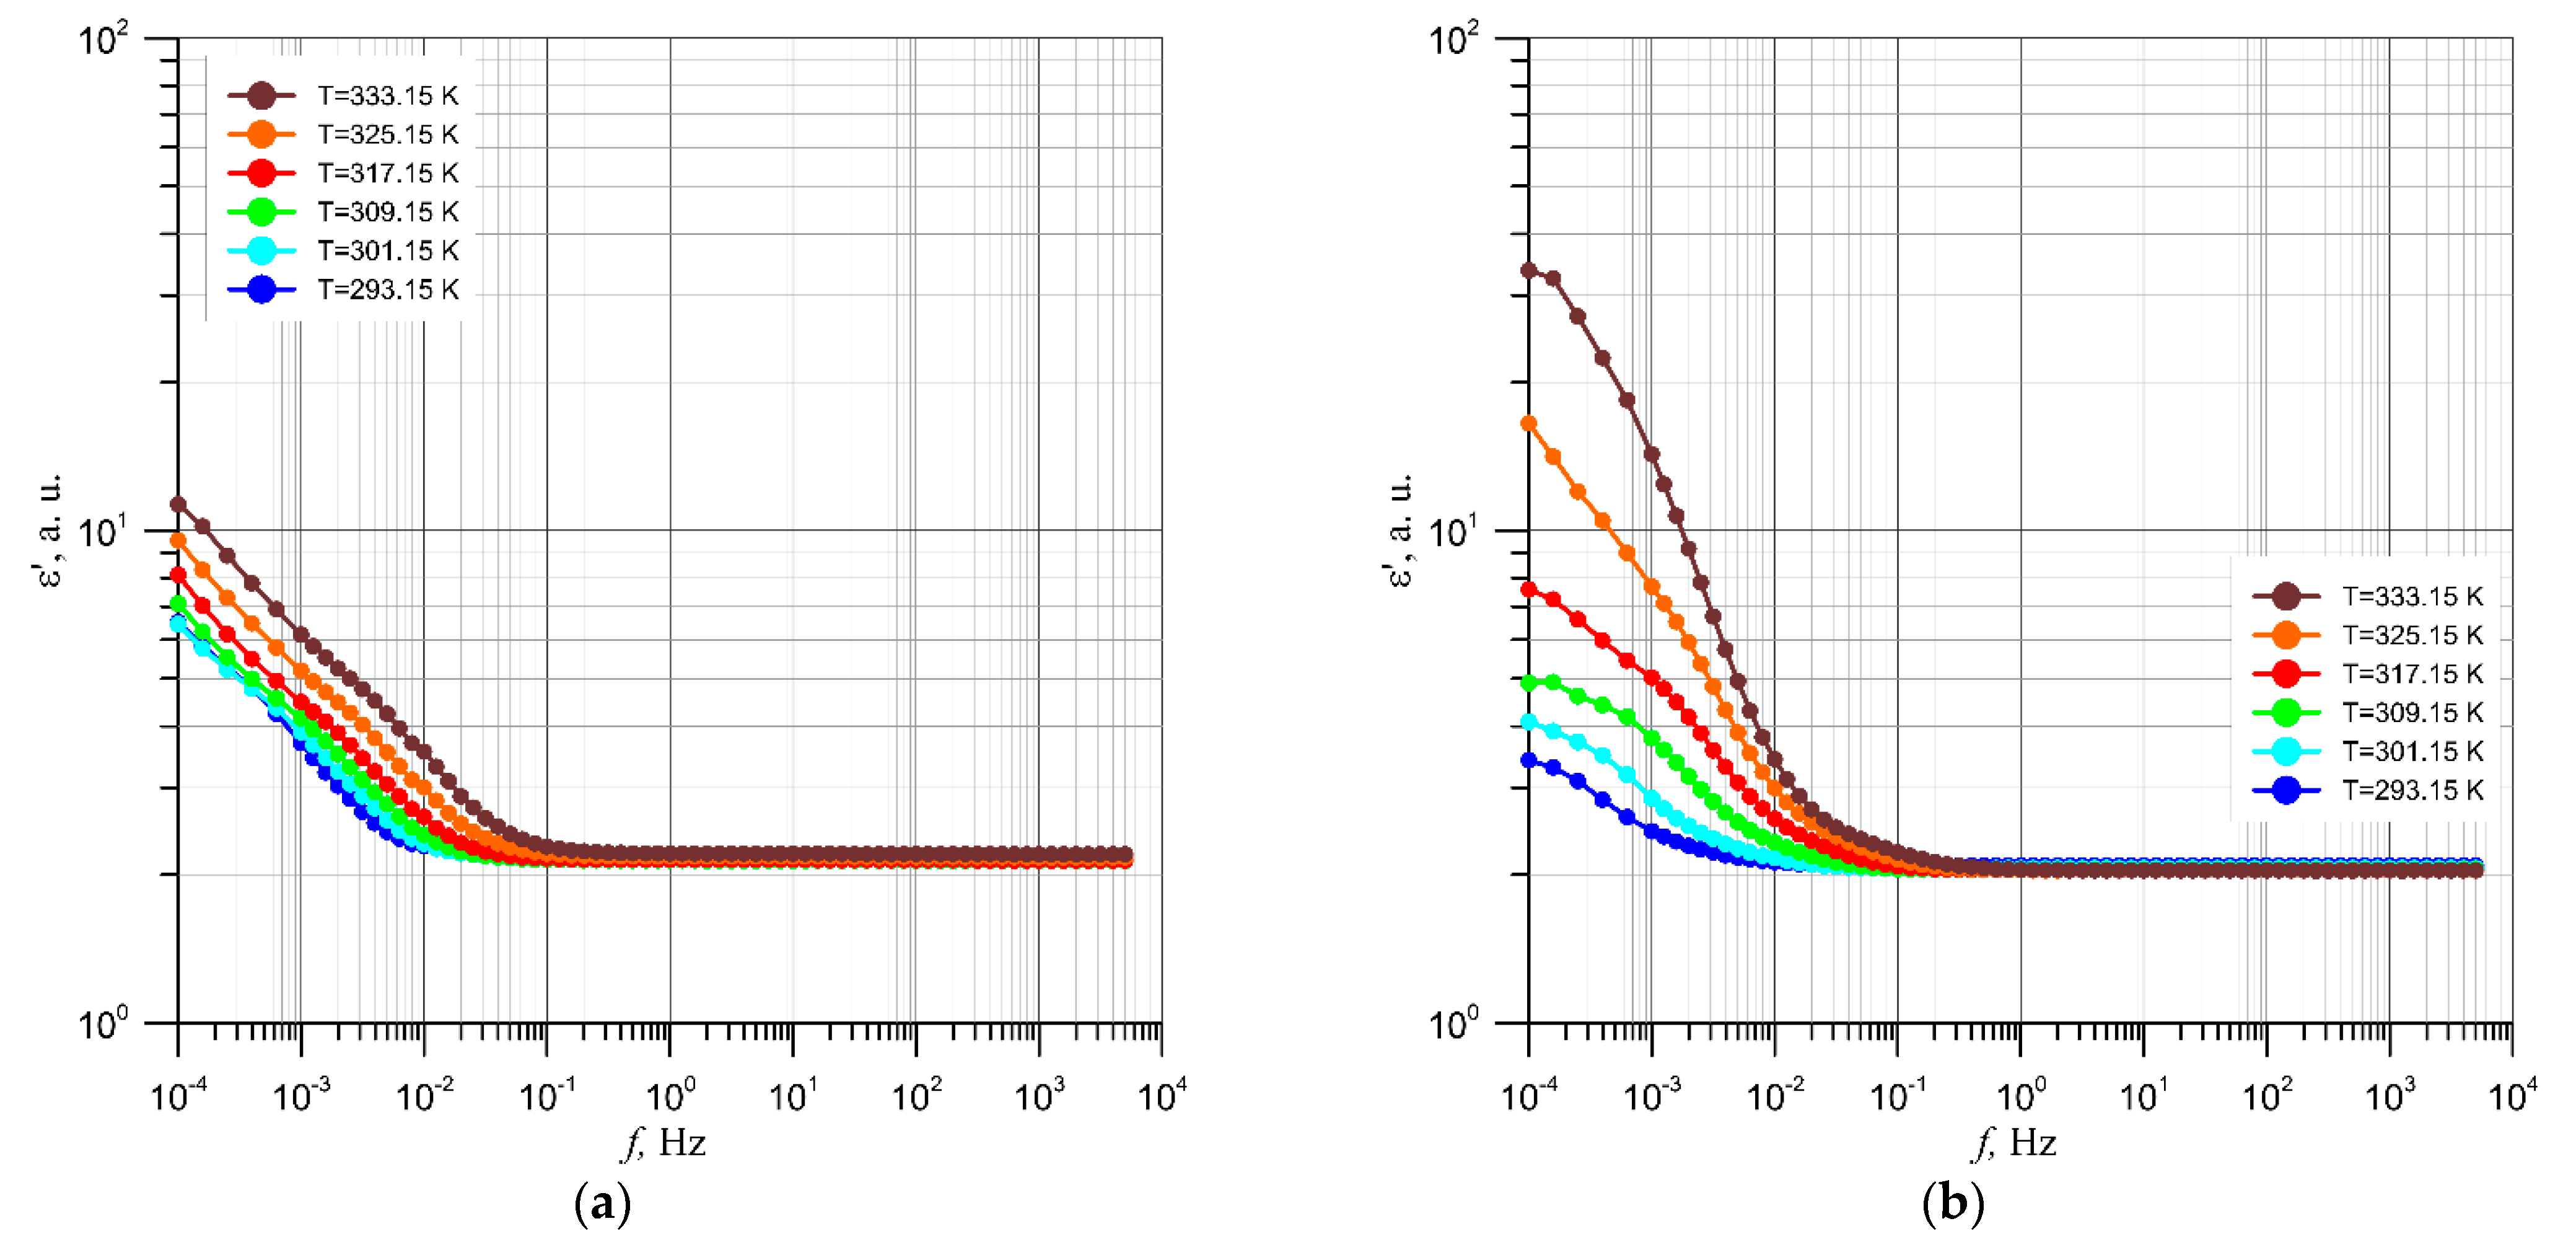
Figure 4 shows the dielectric permittivity dependence on frequency and temperature of brand new and moistened oil.
Figure 4a,b show that the permittivity of the oil in the frequency range above 0.1 Hz has a constant value of about 2.2. This is in line with the previously known results [
60]. In the low-frequency area (
f < 0.1 Hz), as the frequency decreases, the permittivity of the brand new oil increases from about three to about five times, depending on the measuring temperature. Oil moisturization causes changes in the permittivity curves in this frequency range. At temperatures from 293.15 K to 333.15 K, there is a slight decrease in permittivity, not exceeding two times. The degree of permittivity reduction is greatest at 293.15 K, and it decreases with the increasing temperature. For temperatures above 333.15 K, the permittivity starts to increase compared to brand new oil. For the highest temperature of 333.15 K, the increase is about three times. The observed changes in permittivity are related to the increase in oil moisture with the increasing temperature.
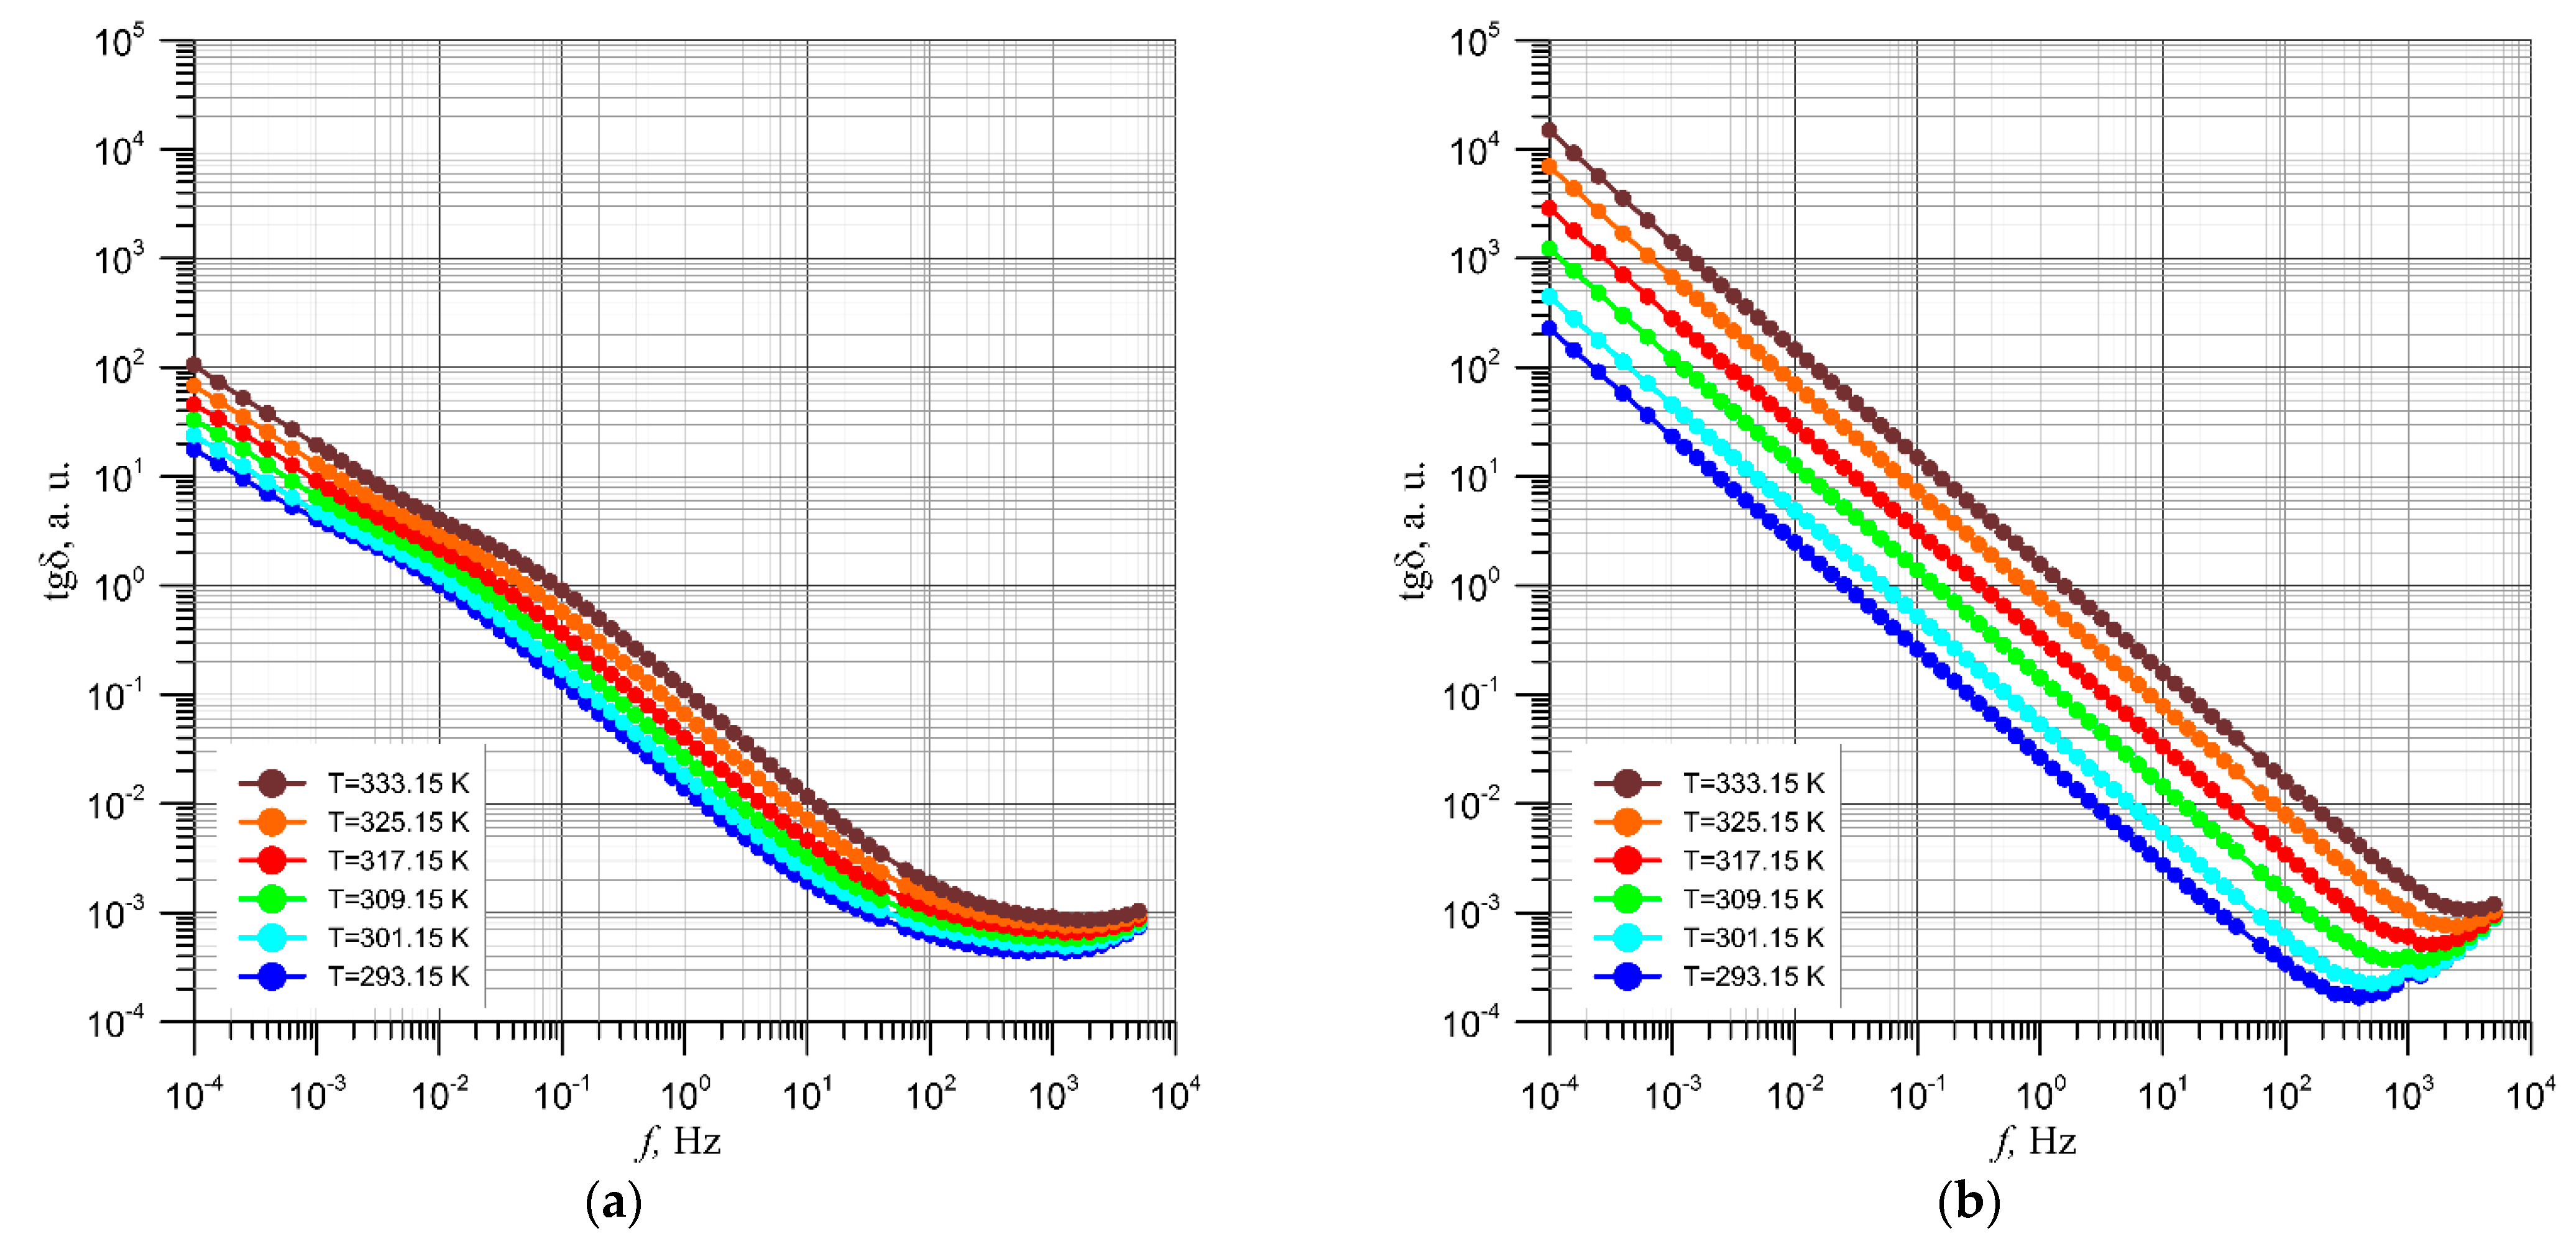
Figure 5 shows the loss tangent dependence on the frequency and temperature of the brand new and moistened insulating oil. The figure shows that moisturization changes the shape of the curves. The plot for a brand new oil at a temperature of 293.15 K shows that, at a frequency of 10
−4 Hz, the value of the loss tangent is about 20. The increase in frequency causes a decrease in the value of tanδ. With the frequency increase above 0.01 Hz, the rate of the tanδ value reduction increases. In the frequency range above 10 Hz, the decrease of the plot slows down, and at a frequency of about 1000 Hz, the minimum is observed. The tanδ minimum value is about 4×10
−4. For a moistened oil at a frequency of 10
−4 Hz, the loss tangent value increases, compared to brand new oil, to about 70. In the range from 10
−4 Hz to about 0.01 Hz, the slope of the tanδ value reduction is greater than for brand new oil and continues in practically the same way up to a minimum at a frequency of about 400 Hz. The tanδ minimum value for the moistened oil is about six times lower than for the brand new one and is about 6 × 10
−5. Additionally, the shape of the minimum is very clear compared to the brand new oil. With the increase of the measuring temperature, the tanδ curves for the moistened oil shifts to the area of higher frequencies much faster than for the brand new oil. This phenomenon is related to the relaxation time reduction due to the increase in moisture.
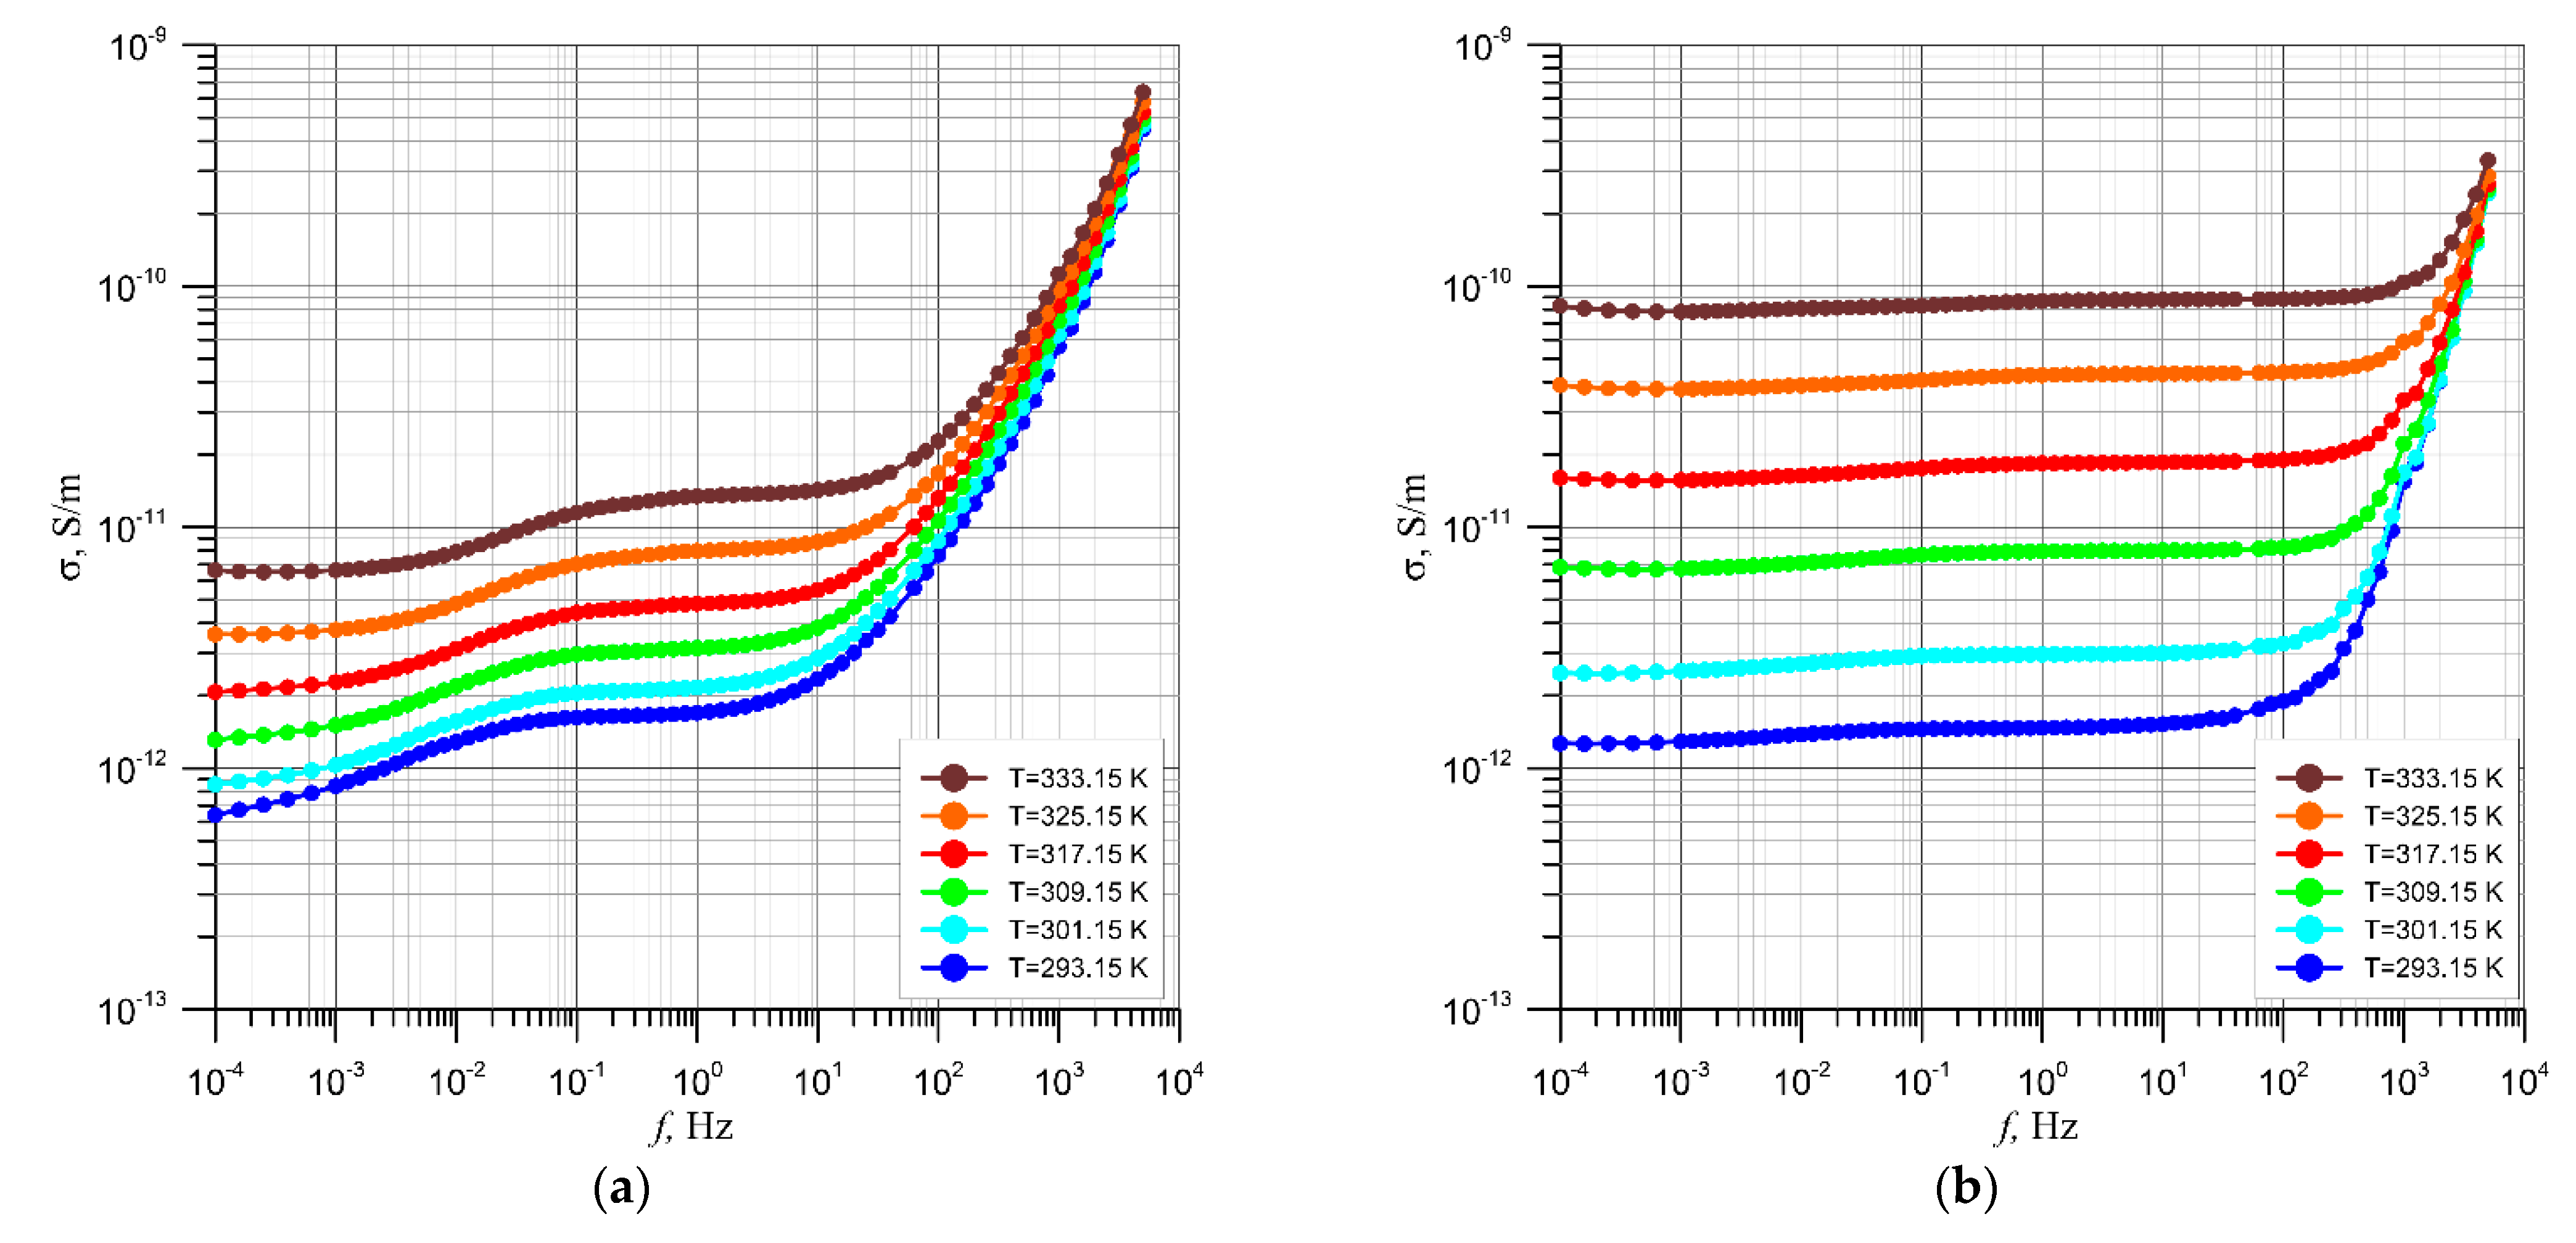
The greatest changes were observed for conductivity dependencies on the frequency and temperature.
Figure 6 shows the conductivity dependencies of brand new and moistened mineral-insulating oil. A flat section in the low-frequency area occurs in the conductivity plots of brand new oil. With a frequency increase, an approximately double increase in conductivity is observed, transition to a steady state and then a very rapid further increase. A temperature increase from 293.15 K to 333.15 K increases the conductivity by about 10 times. This means that, in brand new oil, at least two current conduction mechanisms occur. Oil moistening causes the disappearance of the first segment of the conductivity increase. In the second stage, the rate of conductivity increases. Oil moistening causes about 60 times greater changes in conductivity with the temperature increase compared to brand new oil.
In insulating materials, the conductivity dependence on temperature is described by the formula [
61]:
where: σ
(T)—conductivity, σ
0—numerical factor, ∆
Eσ—conductivity activation energy,
k—Boltzmann’s constant and
T—temperature.
Based on Formula (13), the so-called Arrhenius plot can be made in which the variables and are used for linearization. In case of a constant value of the activation energy of conductivity, the Arrhenius plot decreases in a straight line.
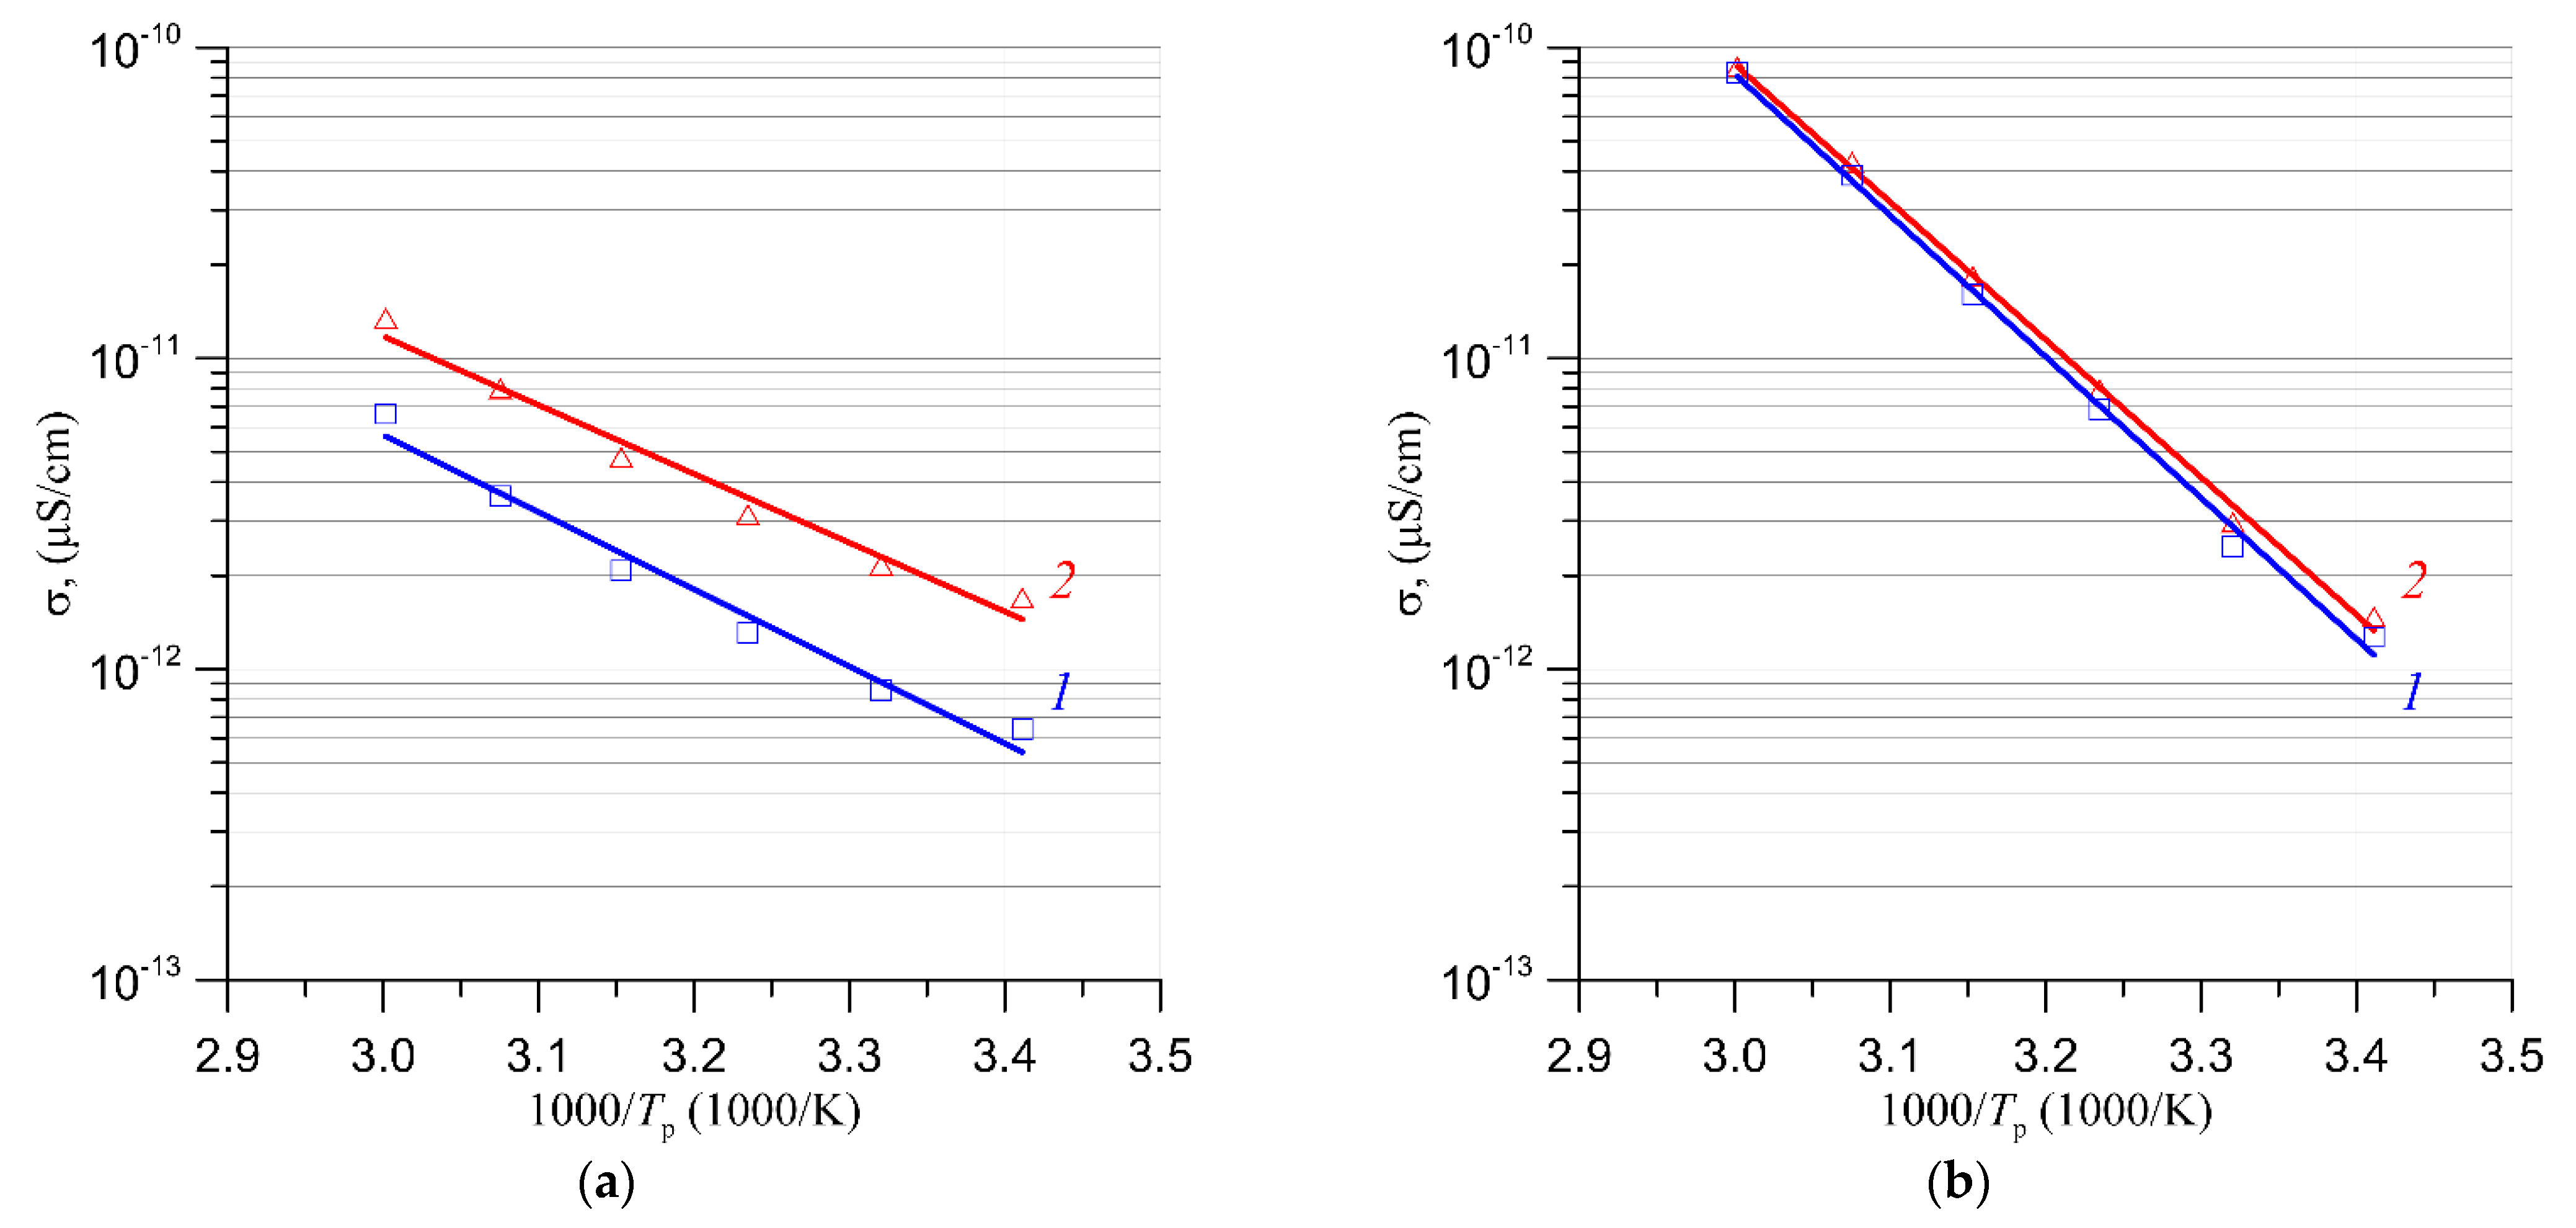
Figure 7 shows Arrhenius plots for brand new and moistened oil. The graphs were made for the conductivity values measured at the frequency of 10
−4 Hz (before the first growth stage) and at 1 Hz (after the first growth stage). The figure shows the linear approximations of the experimental results with solid lines. The determination coefficients
R2 values prove the good quality of the approximation. Their values are close to one, and they are 0.9764 and 0.9753 for brand new oil and 0.9967 and 0.9878 for moist oil. For brand new oil, the activation energy values are ∆
E(10
−4 Hz) = 0.492 eV and ∆
E(1 Hz) = 0.439 eV. The mean value is ∆
E ≈ 0.466 ± 0.0265 eV. The difference between these values is approximately 5.7%. Oil moisturization causes almost double the increase in activation energy for both frequencies to the values of ∆
EW (10
−4 Hz) = 0.901 eV and ∆
E (1 Hz) = 0.878 eV, respectively, and the mean value of ∆
EW ≈ 0.890 ± 0.0115 eV. The difference in this case is only 1.3%. The observed increase in the activation energy of conductivity is caused by an increase in the oil water content due to the moistening process. Activation energy increase is related to the increase of the oil moisture level in the state of thermodynamic equilibrium, determined on the basis of the Oommen characteristics [
12].
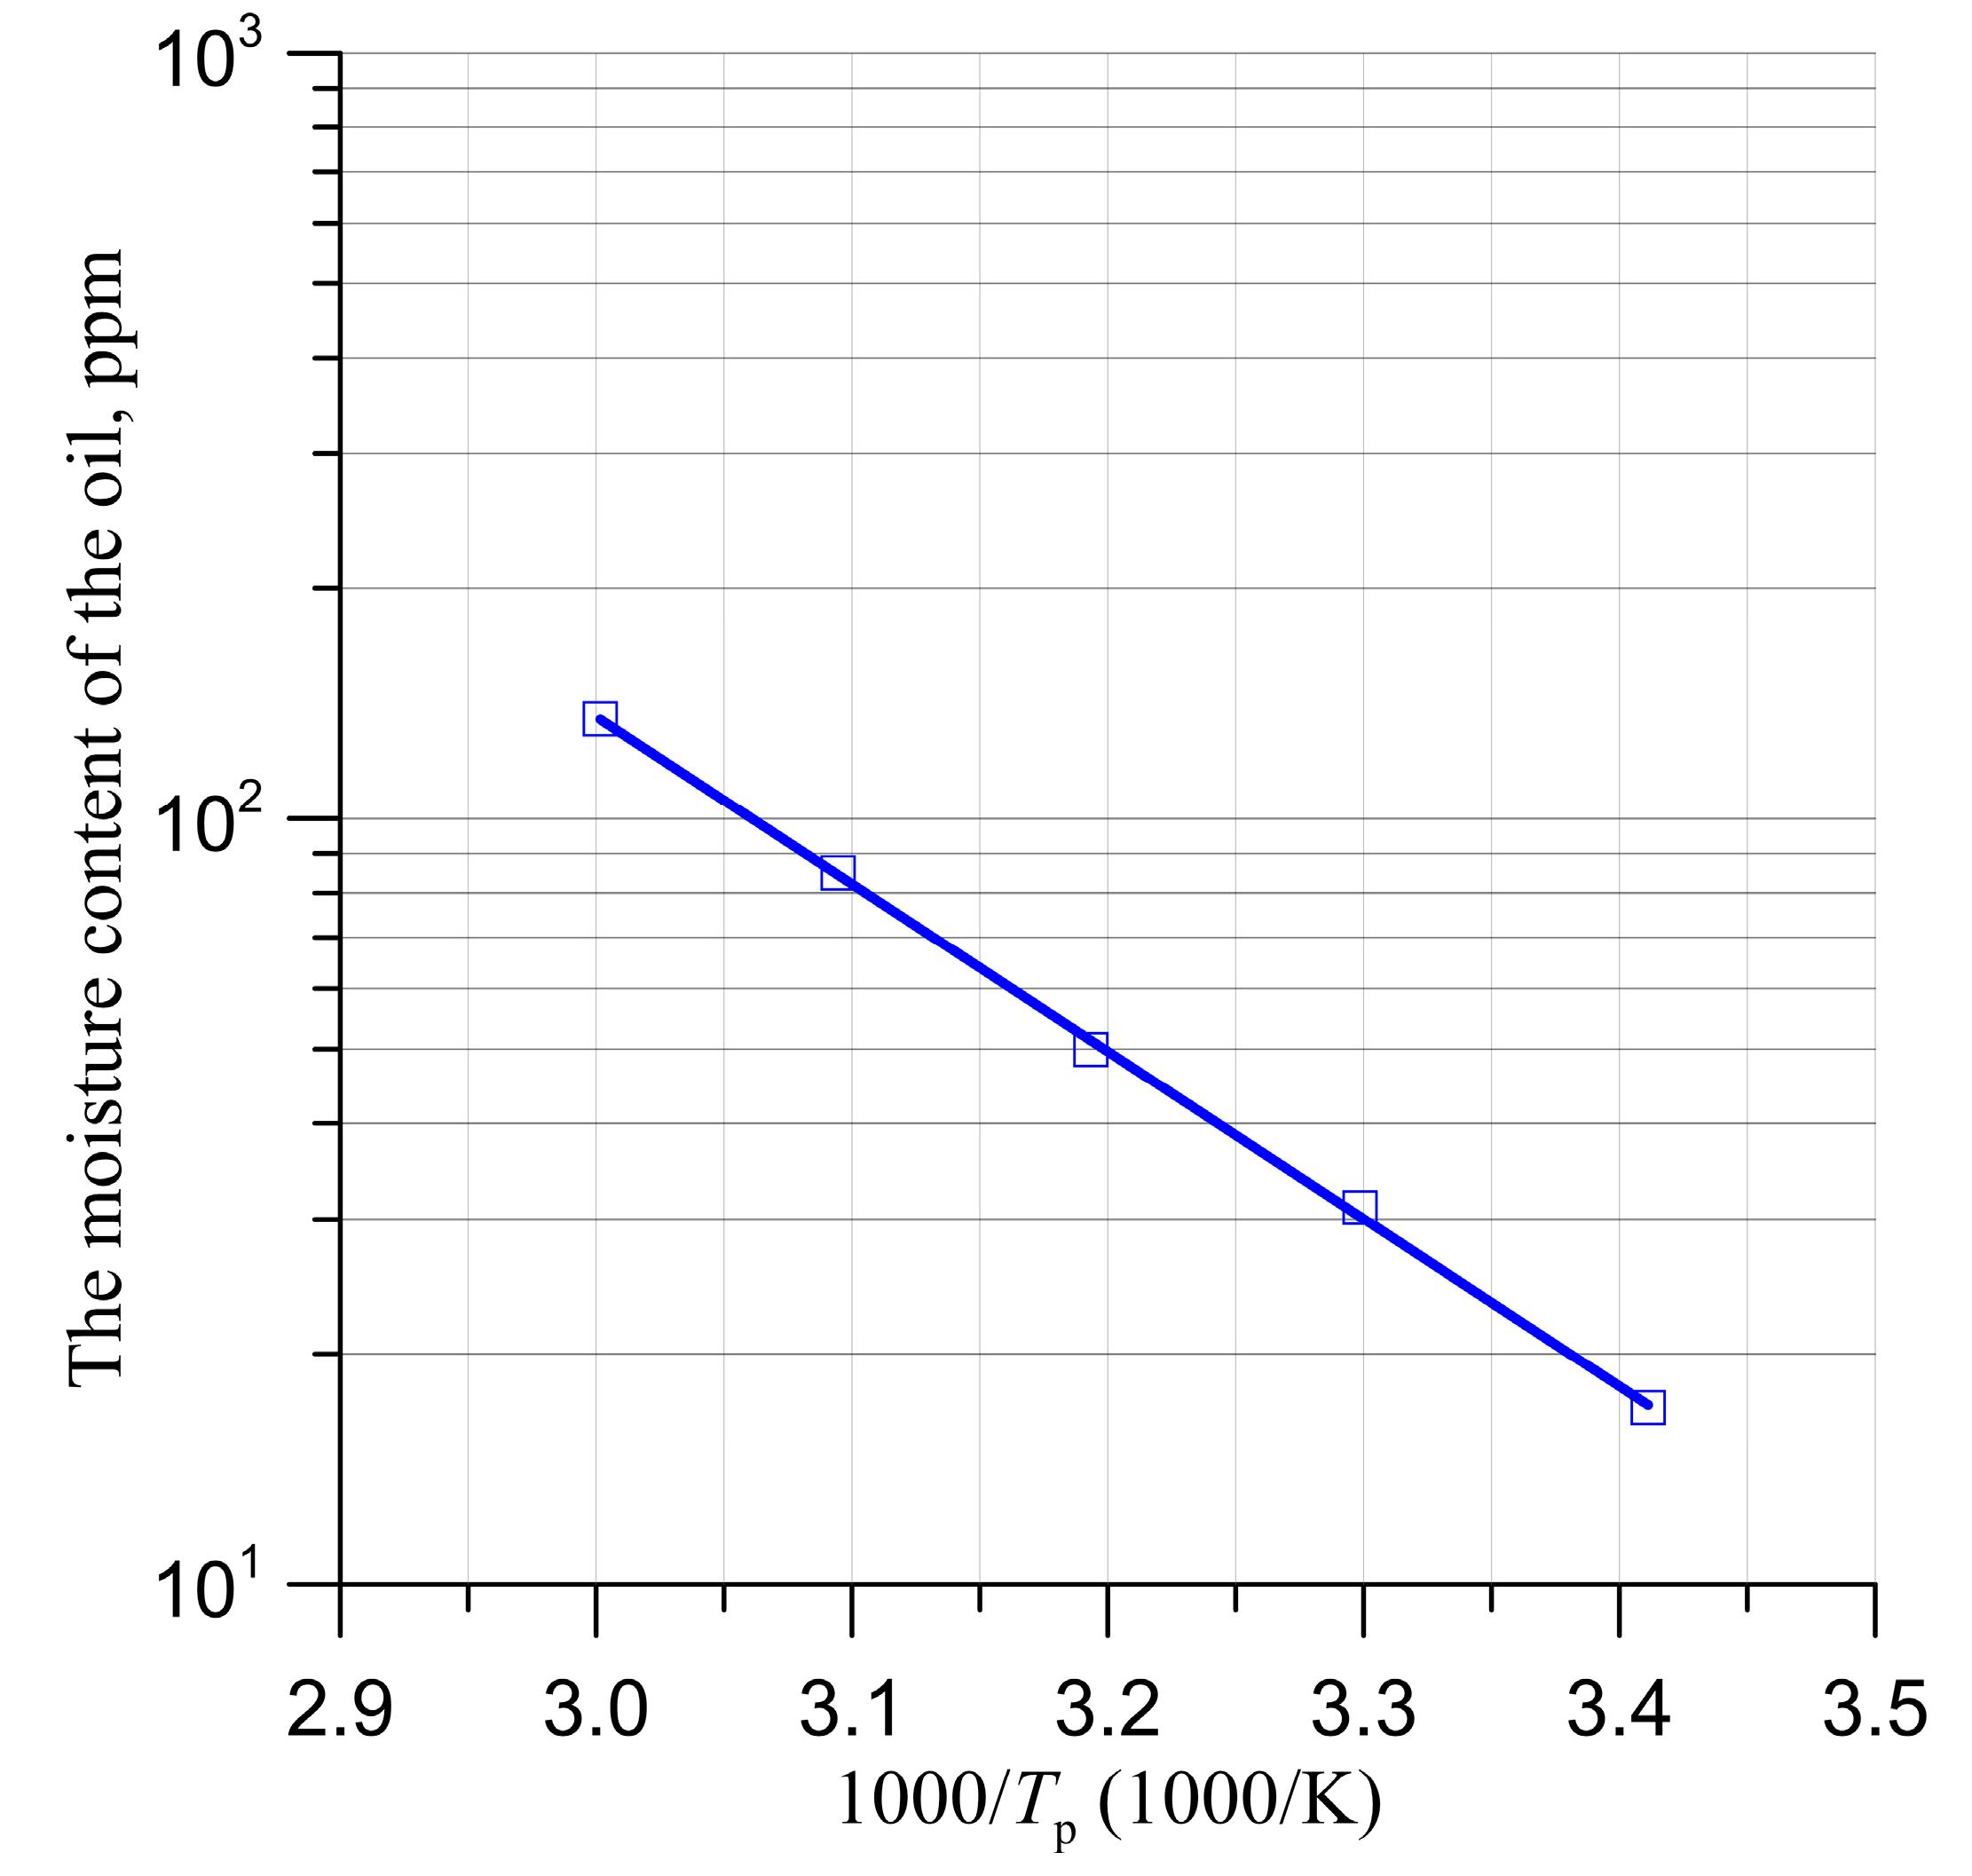
On the basis of the Oommen characteristics, the water content of the oil was determined, corresponding to the water content of 5% by weight in the pressboard, for temperatures from 293.15 K to 333.15 K. On this basis, the Arrhenius plot, shown in
Figure 8, was made. It can be seen from the figure that the approximation of the data points read from the Oommen characteristics is a decreasing straight line, the coefficient of determination for which is very close to one and amounts to 0.9994.
The activation energy value of moisture diffusion from the pressboard into the oil determined from the Arrhenius plot is 0.438 eV. In work [
12], it was assumed that the state of thermodynamic equilibrium was achieved by the diffusion of water molecules from the pressboard into the oil with the increasing temperature. The diffusion processes are determined by the diffusion coefficient. According to [
62], the diffusion coefficient can be defined as:
where:
D(T)—diffusion coefficient,
D0—numerical factor, ∆
ED—diffusion activation energy,
k—Boltzmann’s constant and
T—temperature.
In the case of dielectrics, the conductivity depends on the concentration of places from which the charges involved in current conducting can be released [
61]. They are released by thermal activation. Participation in current conduction is determined by the activation energy of migration. This means that, in Formula (13), for conductivity, the activation energy of the conductivity ∆
Eσ is the sum of the thermal activation energy and the migration activation energy. In the case of oil moistening by the diffusion of water from the pressboard, the concentration of water molecules in the oil increases with the temperature proportional to the diffusion coefficient described by Formula (14). This means that the formula for conductivity in the case of water diffusion from the pressboard into the oil should be written as:
where: σ
w0—numerical factor, ∆
Eσ—conductivity activation energy of brand new oil and ∆
ED—activation energy of water molecules diffusion from the pressboard into the oil.
The comparative analysis of the electrical properties of brand new and moistened oil shows that the moistening process, which takes place in power transformers, causes an increase in the oil activation energy of conductivity compared to the oil to which no additional moisture is supplied. The comparison of the Arrhenius plots (
Figure 7) shows that the activation energy of conductivity increases from the value for the brand new oil ∆
E ≈ 0.466 ± 0.0265 eV to the value for the oil moistened by moisture diffusion from the pressboard ∆
EW ≈ 0.890 ± 0.0115 eV. The increase in the activation energy of the conductivity due to moisturization is approximately 0.424 eV. The activation energy of water molecules diffusion from the pressboard into the oil, determined from the Arrhenius plot, is 0.438 eV. This is very close to the value of the increase in the activation energy of conductivity caused by moisturization. The difference between them is around 3.2%. The same, within the uncertainty limits, values of activation energy may mean that the increase in the activation energy of the conductivity observed in the moist oil is caused by the diffusion of water molecules from the pressboard into the oil.
4. Conclusions
The study presents measurements of frequency and temperature dependencies of admittance Y, phase shift angle φ, AC conductivity σAC, permittivity ε′ and loss tangent tanδ for brand new and moistened oil. The moisturization was done in a manner identical to the oil moistening in power transformers. To do so, pressboard plates with a moisture content of 5% by weight were placed in a vessel with brand new oil. The volume of the pressboard was 10 times smaller than volume of the oil. Moistening was achieved by the migration of moisture from the moistened pressboard into the oil.
It was found that all measured AC electrical parameters of the oil after moistening showed some changes.
Admittance studies have shown that the oil moistening reduces the dielectric relaxation time by about ten times. As the temperature increases, the differences in admittance values for the lowest frequency of 10−4 Hz increase. For brand new oil, the change is about 10 times, and, for moisturized oil, about 100 times.
It was found that, in the moistened oil, the section in which the values of the angle φ are close to zero is lengthened. In the area of higher frequencies, the rate of the phase shift angle module increases, and the influence of temperature on the curves shift to the area of higher frequencies, related to the reduction of the dielectric relaxation time value, increases.
It was observed that the permittivity of both brand new and moistened oil in the frequency range above 0.1 Hz is a constant value of about 2.2. Slight changes in permittivity due to moisturization occur in the frequency region below 0.1 Hz.
It was found that moisturization increases the value of tanδ at the frequency of 10−4 Hz from about 20 to about 70. The increase in frequency causes a decrease in the value of tanδ. In the frequency area above 10 Hz for brand new oil, a slowing down of the curve decrease is observed, and at a frequency of about 1000 Hz, the minimum is observed. The minimum value is approximately 4 × 10⁻⁴. In the curve for moistened oil, the reduction of the tanδ value occurs faster than for a brand new oil. The minimum for moistened oil occurs at a frequency of about 400 Hz, and its value is about six times lower than for a brand new one. Moreover, the shape of the minimum is very clear compared to the plot for brand new oil. As the temperature increases, the tanδ curves for the moistened oil shift to the higher frequency area much faster than for the brand new oil. It is related to the reduction of the relaxation time due to the increase in moisture.
Brand new oil has two electric current conduction mechanisms. The first occurs at frequencies lower than about 0.01 Hz, the second above 10 Hz. Moistening the oil causes the first segment of an increase in conductivity to disappear. In the second, the rate of conductivity increases. The activation energy of conductivity for the brand new oil—∆E ≈ 0.466 ± 0.0265 eV—and for the moistened oil—∆EW ≈ 0.890 ± 0.0115 eV–was determined from the Arrhenius plots.
The increase in the activation energy of conductivity during oil moistening is caused by the diffusion of water molecules from the pressboard into the oil.
The observed changes in the oil parameters caused by moistening should be taken into account while analyzing the power transformer insulation condition using the FDS method.
In further research, the authors plan to significantly expand their scope. Parameters such as the time to reach thermodynamic equilibrium, their dependence on the moisture content in the pressboard, temperature and a number of others will be determined.


 ,
, 


