Abstract
Rail transport, specifically diesel–electric trains, faces fundamental challenges in reducing fuel consumption to improve financial performance and reduce GHG emissions. One solution to improve energy efficiency is the electric brake regenerative technique. This technique was first applied on electric trains several years ago, but it is still considered to improve diesel–electric trains efficiency. Numerous parameters influence the detailed estimation of brake regenerative technique performance, which makes this process particularly difficult. This paper proposes a simplified energetic approach for a diesel–electric train with different storage systems to assess these performances. The feasibility and profitability of using a brake regenerative system depend on the quantity of energy that can be recuperated and stored during the train’s full and partial stop. Based on a simplified energetic calculation and cost estimation, we present a comprehensive and realistic calculation to evaluate ROI, net annual revenues, and GHG emission reduction. The feasibility of the solution is studied for different train journeys, and the most significant parameters affecting the impact of using this technique are identified. In addition, we study the influence of electric storage devices and low temperatures. The proposed method is validated using experimental results available in the literature showing that this technique resulted in annual energy savings of 3400 MWh for 34 trains, worth USD 425,000 in fuel savings.
1. Introduction
Rising energy costs have become a serious concern in our societies in general and in passenger rail systems specifically. Subsequently, improving energy efficiency is an important objective to alleviate this problem globally [1]. Following that, the International Union of Railways (UIC) and Canadian Electrical Raceways (CER) set a new plan targeting some goals to be achieved in 2030. The program was established in December 2010, and the progress toward the goals has been monitored and reported yearly by the UIC (technical document “Monitoring report to 2020–2030 UIC/CER strategy targets”) since 2011 [2]. The goals set are as follows:
- reduce the final energy consumed due to train operations by 30% compared to 1990 levels and
- reduce the average CO2 emissions resulting from train operations by 50% compared to 1990 levels.
Although railways’ energy efficiency improvement started in 2010, the achievements are still far from the 2030 plan. Until 2014, the energy consumption required to move a passenger for 1 km was reduced by 13%, while CO2 emissions were reduced by 20% [3]. Hence, energy consumption and CO2 emissions still lag by 17% and 30% to fulfill the plan for 2030. Diesel–electric locomotives have a lower lifetime, lower efficiency, and higher maintenance costs than electric ones. These trains are used in remote areas where the number of passengers is quite limited, and the cost of installing a catenary is very high according to traffic needs [4]. In electric railways, regenerative braking is considered feasible to improve energy efficiency, and related policies were introduced a decade ago. Most of the studies in the literature are devoted to systems for electric locomotives, whereas the number of contributions for diesel–electric locomotives in non-electrified railways is still relatively low [5].
Usually, the brake energy is dissipated at the train’s roof in resistors, as shown in Figure 1. However, recent developments in energy storage devices have made energy storage a viable alternative in railway systems, especially in diesel–electric trains. The energy storage systems (ESSs) allow operation optimization and, therefore, maximize the regenerated brake energy. As a result, ESSs can improve energy efficiency by storing regenerated energy from conventional resistive braking [1].
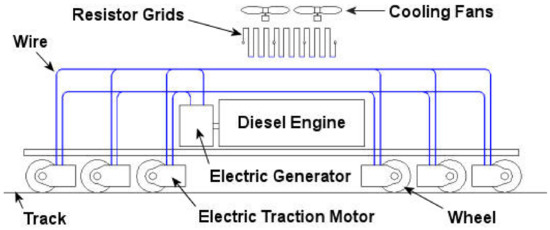
Figure 1.
The rheostatic braking process in diesel–electric locomotive [6].
Regenerative braking charges the storage systems by converting the train’s kinetic energy into electrical energy. In the regenerative braking mode, the train’s engine slows down on an incline or when approaching a train station. The traction motor acts as a generator during braking and converts torque energy into electrical energy, as shown in Figure 2. As such, fuel consumption and emissions are reduced [7]. The application of this technique is not limited to diesel–electric trains. It also serves for kinetic energy recovery in electric and hybrid cars, electric railway vehicles, electric bicycles, electric elevators, and crane lifting motors. Moreover, it can be used in any industry that uses a conveyor system to move material from one workstation to another with halts at a certain distance after a prescribed interval [8].
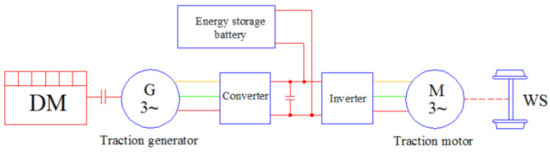
Figure 2.
The regenerative braking process in the diesel–electric train [9].
According to Inarida et al., in 2001, batteries recovered 15% of the diesel-electric train’s regenerated energy (300 kW) [10]. Their numerical results were extracted for a 2000 kW diesel engine operating for two hours with two full brake stations, as shown in Figure 3.
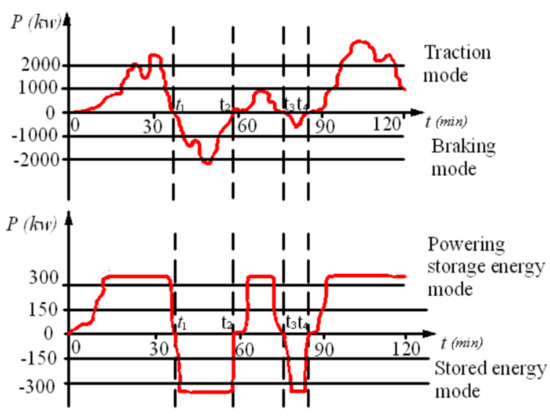
Figure 3.
The traction and braking mode during a journey [11].
In 2007, Desplanques et al. [12] proved that energy regeneration is not limited to the full braking mode. Electrical energy can be regenerated during partial braking as in curves and from the difference of altitude between the start and stop stations. Therefore, 25% of the trains’ traction energy can be restored, which is 10% higher than Inarida’s results [10].
Moreover, according to the Association of American Railroads (AAR, Washington, USA) Train Energy Model (TEM) software, Painter [13] succeeded in saving energy using lead–acid batteries. According to his results, 3400 MWh were saved for 34 trains, worth USD 425,000 in fuel savings. His report at the University of Illinois, Urbana-Champaign, 2006 [13] details these results available. However, the current regenerated from the traction generator and the value of the grid’s resistance were required for obtaining these results. Such details are not readily available and vary significantly from one train to another worldwide. Therefore, a more straightforward method is essential to evaluate all trains’ energy recovery and savings without requiring complex and challenging inputs.
Fournier et al. report that up to 14% of energy saving can be achieved through timetable optimization [14]. More recent studies demonstrated that dynamic braking energy could be recuperated and energy efficiency improved in the railway system by using data from the black box of the train and based on the motion equation of the train. Energy savings of 10–20% and near 70% improvement in load factor and peak shaving are reported [15,16]. In another study, it has been proved that regenerative braking can save up to 30% of lost energy [17]. In 2020, Mayrink et al. [5] applied the electric brake regenerative for diesel–electric trains in Brazil. They proposed a methodology to calculate the fuel economy based on the force and friction power. They extracted the relation between the power dissipation in the resistors’ banks and the dynamic brake from the train’s black box. They use a linear approximation to simplify the calculations [5]. The results of this study were expressed in terms of MARR (minimum accepted rate of return) and NPV (net and present value) [18,19]. Generally, based on the positive NPV and a relatively small payback, the energy recovery from regenerative braking is a viable investment. It is highly recommended when dealing with the necessity to increase transportation efficiency and improve low-carbon mobility [20].
Based on previous studies, we propose in this paper a simplified method, programed in Excel, to assess the feasibility of implementing a regenerative braking system for a diesel–electric train. The software is capable of evaluating the performance of regenerative braking. It mainly uses the average velocity and the average mass of the train, which are easier for the user to obtain. In addition, it determines the energy consumption savings, the fuel savings, the payback period (ROI), and the GHG emission reduction per year.
The literature review confirms the novelty and utility of the proposed approach. Experimental procedures are presently used to determine alternative methods’ complex and challenging inputs. For example, a locomotive was added to the train to hold the batteries needed to perform the analysis in previous experimental studies. In addition, other hardware, such as sensors, are used to measure electrical energy stored in batteries for each electric break. Moreover, additional services should be added, such as installing computer programs to calculate the instant fuel consumption.
The assumptions made in our simplified approach are based on up-to-date knowledge published in scientific literature and are thoroughly justified. Therefore, this study represents a comprehensive analysis of ROI, net annual revenues, and GHG emissions reduction for different journeys using electric regenerative braking for diesel–electric trains. We use a simplified energetic model programmed in Excel code that eliminates all additional costs mentioned above. Furthermore, the model uses easily accessible data such as average velocity and weight. Therefore, the low cost, ease of data access, extensive applicability, and fast and reliable feasibility analysis are the most important assets of the proposed method.
This article is organized as follows. Section 2 reviews the characteristics of the main electric storage devices used in diesel–electric trains. Next, Section 3 describes the methodology used to calculate the annual fuel savings and GHG emissions reduction. The algorithm is implemented using in-house software. Then, in Section 4, a preliminary case is analyzed, and the algorithm is validated. After that, the results for the six case studies are obtained, compared, and discussed in Section 5. Finally, a conclusion is presented in Section 6.
2. Energy Storage in Diesel–Electric Trains
The brake regenerative technique described in the previous section highlights the need to store energy for application to diesel–electric trains. Different technologies and subsystems, such as vehicles, operations, and infrastructure, have been investigated for regenerative braking [21]. However, energy storage could serve electrical power systems to bridge the gap between available or optimal generation capacity and the load demand [21]. The electric energy storage systems used in diesel–electric trains are onboard (OESS) and stationary (SESS) energy storage systems. The power and energy capacities required by OESS are lower than those required by SESS.
On the other hand, SESSs are more flexible regarding the sizing of the system [22]. The feasibility of an energy storage system is determined by its main characteristics, such as energy density, life cycle, and unitary installation cost [23]. Moreover, the main alternatives used in the energy recovery from regenerative braking are batteries [24], supercapacitors [25], and flywheels [26]. Table 1 shows the characteristics of different energy storage systems available [27].

Table 1.
The main characteristics of electric storage systems [27].
According to this table, flywheels are currently the most expensive alternative for existing diesel–electric locomotives, with an installation cost of USD 5000/kWh. Contrariwise, supercapacitors are a viable substitute from a financial perspective, as they cost USD 2000/kWh. Moreover, batteries have the lowest cost ranging between USD 250/KWh and USD 1400/kWh. Supercapacitors beat flywheels and batteries in terms of energy density. It exceeds both, 7 times for the first and ranges between 4 and 70 for the latter. In addition, supercapacitors have a higher lifetime and higher number of cycles compared to the other systems. As a result, according to Table 1, a global favorite energy storage system does not exist. In the same context, Table 2 shows the overall efficiency of the energy storage systems (ESSs), which is the total multiplication of the efficiency of each storage system itself, multiplied by the efficiency of the traction motor (80%).
Table 2.
The overall efficiency of the energy storage systems [28].
According to Table 2, flywheels and supercapacitors have the highest efficiency values. However, García-Garre et al. consider that batteries are still the adequate ESSs for diesel–electric trains [29]. Nevertheless, the batteries are the cheapest energy storage, giving them a considerable advantage over alternative solutions. Generally, among energy storage systems, supercapacitors have drawn significant attention due to their high power density (10 kW kg−1), superior rate capability, rapid charging/discharging rate, long cycle life (>10,000 cycles) [30]. Consequently, the supercapacitor can bridge the gap between batteries and traditional capacitors in terms of both energy storage and power bursts. For instance, they can deliver an energy density several orders of magnitude higher than that of the dielectric capacitors and store and deliver many charges within seconds, which allows them to provide higher powers than batteries. In addition, there are some interesting benefits in supercapacitors, such as delivering peak power and backup power; extending battery run time and battery life; reducing battery size, weight and cost; and enabling low-/high-temperature operation. Section 4 of this paper considers the net annual revenue as a parameter to select the most appropriate energy storage systems.
3. Methodology
In this article, the algorithm proposed was applied on six train trips considering different operations (number of stations during the journey, number of curves, and the difference of altitude) and climate (cold, hot, and moderated weather) conditions. The algorithms applied facilitated determining the fuel savings, the payback period (ROI), and the GHG emission reduction per year. As input, the study used the following parameters:
- (a)
- Train average velocity (v—measured in m/s), which defines the rate of change of the train position with respect to a frame of reference in terms of time. The values in the following sections are used according to experimental measurements in [28].
- (b)
- Locomotive mass (m—measured in tons), which depends on the loads but ranges between 210 and 220 tons in the case of an empty train [31].
- (c)
- Equivalent fuel-burning to produce electricity. This represents the number of kWh of electricity produced by burning 1 gallon of diesel fuel and equals 12 kWh/gal (fuel to electricity efficiency, F2EE = 12 kWh/gal) [32].
- (d)
- Price of a diesel fuel gallon, which is equal to USD 4.24/gal (price of diesel fuel, PDF = USD 4.24/gal) [32].
- (e)
- (f)
- Safety factor (SF) for investment cost of the ESS: expresses the capacity of the system for the intended load and is considered to be 300% in the following sections [27].
- (g)
- Efficiency percentage including equipment availability and use: if not otherwise specified, the value used is 35% availability and usage of the ESS and auxiliary equipment [13].
- (h)
- Percentage of speed reduction in curves: when the train approaches a curve, the driver must decrease the velocity by an average of 10% [23].
- (i)
- GHG emission ratio: Table 3 below shows the GHG emissions coefficients according to the duty cycle and tier [33]. The “switch” type duty cycle is used at tier 3 for all the GHG emissions in this study.
Table 3. GHG emission standard coefficients (g/kWh) [33].
Based on the RetScreen database, the CO2 emission reduction is considered constant, equal to 266.758 g/kWh [34].
As input, we consider the following parameters in the analysis:
- B: Number of journeys per week for every train.
- C: Difference in altitude (measured in meters) between the departure station and the destination station. We calculate the annual energy saved per train by the effect of the difference of altitude as the potential energy of the train.
- D: Additional braking due to cold climate (%) can occur in the case of snow or heavy rain.
- F: Number of curves between the departure station and the destination station.
- G: Number of full brakes during the journey of the diesel–electric train.
- H: Percentage of equipment availability and use (35%).
- v: Train average velocity (measured in m/s).
- J: Energy storage technology price per kWh (USD/kWh).
- m: Locomotive mass (tons).
- R: Percentage of speed reduction in curves (%).
- W: Number of weeks in a year (W = 52).
- η: Storage system’s overall efficiency (as per Table 2).
After that, the following equations (Equations (1)–(12)) were used:
- Total energy saved per train per year during full brakes only (MWh):
- Total energy saved per train per year based on the difference of altitude (MWh):
- Total energy saved per train per year based on the number of curves (MWh):
- Total energy saved per year/train (MWh):
- Average revenues per year/train (AvAnnRev—USD) associated with regenerative braking. These revenues are considered as the equivalent price of the fuel to burn to produce the same annual energy as the regenerative braking:
- Capital cost for the energy storage system/train (capital cost ESS technology—USD): This is essential to determine the size of the ESS technology system needed to store the amount of average regenerative energy recovered during one full braking multiplied by a security factor (SF, considered as 300%). The unitary installation cost J (UIC—USD/kWh) is shown in Table 1 [27].
- The volume of the used ESS V (m3): The size of the ESS needed to store the energy recovered by the regenerative brake is determined by the following equation:
- Average annual expenses/train (AvAnnExp—USD) associated with regenerative braking. These expenses are related to operation and maintenance fees that are considered to be 10% of the capital cost (PMC—percentage of maintenance cost, 10%) [28]. This percentage is relatively low since no specific maintenance operation fees are associated with the storage system itself but with the rest of the regenerative equipment. This annual cost is added to the annual equivalent of the replacement of ESS equipment. Therefore, it is equivalent to the quotient between capital investment cost for ESS equipment and its lifetime (NY) as it appears in Table 2 [30]:
- Net annual revenues/train (NetAnnRev—USD) associated with regenerative braking. These are the difference between the average annual revenues and the average annual expenses:
- Return on investment or restitution period (ROI—years). It represents the duration to recover the initial investment using the annual benefits (difference between the average annual revenues and expenses):
- Annual emission reduction (AER) for HC, CO, NOx, PM, and CO2, which is determined using the GHG emission standard coefficients (GHGESC—g/kWh) as shown in Table 3 [35]:
As mentioned before, this study was conducted with six real train operation routes, the characteristics of which are presented in Table 4.
Table 4.
Studied cases and their characteristics [36].
In the above table, cases 1, 2, and 3 are related to trips in a cold climate. The temperature effect is considered according to Khadim et al. [35]. If the temperature is above 0 °C through all the months of the year (average monthly temperature), the effect of temperature will be assumed as negligible even if it was considered cold weather. Elsewhere, for example, if we have just four months in the year with −4 °C and the average temperature of the other months was above 0 °C, the temperature effect is (4/12) * ((−4) * (−8)/10) = 1.067%, approximately. Another example, if we have three months in the year with −4, −6, and −11 °C and the average temperature of the other months is above 0 °C, the temperature effect is (1/12) * ((−8)/10) * (−4 − 6 − 11) = 1.4%.
There are five cold months for case 1 (London), with average temperatures between 6 and 10 °C. The cold temperature effect is evaluated at 0% additional charge per year [36]. For case 2 (Montreal), there are seven months subject to cold temperature effects. The average temperature varies from −9 to 10 °C. The cold temperature effect is evaluated at approximately 3.84% additional charge per year [36]. In case 3 (Schefferville), 10 months are known to have cold episodes where the average temperatures range between −24 and 9 °C. The cold temperature effect is evaluated at approximately 11.22% additional charge per year [37].
Case 1 has the highest number of trains, while case 2 has the highest number of travels per week/train, and case 3 has the lowest temperature and the highest altitude difference.
Moreover, cases 4, 5, and 6 are in hot climate environments. Therefore, the additional load due to the temperature was considered negligible. Case 4 has the higher temperature, while case 5 has the highest number of stations (full brake), and case 6 has the maximum number of trains and altitude difference.
4. Base Case and Validation
To determine the best electric storage system for the application and validate the proposed method, we use the base case study in Table 5. Based on the previous section equations, the energetic, financial, and ecologic results for different electric storage systems are shown in Table 6.
Table 5.
Input parameters used in the base case study of electric regenerative braking.
Table 6.
Energetic, financial, and ecologic results for different ESS in the base case study.
According to Table 6, it is clear that the energy saved based on altitude difference is negligible compared to the total energy saved per year/train. On the other hand, the energy saved per train per year during full brakes only and the energy saved per train per year based on the number of curves represent around 47% and 53% of the total energy saved per year/train. This is due to the high number of curves, equal to 48.
Moreover, in terms of the ESS storage volume required, there is no need for an additional boxcar in the train as the ESSs’ volume does not exceed 1 m3, except for the flywheel and NiCd. Conversely, in terms of net annual revenues/train, the lead–acid battery is the best choice where its cost is around USD 33,800, and the flywheel is the worst, with annual expenses higher than revenues. In comparison, the other ESSs have similar revenues with an average of USD 22,000/year.
Additionally, Table 6 shows the values for ROI, capital cost for the energy storage system/train (USD), and annual GHG emissions savings/train (kg) for different energy storage systems based on the operational scenario. The analysis of ecologic benefits shows that all ESSs have a quasi-similar effect on annual GHG emissions savings. Regarding ROI, the lead–acid batteries have the best payback period, approximately 5 months (0.41 years), while the flywheel has the worst, infinite. In addition, regarding capital cost, the flywheel and supercapacitors are more expensive than the others. As minimum ROI and capital cost solutions are chosen in industrial and commercial applications, the lead–acid, Li-ion, and NiCd batteries are the best energy storage systems, with very good annual net revenues and annual GHG emission reduction values.
Furthermore, using the lead–acid batteries to store electricity, the total energy saved per year for 34 trains is 3580 MWh, and the related annual net revenues per year will be USD 1,150,000. Under the same conditions, Painter’s results showed that the annual energy saved was 3400 MWh, worth USD 425,000 of fuel savings [13]. The difference is around 5% for the saved energy (MWh) and 270% for fuel savings (USD). The high difference percentage for fuel savings is due to the difference of diesel gallon’s price between 2006 and 2021 where it increased from USD 1.66 to USD 4.24 in the mentioned period, which is a 2.55 ratio increase. Considering the fuel gallon price adjustment, the difference is only 5.6% for fuel saving (USD).
Therefore, it is confirmed that the model and the in-house excel software proposed in this article adequately represent regenerative braking performances. The difference between the experimental results and other potential variations depends on specific ESS prices and performance. Even the technological evolution may change the results, but the algorithms and software will remain valid.
5. Results and Discussion
This section determines the performance of regenerative braking for the six operation scenarios. As mentioned before, the performance is subject to different climate conditions (cold, hot, and moderate weather) and other metrics. Additionally, the total energy saved per year/train (MWh), the net annual revenues/train (USD), the ROI, and the annual GHG emission reduction (kg) per train are analyzed. Each operation scenario’s elements such as the number of trains, duration of the travel, number of curves, number of full brakes, the difference in altitude, number of journeys per week for each train, and the temperature effect are presented in Table 4. In addition to the information in Table 4, we used the same input parameters shown in Table 5 except for the velocity, specified separately for each case study. Based on the base case results, only the lead–acid batteries were selected as ESSs to compare the impact of regenerative braking for the different scenarios. They provided the highest net revenues, GHG savings per year, and lower ROI, as observed in Table 6.
Similarly, Figure 4 and Figure 5 are used to compare the ROI values and the net annual revenues/train (USD). In addition, Figure 6, Figure 7, Figure 8, Figure 9 and Figure 10 are used to compare the different yearly emission reductions per train for the six cases.
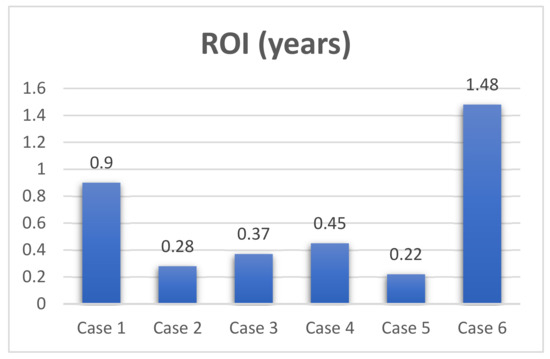
Figure 4.
Comparison of ROI for the six cases when using the electric brake regenerative technique.
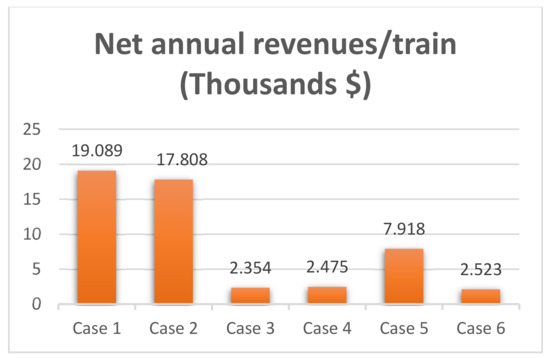
Figure 5.
Comparison of net annual revenues/train (Thousands USD) for the six cases when using the electric brake regenerative technique.
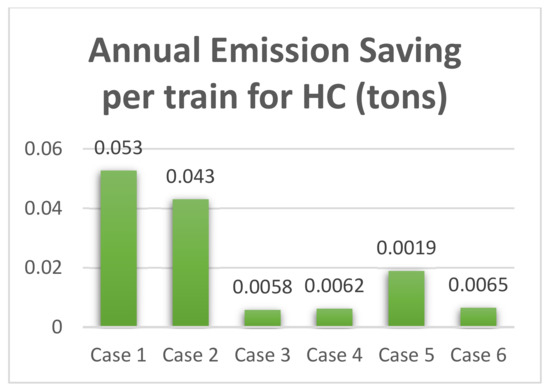
Figure 6.
Comparison of annual emission saving per train for HC (tons) for the six cases when using the electric brake regenerative technique.
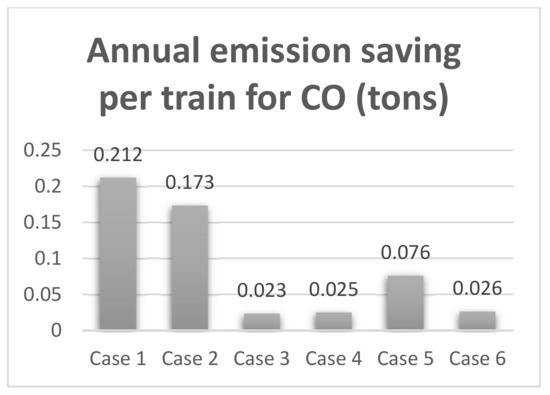
Figure 7.
Comparison of annual emission saving per train for CO (tons) for the six cases when using the electric brake regenerative technique.
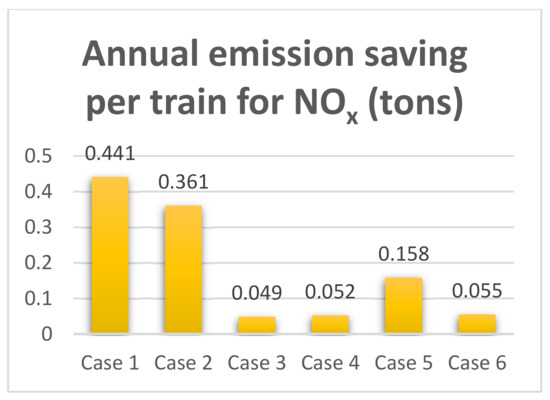
Figure 8.
Comparison of annual emission saving per train for NOx (tons) for the six cases when using the electric brake regenerative technique.
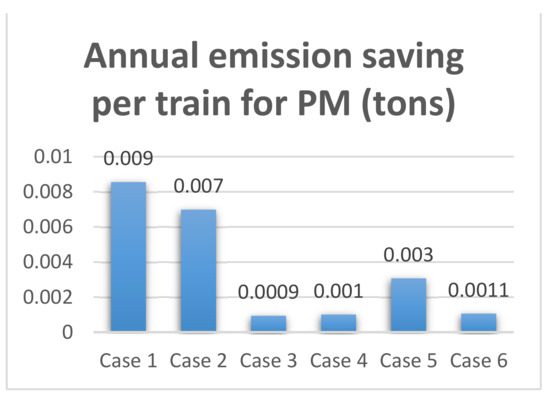
Figure 9.
Comparison of annual emission saving per train for PM (tons) for the six cases when using the electric brake regenerative technique.
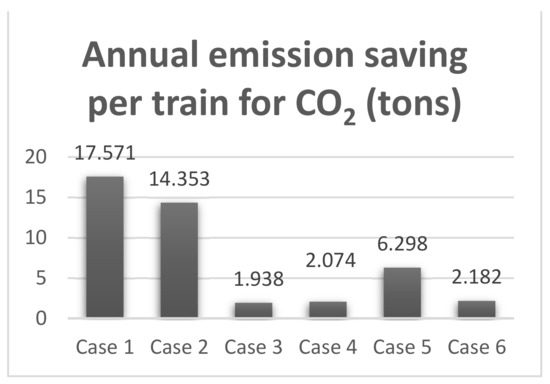
Figure 10.
Comparison of annual emission saving per train for CO2 (tons) for the six cases when using the electric brake regenerative technique.
As seen in Figure 4, the ROI values are low (less than two years), which shows that using electric brake regenerative energy is profitable and feasible. Likewise, and according to Figure 5, case 1 has the highest revenues per year/train, around USD 19,000, and case 6 has the lowest one, around USD 2100. Moreover, if the capital cost of the ESS is divided over the net revenues, the highest ROI values are obtained in cases 1 and 6. Oppositely, the lowest ROI values are obtained in cases 2 and 5, which present a low capital cost of ESS per year/train and high net revenues per year/train. This indicates that the obtained results are reliable.
In terms of annual GHG emission reduction, case 1 has the maximum yearly reduction per train, representing around 53 kg for HC, 212 kg of CO, 441 kg of NOx, 9 kg of PM, and 17,571 kg of CO2. This result is obtained because case 1 has the highest energy saved per year/train (around 66 MWh), given that the annual GHG emission reduction is strictly proportional to the annual energy saved.
Cases 1, 2 and 5 have the highest annual net revenues because they have the highest number of full brakes and curves. On the other hand, although case 6 has eight full brakes during its journey, the number of curves in its case was relatively low. Furthermore, we can see that case 6 has double the number of full brakes than the ones in case 4, so, typically, it has the higher annual net revenues, although they have a similar number of curves. On the other hand, it is clear that the number of full brakes and curves in case 3 is higher than the ones in case 4, but the big difference in the number of travels between these two cases makes the annual net revenues in case 4 higher than in case 3.
Briefly, the two main important parameters in fuel economy calculation using electric brake regenerative were the number of full brakes and the number of curves. The difference of altitude and the percentage of effect of low temperature did not present high importance. On the other hand, the enormous difference in the number of travels per week for each train may change the results, regardless of the number of full brakes and the number of curves during the train’s journey. These results are estimated and normal, especially when analyzing the equations and their parameters. The analysis of the importance of these parameters in fuel economy calculation leads the users or train companies to consider that if the train’s trajectory has a low number of curves, number of travels per week, and full brakes, it is not recommended to use this technique.
Finally, through the results achieved in this article, we recommend that policymakers use electric brake regenerative solutions to improve the energy efficiency of diesel–electric trains, even in cold weather (case 3 proves this clearly). The Excel code described in this paper makes the calculation of gain and profitability easier, depends on simple data to access, and provides faster and reliable results. The reduction in fuel consumption and GHG emissions using this technique contributes to reaching the International Union of Railways (UIC) and Canadian Electrical Raceways (CER) strategy targets mentioned in the introduction. In addition, using energy storage systems in diesel–electric trains is a great strategy to improve energy performance. Therefore, it is helpful to study and analyze other techniques that depend on energy storage, such as using PV solar panels on the train’s roof and storing the energy produced during the train’s journey.
6. Conclusions
This article proposed a simplified method to determine the feasibility of using electric regenerative braking to improve the train’s energy efficiency. The model (Excel code) analyzes the energy saved, the corresponding net revenues per year, and the ROI. This model also computes the GHG emission reduction. The validation used a base case study from the scientific literature to choose the most appropriate energy storage systems. Moreover, the safety regenerative braking is compromised when the ESS storing the recovered energy is 100% charged. The excessive charge would cause the battery’s voltage to rise above a safe level.
Electric regenerative braking was proved to be profitable and feasible. It increases the performance of the energy system of the train and reduces pollution associated with supply generation. Low ROI values demonstrate this, less than two years for all the studied cases. In parallel, the net annual revenues/train and GHG emissions savings were always positive for all the studied cases. The lowest ROI values were obtained in the cases for Montreal and Sydney due to their low capital cost of ESS per year/train and high net revenues per year/train. However, the case of London had the maximum annual fuel reduction per train because it has the highest energy saved per year/train and the maximum yearly GHG emission reduction. Finally, the number of full brakes had the most significant influence in general, except when plenty of curves or high-altitude differences existed. Future research can perform tests on a batch of data using artificial intelligence or statistical analysis to pave the way toward smart management energy systems in the Industry 4.0 era.
Author Contributions
Conceptualization: A.I. and H.I.; methodology: A.F., H.I. and A.I.; validation: H.I., A.I., S.S.K. and M.I.; formal analysis: A.F., H.I., A.I., S.S.K. and M.I.; writing—original draft preparation: A.F., S.S.K. and M.I.; writing—review and editing: A.F., H.I., A.I., S.S.K. and M.I.; visualization: A.F., S.S.K. and M.I.; supervision: H.I. and A.I.; project administration: H.I., A.I. and S.S.K. All authors have read and agreed to the published version of the manuscript.
Funding
This research was funded by the Government of Canada through Transport Canada “CleanTransportation Program—Research and Development”.
Institutional Review Board Statement
Not applicable.
Informed Consent Statement
Not applicable.
Data Availability Statement
Not applicable.
Conflicts of Interest
The authors declare no conflict of interest.
Nomenclature and Symbols
| AAR | Association of American Railroads |
| AER | Annual emission reduction |
| AvAnnExp | Average annual expenses/train |
| AvAnnRev | Average revenues per year/train |
| CapitalCostESSTechnology | Capital cost for the energy storage system/train |
| CER | Canadian Electrical Raceways |
| ESS | Energy storage system |
| F2EE | Fuel to electricity efficiency |
| GHG | Greenhouse gas |
| m | Locomotive mass |
| NetAnnRev | Net annual revenue/train |
| OESS | On-board energy storage system |
| Price of diesel fuel | |
| ROI | Payback period |
| SESS | Stationary energy storage system |
| SF | Safety factor |
| TEM | Train energy model |
| UIC | International Union of Railways |
| v | Train average velocity |
| η | Efficiency of the energy storage system |
References
- Agenjos, E.; Gabaldon, A.; Franco, F.G.; Molina, R.; Valero, S.; Ortiz, M.; Gabaldon, R.J. Energy efficiency in railways: Energy storage and electric generation in diesel-electric locomotives. In Proceedings of the CIRED 2009—20th International Conference and Exhibition on Electricity Distribution—Part 1, Prague, Czech Republic, 8–11 June 2009; pp. 1–7. [Google Scholar]
- Middleton, W.D.; Middleton, W.D., III. Frank Julian Sprague: Electrical Inventor and Engineer; Indiana University Press: Bloomington, IN, USA, 2009. [Google Scholar]
- International Energy Agency; International Union of Railways. Railway Handbook 2017, Energy Consumption and CO2 Emissions; International Energy Agency: Paris, France, 2012. [Google Scholar]
- González-Gil, A.; Palacin, R.; Batty, P. Sustainable urban rail systems: Strategies and technologies for optimal management of regenerative braking energy. Energy Convers. Manag. 2013, 75, 374–388. [Google Scholar] [CrossRef] [Green Version]
- Mayrink, S., Jr.; Oliveira, J.G.; Dias, B.H.; Oliveira, L.W.; Ochoa, J.S.; Rosseti, G.S. Regenerative Braking for Energy Recovering in Diesel-Electric Freight Trains: A Technical and Economic Evaluation. Energies 2020, 13, 963. [Google Scholar] [CrossRef] [Green Version]
- Available online: http://www.engineeringexpert.net/Engineering-Expert-Witness-Blog/tag/railroad-brakes (accessed on 6 July 2020).
- Bhanewad, K.; Pandhurnekar, R.; Khandekar, S.; Parshiwanikar, T. Design and Development of Regenerative Braking System. J. Xi’an Univ. Archit. Technol. 2021, 13, 439–445. [Google Scholar]
- Vishwakarma, D.; Chaurasia, S. Regenerative Braking System. Imp. Int. J. Eco-Friendly Technol. 2016, 1, 27–30. [Google Scholar]
- Kaneko, T.; Shimada, M.; Kujiraoka, S.; Kojima, T. Easy maintenance and environmentally-friendly train traction system. Hitachi Rev. 2004, 53, 15–19. [Google Scholar]
- Inarida, S.; Kojima, T.; Shimada, M.; Masuda, S. Train traction systems for passenger comfort and easier maintenance. Hitachi Rev. 2001, 50, 134–138. [Google Scholar]
- Available online: https://www.intechopen.com/chapters/17059 (accessed on 1 August 2011).
- Desplanques, Y.; Roussette, O.; Degallaix, G.; Copin, R.; Berthier, Y. Analysis of tribological behaviour of pad–disc contact in railway braking: Part 1. Laboratory test development, compromises between actual and simulated tribological triplets. Wear 2007, 262, 582–591. [Google Scholar] [CrossRef]
- Painter, T.D. Recovering Railroad Diesel-Electric Locomotive Dynamic Brake Energy. Master’s Thesis, University of Illinois Urbana-Champaign, Urbana and Champaign, IL, USA, 2006. [Google Scholar]
- Fournier, D.; Fages, F.; Mulard, D. A Greedy Heuristic for Optimizing Metro Regenerative Energy Usage. In Proceedings of the 2nd International Conference on Railway Technology: Research, Development and Maintenance, Ajaccio, France, 8–11 April 2014; Volume 104. [Google Scholar]
- Tauler, A. Informe 2017 del Observatorio del Ferrocarril en España; Ministerio de Fomento (Spanish Government): Madrid, Spain, 2018. Available online: https://www.mitma.gob.es/el-ministerio/campanas-de-publicidad/2021-anio-europeo-del-ferrocarril (accessed on 31 August 2019).
- Sumpavakup, C.; Ratniyomchai, T.; Kulworawanichpong, T. Optimal energy saving in DC railway system with onboard energy storage system by using peak demand cutting strategy. J. Mod. Transp. 2017, 25, 223–235. [Google Scholar] [CrossRef] [Green Version]
- Bawage, S.; Ranjan, P.; Chaudhari, O.; Rai, S. Regenerative Braking System in Automobiles. Int. Res. J. Eng. Technol. 2017, 4, 2367–2369. [Google Scholar]
- U.S. Dollar/Brazilian Real. Available online: https://www.tradingview.com/symbols/USDBRL (accessed on 4 November 2019).
- Banco Central do Brasil. Taxa de Juros. Available online: https://www.bcb.gov.br/estatisticas/txjuros (accessed on 4 November 2019).
- Mongird, K.; Fotedar, V.; Viswanathan, V.; Koritarov, V.; Balducci, P.; Hadjerioua, B.; Alam, J. Energy Storage Technology and Cost Characterization Report; U.S. Department of Energy’s Water Power Technologies Office by Pacific Northwest National Laboratory: Washington, DC, USA, 2019.
- Khodaparastan, M.; Mohamed, A.A.; Brandauer, W. Recuperation of regenerative braking energy in electric rail transit systems. IEEE Trans. Intell. Transp. Syst. 2019, 20, 2831–2847. [Google Scholar] [CrossRef] [Green Version]
- Zakeri, B.; Syri, S. Electrical energy storage systems: A comparative life cycle cost analysis. Renew. Sustain. Energy Rev. 2015, 42, 569–596. [Google Scholar] [CrossRef]
- Steiner, M.; Klohr, M.; Pagiela, S. Energy storage system with ultracaps on board of railway vehicles. In Proceedings of the 2007 European Conference on Power Electronics and Applications, Aalborg, Denmark, 2–5 September 2007; pp. 1–10. [Google Scholar]
- Møller, K.T.; Jensen, T.R.; Akiba, E.; Li, H. Hydrogen—A sustainable energy carrier. Prog. Nat. Sci. Mater. Int. 2017, 27, 34–40. [Google Scholar] [CrossRef]
- Gao, Z.; Chin, C.S.; Woo, W.L.; Jia, J. Integrated equivalent circuit and thermal model for simulation of temperature-dependent LiFePO4 battery in actual embedded application. Energies 2017, 10, 85. [Google Scholar] [CrossRef] [Green Version]
- Lin, F.; Li, X.; Zhao, Y.; Yang, Z. Control strategies with dynamic threshold adjustment for supercapacitor energy storage system considering the train and substation characteristics in urban rail transit. Energies 2016, 9, 257. [Google Scholar] [CrossRef]
- Spiryagin, M.; Wolfs, P.; Szanto, F.; Sun, Y.Q.; Cole, C.; Nielsen, D. Application of flywheel energy storage for heavy haul locomotives. Appl. Energy 2015, 157, 607–618. [Google Scholar] [CrossRef]
- Choudhary, N.; Li, C.; Moore, J.; Nagaiah, N.; Zhai, L.; Jung, Y.; Thomas, J. Asymmetric supercapacitor electrodes and devices. Adv. Mater. 2017, 29, 1605336. [Google Scholar] [CrossRef] [PubMed]
- García-Garre, A.; Gabaldón, A. Analysis, evaluation and simulation of railway diesel-electric and hybrid units as distributed energy resources. Appl. Sci. 2019, 9, 3605. [Google Scholar] [CrossRef] [Green Version]
- Ruan, J.; Walker, P.D.; Zhang, N.; Wu, J. An investigation of hybrid energy storage system in multi-speed electric vehicle. Energy 2017, 140, 291–306. [Google Scholar] [CrossRef]
- Nelson, R.G.; Schrock, M.D. Energetic and economic feasibility associated with the production, processing, and conversion of beef tallow to a substitute diesel fuel. Biomass Bioenergy 2006, 30, 584–591. [Google Scholar] [CrossRef]
- Das, C.K.; Bass, O.; Kothapalli, G.; Mahmoud, T.S.; Habibi, D. Overview of energy storage systems in distribution networks: Placement, sizing, operation, and power quality. Renew. Sustain. Energy Rev. 2018, 91, 1205–1230. [Google Scholar] [CrossRef]
- Leng, G.J. Renewable Energy Technologies Project Assessment Tool, RETScreen; DOE Office of Scientific and Technical Information: Oak Ridge, TN, USA, 1998.
- Elgowainy, A.; Vyas, A.; Biruduganti, M.; Shurland, M. Railroad Energy Intensity and Criteria Air Pollutant Emissions; Transportation Research Board: Washington, DC, USA, 2018. [Google Scholar]
- Kadhim, N.S.; Idhas, S.M. The Effect of Diesel Fuel Temperature, Speed and Load on Some Performance Parameters of Tractor Engine. In Proceedings of the IX International Scientific Symposium “Farm Machinery and Processes Management in Sustainable Agriculture”, Lublin, Poland, 22–24 November 2017. [Google Scholar]
- Papapetrou, M.; Kosmadakis, G.; Giacalone, F.; Ortega-Delgado, B.; Cipollina, A.; Tamburini, A.; Micale, G. Evaluation of the economic and environmental performance of low-temperature heat to power conversion using a reverse electrodialysis—Multi-effect distillation system. Energies 2019, 12, 3206. [Google Scholar] [CrossRef] [Green Version]
- Kim, D.; Cox, S.J.; Cho, H.; Im, P. Evaluation of energy savings potential of variable refrigerant flow (VRF) from variable air volume (VAV) in the US climate locations. Energy Rep. 2017, 3, 85–93. [Google Scholar] [CrossRef]
Publisher’s Note: MDPI stays neutral with regard to jurisdictional claims in published maps and institutional affiliations. |
© 2021 by the authors. Licensee MDPI, Basel, Switzerland. This article is an open access article distributed under the terms and conditions of the Creative Commons Attribution (CC BY) license (https://creativecommons.org/licenses/by/4.0/).