
Quantitative Risk Assessment for Aerospace Facility According to Windrose


Abstract
:1. Introduction
2. Methodology
2.1. Validation Approach
2.1.1. Part 1. Risk Assessment Objective (Select Accident Scenarios)
2.1.2. Part 2. Fire Risk Information (Collect Relevant Data Sources and Risk Calculation Method)
2.1.3. Part 3. Frequency (Selecting Proper Database and Applying)
2.1.4. Part 4. Consequence
2.1.5. Part 5. Quantitative Fire Risk Assessment Presentation
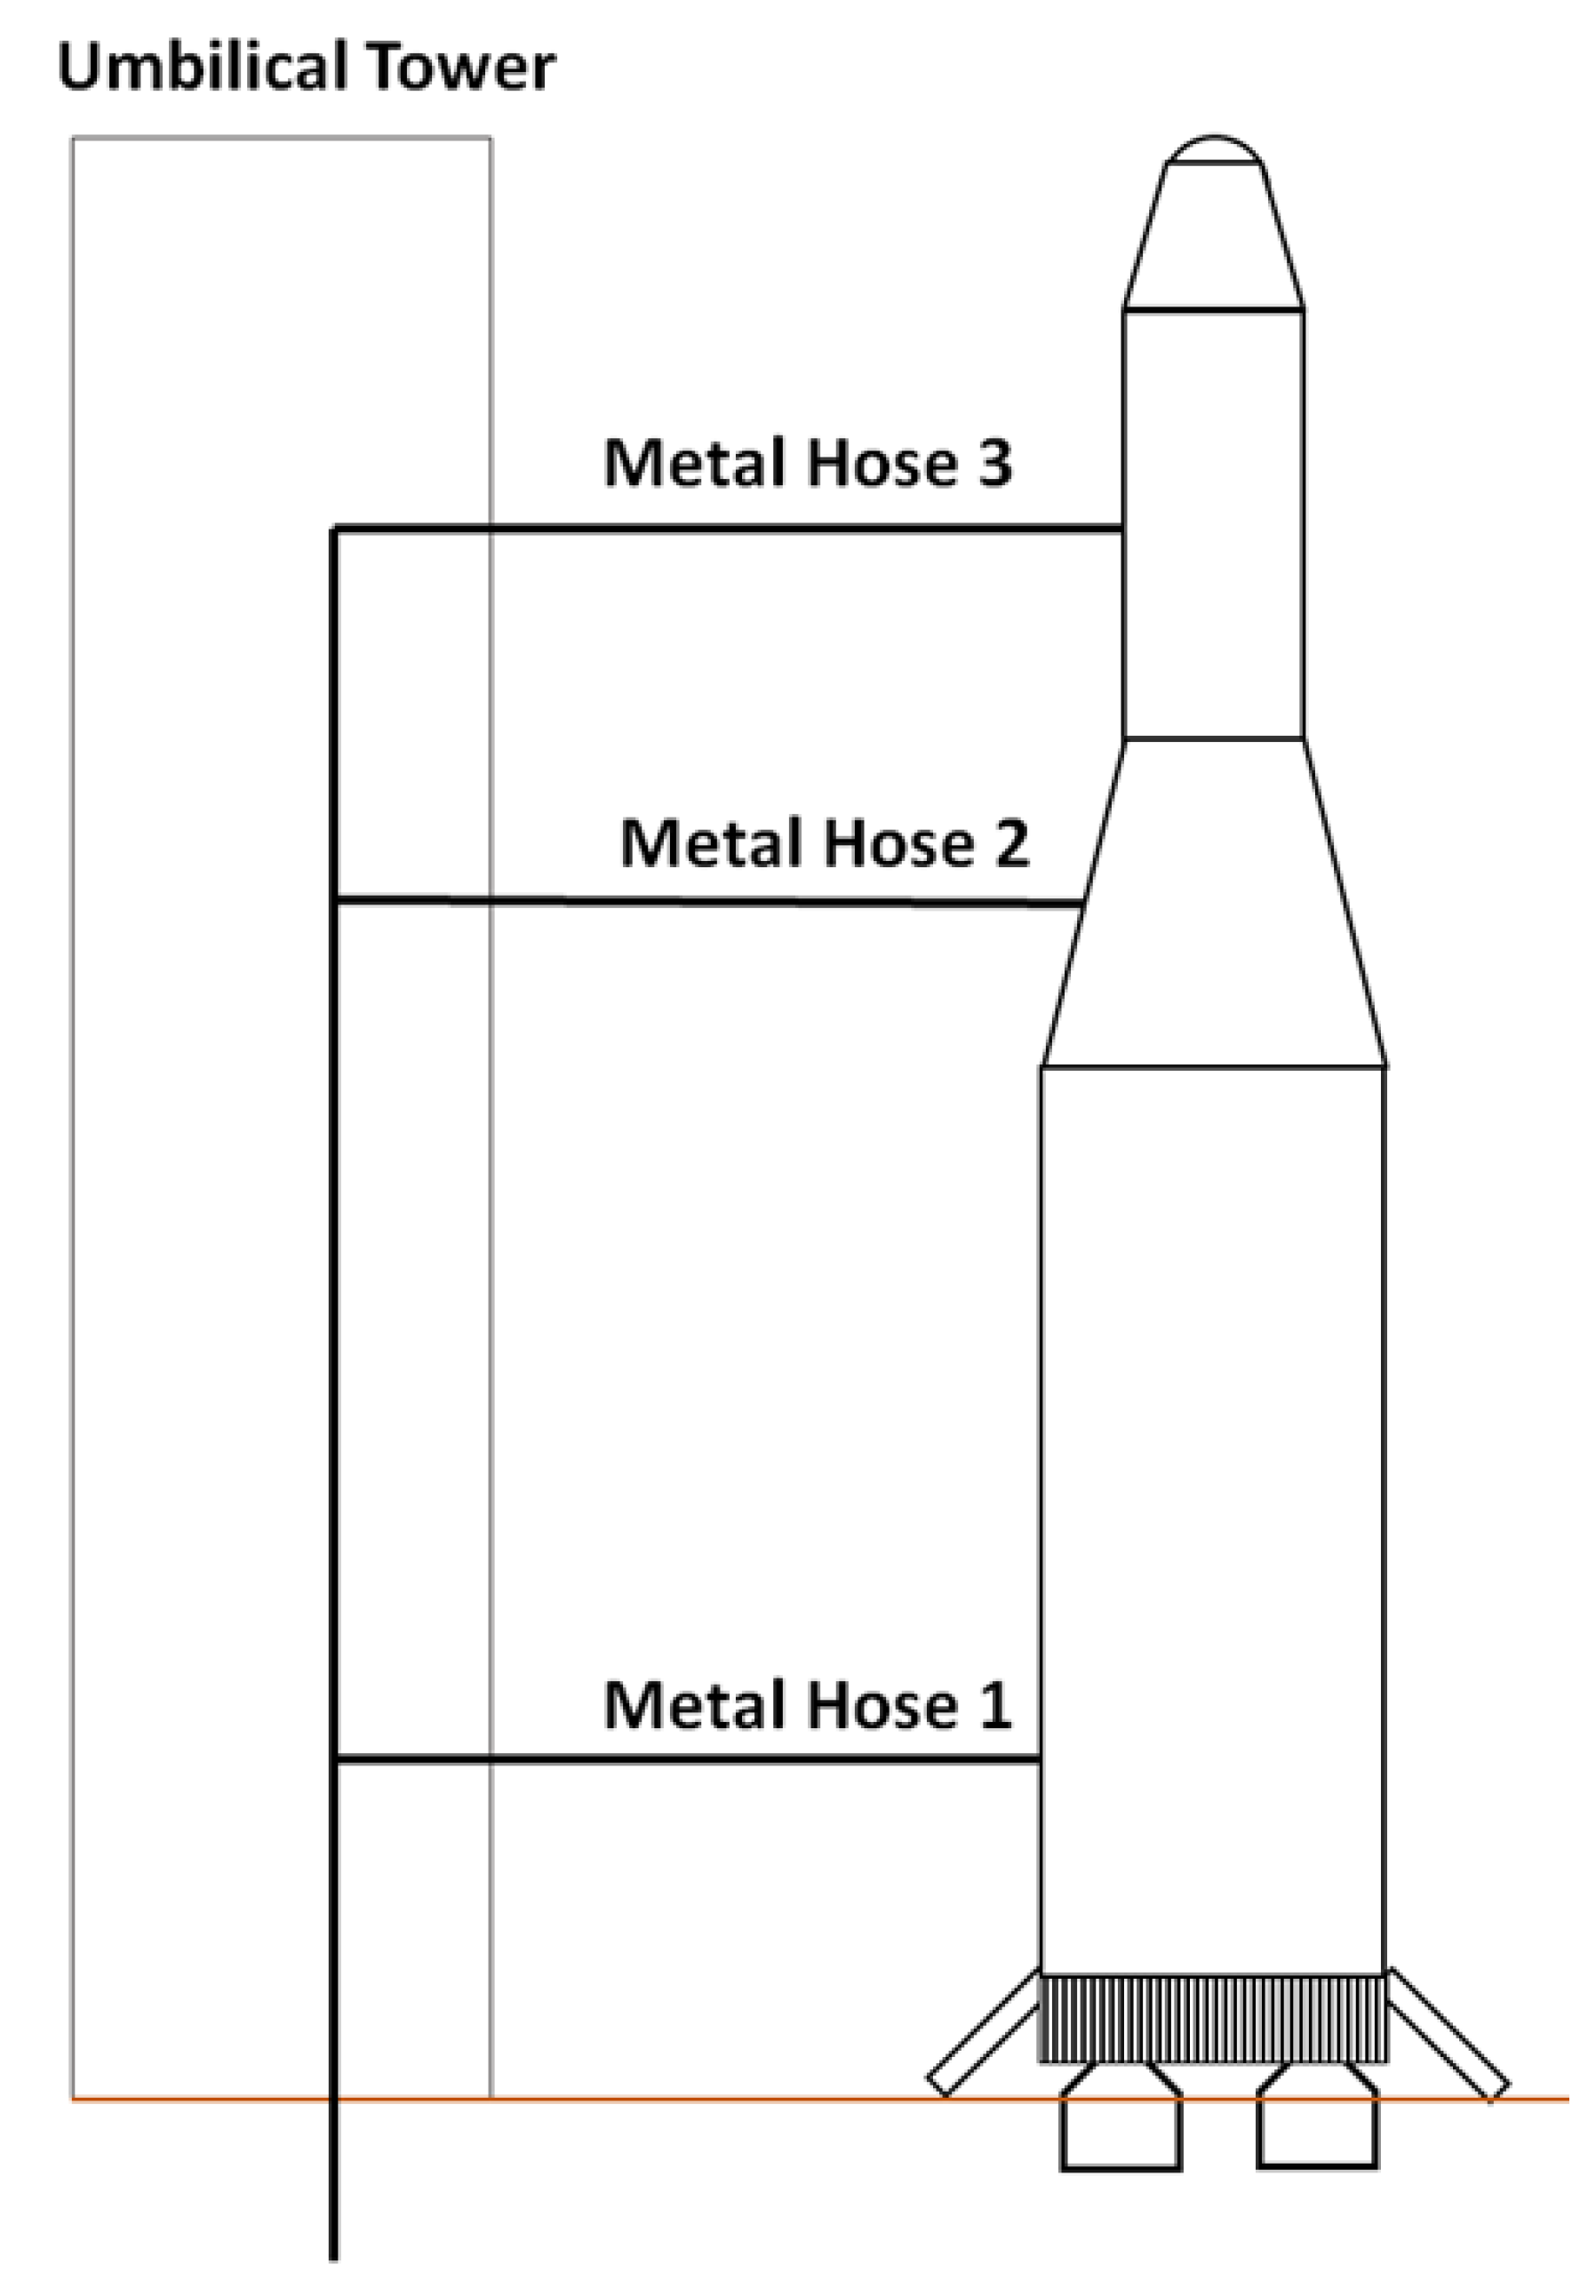
2.2. Scenario and Boundary Definitions (Metal Hose)
2.3. Individual Risk
- The wind distribution is constant, and accidents can occur in all directions.
- Only one wind speed and climate stability degree are used.
- Mitigation factors, such as evacuation, are not considered.
- Leakage sources are uniformly distributed; thus, accidents can occur at any point.
2.4. Jet Fire Fatality
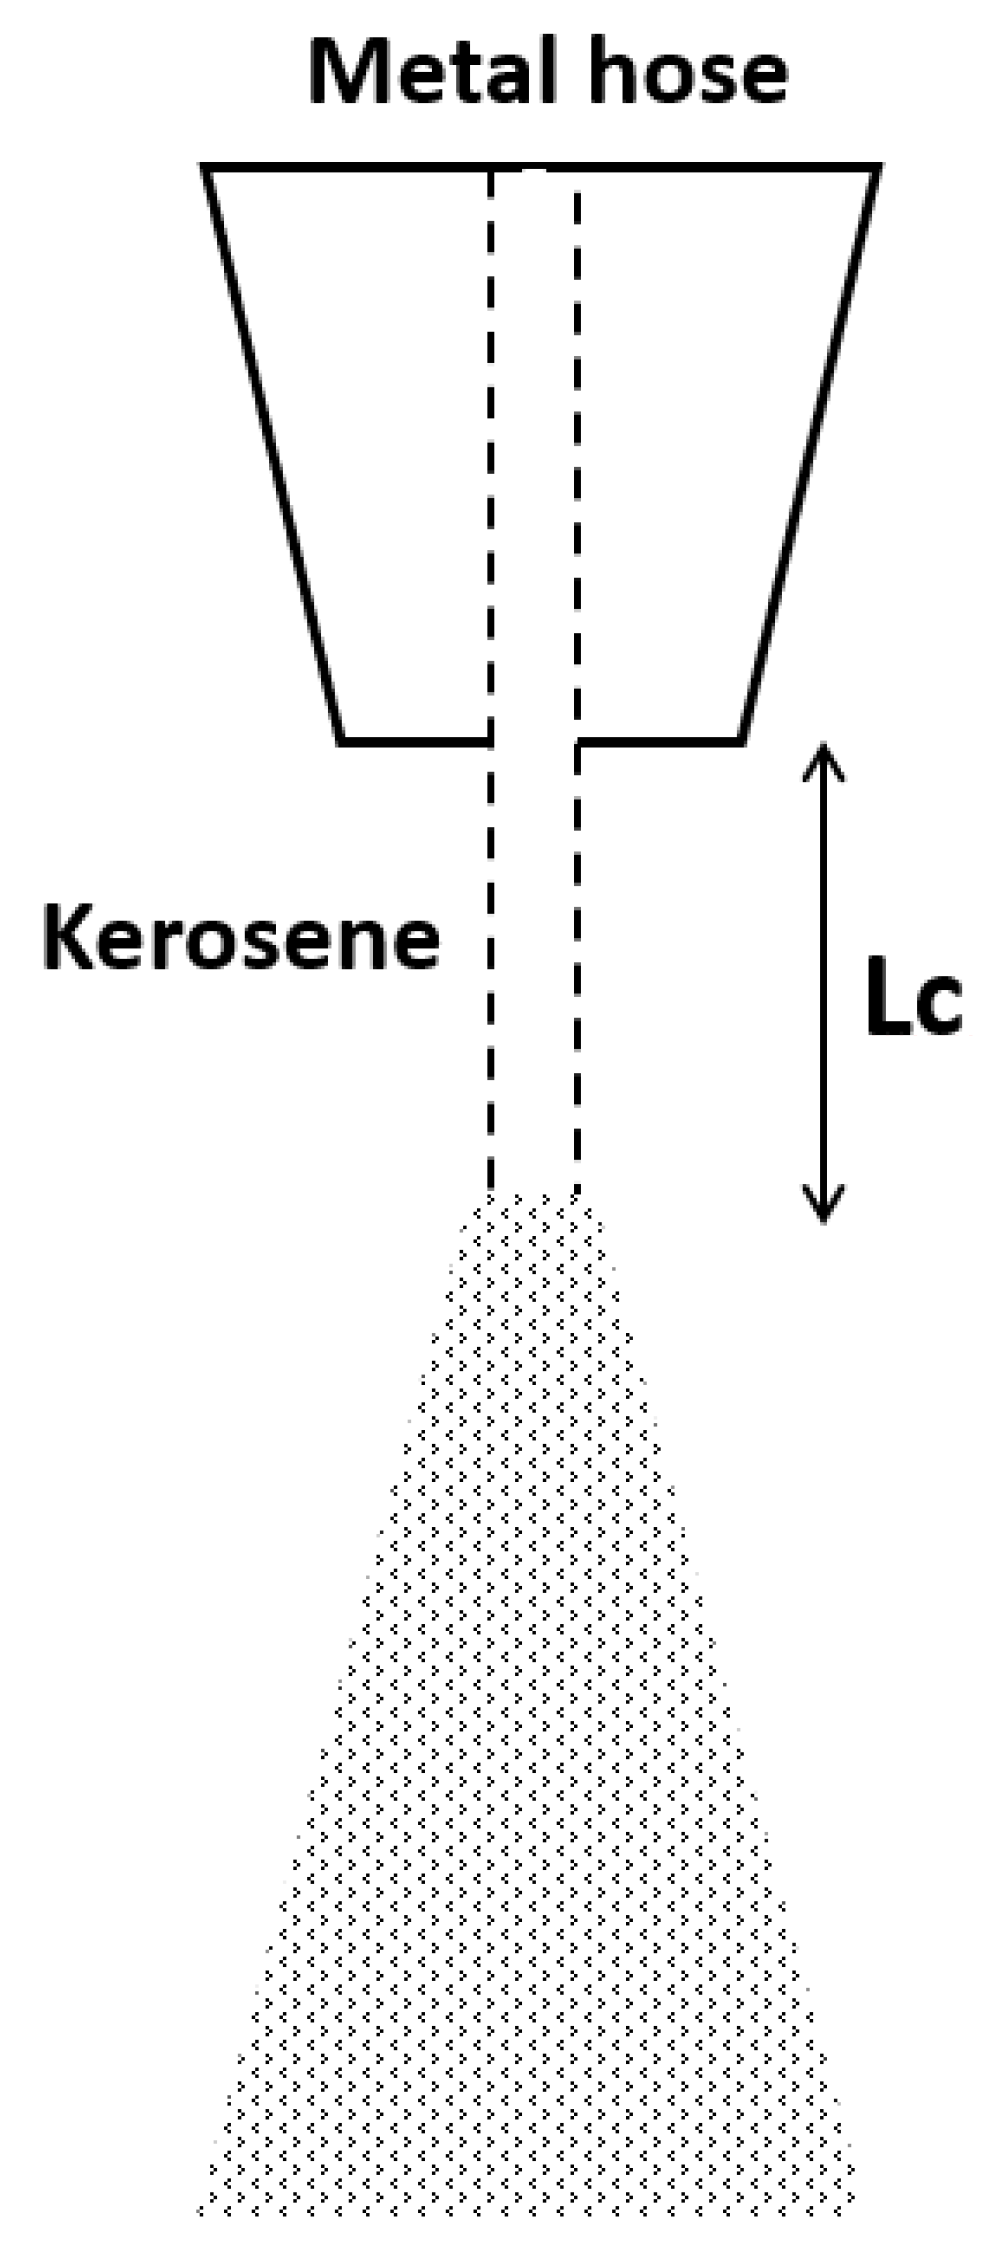
2.5. Kerosene Atomization
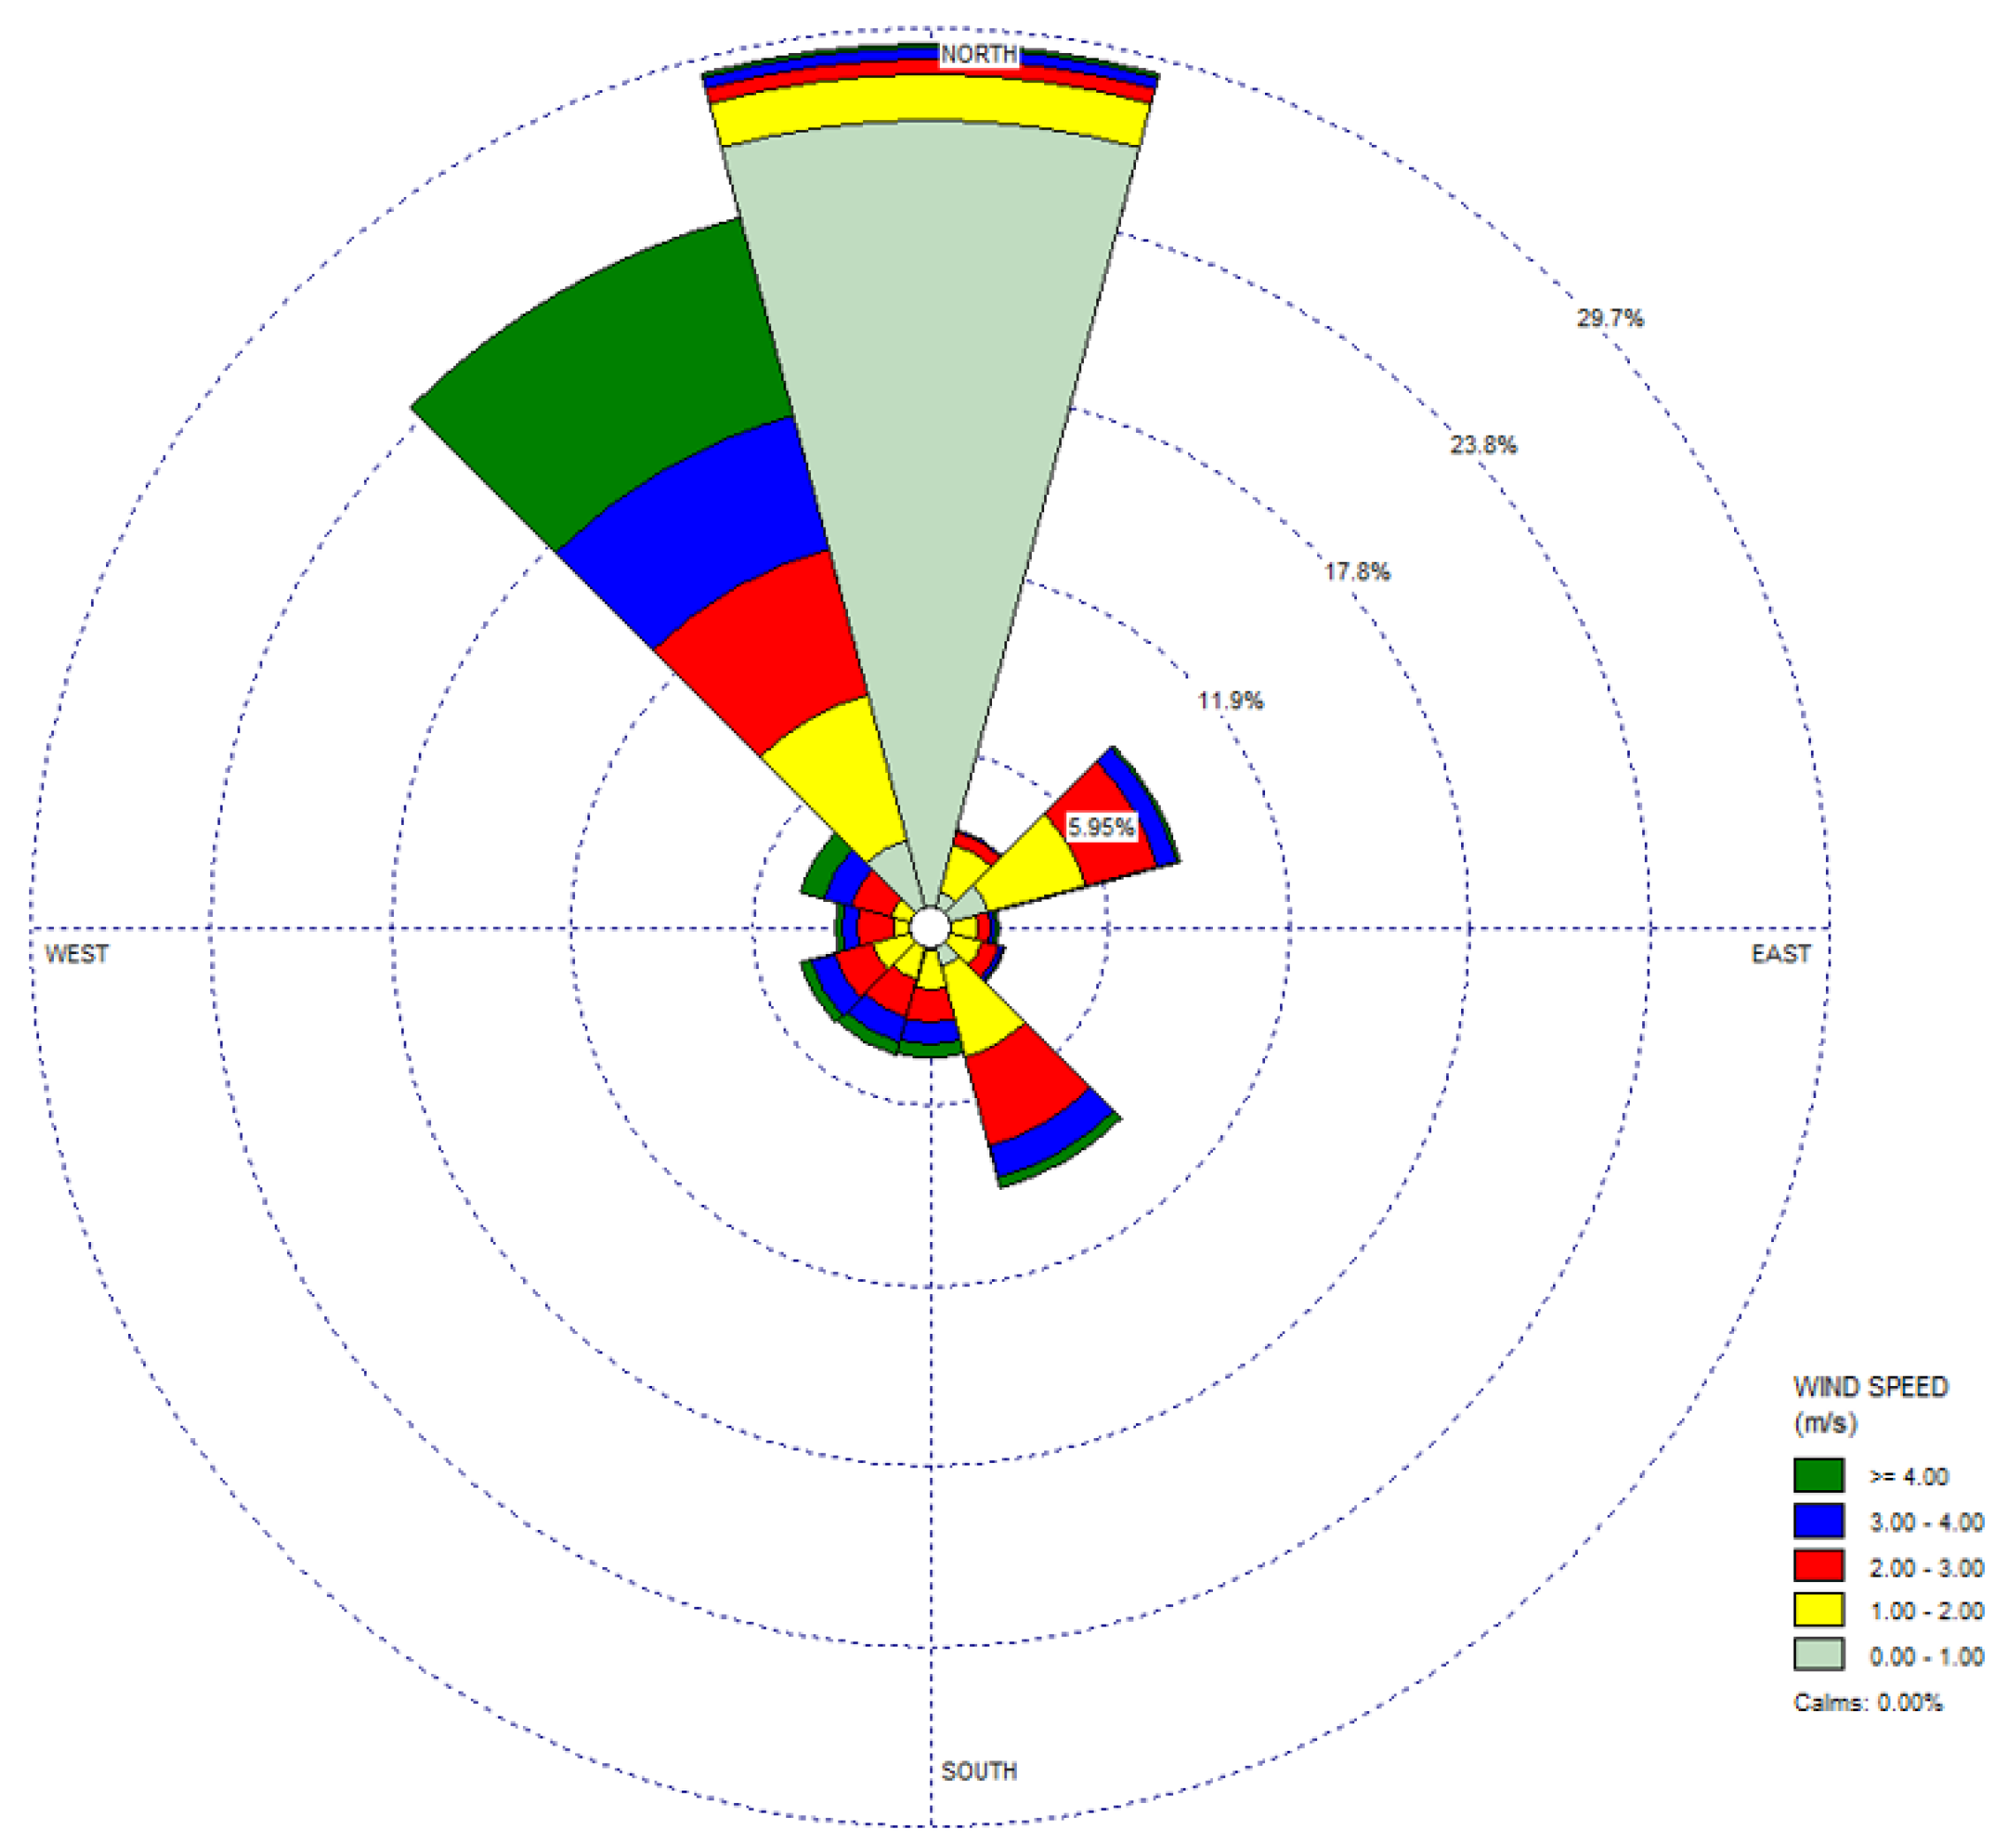
2.6. Metal Hose Ignition Probability and Wind Rose Data
3. Consequence Analysis
- Kerosene leaks from the metal hose at a high speed.
- Metal hose has a hole diameter of 13 mm.
- Kerosene atomizes to form a jet fire when Lc = 3.20 m.
- Radii from the jet fire for 99%, 50%, and 1% fatality can be determined.
- Frequency of a jet fire can be determined for four directions, and the frequencies in each direction can be summed to obtain the total frequency.
4. Risk Analysis
- is set to 0.33 since Korean labour standards are applied to work 8 h out of 24 h.
- The was set as follows, since the person working at the space launch facility was among those working at the Korea Aerospace Research Institute located in Goheung was 0.88.
5. Results and Discussion
6. Sensitivity Analysis
- The high value is set to 1, assuming that the working person is the maximum in the aerospace facility.
- The high and low values are 1 and 0.5.
- Sensitivity analysis was compared based on 99% fatality.
- In the results and discussion, 99% fatality was selected, due to the high individual risk and sensitivity analysis was performed.
7. Conclusions
- The fire probability of a metal hose with a hole diameter of 13 mm and release rate of 10.93 kg/s is 3.0 × 10⁻⁴.
- In a case of jet fire occurring from a metal hose, the 99% fatality area and distance are 493.87 m2 and 3.20~12.94 m, the 50% fatality area and distance are 518.01 m2 and 12.94~18.23 m, and 1% fatality area and distance are 1027.71 m2 and 18.23~25.68 m, respectively.
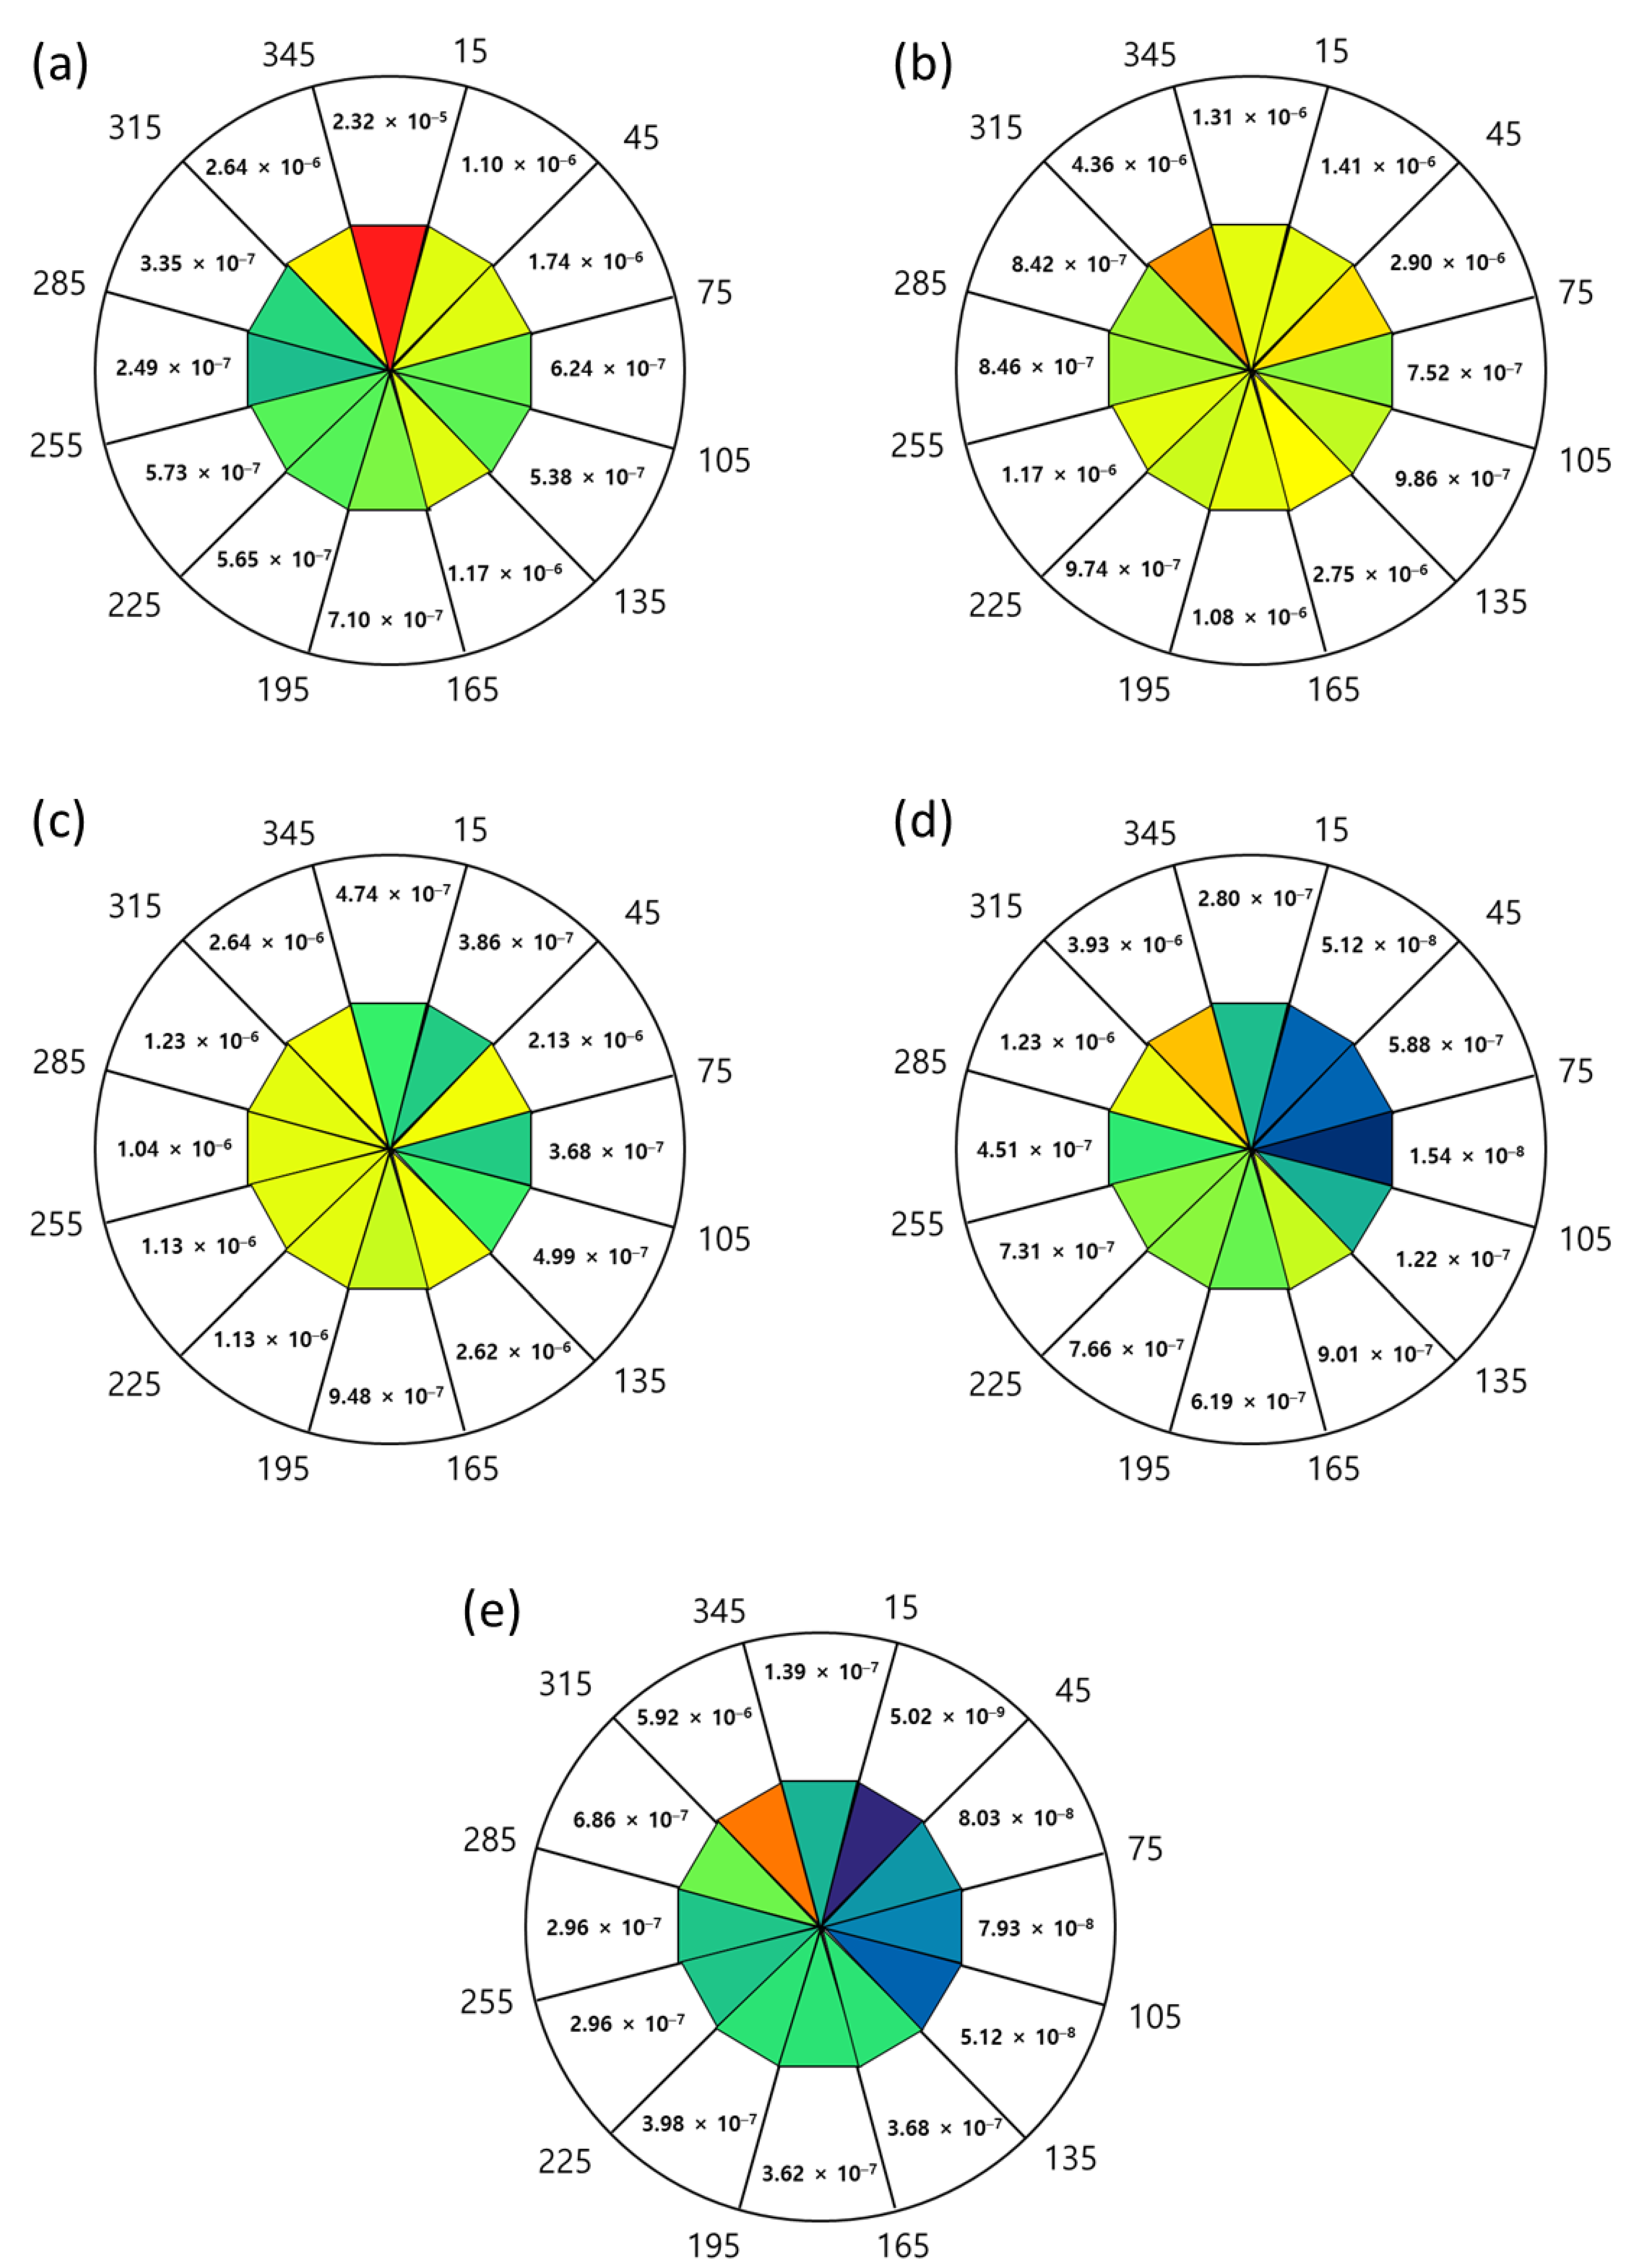
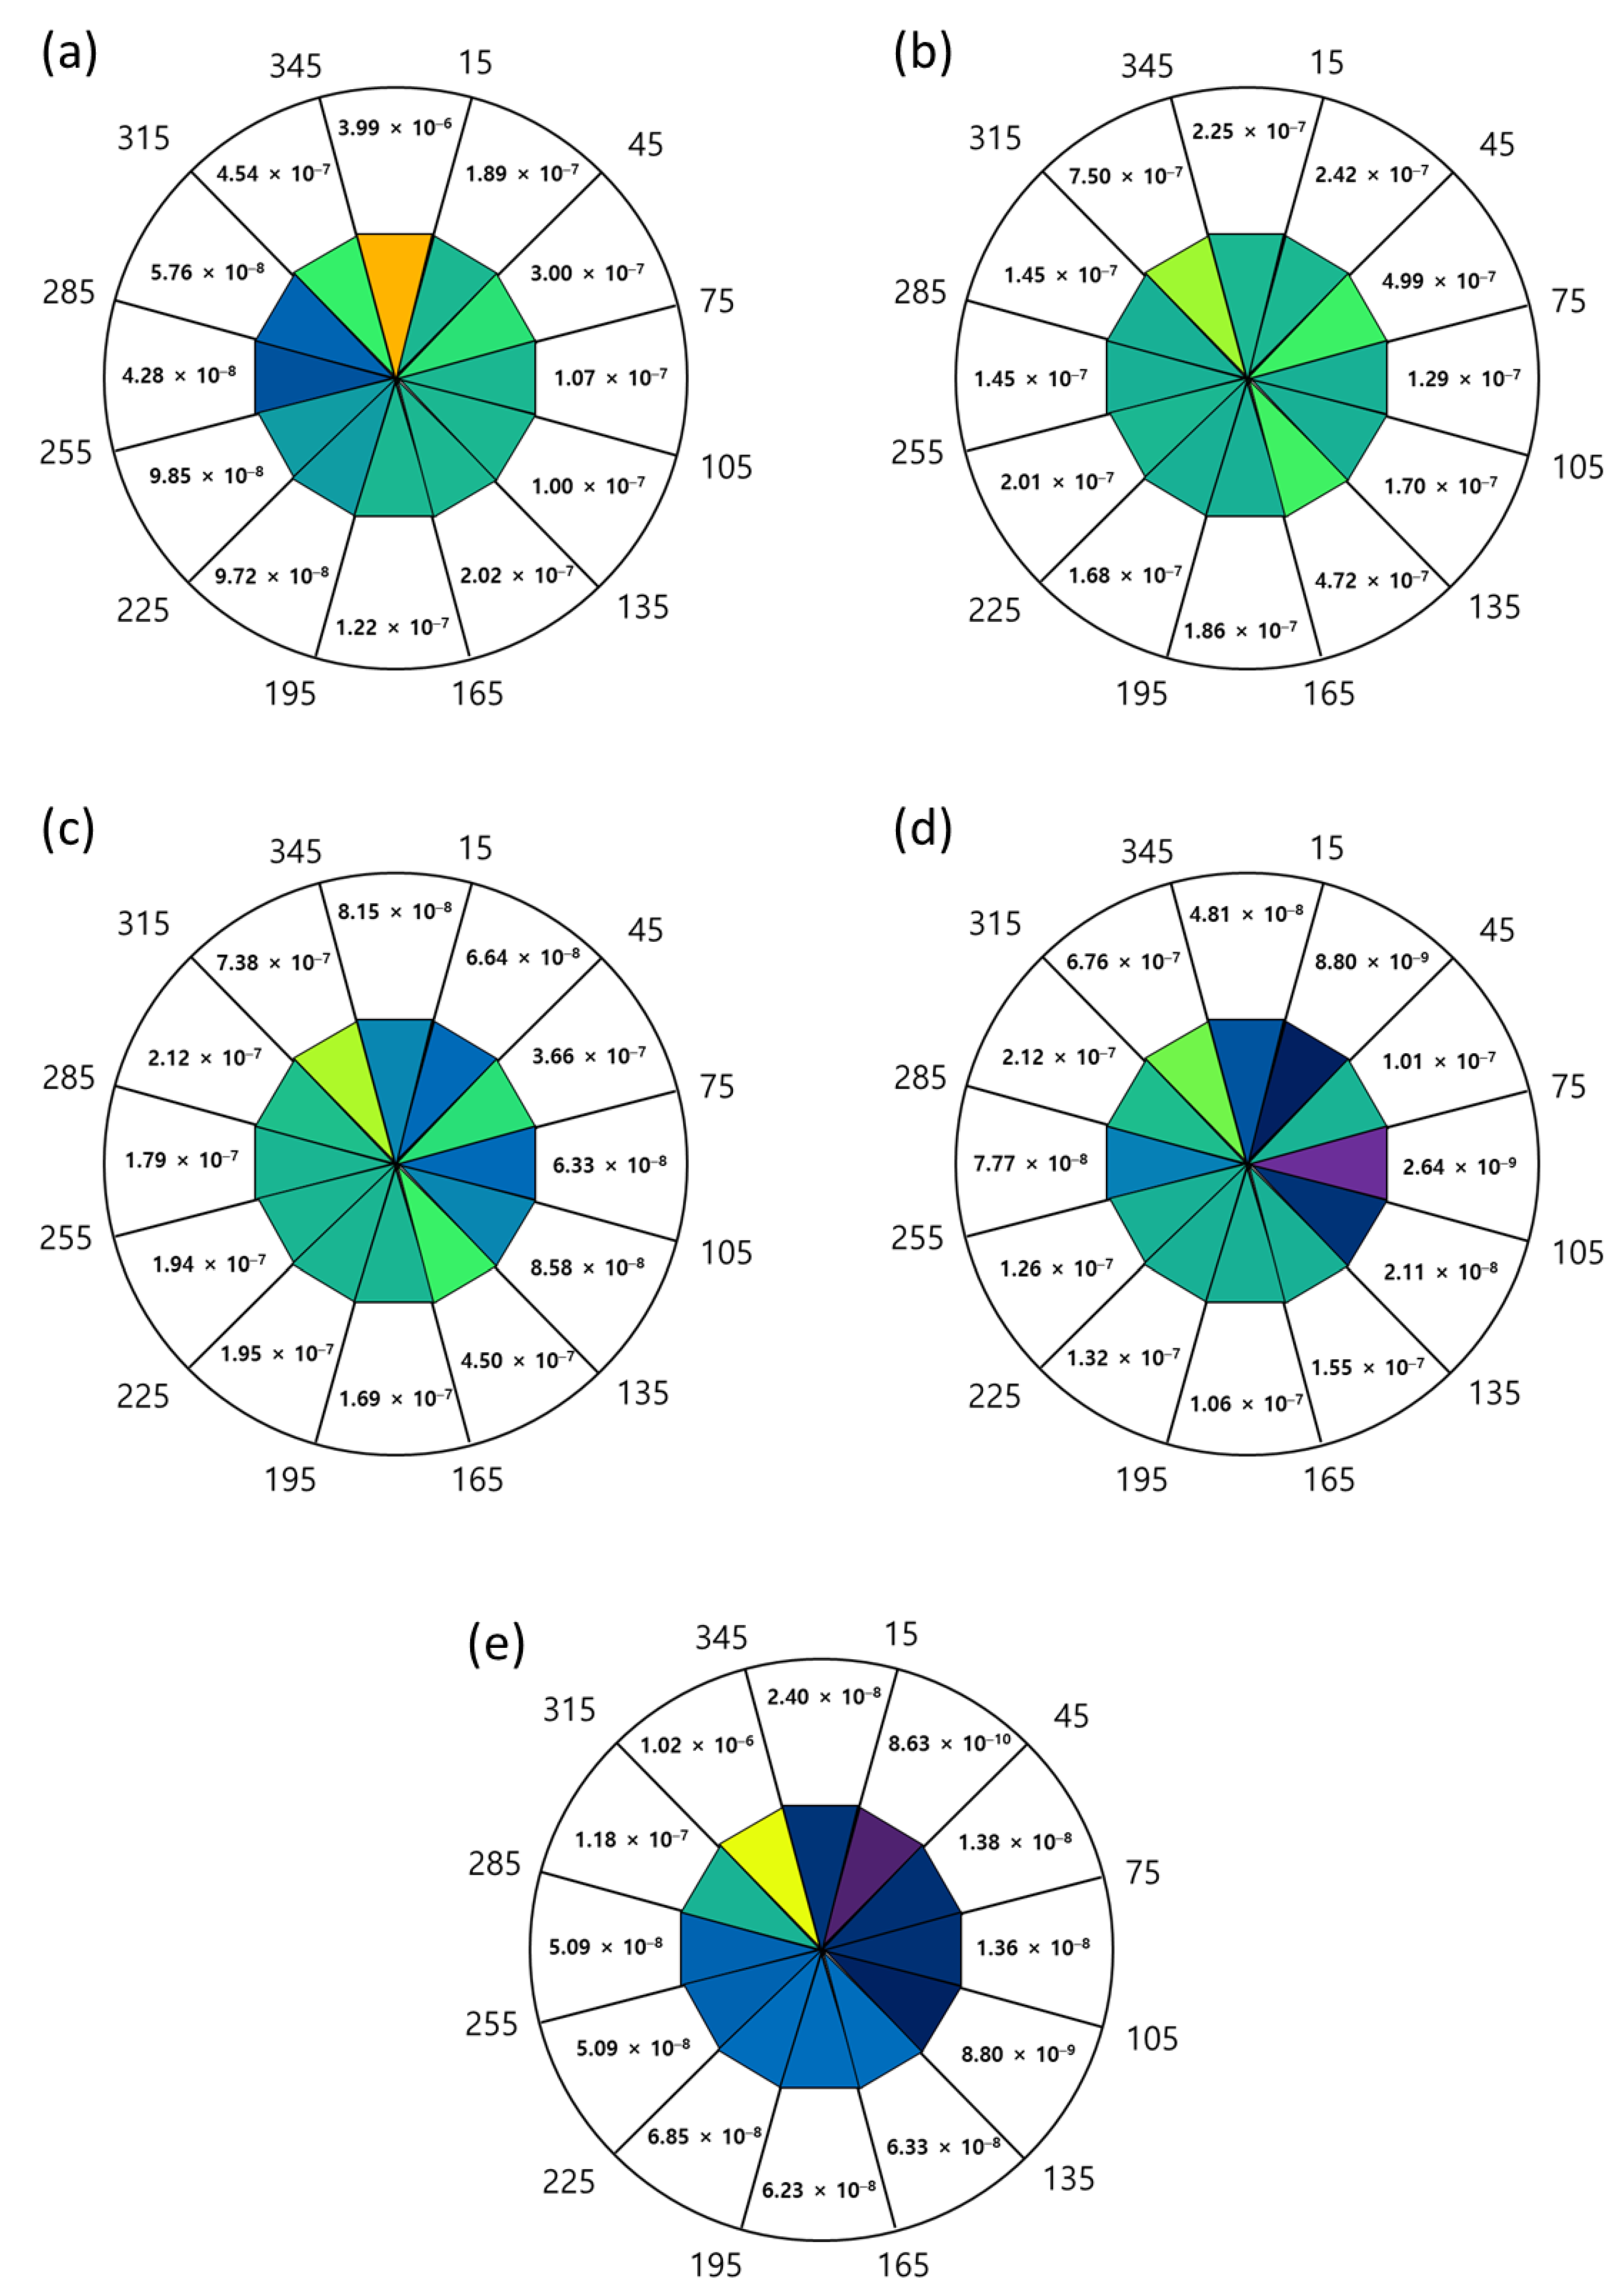
- The highest IR was at 345°–15° for a wind speed of 0–1 m/s and at 315°–345° for wind speeds >1 m/s. The lowest IR was at 255°–285° for a wind speed of 0–1 m/s, 75°–105° for wind speeds of 1–4 m/s, and 15°–45° for wind speeds >4 m/s. The IR showed similar tendencies at different fatality probabilities.
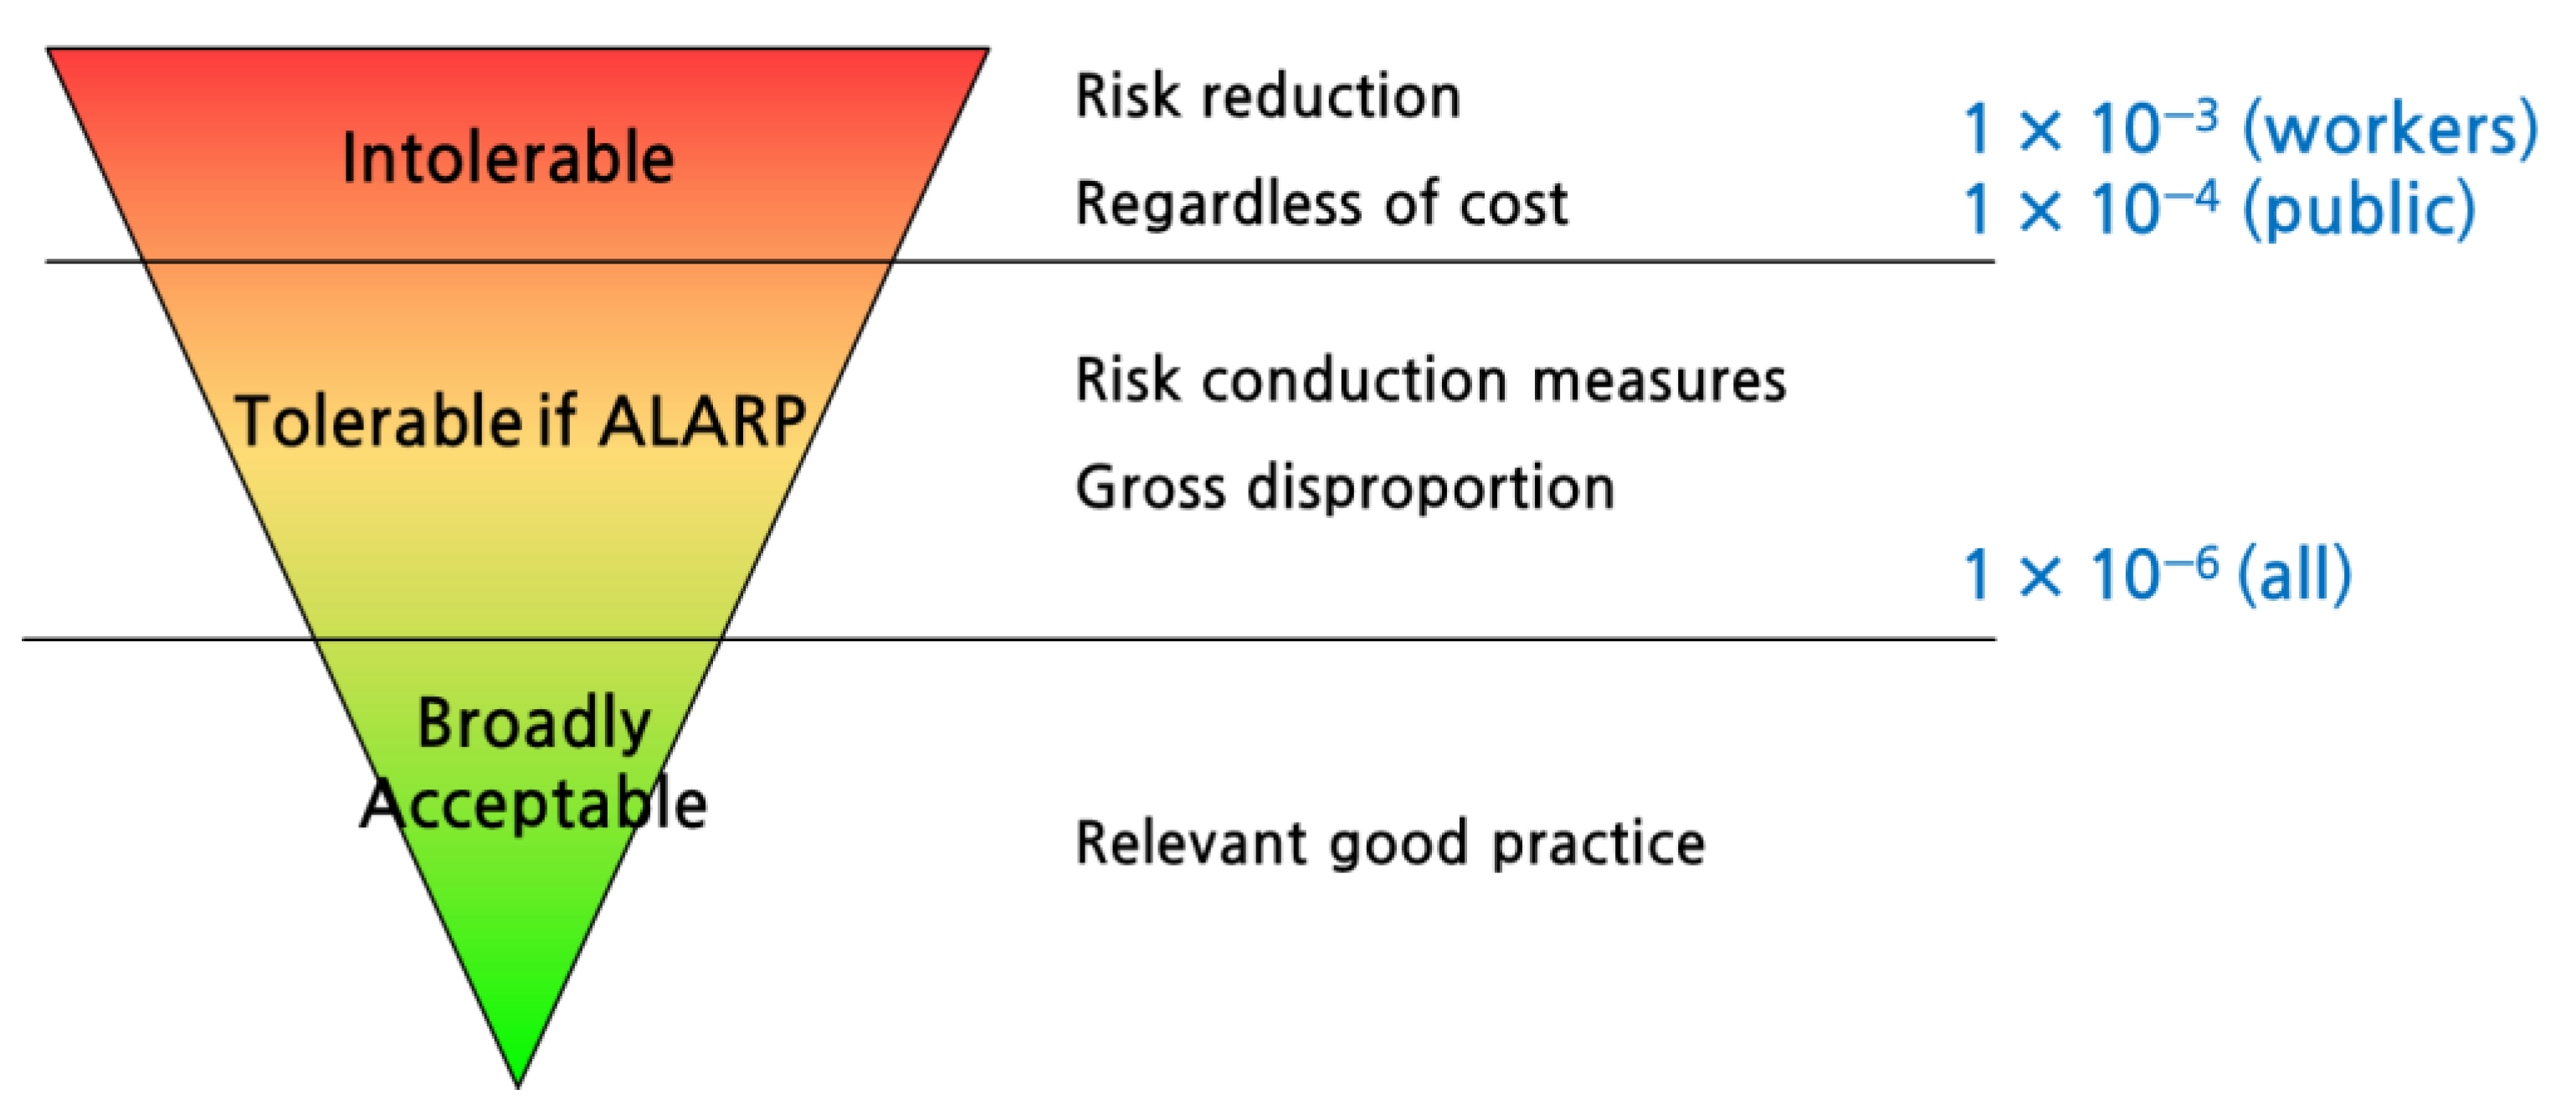
- The individual risk from jet fire in an aerospace facility was calculated that maximum risk is 3.35 × 10⁻⁵, minimum is 1.49 × 10⁻⁶. The highest IR of 3.35 × 10⁻⁵ is within the tolerable range according to the risk assessment criteria set by HSE ALARP standard. Furthermore, all individual risks were satisfied with the ALARP standard, regardless of wind speed and fatality. Therefore, the risk of metal hose jet fire was tolerable.
- As a result of sensitivity analysis according to , which is an important factor in considering individual risk results for metal hose jet fire, this study appeared that all individual risks satisfy the tolerable criteria, even if the value is maximum.
Author Contributions
Funding
Institutional Review Board Statement
Informed Consent Statement
Data Availability Statement
Acknowledgments
Conflicts of Interest
Nomenclature
| IR of population group k (1/year) | |
| Overall fraction of time that population group k is in the area (-) | |
| Probability that population group k is at location i (-) | |
| Frequency of fatalities at location i (-) | |
| Frequency of event outcome j (1/year) | |
| Probabilities of fatality produced by event outcome j (-) | |
| Probabilities of weather conditions produced by event outcome j (-) | |
| Probability of the direction required to produce event outcome i (-) | |
| Time that the target is exposed to radiation (s) | |
| Thermal radiation flux (W/m2) | |
| Mass flow rate of leakage (kg/s) | |
| Distance between the target and the center of the flame zone (m) | |
| Jet breakup length (m) | |
| Weber number | |
| Reynolds number | |
| Density (kg/m3) | |
| Jet velocity (m/s) | |
| Diameter of nozzle or hole (m) | |
| Surface tension (N/m) | |
| Viscosity (kg/m/s) | |
| Overall fraction of time that a person is in a given area (-) | |
| Probability that the person is at a location (-) | |
| Fire probability of the metal hose (1/year) | |
| The fatality probability of a jet fire (-) | |
| Probability that the jet fire will be in one of the wind rose (-) |
References
- West Yorkshire Fire & Rescue Service (WYFRA). Methods of Fire Risk Assessment (Fire Safety Training), West Yorkshire Fire & Rescue Service Procedure & Guidance Fire Safety, UK. 2011. Available online: https://www.westyorksfire.gov.uk/your-safety/work/fire-risk-assessments/ (accessed on 15 June 2020).
- Burt, B.A. Definitions of Risk. J. Dent. Educ. 2001, 65, 1007–1008. [Google Scholar] [CrossRef] [PubMed]
- Alp, E.; Eng, P.; Atkinson, D.; Beatty, R.; De Gagne, D.; Gagner, V.; Gulbinas, E.; Hilber, M.; Hyatt, N.; Kelly, B.; et al. Risk Assessment—Recommended Practices for Municipalities and Industry; Canadian Society for Chemical Engineering: Ottawa, ON, Canada, 2004; Available online: https://www.cheminst.ca/about/about-csche/ (accessed on 7 September 2018).
- Uijt de Haag, P.A.M.; Ale, B.J.M. Guidelines for quantitative risk assessment, CPR 18E. In TNO Purple Book; Netherlands Or-ganisation for Applied Scientific Research: The Hague, The Netherlands, 2005. [Google Scholar]
- CCPS (Center for Chemical Process Safety). Event Probability and Failure Frequency Analysis. In Guidelines for Chemical Process Quantitative Risk Analysis, 2nd ed.; American Institute of Chemical Engineers: New York, NY, USA, 2010. [Google Scholar]
- Cummings, M.L. Factors that Influence the Acceptance of New Aerospace Risk Assessment Techniques. AIAA Scitech Forum 2020. [Google Scholar] [CrossRef]
- Gonzales, E.; Murray, D. FAA’s Approaches to Ground and NAS Separation Distances for Commercial Rocket Launches. In Proceedings of the 48th AIAA Aerospace Sciences Meeting Including the New Horizons Forum and Aerospace Exposition, Orlando, FL, USA, 4–7 January 2010; pp. 1–12. [Google Scholar]
- Altavilla, A.; Garbellini, L. Risk assessment in the aerospace industry. Saf. Sci. 2002, 40, 271–298. [Google Scholar] [CrossRef]
- Padiha, D.; Butt, C.; Tisato, J.; Wilson, S. The Australian approach to ground population modelling and risk assessment. In Proceedings of the 4th IAASS Workshop on Launch and Re-entry Safety, Chincoteague, VA, USA, 18 September 2012; pp. 1–6. [Google Scholar]
- Lariviere, M.; Kezirian, M.T. Preliminary safety assessment of the DLR SpaceLiner vehicle. J. Space Saf. Eng. 2019, 6, 15–23. [Google Scholar] [CrossRef]
- Coccorullo, I.; Russo, P. Jet fire consequence modeling for high-pressure gas pipelines. AIP Conf. Proc. 2016, 1790, 110007. [Google Scholar] [CrossRef]
- Jo, Y.-D.; Ahn, B.J. A method of quantitative risk assessment for transmission pipeline carrying natural gas. J. Hazard. Mater. 2005, 123, 34. [Google Scholar] [CrossRef]
- Lee, S.; Landucci, G.; Reniers, G.; Paltrinieri, N. Validation of Dynamic Risk Analysis Supporting Integrated Operations Across Systems. Sustainability 2019, 11, 6745. [Google Scholar] [CrossRef] [Green Version]
- Goerlandt, F.; Khakzad, N.; Reniers, G. Validity and validation of safety-related quantitative risk analysis: A review. Saf. Sci. 2017, 99, 127–139. [Google Scholar] [CrossRef]
- Tixier, J.; Dusserre, G.; Salvi, O.; Gaston, D. Review of 62 risk analysis methodologies of industrial plants. J. Loss Prev. Process. Ind. 2002, 15, 291–303. [Google Scholar] [CrossRef] [Green Version]
- Lee, S. Quantitative risk assessment of fire & explosion for regasification process of an LNG-FSRU. Ocean Eng. 2020, 197, 106825. [Google Scholar] [CrossRef]
- Roos, A.J. Methods for the Determination of Possible Damage, CPR 16E. In TNO Green Book; Netherlands Organisation for Applied Scientific Research: The Hague, The Netherlands, 1992. [Google Scholar]
- Han, Z.; Weng, W. An integrated quantitative risk analysis method for natural gas pipeline network. J. Loss Prev. Process. Ind. 2010, 23, 428–436. [Google Scholar] [CrossRef]
- Franks, A. A Simplified Approach to Estimating Individual Risk, Health & Safety Executive, UK. 2017. Available online: https://www.hse.gov.uk/research/misc/vectra300-2017-r03.pdf (accessed on 23 June 2019).
- Miesse, C.C. Correlation of Experimental Data on the Disintegration of Liquid Jets. Ind. Eng. Chem. 1955, 47, 1690–1701. [Google Scholar] [CrossRef]
- Washington, J. Failure Rate and Event Data for Use within Risk Assessments. Health & Safety Executive, UK. 2012. Available online: https://wwwhsegovuk/landuseplanning/failure-ratespdf (accessed on 6 February 2018).
- Cox, A.W.; Lees, F.P.; Ang, M.L. Classification of Hazardous Locations; IChemE: London, UK, 1990; pp. 56–61. [Google Scholar]
- Magee, J.W.; Bruno, T.J.; Friend, D.G.; Huber, M.L.; Laesecke, A.; Lemmon, E.W.; McLinden, M.O.; Perkins, R.A.; Baranski, J.; Widegren, J.A. Thermophysical Properties Measurements and Models for Rocket Propellant RP-1: Phase I, National Institute of Standards and Technology (NIST), USA. 2007. Available online: https://nvlpubs.nist.gov/nistpubs/Legacy/IR/nistir6646.pdf/ (accessed on 10 December 2021).
- Vukadinovic, V.; Habisreuther, P.; Zarzalis, N. Influence of pressure and temperature on laminar burning velocity and markstein number of kerosene jet A-1: Experimental and numerical study. Fuel 2013, 111, 401–410. [Google Scholar] [CrossRef]
- Franks, A.; Maddison, T. A Simplified Method for the Estimation of Individual Risk. Process. Saf. Environ. Prot. 2006, 84, 101–108. [Google Scholar] [CrossRef]
- Shao, H.; Duan, G. Risk Quantitative Calculation and ALOHA Simulation on the Leakage Accident of Natural Gas Power Plant. Procedia Eng. 2012, 45, 352–359. [Google Scholar] [CrossRef] [Green Version]
- Kim, S.B.; Kim, Y.H.; Lee, C.; Um, S.I.; Ko, J.W.; Baek, J.B. A study on the individual and societal risk estimation for the use and storage facility with toxic materials. J. Korean Soc. Saf. 1997, 12, 51–59. Available online: https://www.koreascience.or.kr/article/JAKO199711922390725.page (accessed on 23 May 2021).
- Renjith, V.R.; Madhu, G. Individual and societal risk analysis and mapping of human vulnerability to chemical accidents in the vicinity of an industrial area. Int. J. Appl. Eng. Res. 2010, 1, 135–148. Available online: https://www.semanticscholar.org/paper/Individual-and-societal-risk-analysis-and-mapping-RenjithV-Madhu/af09801ce0302f54fd67740704a1b36c1486d654 (accessed on 19 October 2021).
- Skřínský, J.; Sluka, V.; Senčík, J.; Pražáková, M.; Maly, S. Application of emergency planning criteria for the control of major accident hazards—Calculation of the consequences of fire accidents. Saf. Reliab. Risk Anal. 2013, 2013, 135–142. [Google Scholar] [CrossRef]
- Ma, L.; Li, Y.; Liang, L.; Li, M.; Cheng, L. A novel method of quantitative risk assessment based on grid difference of pipe-line sections. Saf. Sci. 2013, 59, 219–226. [Google Scholar] [CrossRef]
- Bayvel, L.; Orzechowski, Z. Liquid Atomization, 1st ed.; Taylor & Francis: Milton Park, FL, USA, 1993. [Google Scholar]
- Lefebvre, H.; McDonell, V.G. Atomization and Sprays, 2nd ed.; CRC Press: Boca Raton, FL, USA, 2017. [Google Scholar]
- Bremond, N.; Clanet, C.; Villermaux, E. Atomization of undulating liquid sheets. J. Fluid Mech. 2007, 585, 421–456. [Google Scholar] [CrossRef]
- Chen, X.; Ma, D.-J.; Yang, V.; Popinet, S. High-fidelity simulations of impinging jet atomization. At. Sprays 2013, 23, 1079–1101. [Google Scholar] [CrossRef] [Green Version]
- Khan, O.S.; Baek, S.W.; Hojat, G. On the autoignition and combustion characteristics of kerosene droplets at elevated pressure and temperature. Combust. Sci. Technol. 2007, 179, 2437–2451. [Google Scholar]
- Inoue, C.; Watanabe, T.; Himeno, T. Numerical Analysis on Dynamics and Inner Structures of Liquid Jet in Pinch-Off. In Proceedings of the 43rd AIAA/ASME/SAE/ASEE Joint Propulsion Conference & Exhibit, Cincinnati, OH, USA, 8–11 July 2007. [Google Scholar]
- Wang, T.-S. Thermophysics Characterization of Kerosene Combustion. J. Thermophys. Heat Transf. 2001, 15, 140–147. [Google Scholar] [CrossRef] [Green Version]
- Daycock, J.H.; Rew, P.J. Development of a Method for the Determination of On-Site Ignition Probabilities; Health & Safety Executive: Bootle, UK, 2004. Available online: https://www.hse.gov.uk/research/rrhtm/rr226.htm (accessed on 22 May 2019).
- Zhu, C.; Jiang, J.; Yuan, X. Study on Ignition Probability of Flammable Materials after Leakage Accidents. Procedia Eng. 2012, 45, 435–441. [Google Scholar] [CrossRef] [Green Version]
- Rew, P.J.; Spencer, H. A framework for ignition probability of flammable gas clouds. Icheme. Symp. Ser. 2005, 141, 151–162. Available online: https://wwwsemanticscholarorg/paper/A-FRAMEWORK-FOR-IGNITION-PROBABILITY-OF-FLAMMABLE-Rew-Spencer/3c0e49153a49710d3e448ef62af2aaa371406153 (accessed on 23 August 2018).
- Applequist, S. Wind Rose Bias Correction. J. Appl. Meteorol. Clim. 2012, 51, 1305–1309. [Google Scholar] [CrossRef]
- Slusser, W. Wind Rose Maps of the United States. Weather 1965, 18, 260–263. [Google Scholar] [CrossRef]
- Varma, S.A.K.; Srimurali, M.; Varma, S.V. Evolution of wind rose diagrams for RTPP. Kadapa, AP, India. Int. J. Innovat. Res. Dev. 2013, 2, 2278. Available online: https://wwwsemanticscholarorg/paper/Evolution-of-Wind-Rose-Diagrams-for-RTPP%2C-KADAPA%2C-Varma-Srimurali/652d3848683cd8f43fe46f0b2df85915b1db1752 (accessed on 13 January 2021).
- Bharani, R.; Sivaprakasam, A. Meteorosoft: A excel function for wind data processing and rose diagram. Earth Sci. Inform. 2019, 13, 965–971. [Google Scholar] [CrossRef]
- Thé, J.L.; Thé, C.L.; Johnson, M.A. WRPLOT View Release Notes; Lakes Environmental: Waterloo, ON, Canada, 2018. [Google Scholar]
- Amir-Heidari, P.; Maknoon, R.; Taheri, B.; Bazyari, M. Identification of strategies to reduce accidents and losses in drilling industry by comprehensive HSE risk assessment—A case study in Iranian drilling industry. J. Loss Prev. Process. Ind. 2016, 44, 405–413. [Google Scholar] [CrossRef]
- Brookes, K.; Limbert, C.; Deacy, C.; O’Reilly, A.; Scott, S.; Thirlaway, K. Systematic review: Work-related stress and the HSE Management Standards. Occup. Med. 2013, 63, 463–472. [Google Scholar] [CrossRef] [Green Version]
- Baybutt, P. The ALARP principle in process safety. Process. Saf. Prog. 2014, 33, 36–40. [Google Scholar] [CrossRef]
- Melchers, R. On the ALARP approach to risk management. Reliab. Eng. Syst. Saf. 2001, 71, 201–208. [Google Scholar] [CrossRef]
- Maselli, G.; Macchiaroli, M.; Nesticò, A. ALARP Criteria to Estimate Acceptability and Tolerability Thresholds of the Investment Risk. Appl. Sci. 2021, 11, 9086. [Google Scholar] [CrossRef]


| Physical Properties | Value | Physical Properties | Value |
|---|---|---|---|
| Critical temperature (°C) | 321.45 | Viscosity (N·s/m2) | 0.00164 |
| Boiling point (°C) | 150.82 | Critical pressure (bar) | 22.9 |
| Flammable/toxic | Flammable | Surface tension (N/m) | 0.0275 |
| Molecular weight (g/mol) | 128.258 | Upper flammable limit (%) | 5.6 |
| Lower flammable limit (%) | 0.7 | Density (kg/m3) | 820 |
| Heat of combustion (kJ/kg) | 43,200 | Burning velocity (mm/s) | 0.07 |
| Diameter (mm) | Velocity (m/s) | Reynolds Number | Weber Number | Breakup Length (m) |
|---|---|---|---|---|
| 10 | 169.7 | 8.5 × 10⁵ | 8.6 × 10⁶ | 3.11 |
| 13 | 100.4 | 6.5 × 10⁵ | 4.0 × 10⁶ | 3.20 |
| 15 | 75.4 | 5.7 × 10⁵ | 2.6 × 10⁶ | 3.28 |
| 20 | 42.4 | 4.4 × 10⁵ | 1.1 × 10⁶ | 3.43 |
| 25 | 27.2 | 3.7 × 10⁵ | 6.4 × 10⁵ | 3.59 |
| 30 | 18.9 | 3.3 × 10⁵ | 4.3 × 10⁵ | 3.77 |
| 35 | 13.9 | 3.1 × 10⁵ | 3.3 × 10⁵ | 3.98 |
| 40 | 10.6 | 3.1 × 10⁵ | 2.8 × 10⁵ | 4.24 |
| Release Rate | Ignition Probability of a Liquid |
|---|---|
| <1 kg/s | 1.0 × 10⁻² |
| 1–50 kg/s | 3.0 × 10⁻² |
| >50 kg/s | 8.0 × 10⁻² |
| Direction (°) | 0–1 (m/s) | 1–2 (m/s) | 2–3 (m/s) | 3–4 (m/s) | >4 (m/s) |
|---|---|---|---|---|---|
| 345–15 | 26.65380 | 1.50060 | 0.54358 | 0.32131 | 0.16008 |
| 15–45 | 1.25990 | 1.61807 | 0.44338 | 0.05873 | 0.00576 |
| 45–75 | 1.99926 | 3.33057 | 2.44034 | 0.67487 | 0.09213 |
| 75–105 | 0.71633 | 0.86374 | 0.42266 | 0.17620 | 0.09098 |
| 105–135 | 0.66911 | 1.13207 | 0.57237 | 0.14050 | 0.05873 |
| 135–165 | 1.34628 | 3.15206 | 3.00350 | 1.03418 | 0.42266 |
| 165–195 | 0.81537 | 1.23802 | 1.12977 | 0.71057 | 0.41575 |
| 195–225 | 0.64838 | 1.11825 | 1.29906 | 0.87871 | 0.45720 |
| 225–255 | 0.65759 | 1.34397 | 1.29791 | 0.83955 | 0.33974 |
| 255–285 | 0.28561 | 0.97084 | 1.19426 | 0.51824 | 0.18772 |
| 285–315 | 0.38465 | 0.96623 | 1.41307 | 0.92938 | 0.78773 |
| 315–345 | 3.02999 | 5.00622 | 4.92330 | 4.50871 | 6.79358 |
| Total | 38.46620 | 22.24060 | 18.68320 | 10.79100 | 9.81205 |
| Ignition Probability | Failure Probability | Metal Hose Fire Probability |
|---|---|---|
| 3.0 × 10⁻² | 1.0 × 10⁻² | 3.0 × 10⁻⁴ |
| Metal Hose Release Rate | 99% Fatality Area 99% Fatality Distance | 50% Fatality Area 50% Fatality Distance | 1% Fatality Area 1% Fatality Distance |
|---|---|---|---|
| 10.93 kg/s | 493.87 m2 3.20~12.94 m | 518.01 m2 12.94~18.23 m | 1027.71 m2 18.23~25.68 m |
| IR (Jet Fire) | |||||
|---|---|---|---|---|---|
| 99% | 0.33 | 0.88 | 3.0 × 10⁻⁴ | 1 | 12 directions |
| 50% | 0.33 | 0.88 | 3.0 × 10⁻⁴ | 0.805 | 12 directions |
| 1% | 0.33 | 0.88 | 3.0 × 10⁻⁴ | 0.172 | 12 directions |
Publisher’s Note: MDPI stays neutral with regard to jurisdictional claims in published maps and institutional affiliations. |
© 2021 by the authors. Licensee MDPI, Basel, Switzerland. This article is an open access article distributed under the terms and conditions of the Creative Commons Attribution (CC BY) license (https://creativecommons.org/licenses/by/4.0/).
Share and Cite
Kim, H.J.; Jang, K.M.; Yeo, I.S.; Oh, H.Y.; Kang, S.I.; Jung, E.S. Quantitative Risk Assessment for Aerospace Facility According to Windrose. Energies 2022, 15, 189. https://doi.org/10.3390/en15010189
Kim HJ, Jang KM, Yeo IS, Oh HY, Kang SI, Jung ES. Quantitative Risk Assessment for Aerospace Facility According to Windrose. Energies. 2022; 15(1):189. https://doi.org/10.3390/en15010189
Chicago/Turabian StyleKim, Hee Jin, Kyeong Min Jang, In Seok Yeo, Hwa Young Oh, Sun Il Kang, and Eun Sang Jung. 2022. "Quantitative Risk Assessment for Aerospace Facility According to Windrose" Energies 15, no. 1: 189. https://doi.org/10.3390/en15010189
APA StyleKim, H. J., Jang, K. M., Yeo, I. S., Oh, H. Y., Kang, S. I., & Jung, E. S. (2022). Quantitative Risk Assessment for Aerospace Facility According to Windrose. Energies, 15(1), 189. https://doi.org/10.3390/en15010189