Abstract
Satisfying the mobile traffic demand in next generation cellular networks increases the cost of energy supply. Renewable energy sources are a promising solution to power base stations in a self-sufficient and cost-effective manner. This paper presents an optimal method for designing a photovoltaic (PV)-battery system to supply base stations in cellular networks. A systematic approach is proposed for determining the power rating of the photovoltaic generator and battery capacity from a technical and economical point of view in order to minimize investment cost as well as operational expenditure, while the power autonomy of the PV-battery system is maximized in a multi-objective optimization framework. The proposed method is applied to optimally size a photovoltaic-battery system for three cases with different availability of solar power to investigate the effect of environmental conditions. Problem-solving using the proposed approach leads to a set of solutions at different costs versus different levels of power autonomy. According to the importance of each criterion and the preference of decision-makers, one of the achieved solutions can be selected for the implementation of the photovoltaic-battery system to supply base stations in cellular networks.
1. Introduction
In recent years, the energy consumption of information and communication technology (ICT) has become an economic issue for operators and a major challenge for sustainable development [1]. The energy consumption of the ICT industry accounts for approximately 3% of global annual energy consumption and is growing at an annual rate of 15–20% [1]. The carbon footprint from ICT is furthermore predicted to increase 7.3% annually and exceed 14% of the global footprint by 2040. The need to bring next generation cellular telecommunication network services to areas that do not have access to a reliable power grid results in a variety of objective challenges for telecom providers, government agencies, and researchers. Solar-powered cellular telecommunication networks can be particularly significant for regions that have poor grid connectivity while being rich in solar resources [2]. Using solar energy for supplying cellular telecommunication networks not only reduces the carbon emission, but also lowers operational cost as compared to powering from the grid or conventional sources of energy [3].
Deployment of renewable sources, such as solar photovoltaic (PV) panels, is currently increasing in order to meet the needs of growing energy demand and to mitigate the impact of fossil pollutants on the environment and guarantee socio-economic benefits for sustainable development [4]. Despite their advantages, the intermittent nature of most of the renewable sources is still a challenge that can be resolved by hybridization. A renewable-hybrid energy system (RHES) combines renewable energy sources (RESs), energy storage (ES) devices, such as batteries, and the electrical grid to supply the base stations [5].
Research has been done concerning the possibility of powering a base station in a telecommunication network with solar PV panels and battery for ES such that the base station could operate even when the PV panel was not producing energy. In [5], the authors studied cellular access networks, which solely relied on renewable energy, while in [6], an exchange link between the PV panels and the main grid exists. Authors in [7] suggested a traffic-aware renewable energy assisted base station cooperation. The focus of some papers, [8,9,10,11], was on the overview of sustainable and green mobile network deployment, while some others, [12,13], focused on modeling the behavior of renewable-based base stations in order to dimension the system components correctly by understanding the system characteristics. In [12,13,14], a study was presented about the Markovian models to compute the possibility of base station interruption in a solar-powered cellular network. In [12], two Markov chain models based on solar irradiation data, respectively in two and three successive days were considered. The objective of [12] was to expose the influence of correlation in weather conditions. Furthermore, only the influence of different battery sizes on the operation of the system was studied. Authors in [13] considered a similar model as in [12], while they investigated the impact of three different types of quantization—weather characteristics, duration of time steps, and size of the battery to analyze the performance of renewable energy-based power supply for cellular networks. In [14], a discrete-time Markov procedure for modeling the battery state of charge (SOC) was proposed which could be applied for assessing the impact of system parameters on the base station interruption probability.
Optimal energy management of green next generation telecommunication networks is another aspect which was investigated in [2,15,16,17,18,19,20,21,22,23,24,25,26,27,28,29,30]. The “energy consumption-based and user joint allocation” approach together with “the energy cost-based and user joint allocation” method were presented in [2]. After converting the two multi-objective optimization problems into two convex optimization problems, the convex optimization toolbox in MATLAB (MathWorks corporate, Natick, MA, USA) was used to solve the optimal allocation strategies. The focus in [15] was on decreasing the “on-grid energy consumption in Heterogeneous telecommunication Networks (HetNets)” supplied with hybrid power sources while analyzing the short- and long-term energy efficiency problem. In [16], a user association approach for improving the behavior of hybrid energy-based HetNets was proposed. Authors in [17] considered an online energy management framework for mobile networks, including both on- and off-grid base stations. Reference [18] investigated four techniques, including “the base station sleeping strategy,” “the optimized energy procurement from the smart grid,” “the base station energy sharing”, and “the green networking collaboration between competitive mobile operators”.
In order to provide environmental and economic benefits for wireless operators, these techniques could be exploited separately or together. Optimization of PV panel azimuth angle was considered in [19,20]. The purpose was to attain an acceptable match between the daily energy generation and consumption profiles. In [19], the considered system was off-grid and consisted of one PV cell while in [20], several PV cells were used for powering one on-grid base station and the objective was to optimize the azimuth angles of N PV cells to draw less energy per day from the main grid. Reference [21] presented an analytical method to find a suitable combination of PV panels and batteries to power base stations to reduce the required capital expenditure (CAPEX). In [22], the feasibility of solar PV power generation for cellular networks from technical, economic, and environmental aspects was investigated from a mobile network operator point of view. The power rating of the PV system was determined based on total cost including CAPEX and operational expenditure (OPEX). The effects of quantization in the three parameters of the model including time slot in horizon of study, weather, and ES capacity in dimensioning of the power system of PV-powered off-grid base stations were examined in [23]. The target of [24] was to minimize the installation costs for an unmanned aerial vehicle (UAV)-based cellular network, considering the constraints of UAV’s coverage, solar panel energy consumption, levels of the batteries, and the deployment of the optical ring for connecting the installed sites. In [25], in order to prepare a reliable emission-free and economic power supply, optimal sizing of a hybrid renewable energy system based on a discrete multi-objective grey wolf algorithm was applied in off-grid rural base stations. In [26], a low complexity approach based on a convex optimization framework was proposed for dimensioning PV-battery systems in a stand-alone base station. The techno-economic feasibility of renewable energy-based off-grid cellular base stations was studied in [27]. The stochastic nature of renewable energy sources in addition to the load traffic for distant regions in Bangladesh was also considered. Authors in [28] investigated the layout of green mobile networks (using renewable energies) by setting up an intelligent energy management that facilitates the off-grid operation of base stations. In [29], the validity of some power supply solutions such as “standalone PV”, “hybrid PV-wind turbine,” “hybrid PV-diesel generator”, and “hybrid PV-electric grid” was examined to supply the long-term evolution (LTE) base stations associated with technical, economic, and environmental prospects in Bangladesh. In [30], an energy management strategy was suggested in order to improve the energy efficiency of, and to reduce fuel consumption in, off-grid cellular networks supplied with a hybrid PV-diesel generator system.
Regarding the scope of these studies, it is observed that almost all of them focused on the PV-battery systems, while none of them was dedicated to an accurate model for available PV output power generation estimation. Moreover, in the PV-battery system case, the SOC limits as well as battery operation cost were not considered. Current models of power management in these systems do not take the ambient temperature effect, battery degradation, or feed-in tariff into account. Therefore, this paper will start by defining realistic scenarios used in combination with models of power generation and storage devices to evaluate the power generation capability and ES capacity of PV-battery powered base stations. Subsequently, an optimization framework will be developed and formulated for determining the power rating of PV panels and battery capacity from a technical and economical point of view in order to minimize CAPEX as well as OPEX while the power autonomy of the PV-battery system is maximized.
2. System Structure
Figure 1 illustrates the energy flow within different elements of a solar-powered next generation telecommunication network that consists of a macro base station (MBS) and two small base stations (SBS). The red arrows represent the energy flows, whereas the black-dashed arrows represent the communication links. Each base station is equipped with a PV-battery system. The energy management system (EMS) unit as a central controller collects information regarding power consumption, generation, and ES state, and sends commands to the dispatchable units [3]. The determination of the power rating of the PV system and battery capacity in PV-battery equipped base stations can be tackled by establishing an optimization framework which considers the amount of available power produced by installed PV panels and the profile of power consumed by the base stations (BSs).
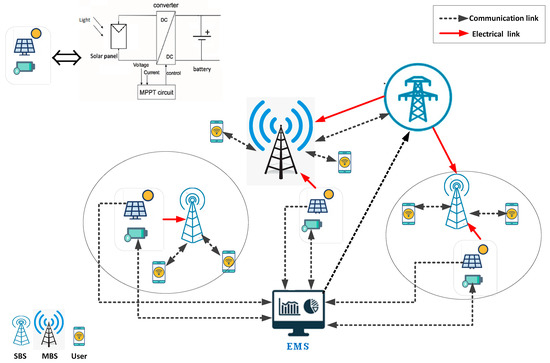
Figure 1.
The configuration of next generation cellular telecommunication networks.
2.1. PV Generation Modeling
The aim of this section is to select a mathematical model for PV power generation. Several models to estimate the output power of a PV system have been proposed in the literature [19]. The solar power generation in different geographical locations depends on a variety of parameters, including solar irradiance and installation angles of PV panels, as well as cell and ambient temperatures [31]. The studied models of solar-powered base stations were investigated while considering some of the above-mentioned parameters. The considered model in this paper is based on the one proposed in [19], while the model is enhanced to include cell temperature effects.
From the photovoltaic geographical information system (PVGIS) database [32], the direct normal irradiance , the diffuse horizontal irradiance , and the global horizontal irradiance in three different case studies of Malaga, Aalborg, and Boujdour are obtained for each hour.
When installing a PV system, the location optimal tilt and azimuth angles, γ and θ, can guarantee the maximum achievable solar power. A detailed research on installation angles of a PV panel was presented in [19].
The generated PV power can be modeled as follows:
where is the PV system rated power. is the received solar irradiance by the PV system which can be calculated as follows:
where , , are the direct-beam, sky-diffuse, and ground-reflected components, respectively.
(the direct-beam component) is defined as follows:
where is the angle of incidence at t and can be calculated in [19] as the following:
with
where the latitude of the installation site is demonstrated by lat, is the declination angle, and is the hour angle at t [19], which are respectively calculated as follows:
where d is the day of the year and AST is the apparent (true) solar time [32], which is calculated as follows:
where LST is the local standard time, LOD is the longitude, LSMT is the local standard meridian time, and EoT is the equation of time [33], which are given, respectively, as follows:
where B is a factor calculated as follows:
(the sky-diffuse component) is defined as the following:
where At is the anisotropy index and is the solar zenith angle, which are calculated as follows:
where Ed, the extraterrestrial radiation, is calculated as follows:
(the ground-reflected component) is defined as follows:
where [0, 1] is the albedo of the ground [19].
In order to make the model more realistic, the panel temperature should be added to the model. The cell temperature is dependent on the ambient temperature and the total irradiation on the PV system is based on the nominal operating cell temperature (NOCT), which is considered 45° [34].
where is the ambient temperature. Accordingly, the generated PV power of (1) is modified as:
where dp (%/°C) is the temperature coefficient which is considered −0.4 in this paper.
In order to validate the built model, the estimated output power based on the presented model using the irradiation and temperature data from the Aalborg University (AAU) site as well as the PVGIS [32] are compared with the measured output power of the installed PV system in the AAU for 23 April 2009 and the results are shown in Figure 2.
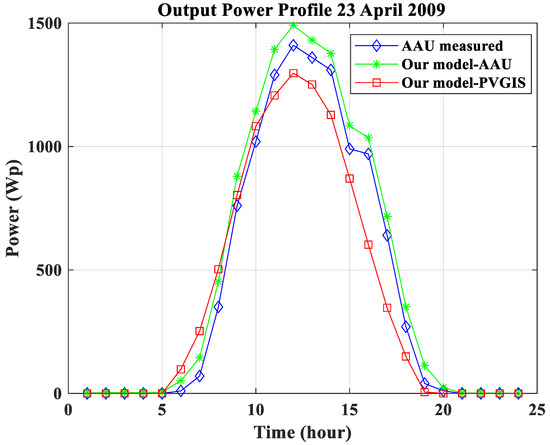
Figure 2.
Comparison of the measured output power (Aalborg University (AAU) measured) of the installed photovoltaic (PV) system in the AAU with the estimated output power based on the presented model using the irradiation and temperature data from the AAU site (Our model-AAU) as well as the photovoltaic geographical information system (PVGIS) (Our model-PVGIS).
2.2. Energy Storage Modeling
In order to deal with the intermittent nature of RESs systems that combine these sources and ES devices, some suggestions were made in the literature. A review of battery energy storage modeling was presented in [35].
In this paper, it is assumed that the solar energy is first used to power the base station, and the excess energy is stored in the battery (if not fully charged). During the periods when no solar energy is being generated, e.g., during the night or in cloudy weather, or if the PV production is not sufficient to satisfy the base station demand, the stored energy can be used. In case the battery fully discharges, the required power can be drawn from the grid, if applicable [3] (Figure 1).
For considering the limitation on the battery charge and discharge rates along with limits on the state of charge (SOC), the following equation and constraints should be satisfied [36]:
where and are, respectively, the minimum and maximum SOC of the battery, is the battery SOC at time t, and are the battery charge and discharge rates at time t, is the battery capacity, and are, respectively, the battery charge and discharge efficiencies, and Δt is the time slot. and are the battery minimum charge and discharge rates, and and are the battery maximum charge and discharge rates, respectively.
3. Problem Formulation
The main advantages of energy harvesting from PV-battery systems in telecommunication networks are: (i) selling the excess power of the PV-battery system to the main grid, and (ii) increasing the power autonomy factor, which leads to increasing the reliability of the system due to the reduction of dependency on the main grid [37].
This section is devoted to the presentation of the considered objective functions including the minimization of the total cost and the maximization of the power autonomy factor of the PV-battery system.
3.1. Minimization of the Total Cost
The first objective () is to minimize the total financial costs of the PV-battery power system, including CAPEX and OPEX, from the mobile network operator (MNO) point of view:
where is the cost of battery in $ and is the installation area of the PV system in m2. is the cost of PV panels in $/kW, is the rental cost of installation area in $/m2, is the power of the main grid in kW, and is the electricity price in $/kWh. H is the horizon of study, which equals D×T (number of days of the year multiplied by the number of hours in a day), and is the battery operational cost, including the SOC-related () as well as DoD-related () costs [38]:
where LBDS is the linear battery degradation cost-slope parameter, LBDI is the linear battery degradation cost-intercept, is capacity fade at end of life, and is the labor cost for battery replacement, the values of which are derived from [38].
3.2. Maximization of the Power Autonomy Factor
Prevention of greenhouse gas emissions is another major goal of PV system implementation in different applications. Accordingly, if the share of the main grid to supply the base stations decreases, the amount of carbon footprint will consequently decrease. Moreover, with the increase of the share of PV-battery systems to supply base stations, the self-sufficiency and power autonomy of telecommunication networks will be enhanced [37].
In order to maximize the power autonomy factor in telecommunication networks, the drawn power from the main grid should be minimized. Hence, the second objective function () is defined as follows:
where and are, respectively, the hourly PV and battery power share for supplying the load. is the hourly electricity demand of the base station.
3.3. Technical Constraints
Beside the battery constraints, one of the most important requirements in power management of base stations is the balance of electricity demand and supply as in the following [39]:
where and are the hourly power of PV panels and battery, respectively.
3.4. Power Dispatch Strategy
The flowchart of the selected power dispatch strategy is illustrated in Figure 3. When the PV generation is more than the load demand, after supplying the load, the extra energy will be stored in the battery if it is not fully charged. Any surplus energy will be delivered to the electric grid. If the PV cannot provide enough energy to supply the load, the first choice is to discharge the battery. If there is not enough energy stored in the battery, then the electricity will be purchased from the main grid such that the power balance be satisfied.
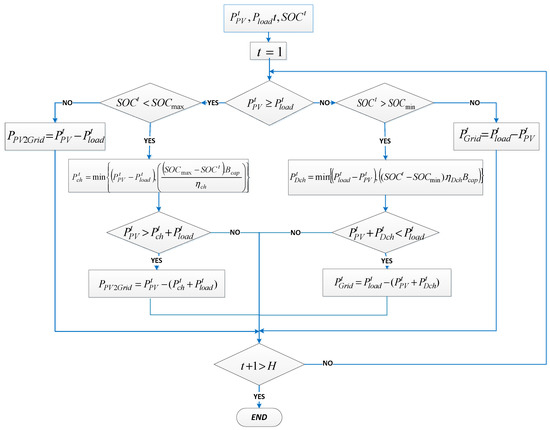
Figure 3.
Flowchart of the power dispatch strategy.
By applying this power dispatch strategy, the dependency of the telecommunication network on the power grid will reduce and this results in the reliability increase of the system. Moreover, this strategy can also be implemented in cases in which the electricity grid is not available. In this situation, when the PV-battery system cannot satisfy the demand, some forms of green programmable energy sources such as hydrogen and fuel cells can be a used [40].
4. Multi-Objective JAYA Algorithm
In order to determine the optimal size and installation (tilt and azimuth) angles of PV panels and the battery capacity to power base stations, a multi-objective optimization framework is proposed in this section. As is mentioned in Section 3, the objectives are minimization of the total financial cost as well as maximization of the power autonomy factor.
The main advantage of using meta-heuristic algorithms in order to solve multi-objective problems is that they deal with a set of feasible solutions, which allows finding different solutions in the Pareto-optimal front by executing the algorithm only once. Moreover, meta-heuristic algorithms are not sensitive to the Pareto front pattern and continuity, which is one of the drawbacks of mathematical programming [41,42]. In order to solve the considered base station power management problem, the multi-objective version of the JAYA algorithm is proposed.
4.1. JAYA Algorithm
Compared to other meta-heuristic algorithms, the JAYA algorithm is simpler and more rapid while there is no need to tune the algorithmic parameters [36,43,44]; hence, the JAYA algorithm is applied in this paper.
The JAYA algorithm proposed by R. Venkata Rao [43] is selected due to its simplicity and rapidity, and as there is no need to have any information about control parameters. The major convenience of the JAYA algorithm is its independence in tuning and controlling the algorithmic parameters. Moreover, based on a detailed comparison between the PSO algorithm and the JAYA algorithm in [36], it is concluded that the JAYA algorithm is more advantageous to be used in solving multi-objective optimization problems.
If f(x) is considered as the objective function to be minimized, it is assumed that m is the number of design variables (i.e., i = 1, 2,…, m) in each iteration iter, and n is the number of solutions (i.e., the size of the population j = 1, 2,…, n). The best solution has the lowest value of f(x) in solution queues and the worst solution has the maximum value of f(x). Considering as the ith variable for the jth solution in iterth iteration, is modified according to the following [36]:
where is the ith variable in best solutions in iterth iteration, and is the ith variable in worst solutions in iterth iteration. is the modified version of ; and and are two random values in range [0, 1]. expresses the tendency of the solution to approach to the best solution, while shows the trend of the solution to get far from the worst solution. If leads to a better objective function value than that of , it is acceptable. At the end of each iteration, best solutions based on the values of the objective function are preserved and will be considered as the population for the next iteration. The best and worst solutions are determined in the recent preserved population for the next iteration. This procedure will continue until the termination criterion is satisfied.
4.2. Multi-Objective JAYA
In the design of the PV-battery system power supply for base stations, a multi-objective JAYA is applied to optimize both total cost and power autonomy factor. However, in order to make the JAYA algorithm suitable for multi-objective optimization problems, the concept of Pareto dominance is associated to generate non-dominated (Pareto-optimal) solutions, which results in Pareto fronts. At the end of each iteration of the multi-objective JAYA, the updated Pareto-optimal solutions are stored in a repository [45]. The steps of the proposed multi-objective framework are as follows:
Step 1. Specify hourly solar irradiations, ambient temperature, geographical location, load profile, the battery specification, the design variables ranges, number of variables, and the termination criterion.
Step 2. Generate initial solutions in the feasible design variable range based on the following:
where X is an array of variables considered as a solution including the battery capacity, the area of installed PV panels, installation angles, battery charge and discharge rates, and the exchanged power with the main grid; and are, respectively, the lower and upper bands of design variables; and rand is a random value in range (0,1).
Step 3. Evaluate the initial solutions, i.e., check the constraints and calculate the objective functions.
Step 4. Determine and store non-dominated solutions in the repository.
Step 5. Determine the best and the worst solutions.
Step 6. Set iter = 1
Step 7. In order to achieve new (modified) solutions, apply the JAYA algorithm based on (27) to each solution.
Step 8. For each new solution, check the battery constraints according to (15)–(18) and the power balance constraint (26). Calculate the objective functions for each new solution.
Step 9. If any of the new solutions is better than the current ones, replace the current solution by the corresponding modified solution.
Step 10. The non-dominated solutions in the modified solutions are identified and stored in the repository. The best and worst solutions are then determined among the stored solutions.
Step 11. Check the termination criterion and if satisfied, terminate the algorithm and go to Step 12; otherwise, set iter = iter + 1 and return to Step 7.
Step 12. Print the solutions in the repository as the Pareto-optimal front.
5. Simulation Results
In order to verify the effectiveness of the proposed approach, it is applied to three cases with different availability of solar power, namely, Aalborg, Denmark, Malaga, Spain, and Boujdour, Morocco to investigate the effect of environmental conditions. The hourly power consumption profiles of a base station in commercial and residential areas [23] on a weekday and weekend are shown in Figure 4. According to the results of [23], a reasonable choice for time slot for a one-year horizon of study is considered equal to one hour. The price for buying electricity based on time-of-use prices (TOU) are shown in Table 1, for Aalborg, Malaga, while the one-third of these prices is considered for the Boujdour, Morocco case. The cost of the PV panel and the battery are considered 1350 $/kWp and 500 $/kWh, respectively [37]. The considered yearly rental cost of the sites for commercial and residential areas are provided in Table 2. The proposed method was implemented in a MATLAB environment. The population size (the number of candidate solutions) and number of maximum iterations in the JAYA algorithm are considered 50 and 200, respectively. Table 3 presents the system variables and their range.
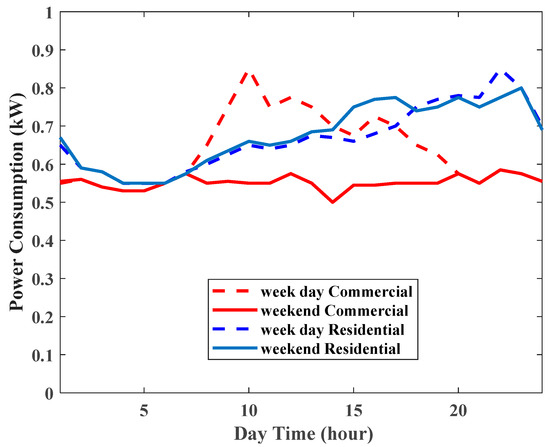
Figure 4.
Weekday and weekend power consumption for a macro base station in commercial and residential areas.

Table 1.
Electricity tariffs.
Table 2.
Rental cost for base station sites.
Table 3.
System variables and their range.
Figure 5 demonstrates the Pareto-optimal solutions of different power autonomy levels at different values of total cost for a PV-battery system-powered base station in a commercial area in the Aalborg, Malaga and Boujdour case studies. As is observed, a high level of power autonomy leads to a higher total cost, and vice versa. According to Figure 5 to achieve a 70% power autonomy factor for Aalborg, the total cost is $35,000, while for Malaga and Boujdour, the total cost is $15,000 and $12,000, respectively.
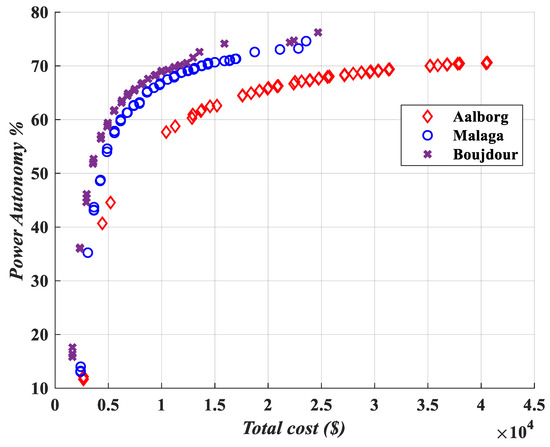
Figure 5.
Pareto-optimal solutions of different power autonomy levels at different values of total cost in a commercial area.
Figure 6, Figure 7 and Figure 8 respectively show the values of total cost and power autonomy factor for a variety of peak PV power and battery capacity values for Malaga, Aalborg and Boujdour in commercial area case studies. Accordingly, as an example, for achieving a power autonomy factor of 70%, in the case of Malaga, installation of a 4.9 kWp PV panel and a 5 kWh battery is required. In the case of Aalborg, installation of a 10.5 kWp PV panel and a 15 kWh battery is required, while in the case of Boujdour, installation of a 3.4 kWp PV panel and a 9 kWh battery is required.
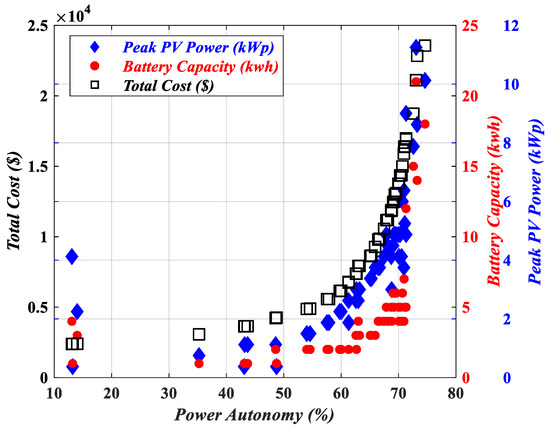
Figure 6.
Total cost and power autonomy factor for a variety of PV panel installation areas and battery capacity values for Malaga (commercial area).
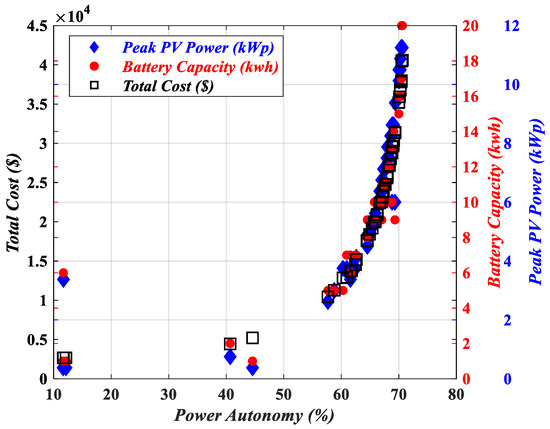
Figure 7.
Total cost and power autonomy factor for a variety of PV panel installation areas and battery capacity values for Aalborg (commercial area).
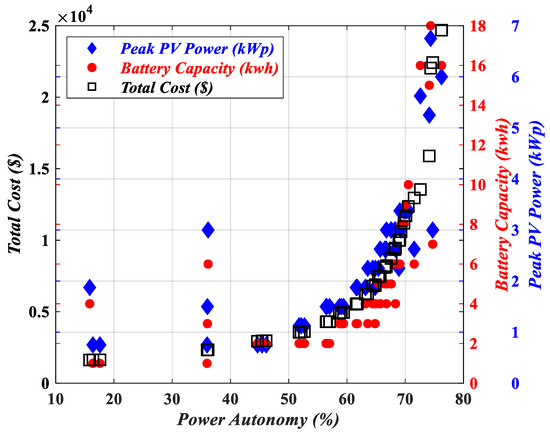
Figure 8.
Total cost and power autonomy factor for a variety of PV panel installation areas and battery capacity values for Boujdour (commercial area).
Figure 9 demonstrates the Pareto-optimal solutions of different power autonomy levels at different values of total cost for a PV-battery system-powered base station in a residential area in Aalborg, Malaga and Boujdour. According to Figure 9, in the case of Aalborg, it is difficult to achieve a power autonomy factor of 70% due to the low solar irradiation. However, in order to achieve a maximum power autonomy factor of 68% in Aalborg, the total cost equals $35,000. For Malaga, the maximum achievable power autonomy factor is 71% for a total cost of $24,000. For Boujdour, the maximum achievable power autonomy factor is 73% for a total cost of $27,700.
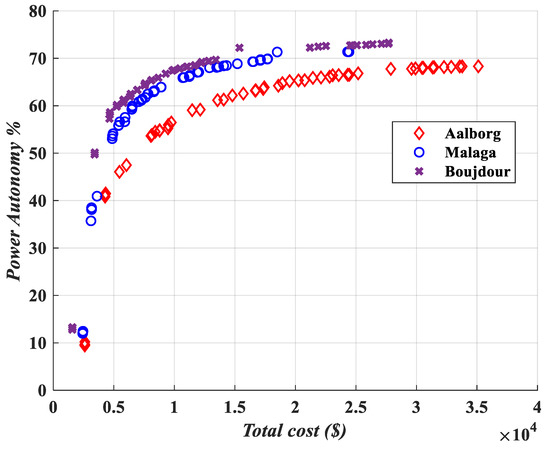
Figure 9.
Pareto-optimal solutions of different power autonomy levels at different values of total cost in a residential area.
Figure 10, Figure 11 and Figure 12 respectively show the values of total cost and power autonomy factor for a variety of peak PV power and battery capacity values for Malaga, Aalborg and Boujdour in residential area case studies. Accordingly, as an example, in the case of Malaga, to achieve a power autonomy factor of 68%, installation of a 5.3 kWp PV panel and a 9 kWh battery is required, which leads to a total cost of $12,900. For the case study of Aalborg, in order to have a power autonomy factor of 68%, installation of a 11.25 kWp PV panel and a 19 kWh battery is required, which leads to a total cost of $35,000. In Boujdour, a 4.5 kWp PV panel and a 5 kWh battery need to be installed, which leads to a total cost of $10,400.
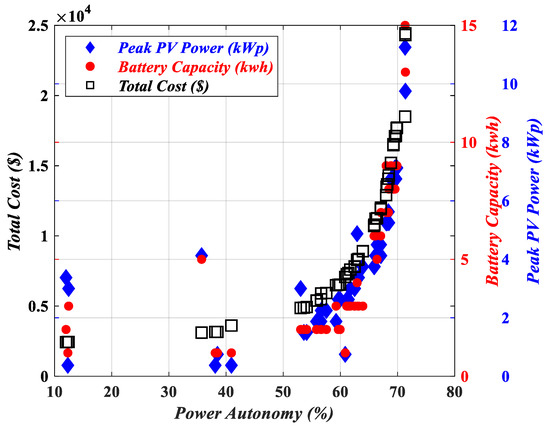
Figure 10.
Total cost and power autonomy factor for a variety of PV panel installation areas and battery capacity values for Malaga (residential area).
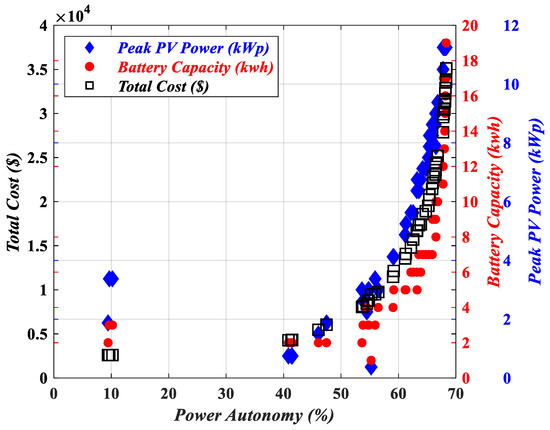
Figure 11.
Total cost and power autonomy factor for a variety of PV panel installation areas and battery capacity values for Aalborg (residential area).
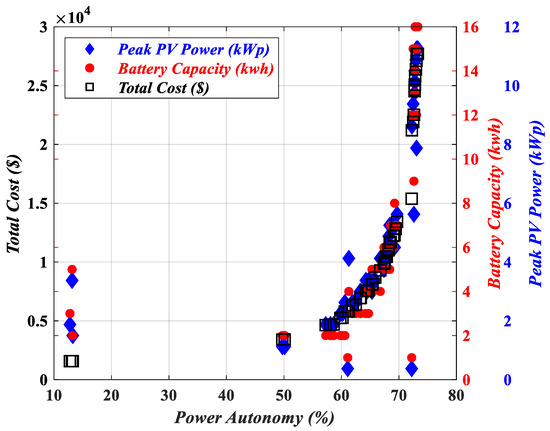
Figure 12.
Total cost and power autonomy factor for a variety of PV panel installation areas and battery capacity values for Boujdour (residential area).
According to Figure 5 and Figure 9, solving the PV-battery dimensioning problem for supplying base stations in cellular networks leads to a set of solutions with different values of economic index (total cost) and self-sufficiency (power autonomy). Consequently, based on the priority of each of the mentioned indices, an MNO can adopt one of the solutions. If the economic aspect is of high importance, the adopted solution leads to a low power autonomy level; on the other hand, if the self-sufficiency aspect is more important, supplying the base station using a PV-battery system leads to a high economic cost. The MNO should always adopt a trade-off between these two approaches.
Based on the peak PV power ranging from zero to 11.25 kWp with an interval of 0.375 kWp and the battery capacity ranging from 0 kWh to 30 kWh for azimuth and tilt angles −13° and 19°, Figure 13 and Figure 14 respectively illustrate the annual total cost yield and power autonomy factor for the case study of a commercial area in Aalborg. According to the results, a higher power autonomy factor is achievable with higher total cost since these considered objectives for the optimization problem are in conflict.
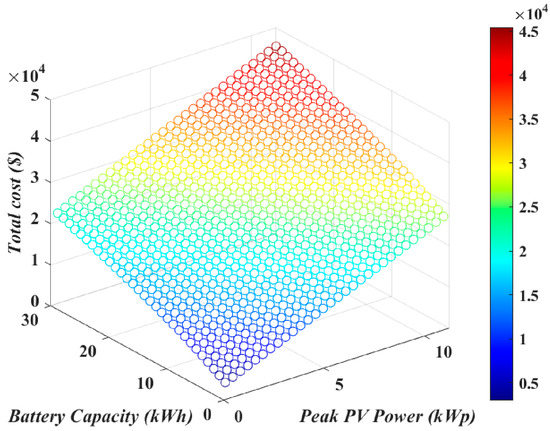
Figure 13.
Total cost for a variety of PV-battery system combinations to supply a commercial base station in Aalborg.
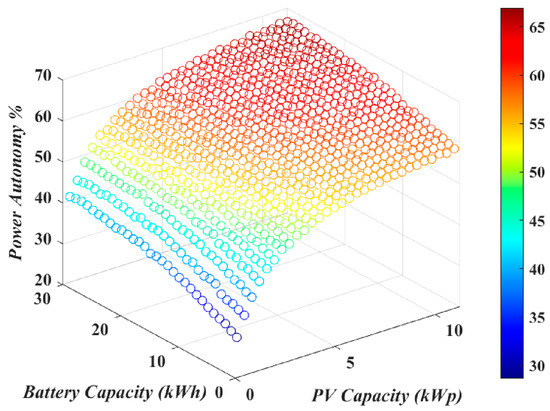
Figure 14.
Power autonomy factor performance for different PV-battery system combinations to supply a commercial base station in Aalborg.
According to Figure 13 and Figure 14, if the PV panel with the maximum peak power is installed in a commercial area in Aalborg, when the battery capacity is increased, it only leads to a higher total cost value, while the maximum achievable power autonomy factor does not improve.
Figure 15, Figure 16 and Figure 17 illustrate the annual daily maximum achievable power autonomy for Malaga, Aalborg, and Boujdour, respectively. It is shown in Figure 15 that the maximum value of power autonomy factor for Malaga is between 70 to 80%, which is achieved during summer. However, the lower values of power autonomy factor are during winter and autumn.
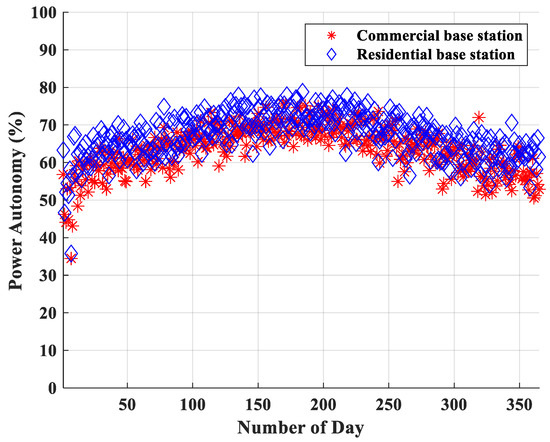
Figure 15.
Power autonomy factor for Malaga throughout the year.
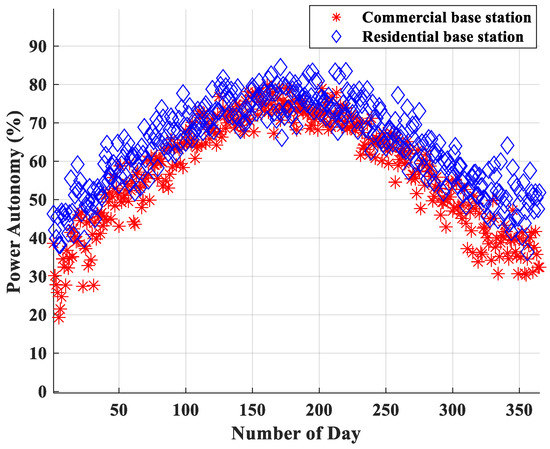
Figure 16.
Power autonomy factor for Aalborg throughout the year.
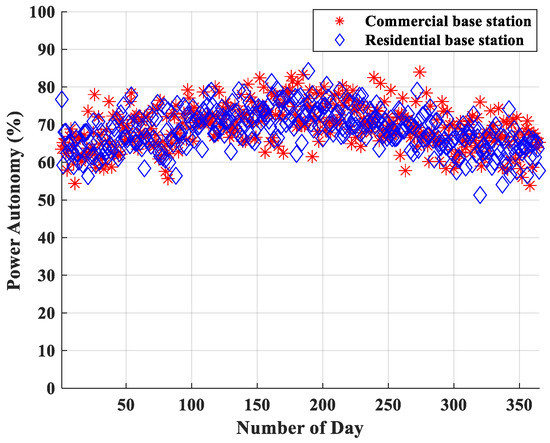
Figure 17.
Power autonomy factor for Boujdour throughout the year.
According to Figure 16, it is observed that for Aalborg during winter and autumn, since there is less solar availability, a lower daily power autonomy factor is achieved. In summer, however, the daily power autonomy factor can reach to values higher than 70%.
From Figure 17, for Boujdour, the highest values of power autonomy factor during summer are higher than 80%, while these values are between 50 to 60% during winter and autumn.
6. Conclusions
The densification of 5G cellular telecommunication networks leads to an extensive energy demand. An advantageous solution to power base stations is RESs, which can both decrease the emission and operational cost while increasing the power autonomy of the system. However, due to the intermittent nature of RESs, an optimal dimension of renewable-based plus battery power supply is essential to power cellular networks self-sufficiently. In this paper, an optimal method for designing a PV-battery system to supply base stations in cellular networks to maximize power autonomy and minimize the total cost of the system is presented. The effect of solar power availability on optimal PV-battery sizing is investigated by comparing results on three different geographical locations, and a detailed analysis of the results leads to the following observations. For achieving a power autonomy factor of 70%, the total cost for the Aalborg case study is three times that of the total cost of Boujdour and two times that of Malaga. Consequently, in order to determine the optimal PV-battery system to supply base stations in cellular networks, the exact power generation of the supply system and consumption profiles of the base station deployment site should be available. Since the power supply of a grid-connected base station is investigated in this paper, future work can focus on solving the problem in a situation where a reliable power grid is not available; however, in cases that 100% power autonomy has not been achieved, another source, such as fuel cell, may be needed to power off-grid base stations. Furthermore, in order to decide on the highest economic design of the PV-battery system for supplying base stations in the next generation cellular telecommunication networks, different energy storage devices as well as a variety of battery technologies can be investigated.
Author Contributions
Conceptualization, M.J. and H.P.; methodology, M.J., H.P. and T.K.; software, M.J. and H.P.; validation, M.J., H.P. and T.K.; formal analysis, M.J.; investigation, M.J.; writing—original draft preparation, M.J.; writing—review and editing, T.K., D.S., S.S. and J.M.G.; supervision, T.K., D.S., S.S. and J.M.G. All authors have read and agreed to the published version of the manuscript.
Funding
This research was funded by the European Union’s Horizon 2020 research and innovation programme under the Marie Sklodowska-Curie grant agreement No 812991.
Institutional Review Board Statement
Not applicable.
Informed Consent Statement
Not applicable.
Data Availability Statement
Not applicable.
Conflicts of Interest
The authors declare no conflict of interest.
References
- Han, D.; Li, S.; Peng, Y.; Chen, Z. Energy sharing-based energy and user joint allocation method in heterogeneous network. IEEE Access 2020, 8, 37077–37086. [Google Scholar] [CrossRef]
- Tran, H.-V.; Kaddoum, G.; Diamantoulakis, P.D.; Abou-Rjeily, C.; Karagiannidis, G.K. Ultra-small cell networks with collaborative RF and lightwave power transfer. IEEE Trans. Commun. 2019, 67, 6243–6255. [Google Scholar] [CrossRef]
- Chamola, V.; Sikdar, B. Solar powered cellular base stations: Current scenario, issues and proposed solutions. IEEE Commun. Mag. 2016, 54, 108–114. [Google Scholar] [CrossRef]
- Rokrok, E.; Javidsharifi, M.; Pourroshanfekr, H.; Javidsharifi, B. Adaptive Nonlinear Control Scheme for Three-Phase Grid-Connected PV Central Inverters. In Proceedings of the 29th International Power System Conference (PSC), Terhan, Iran, 27 October 2014; pp. 1–7. [Google Scholar]
- Marsan, M.G.A.; Bucalo, G.; Di Caro, A.; Meo, M.; Zhang, Y. Towards Zero Grid Electricity Networking: Powering BSs with Renewable Energy Sources. In Proceedings of the 2013 IEEE International Conference on Communications Workshops (ICC), Budapest, Hungary, 9–13 June 2013; pp. 596–601. [Google Scholar]
- Meo, M.; Zhang, Y.; Gerboni, R.; Marsan, M.A. Dimensioning the power supply of a LTE macro BS connected to a PV panel and the power grid. In Proceedings of the 2015 IEEE International Conference on Communications (ICC), London, UK, 8–12 June 2015; pp. 178–184. [Google Scholar]
- Ahmed, F.; Naeem, M.; Ejaz, W.; Iqbal, M.; Anpalagan, A.; Kim, H.S. Renewable energy assisted traffic aware cellular base station energy cooperation. Energies 2018, 11, 99. [Google Scholar] [CrossRef]
- Alsharif, M.H.; Kim, J.; Kim, J.H. Green and sustainable cellular base stations: An overview and future research directions. Energies 2017, 10, 587. [Google Scholar] [CrossRef]
- Kusakana, K.; Vermaak, H.J. Hybrid renewable power systems for mobile telephony base stations in developing countries. Renew. Energy 2013, 51, 419–425. [Google Scholar] [CrossRef]
- Aris, A.M.; Shabani, B. Sustainable power supply solutions for off-grid base stations. Energies 2015, 8, 10904–10941. [Google Scholar] [CrossRef]
- Khare, V.; Nema, S.; Baredar, P. Status of solar wind renewable energy in India. Renew. Sustain. Energy Rev. 2013, 27, 1–10. [Google Scholar] [CrossRef]
- Song, J.; Krishnamurthy, V.; Kwasinski, A.; Sharma, R. Development of a Markov-chain-based energy storage model for power supply availability assessment of photovoltaic generation plants. IEEE Trans. Sustain. Energy 2012, 4, 491–500. [Google Scholar] [CrossRef]
- Leonardi, G.; Meo, M.; Marsan, M.A. Markovian Models of Solar Power Supply for a LTE Macro BS. In Proceedings of the 2016 IEEE International Conference on Communications (ICC) Kuala Lumpur, Malaysia, 22–27 May 2016; pp. 1–7. [Google Scholar]
- Chamola, V.; Sikdar, B. Outage Estimation for Solar Powered Cellular Base Stations. In Proceedings of the 2015 IEEE International Conference on Communications (ICC), London, UK, 8–12 June 2015; pp. 172–177. [Google Scholar]
- Fletscher, L.A.; Suárez, L.A.; Grace, D.; Peroni, C.V.; Maestre, J.M. Energy-aware resource management in heterogeneous cellular networks with hybrid energy sources. IEEE Trans. Netw. Serv. Manag. 2018, 16, 279–293. [Google Scholar] [CrossRef]
- Tang, L.; Hu, H. Multi-Objective Optimization of User Association in HetNets with Hybrid Power Supply. IEEE Trans. Green Commun. Netw. 2019, 3, 933–941. [Google Scholar] [CrossRef]
- Gambín, Á.F.; Scalabrin, M.; Rossi, M. Online power management strategies for energy harvesting mobile networks. IEEE Trans. Green Commun. Netw. 2019, 3, 721–738. [Google Scholar] [CrossRef]
- Ghazzai, H.; Yaacoub, E.; Kadri, A.; Yanikomeroglu, H.; Alouini, M.-S. Next-generation environment-aware cellular networks: Modern green techniques and implementation challenges. IEEE Access 2016, 4, 5010–5029. [Google Scholar] [CrossRef]
- Benda, D.; Sun, S.; Chu, X.; Quek, T.Q.; Buckley, A. PV cell angle optimization for energy generation-consumption matching in a solar powered cellular network. IEEE Trans. Green Commun. Netw. 2017, 2, 40–48. [Google Scholar] [CrossRef]
- Benda, D.; Sun, S.; Chu, X.; Buckley, A.; Quek, T.Q. PV cell orientation angles optimization for a base station equipped with several PV cells. IEEE Trans. Green Commun. Netw. 2019, 4, 194–208. [Google Scholar] [CrossRef]
- Renga, D.; Meo, M. Dimensioning renewable energy systems to power mobile networks. IEEE Trans. Green Commun. Netw. 2019, 3, 366–380. [Google Scholar] [CrossRef]
- De Souza, M.A.; de Souza Farias, F.; Kuribayashi, H.P.; Francês, C.R.; Costa, J.C.; Cardoso, D.L. A Photovoltaic System for Heterogeneous Networks: A Technical, Economic and Environmental Analysis. J. Commun. Inf. Syst. 2020, 35, 90–102. [Google Scholar] [CrossRef]
- Da Silva, A.P.C.; Renga, D.; Meo, M.; Marsan, M.A. The impact of quantization on the design of solar power systems for cellular base stations. IEEE Trans. Green Commun. Netw. 2017, 2, 260–274. [Google Scholar] [CrossRef]
- Chiaraviglio, L.; Amorosi, L.; Blefari-Melazzi, N.; Dell’Olmo, P.; Mastro, A.L.; Natalino, C.; Monti, P. Minimum Cost Design of Cellular Networks in Rural Areas With UAVs, Optical Rings, Solar Panels, and Batteries. IEEE Trans. Green Commun. Netw. 2019, 3, 901–918. [Google Scholar] [CrossRef]
- Kaur, R.; Krishnasamy, V.; Kandasamy, N.K.; Kumar, S. Discrete multiobjective grey wolf algorithm based optimal sizing and sensitivity analysis of PV-wind-battery system for rural telecom towers. IEEE Syst. J. 2019, 14, 729–737. [Google Scholar] [CrossRef]
- Suman, S.; De, S. Low complexity dimensioning of sustainable solar-enabled systems: A case of base station. IEEE Trans. Sustain. Comput. 2019, 5, 438–454. [Google Scholar] [CrossRef]
- Jahid, A.; Monju, M.K.H.; Hossain, M.E.; Hossain, M.F. Renewable energy assisted cost aware sustainable off-grid base stations with energy cooperation. IEEE Access 2018, 6, 60900–60920. [Google Scholar] [CrossRef]
- Piovesan, N.; Temesgene, D.A.; Miozzo, M.; Dini, P. Joint load control and energy sharing for autonomous operation of 5g mobile networks in micro-grids. IEEE Access 2019, 7, 31140–31150. [Google Scholar] [CrossRef]
- Jahid, A.; Hossain, M.S.; Monju, M.K.H.; Rahman, M.F.; Hossain, M.F. Techno-economic and energy efficiency analysis of optimal power supply solutions for green cellular base stations. IEEE Access 2020, 8, 43776–43795. [Google Scholar] [CrossRef]
- Jahid, A.; Islam, M.S.; Hossain, M.S.; Hossain, M.E.; Monju, M.K.H.; Hossain, M.F. Toward energy efficiency aware renewable energy management in green cellular networks with joint coordination. IEEE Access 2019, 7, 75782–75797. [Google Scholar] [CrossRef]
- Fortuna, L.; Nunnari, G.; Nunnari, S. A new fine-grained classification strategy for solar daily radiation patterns. Pattern Recognit. Lett. 2016, 81, 110–117. [Google Scholar] [CrossRef]
- Huld, T.; Müller, R.; Gambardella, A. A new solar radiation database for estimating PV performance in Europe and Africa. Sol. Energy 2012, 86, 1803–1815. [Google Scholar] [CrossRef]
- Khatib, T.; Elmenreich, W. A model for hourly solar radiation data generation from daily solar radiation data using a generalized regression artificial neural network. Int. J. Photoenergy 2015, 2015. [Google Scholar] [CrossRef]
- Al Garni, H.Z.; Awasthi, A.; Wright, D. Optimal orientation angles for maximizing energy yield for solar PV in Saudi Arabia. Renew. Energy 2019, 133, 538–550. [Google Scholar] [CrossRef]
- Sidorov, D.; Muftahov, I.; Tomin, N.; Karamov, D.; Panasetsky, D.; Dreglea, A.; Liu, F.; Foley, A. A dynamic analysis of energy storage with renewable and diesel generation using Volterra equations. IEEE Trans. Ind. Inform. 2019, 16, 3451–3459. [Google Scholar] [CrossRef]
- Ahmadi, S.; Arabani, H.P.; Haghighi, D.A.; Guerrero, J.M.; Ashgevari, Y.; Akbarimajd, A. Optimal use of vehicle-to-grid technology to modify the load profile of the distribution system. J. Energy Storage 2020, 31, 101627. [Google Scholar] [CrossRef]
- Bandyopadhyay, S.; Mouli, G.R.C.; Qin, Z.; Elizondo, L.R.; Bauer, P. Techno-economical model based optimal sizing of PV-battery systems for microgrids. IEEE Trans. Sustain. Energy 2019, 11, 1657–1668. [Google Scholar] [CrossRef]
- Crow, M.L. Electric vehicle scheduling considering co-optimized customer and system objectives. IEEE Trans. Sustain. Energy 2017, 9, 410–419. [Google Scholar]
- Javidsharifi, M.; Niknam, T.; Aghaei, J.; Mokryani, G.; Papadopoulos, P. Multi-objective day-ahead scheduling of microgrids using modified grey wolf optimizer algorithm. J. Intell. Fuzzy Syst. 2019, 36, 2857–2870. [Google Scholar] [CrossRef]
- Bartolucci, L.; Cordiner, S.; Mulone, V.; Pasquale, S. Fuel cell based hybrid renewable energy systems for off-grid telecom stations: Data analysis and system optimization. Appl. Energy 2019, 252, 113386. [Google Scholar] [CrossRef]
- Javidsharifi, M.; Niknam, T.; Aghaei, J.; Mokryani, G. Multi-objective short-term scheduling of a renewable-based microgrid in the presence of tidal resources and storage devices. Appl. Energy 2018, 216, 367–381. [Google Scholar] [CrossRef]
- Narimani, M.R.; Vahed, A.A.; Azizipanah-Abarghooee, R.; Javidsharifi, M. Enhanced gravitational search algorithm for multi-objective distribution feeder reconfiguration considering reliability, loss and operational cost. IET Gener. Transm. Distrib. 2014, 8, 55–69. [Google Scholar] [CrossRef]
- Rao, R. Jaya: A simple and new optimization algorithm for solving constrained and unconstrained optimization problems. Int. J. Ind. Eng. Comput. 2016, 7, 19–34. [Google Scholar]
- Javidsharifi, M.; Niknam, T.; Aghaei, J.; Shafie-khah, M.; Catalão, J.P. Probabilistic Model for Microgrids Optimal Energy Management Considering AC Network Constraints. EEE Syst. J. 2019, 14, 2703–2712. [Google Scholar] [CrossRef]
- Mahboubi-Moghaddam, E.; Narimani, M.R.; Khooban, M.H.; Azizivahed, A.; Sharifi, M. Multi-objective distribution feeder reconfiguration to improve transient stability, and minimize power loss and operation cost using an enhanced evolutionary algorithm at the presence of distributed generations. Int. J. Electr. Power Energy Syst. 2016, 76, 35–43. [Google Scholar] [CrossRef]
Publisher’s Note: MDPI stays neutral with regard to jurisdictional claims in published maps and institutional affiliations. |
© 2021 by the authors. Licensee MDPI, Basel, Switzerland. This article is an open access article distributed under the terms and conditions of the Creative Commons Attribution (CC BY) license (http://creativecommons.org/licenses/by/4.0/).