
Quenching Experiments with CrAl-coated Zircaloy Cladding in Reflooding Water Flows


Abstract
1. Introduction
2. Experimental Methods and Procedure
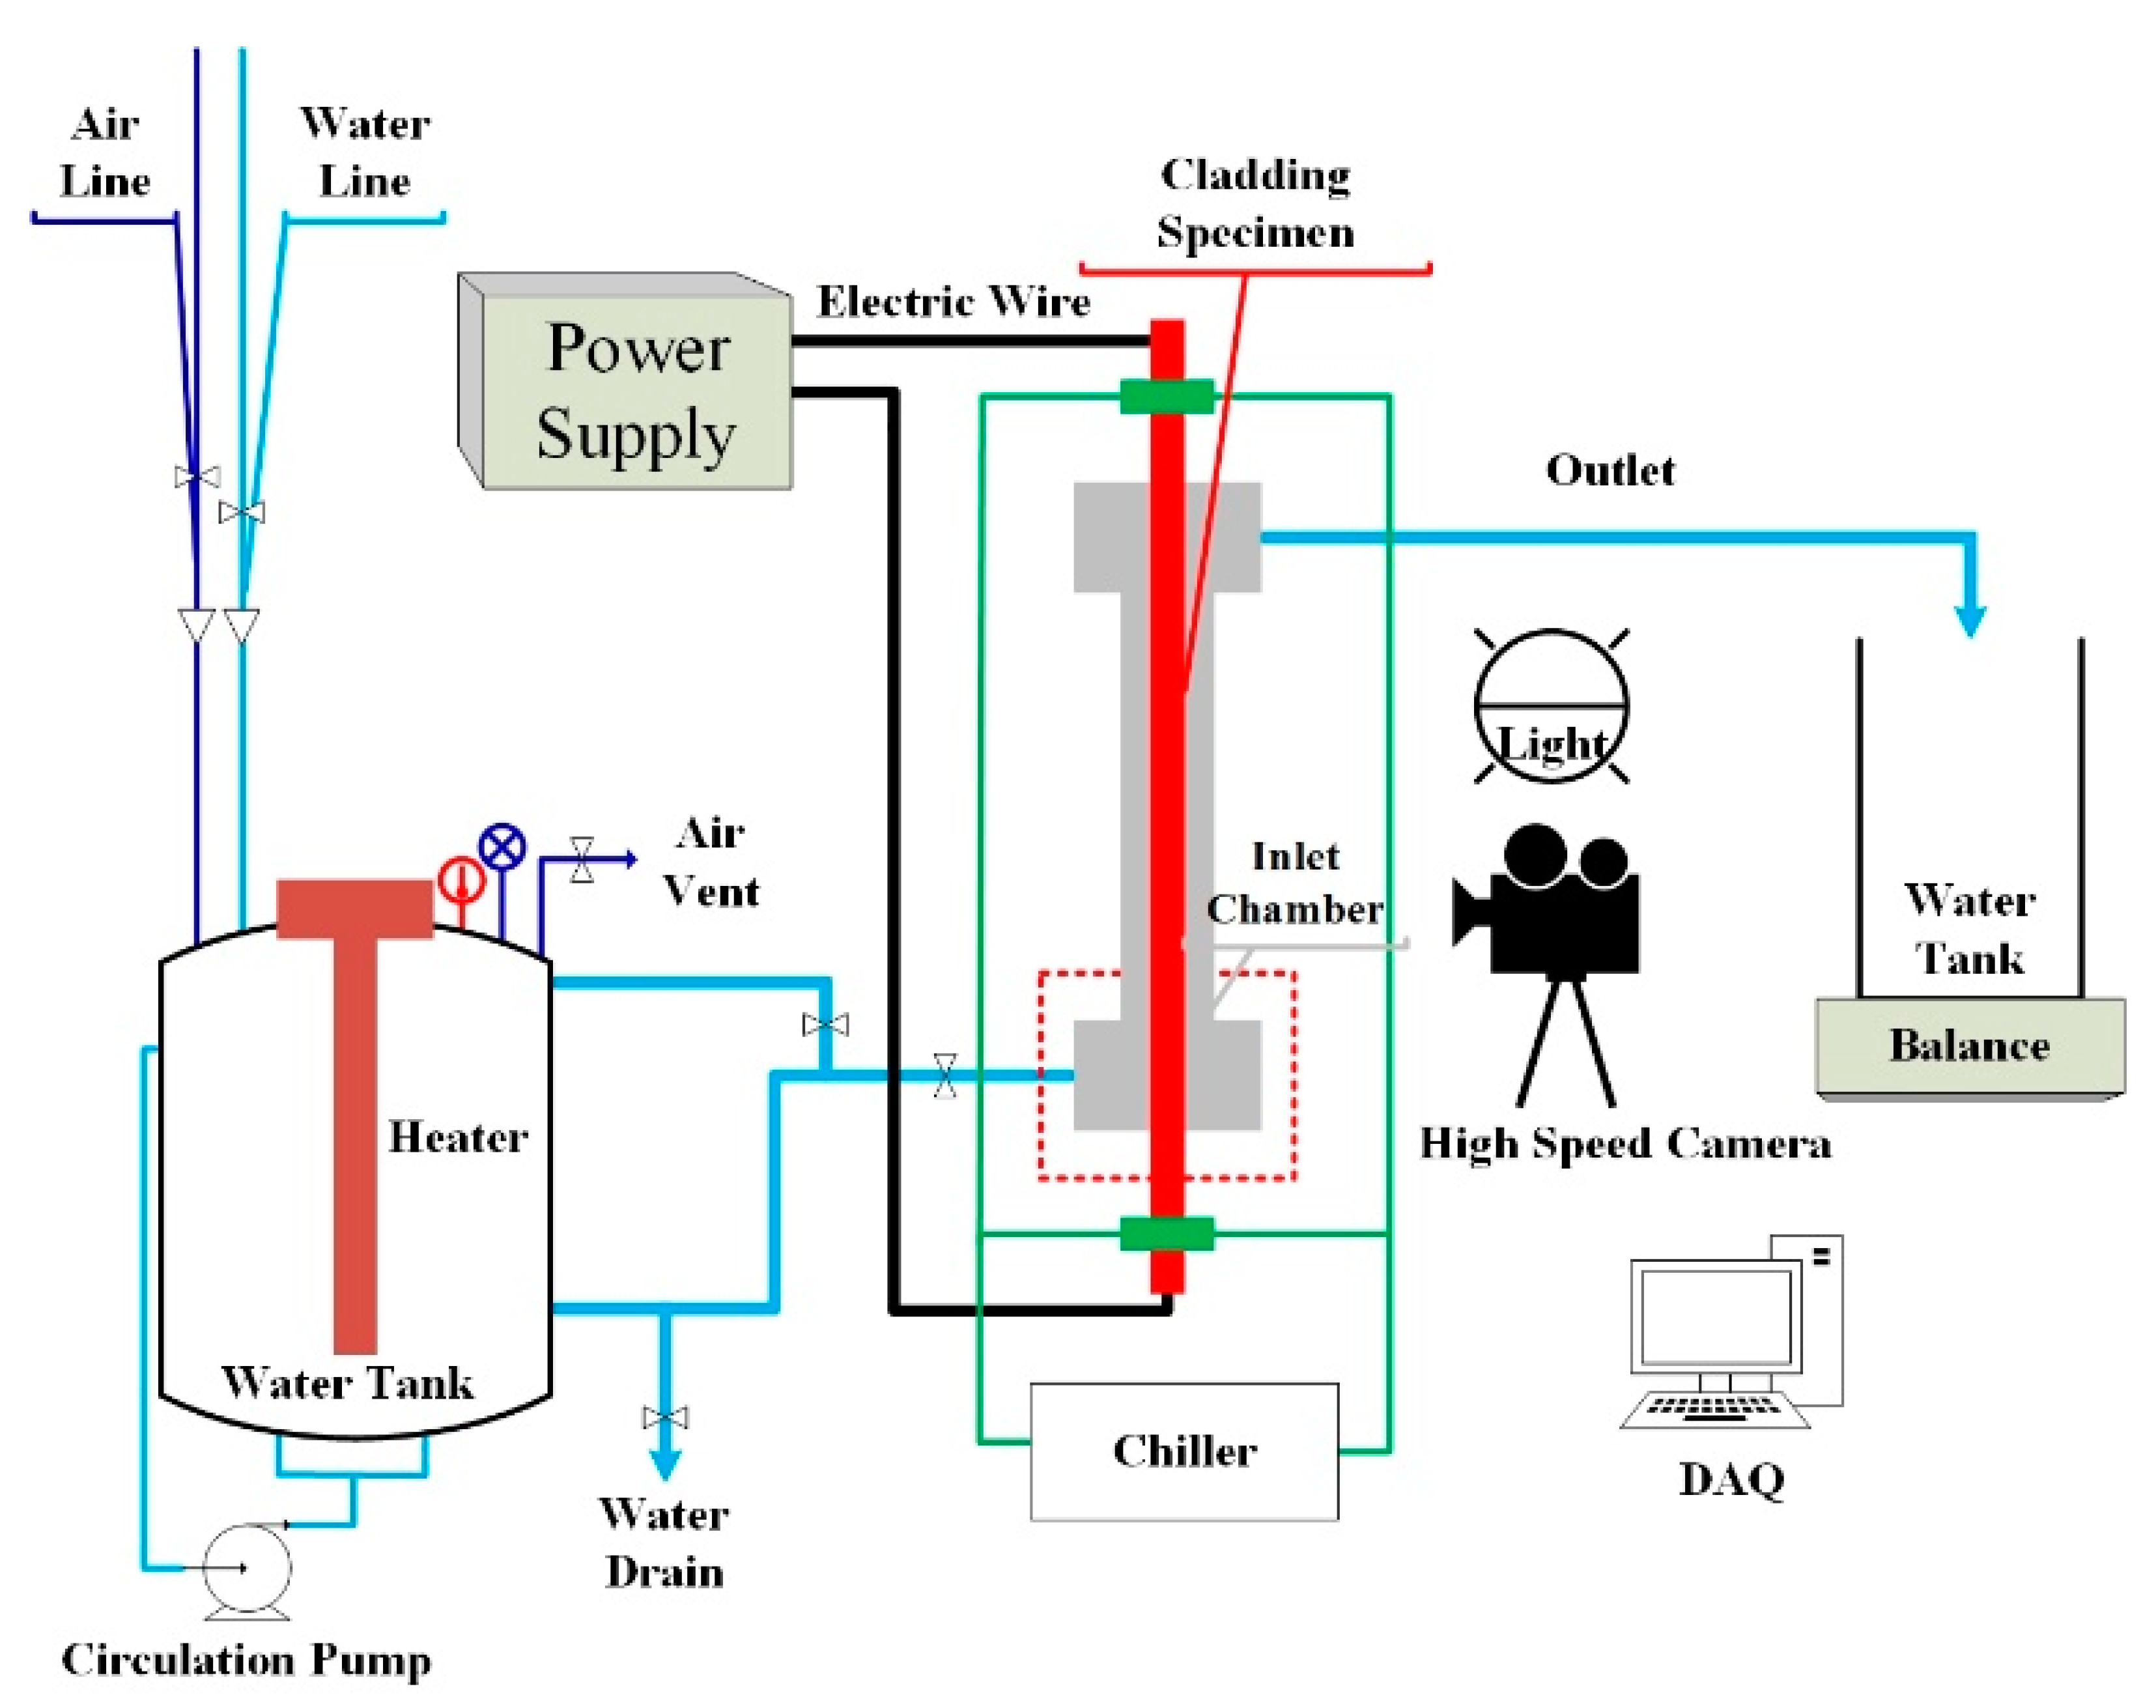
2.1. Experimental Apparatus and Setup
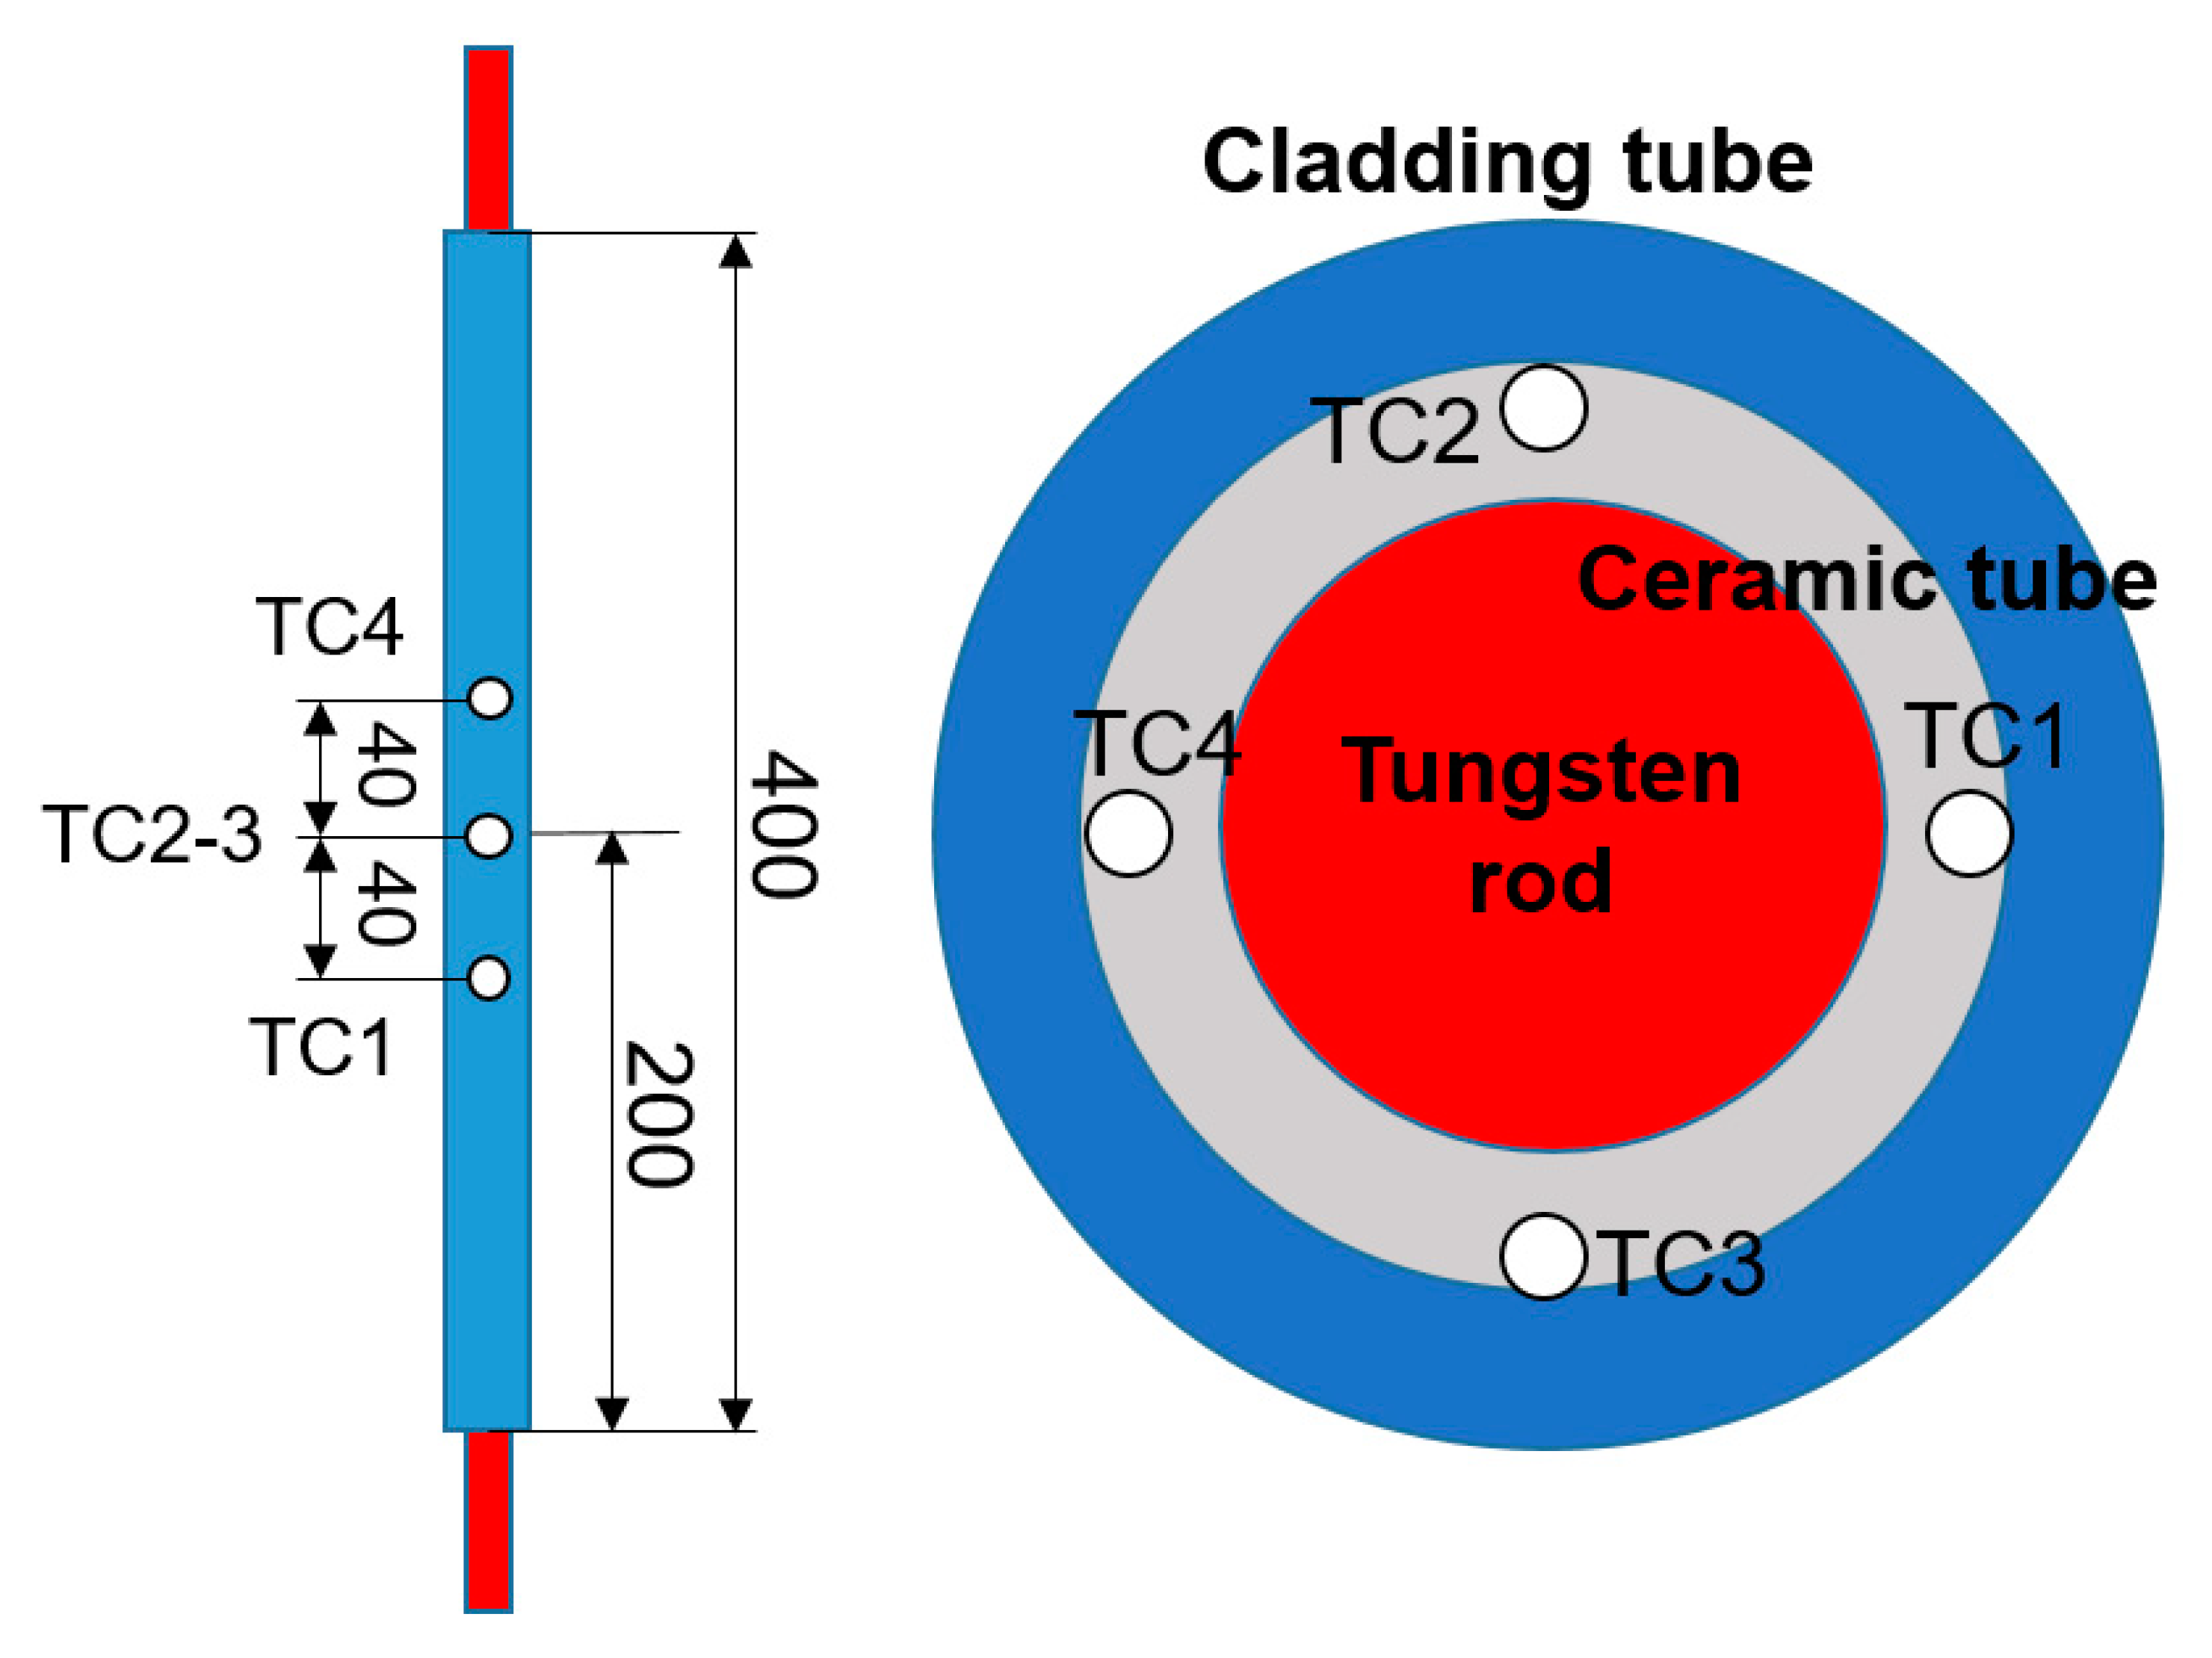
2.2. Test Specimen
2.3. Test Conditions and Procedure
3. Experimental Results and Discussions
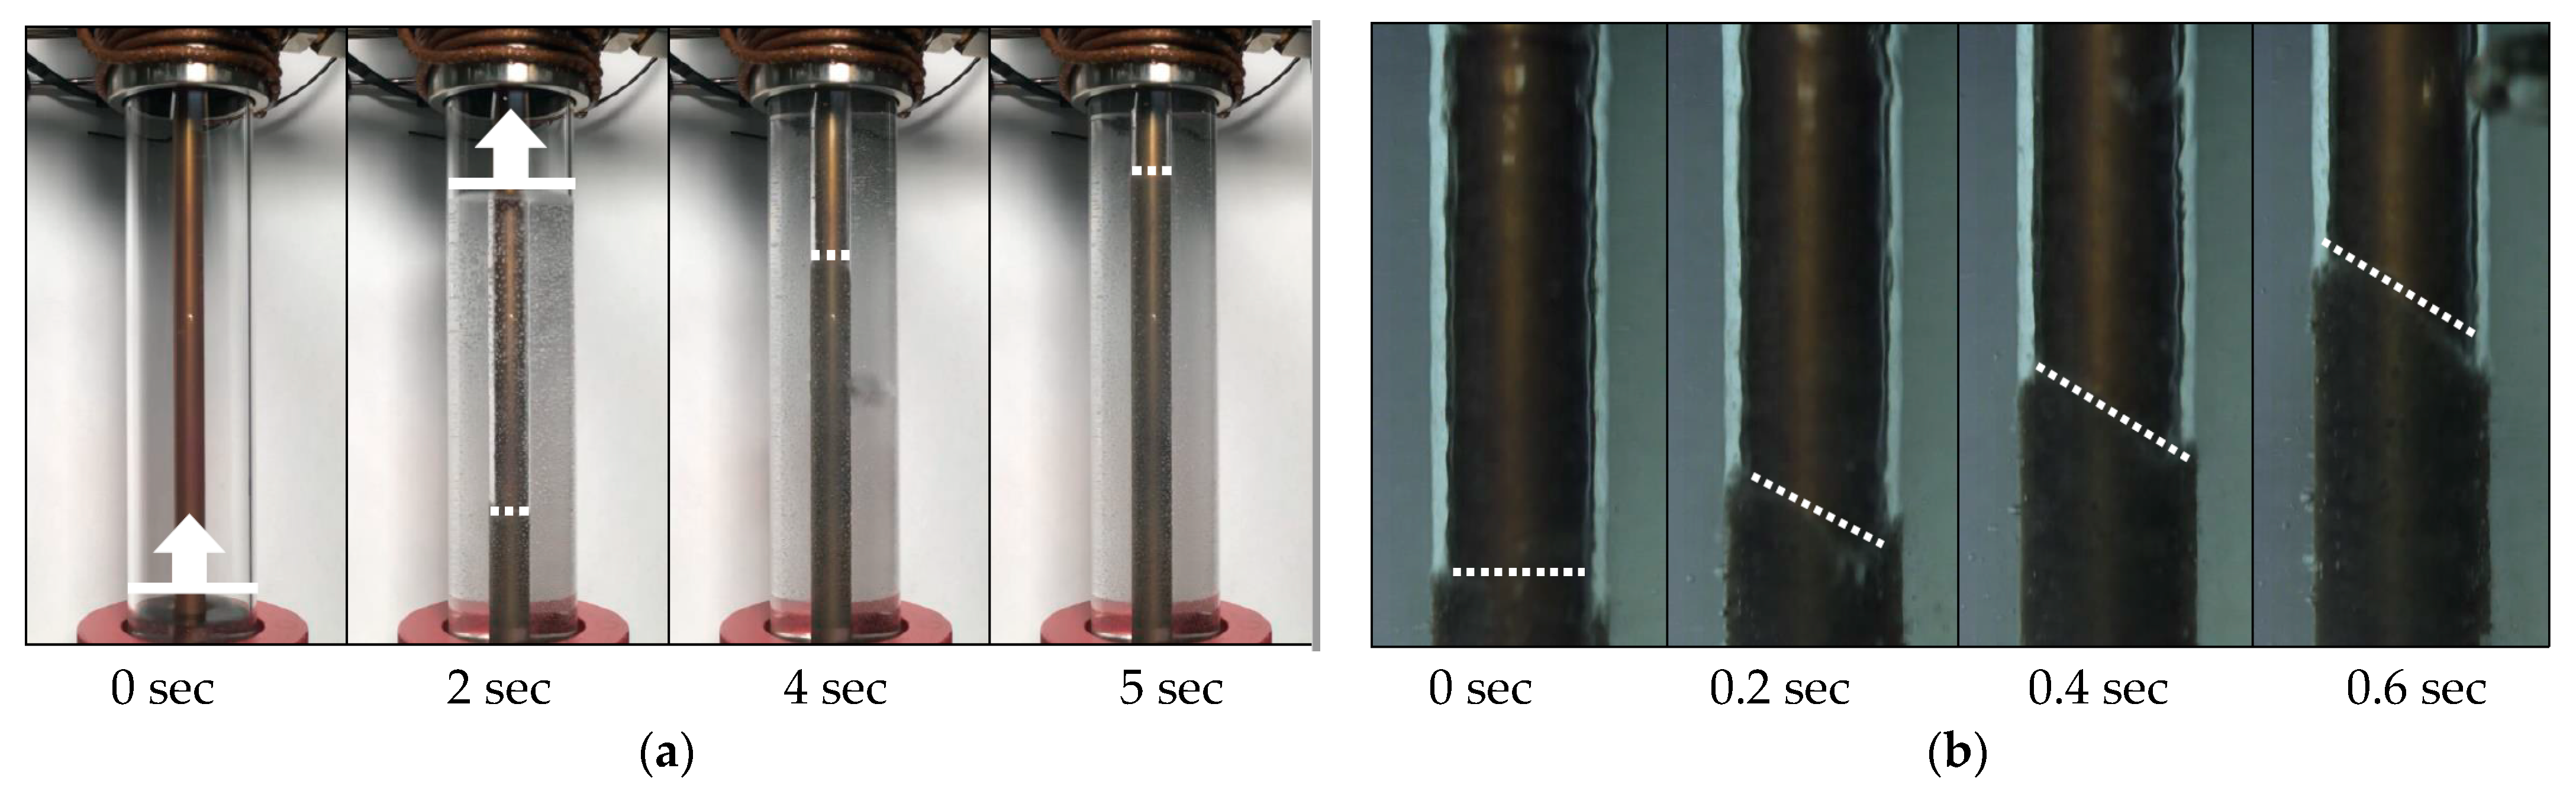
3.1. Flow Visualization of Reflood Quenching
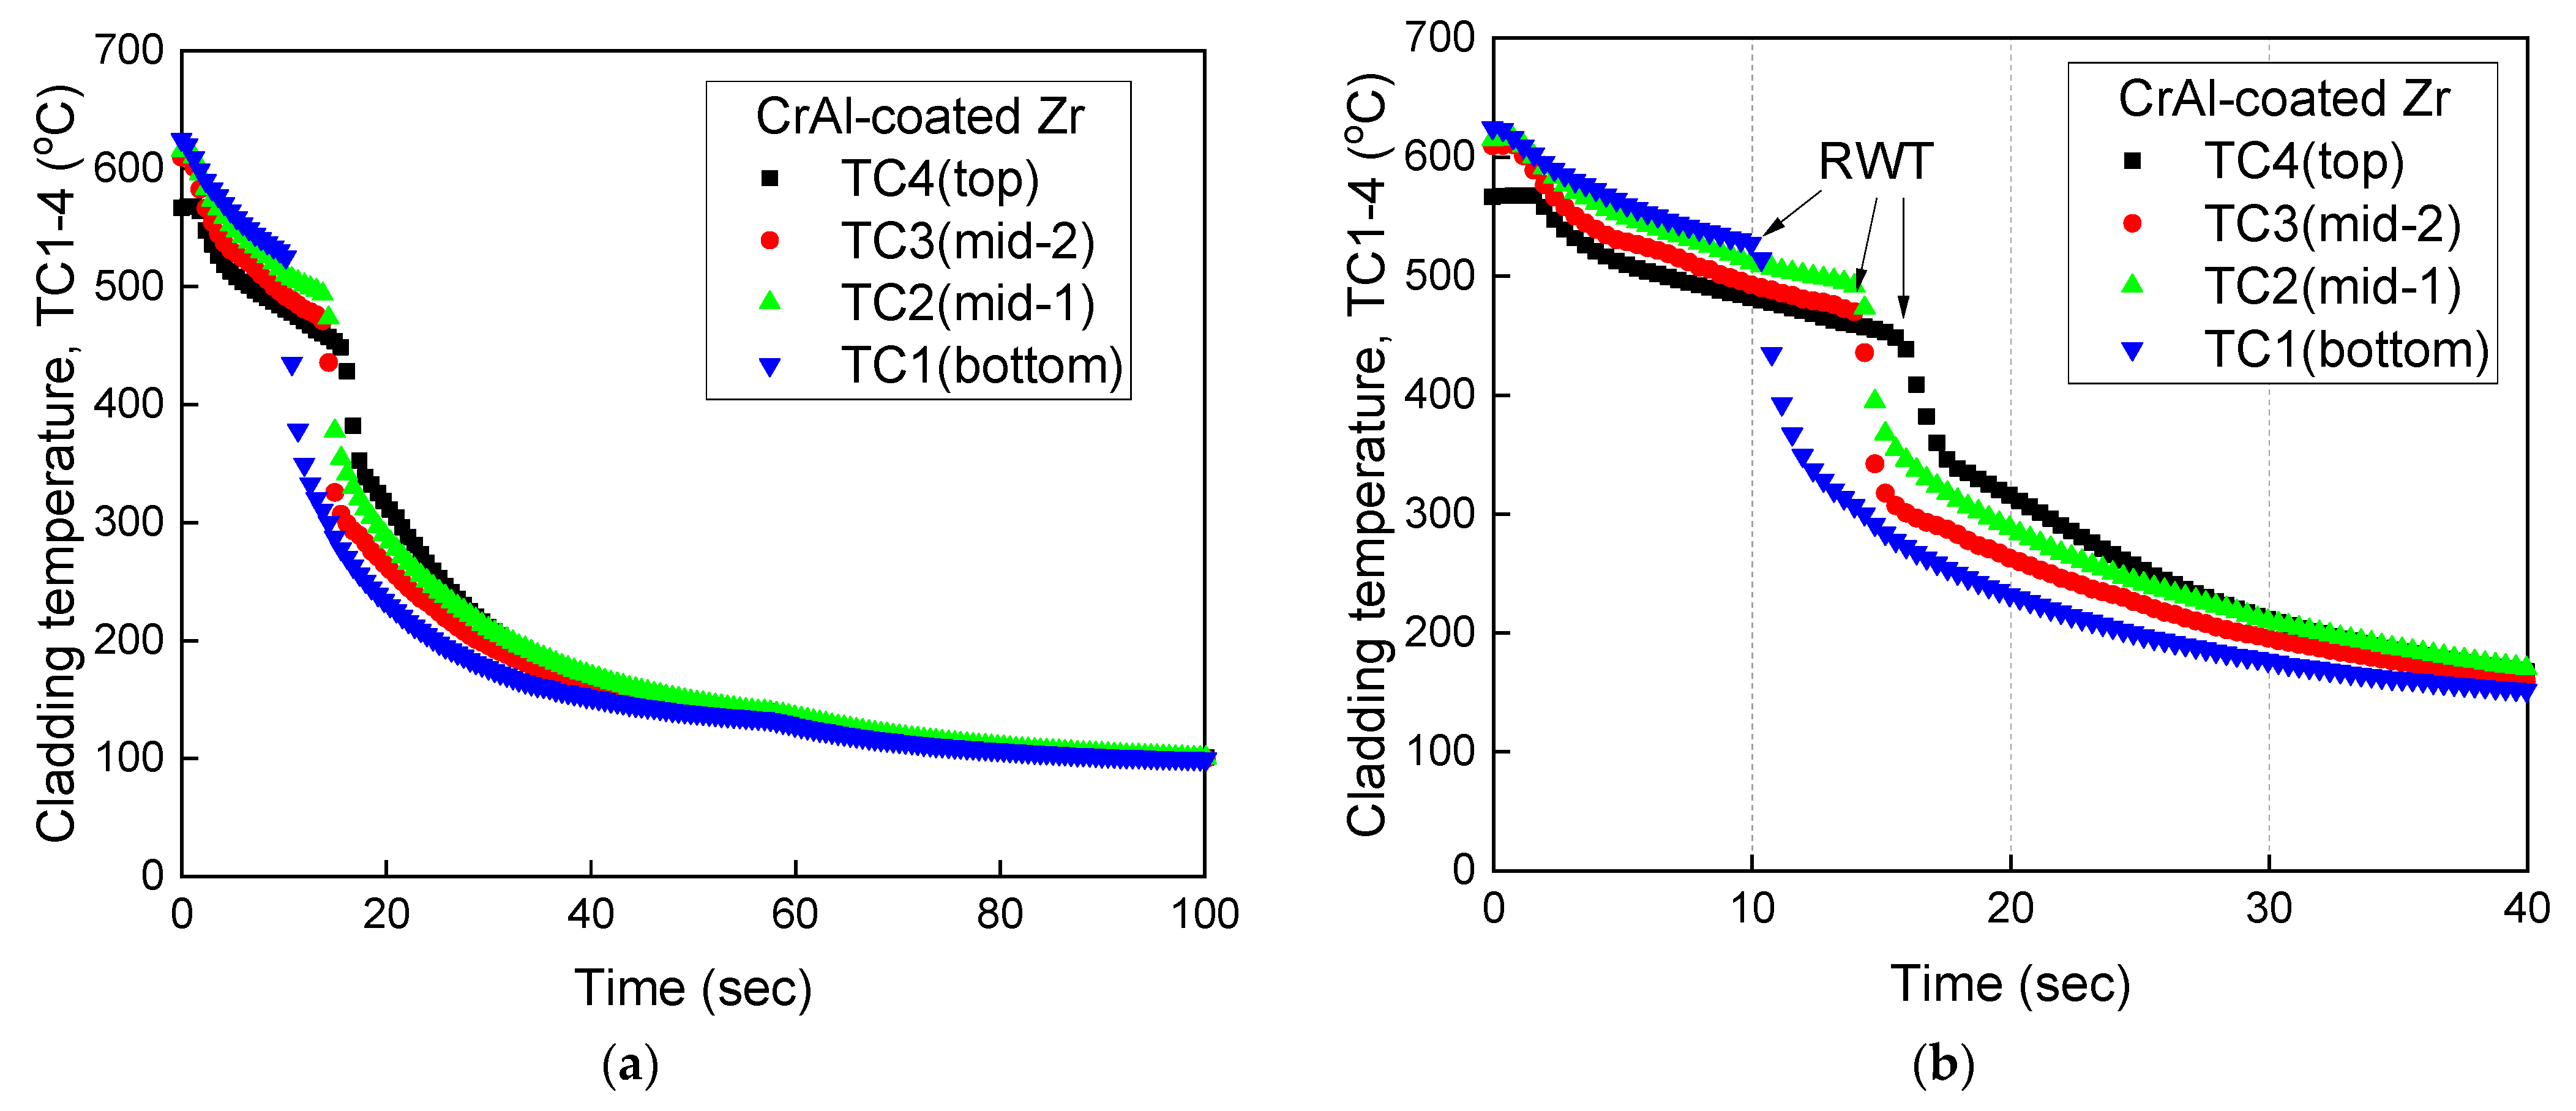
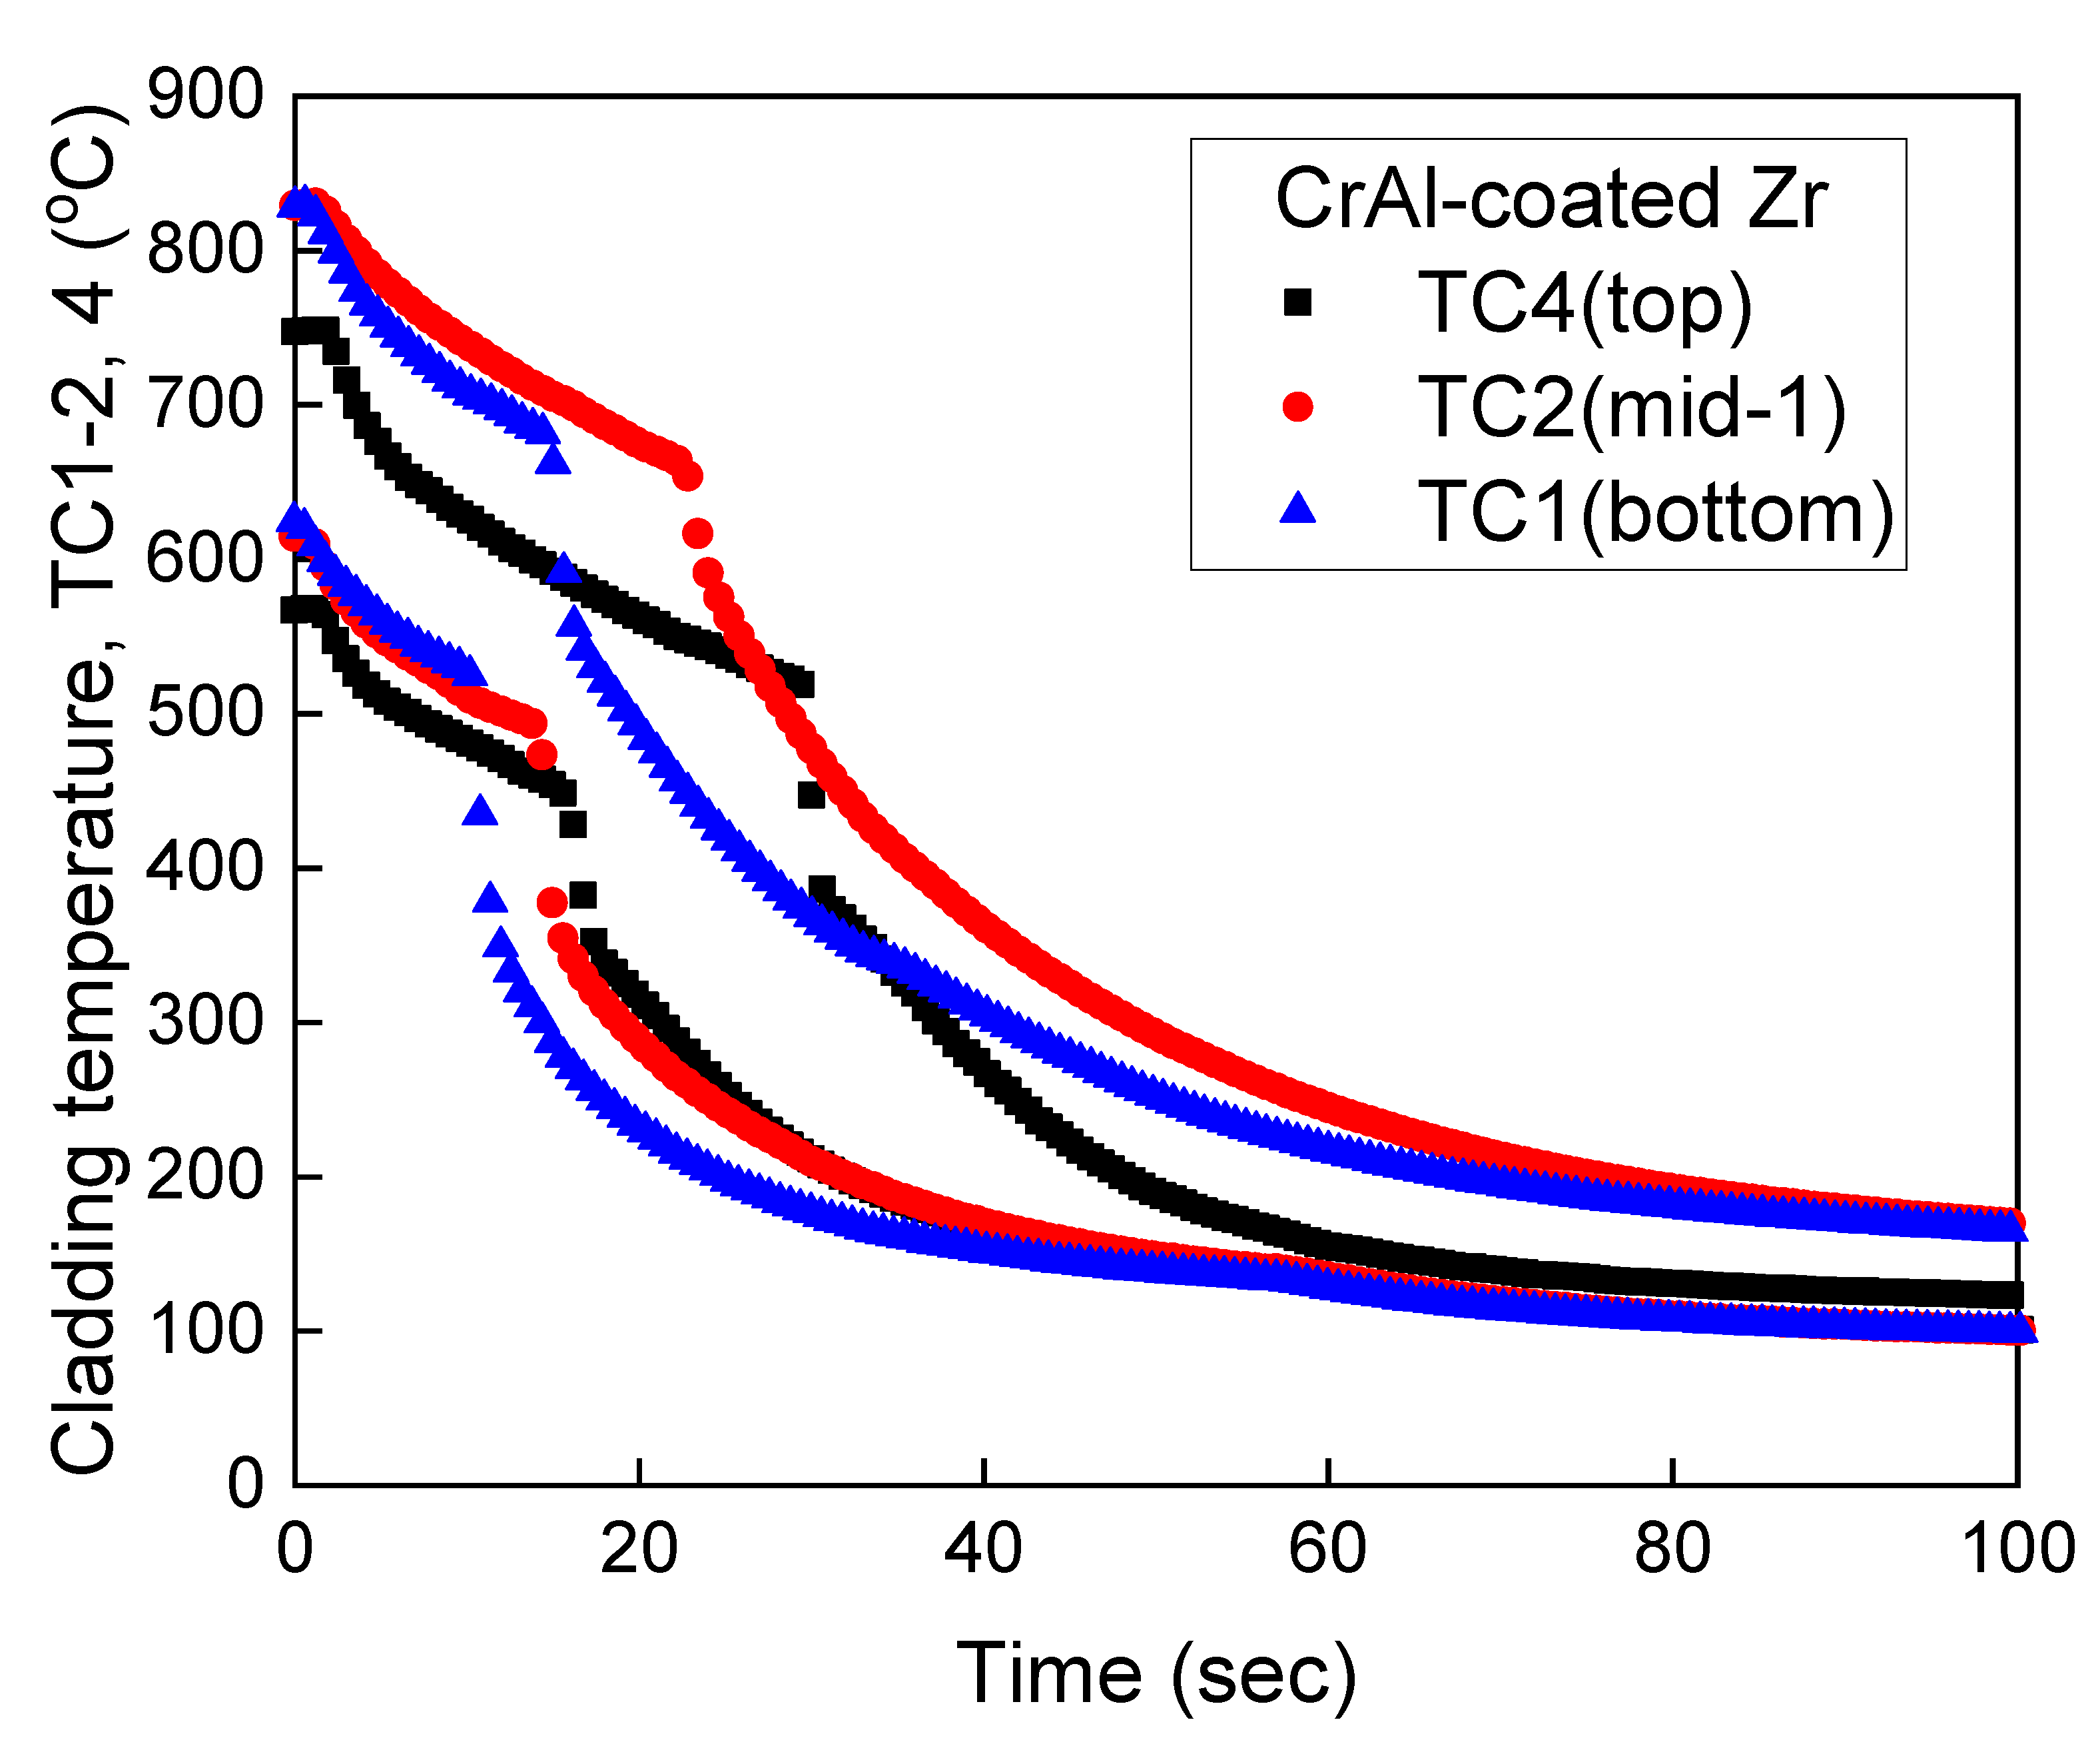
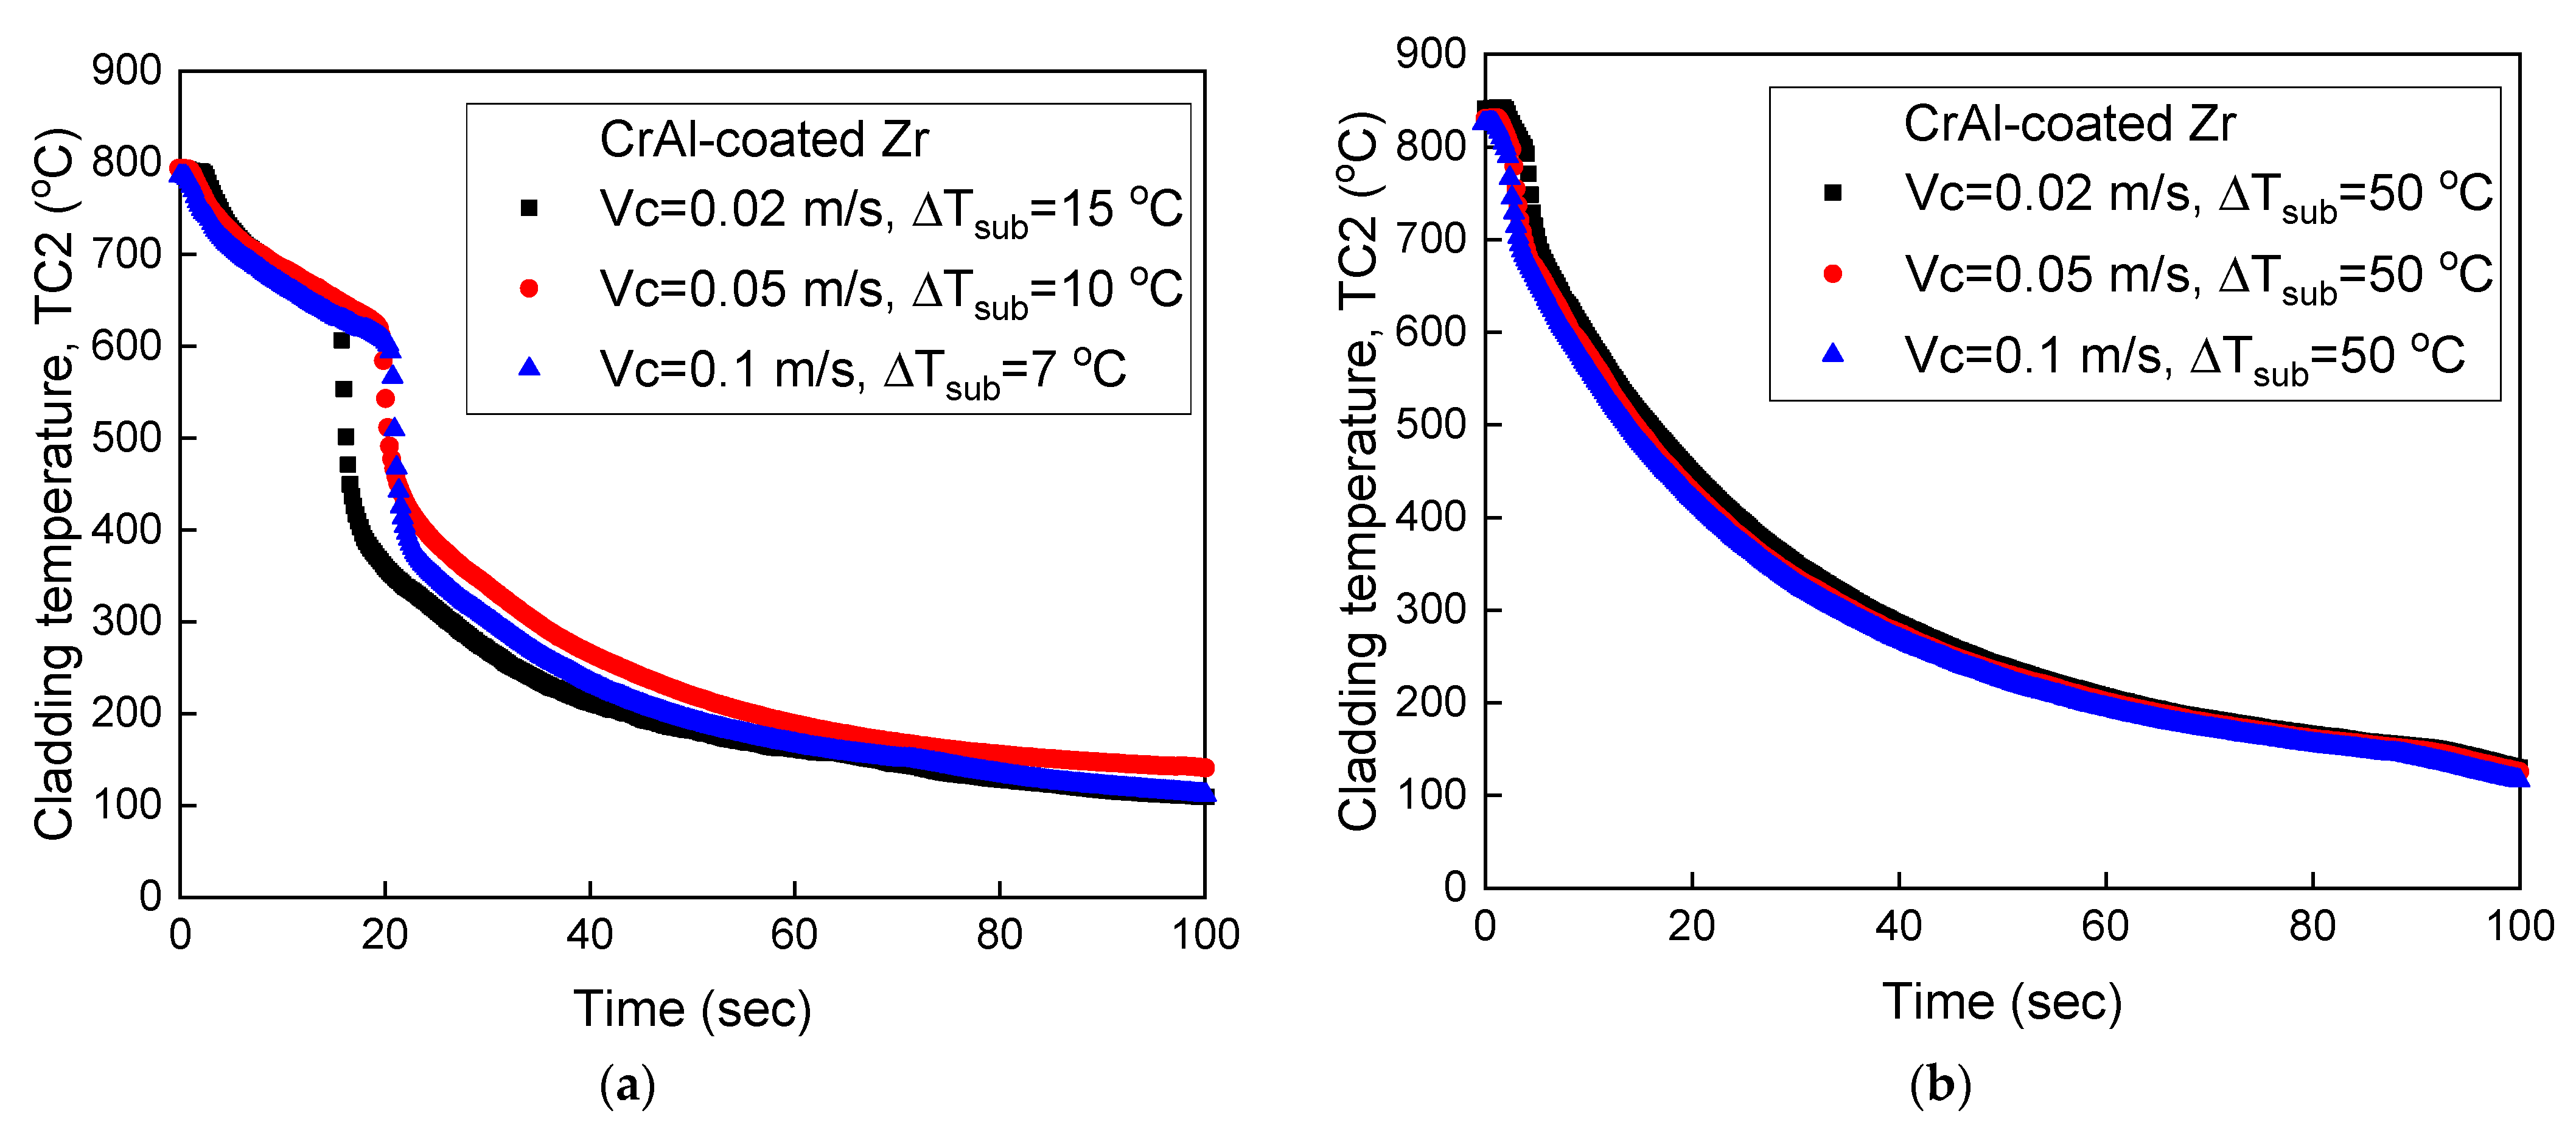
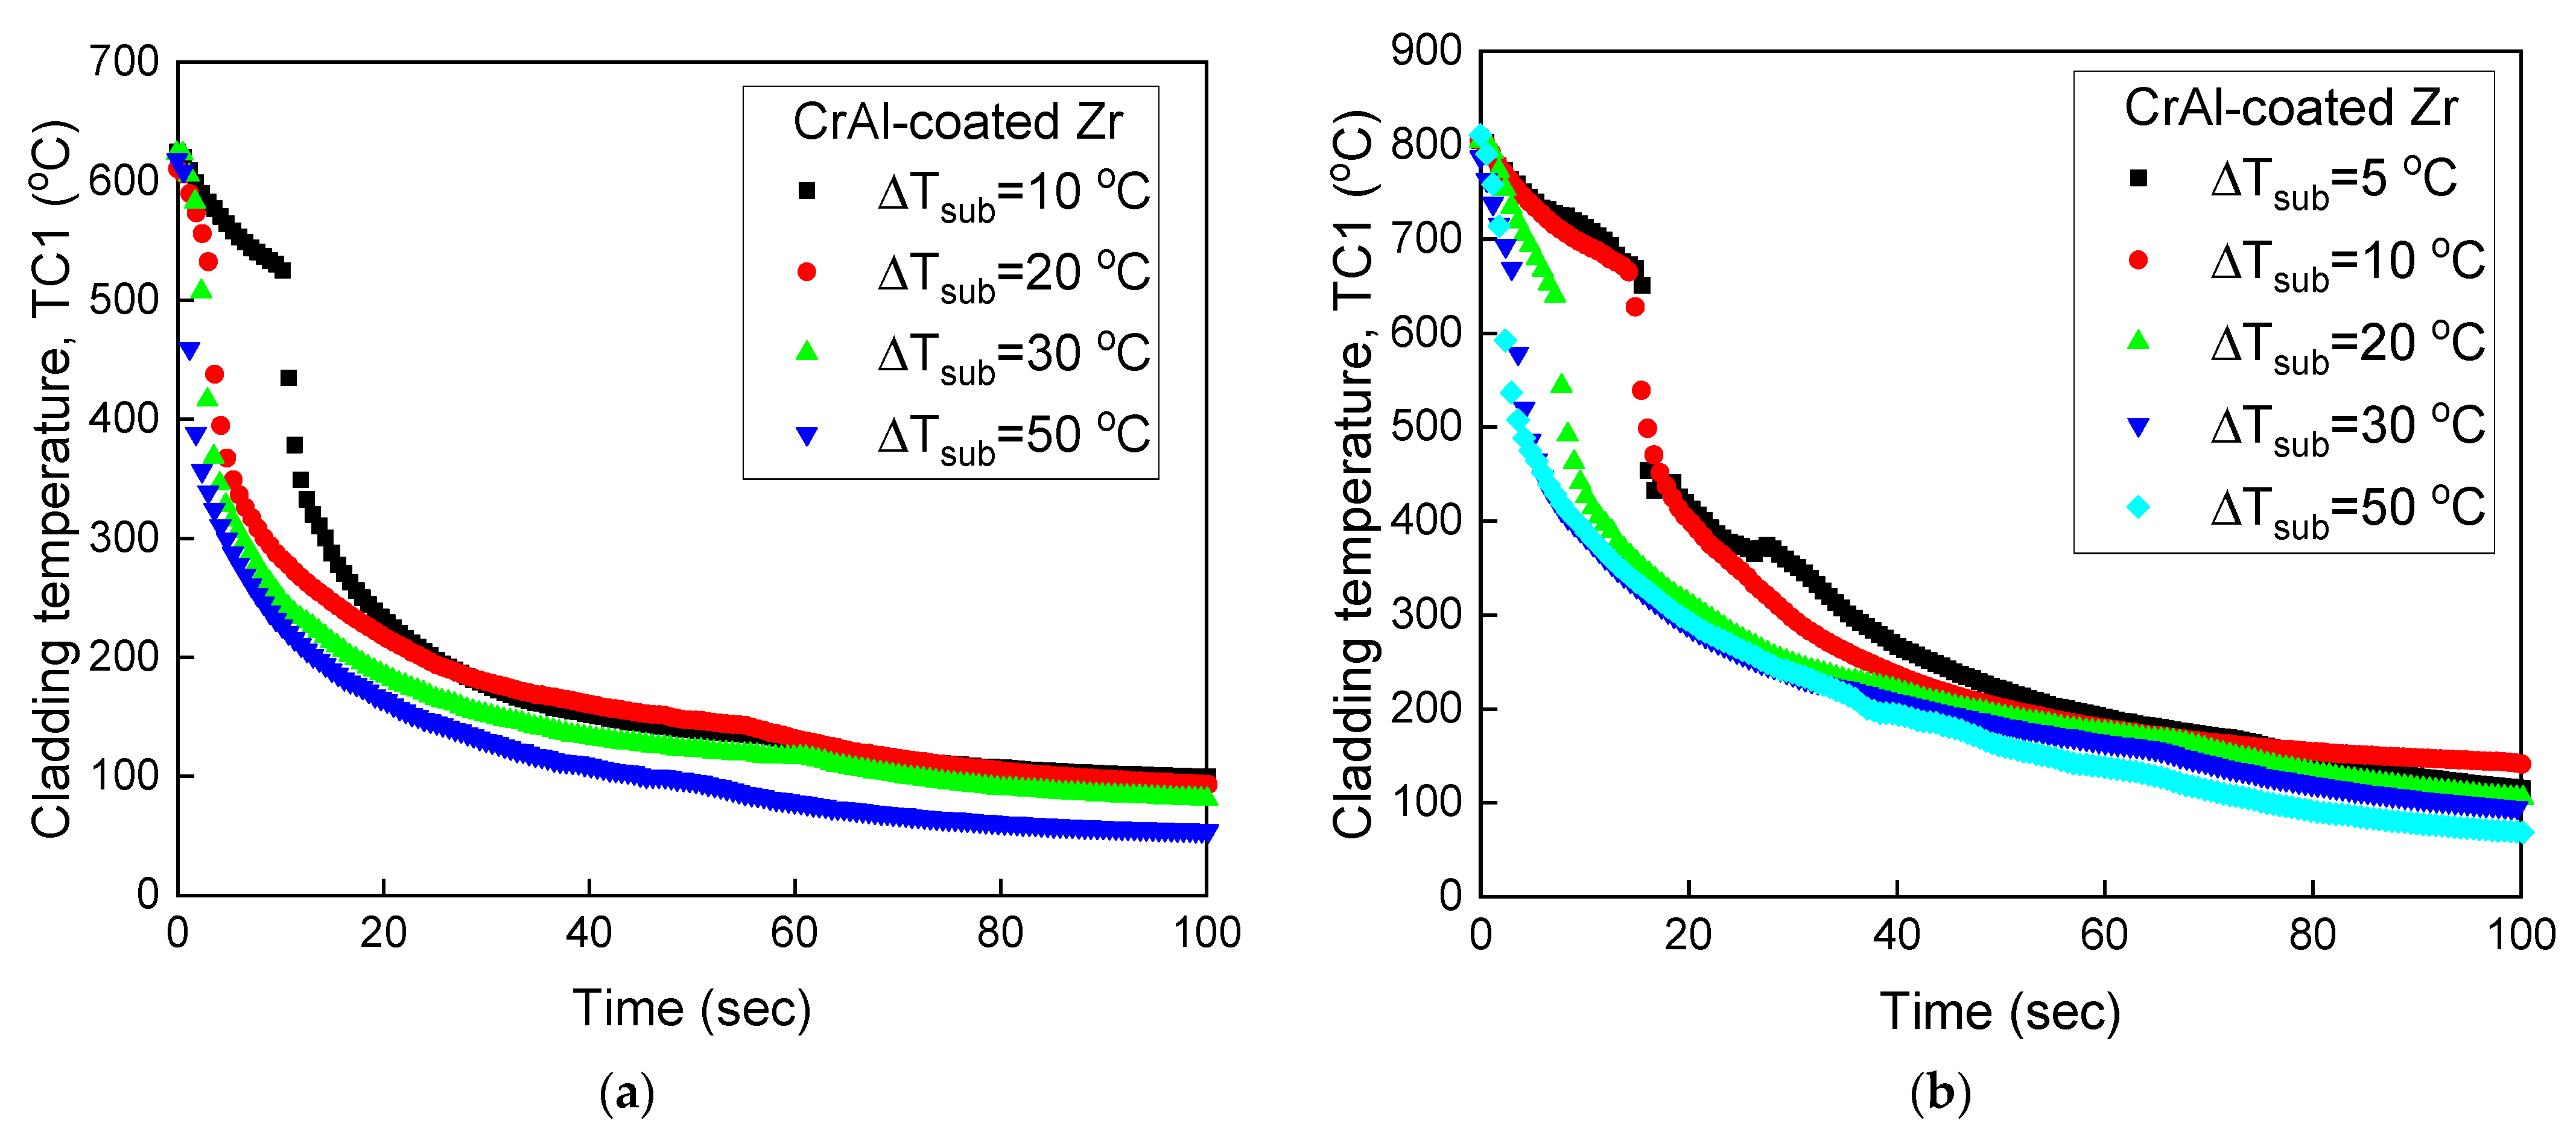
3.2. Parametric Analysis of Quenching Curve
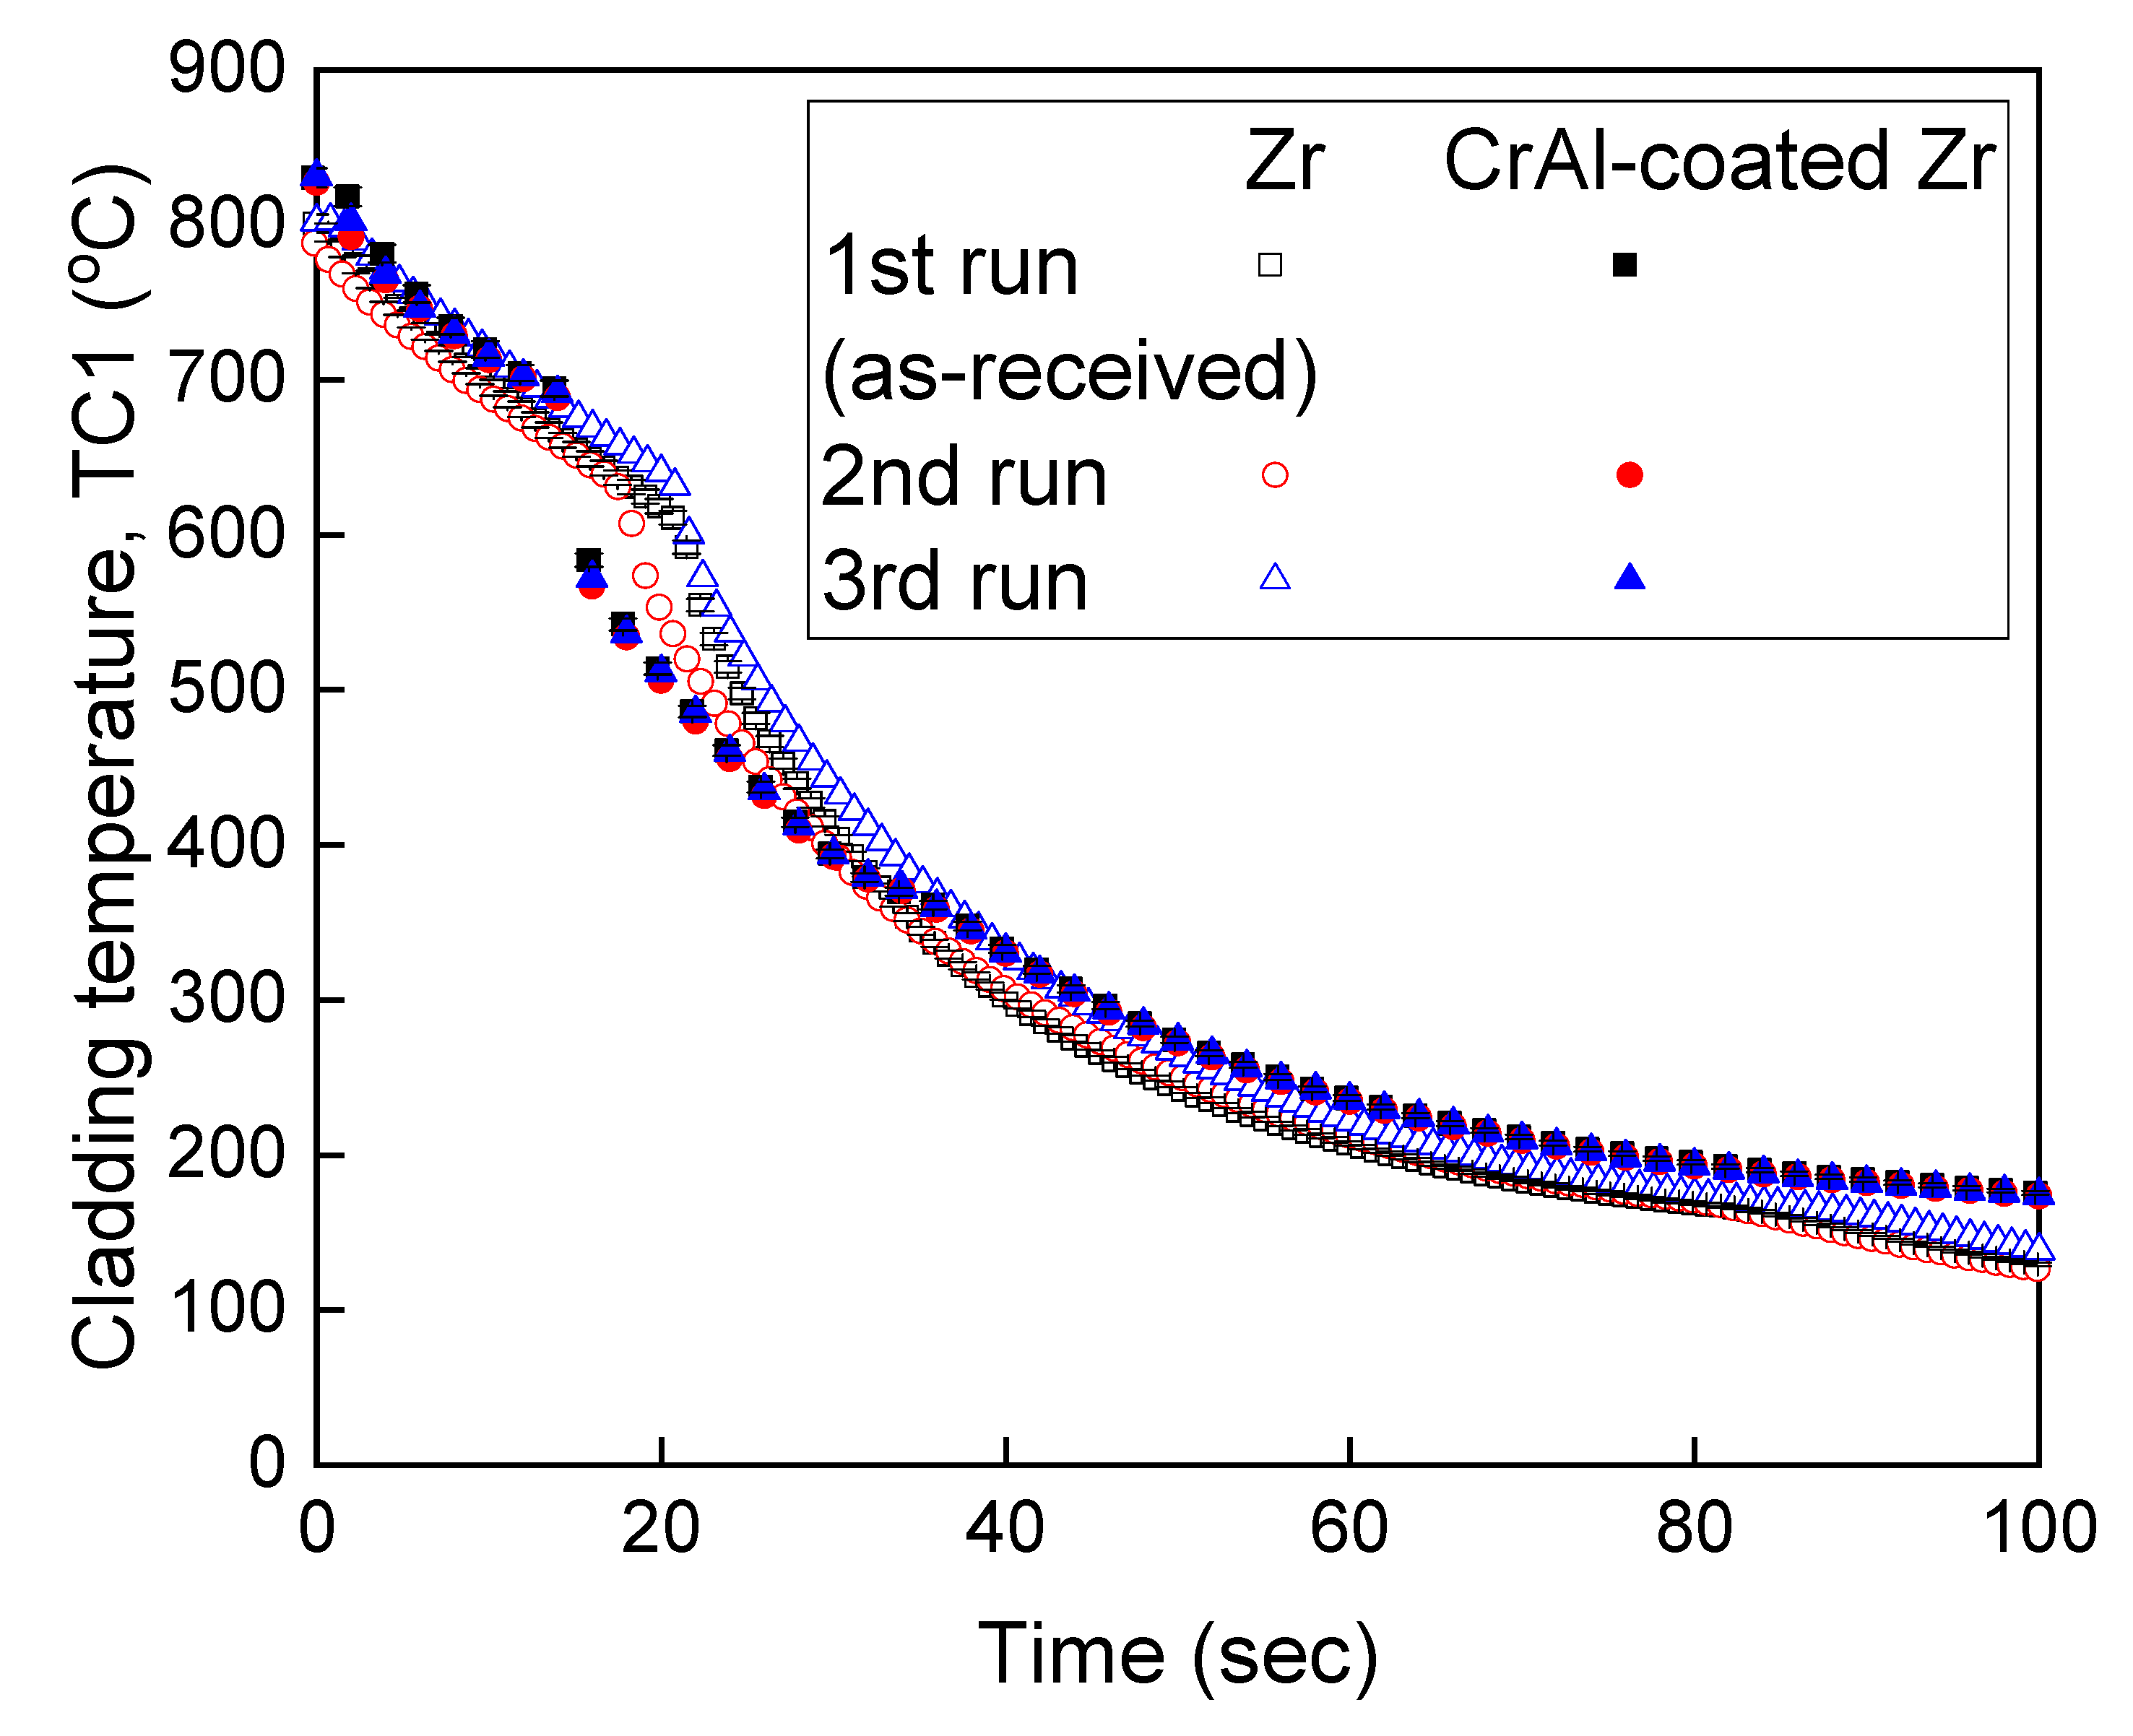
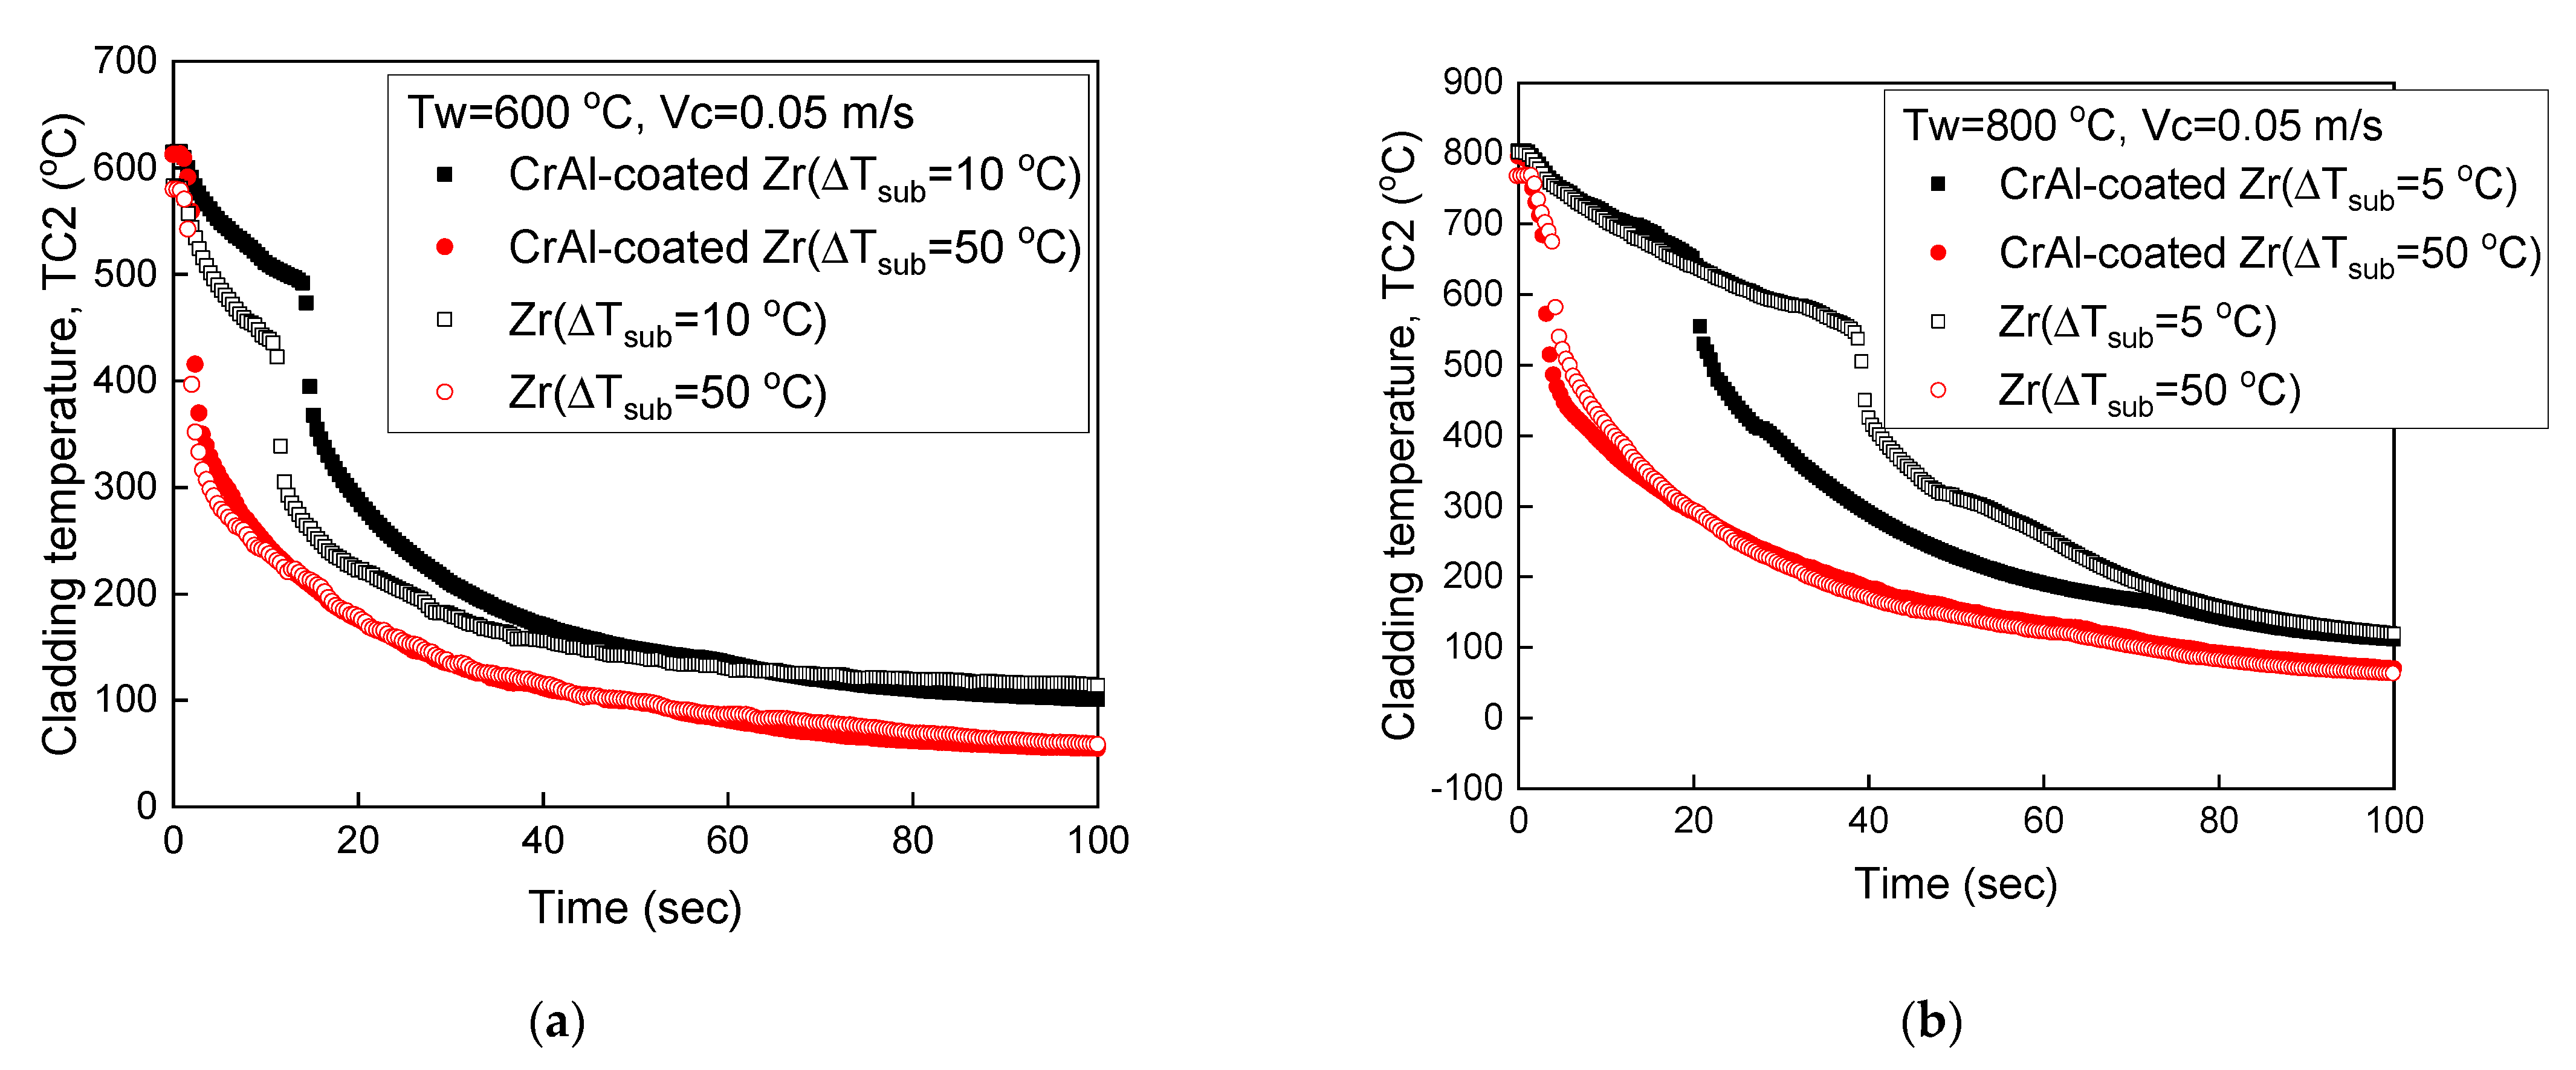
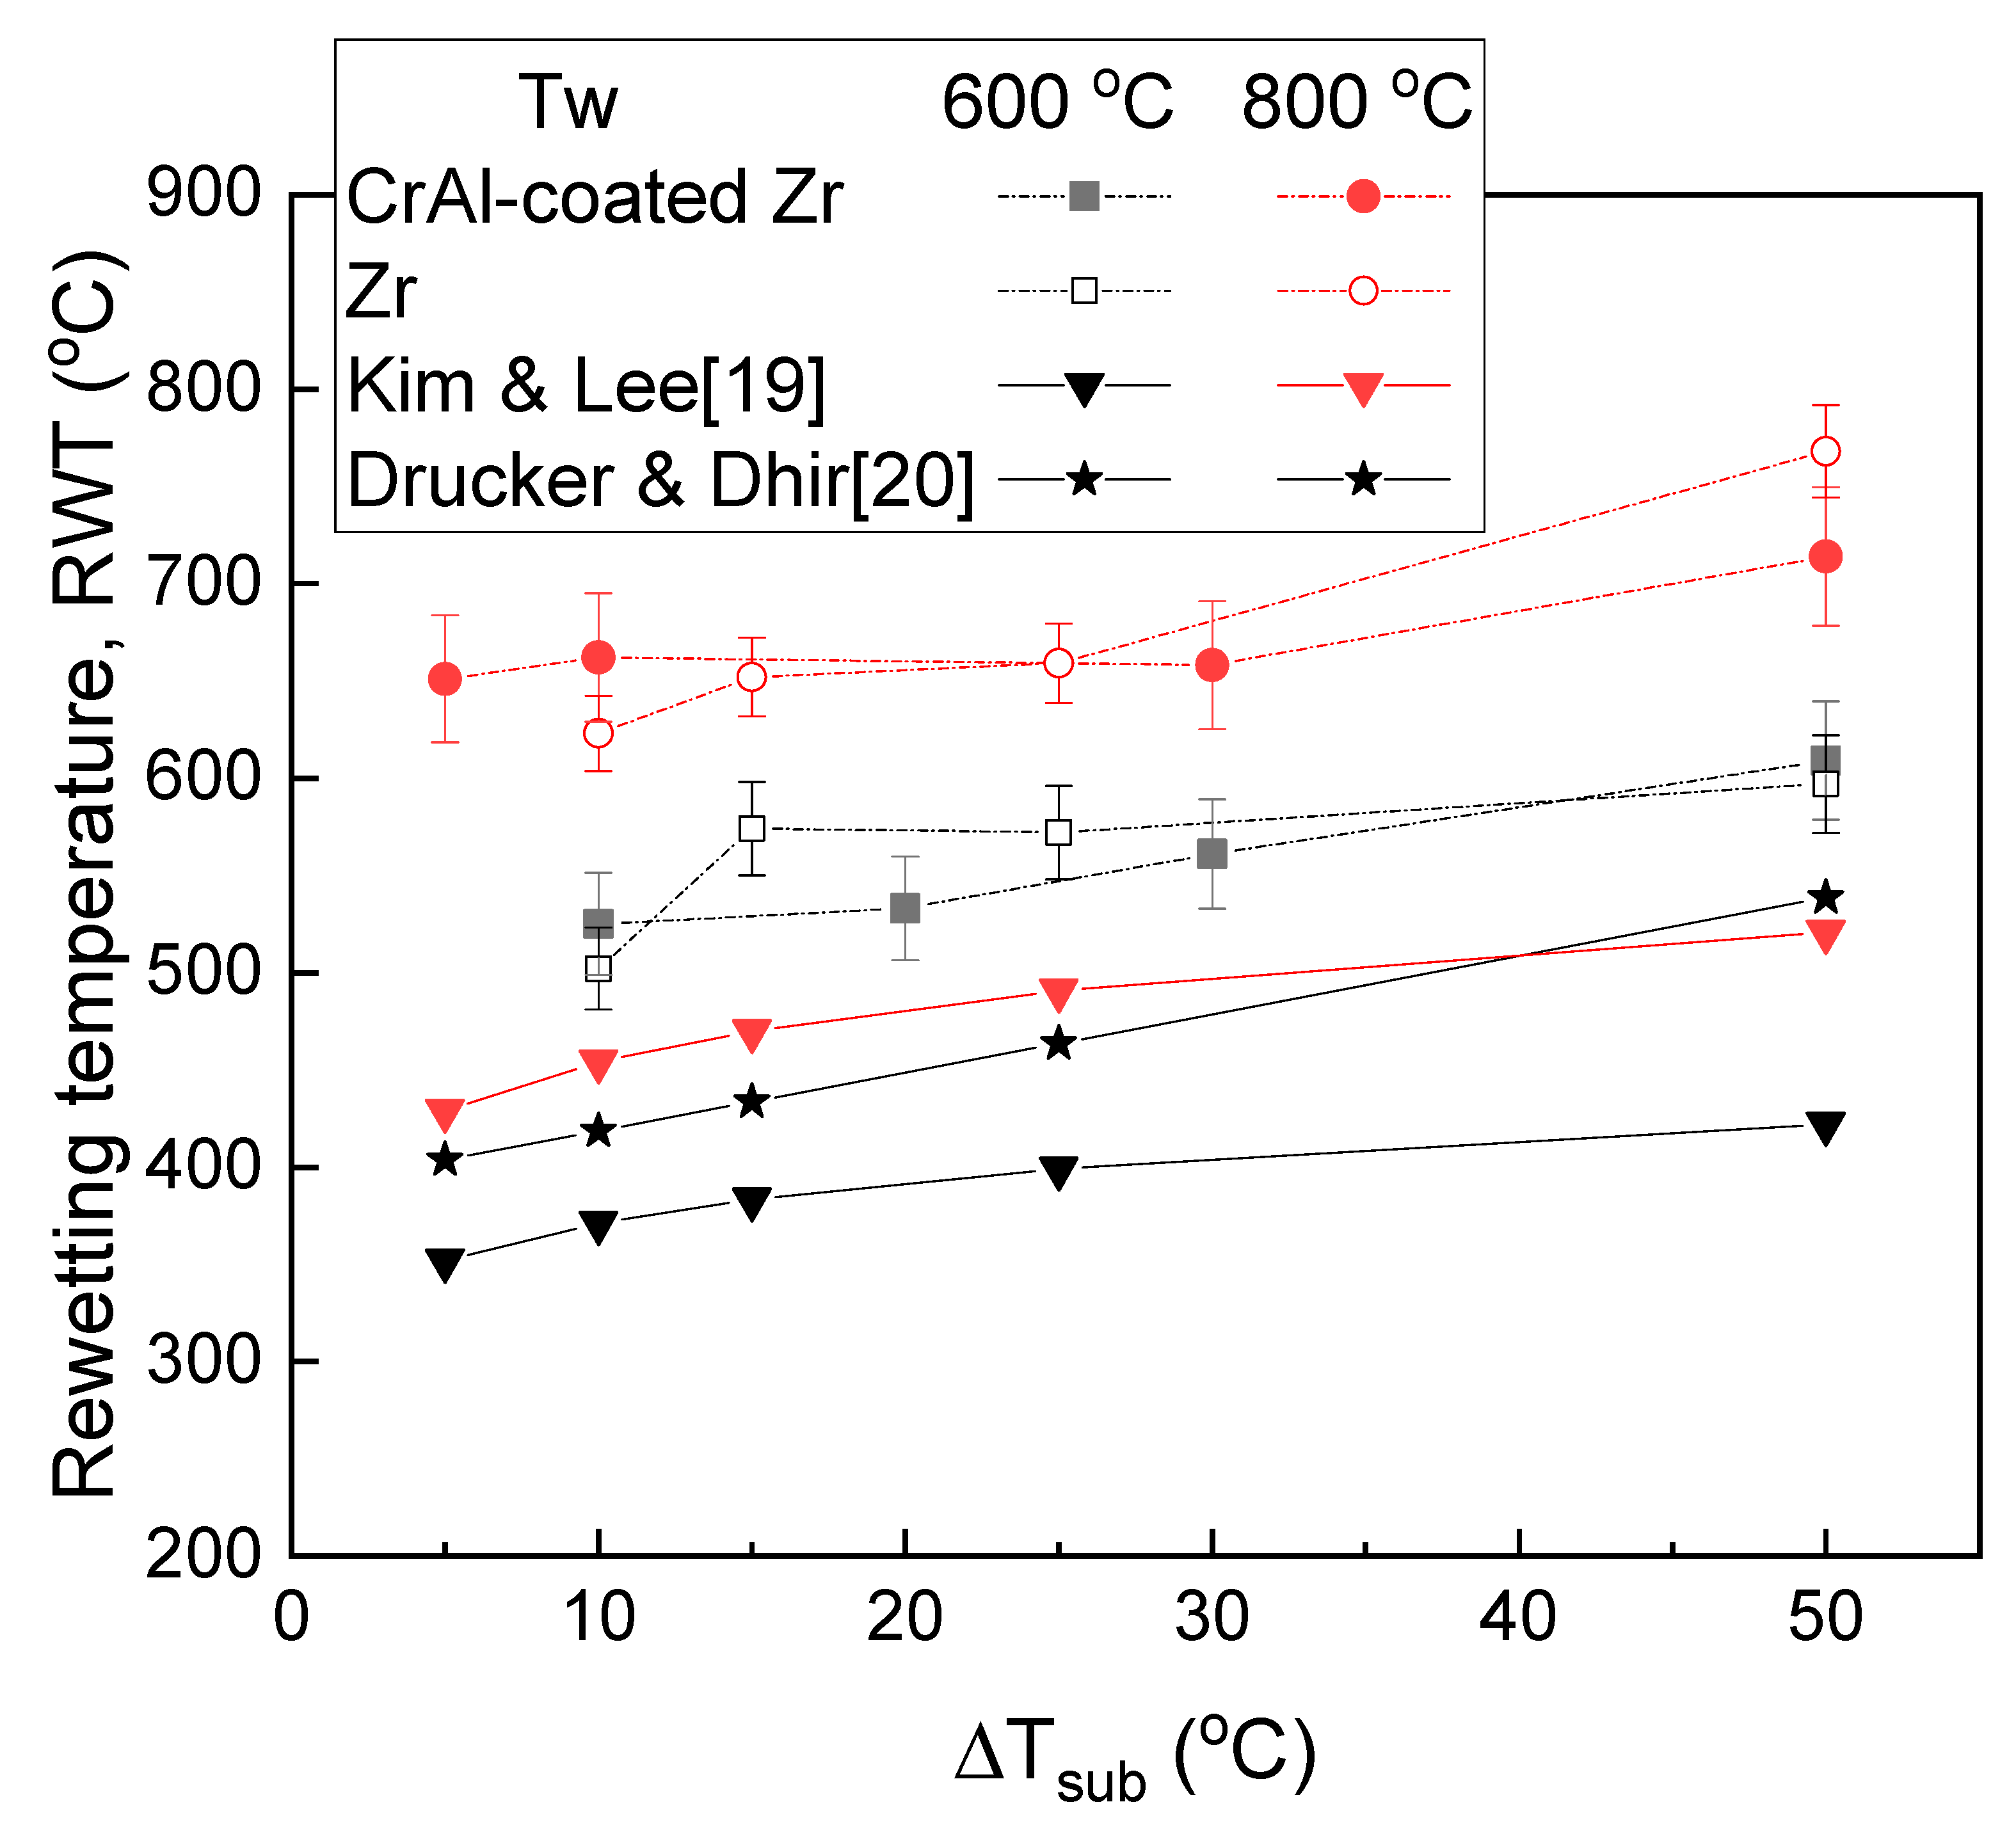
3.3. Quenching Performance of CrAl-Coated Zr Cladding
4. Conclusions
- (1)
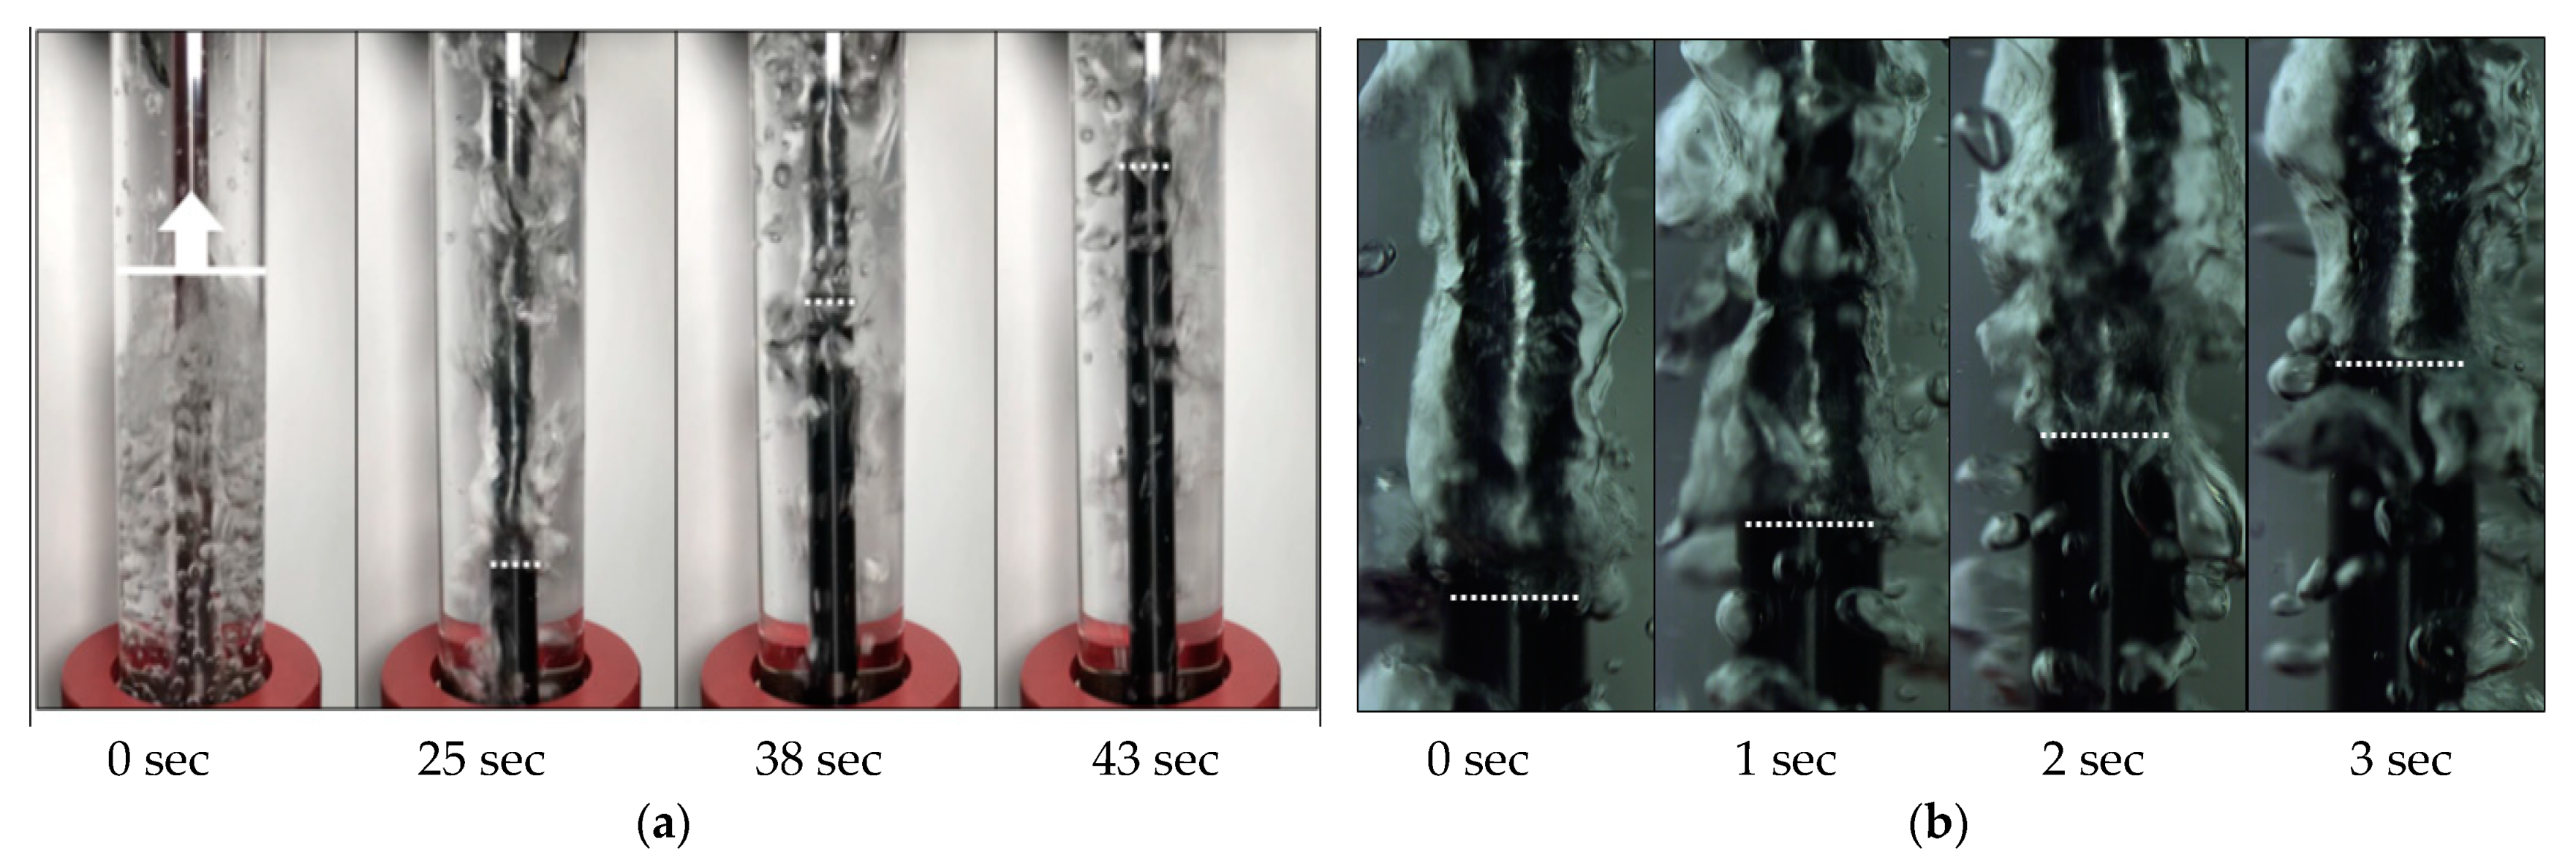
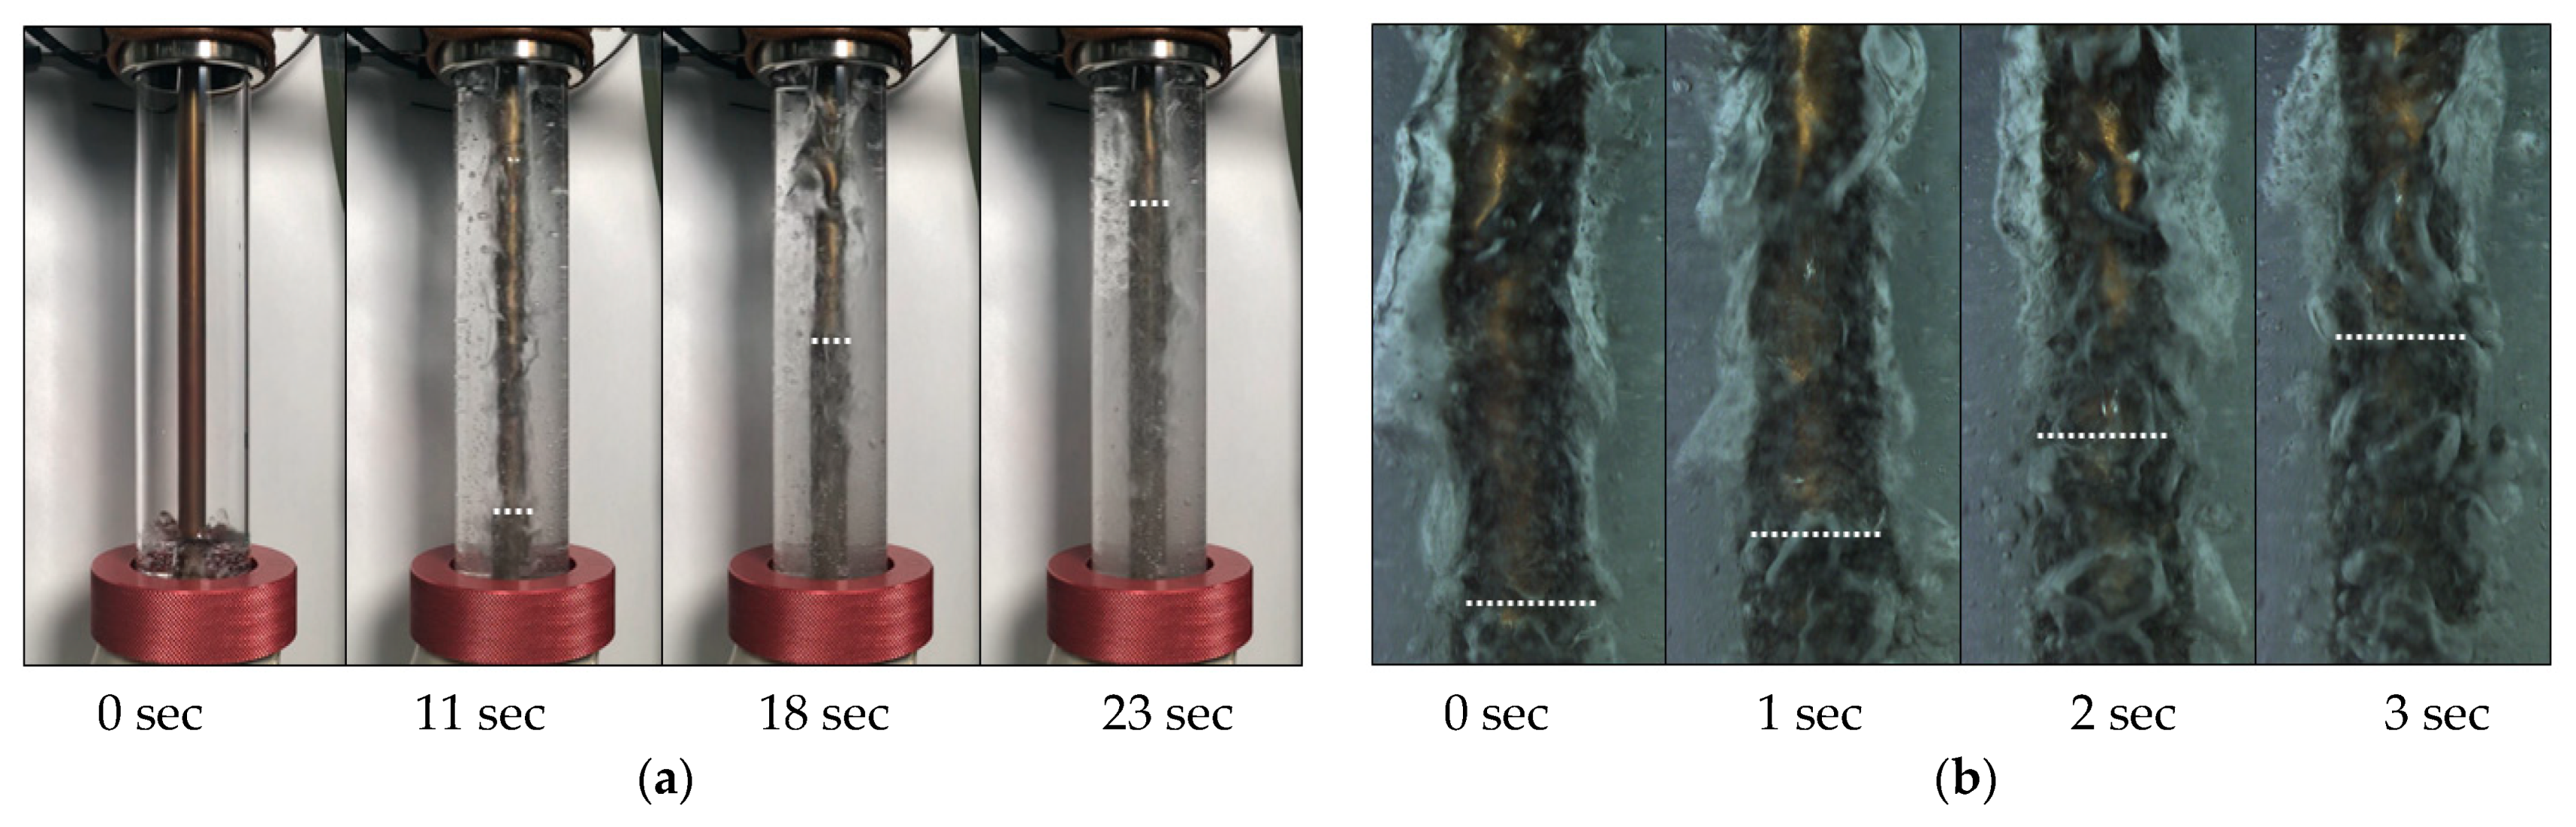
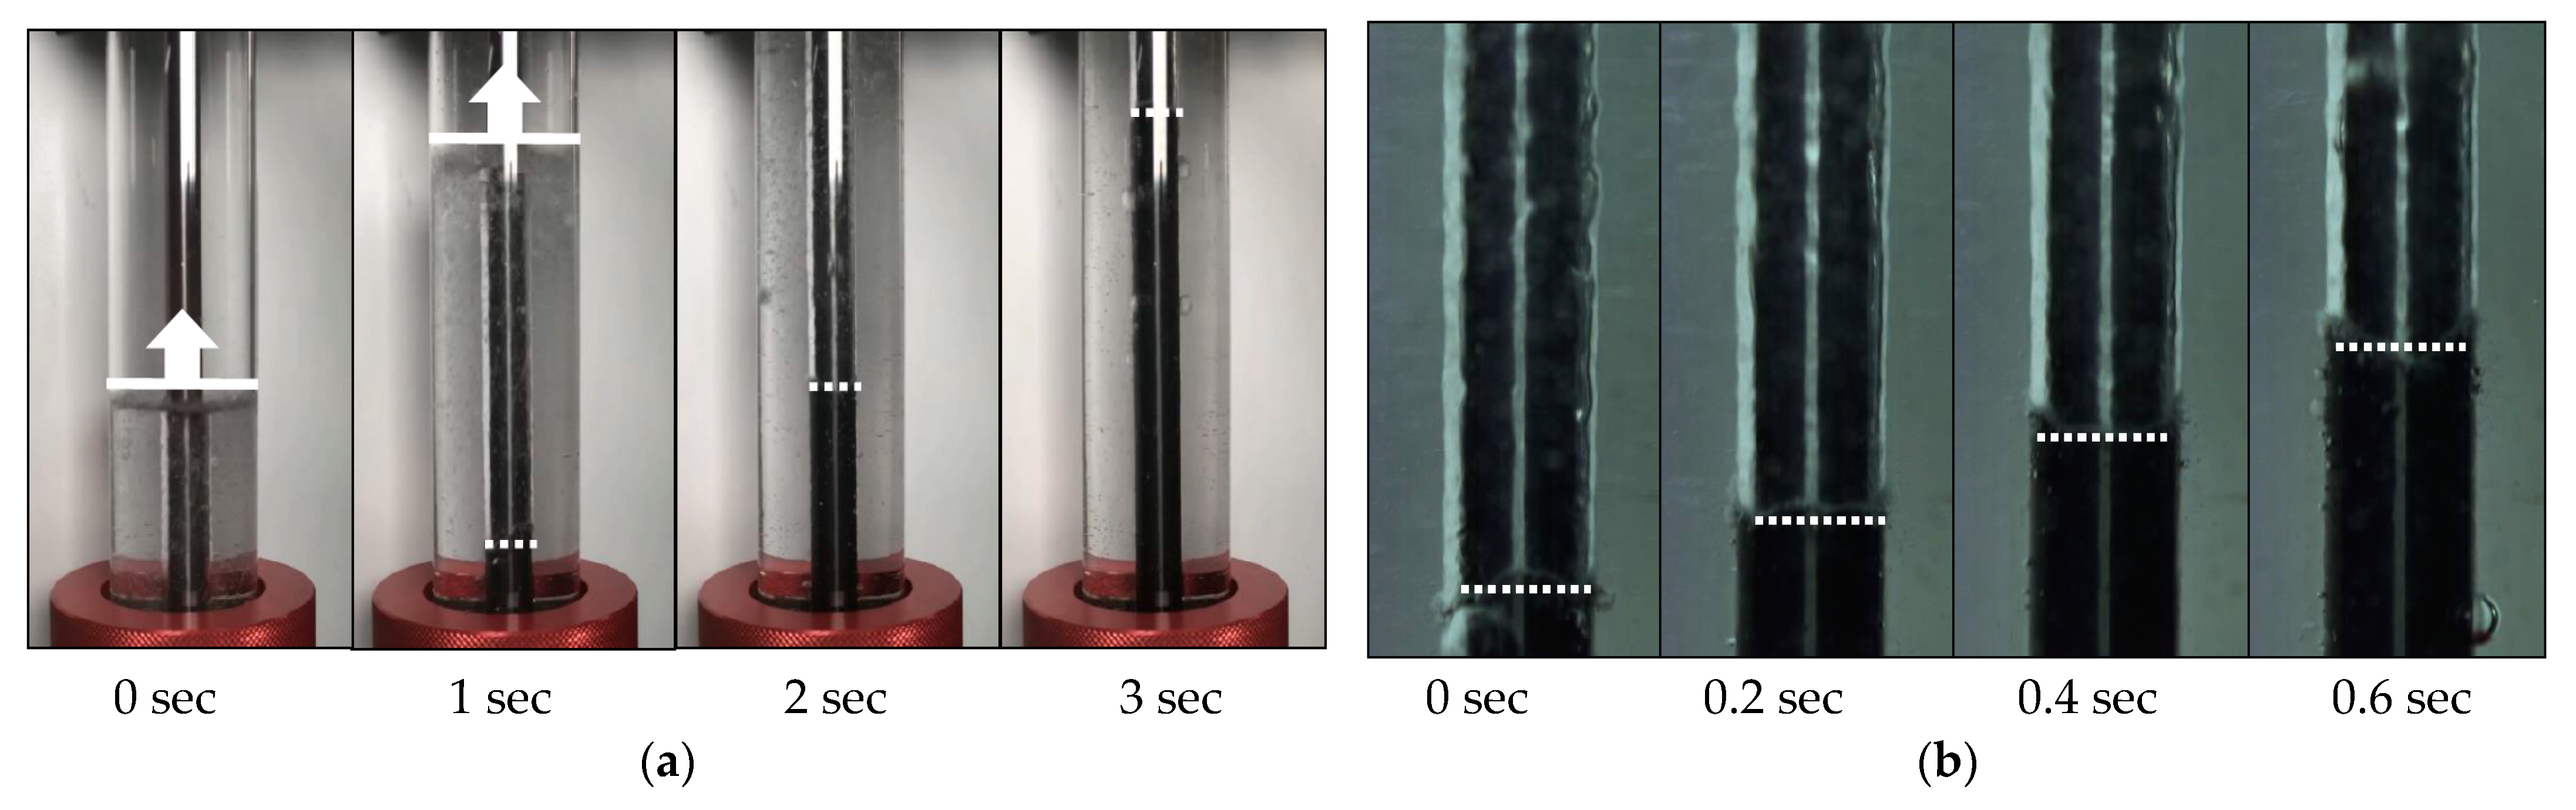
- The CrAl-coated Zr cladding shows the flow pattern and heat transfer mode similar to the uncoated Zr cladding during reflood quenching. The vapor film for the CrAl-coated Zr specimen shows thinner and more turbulent wave than the Zr one at low subcooling. At high subcooling, the CrAl-coated Zr cladding shows asymmetric quench front that moves upwards quickly.
- (2)
- The quenching curves for the high subcooling condition do not show any noticeable difference between uncoated Zr and CrAl-coated Zr claddings. The CrAl-coated Zr specimen shows fast quenching with high RWT and high speed of quench front at high initial cladding temperature (Tw = 800 °C) and low subcooling (Tsub ≤ 10 °C).
- (3)
- The RWT increases as the coolant subcooling and/or initial cladding temperature increases. The reflood velocity has a negligible effect on RWT. There is no significant difference in RWT between the Zr cladding and the CrAl-coated Zr cladding.
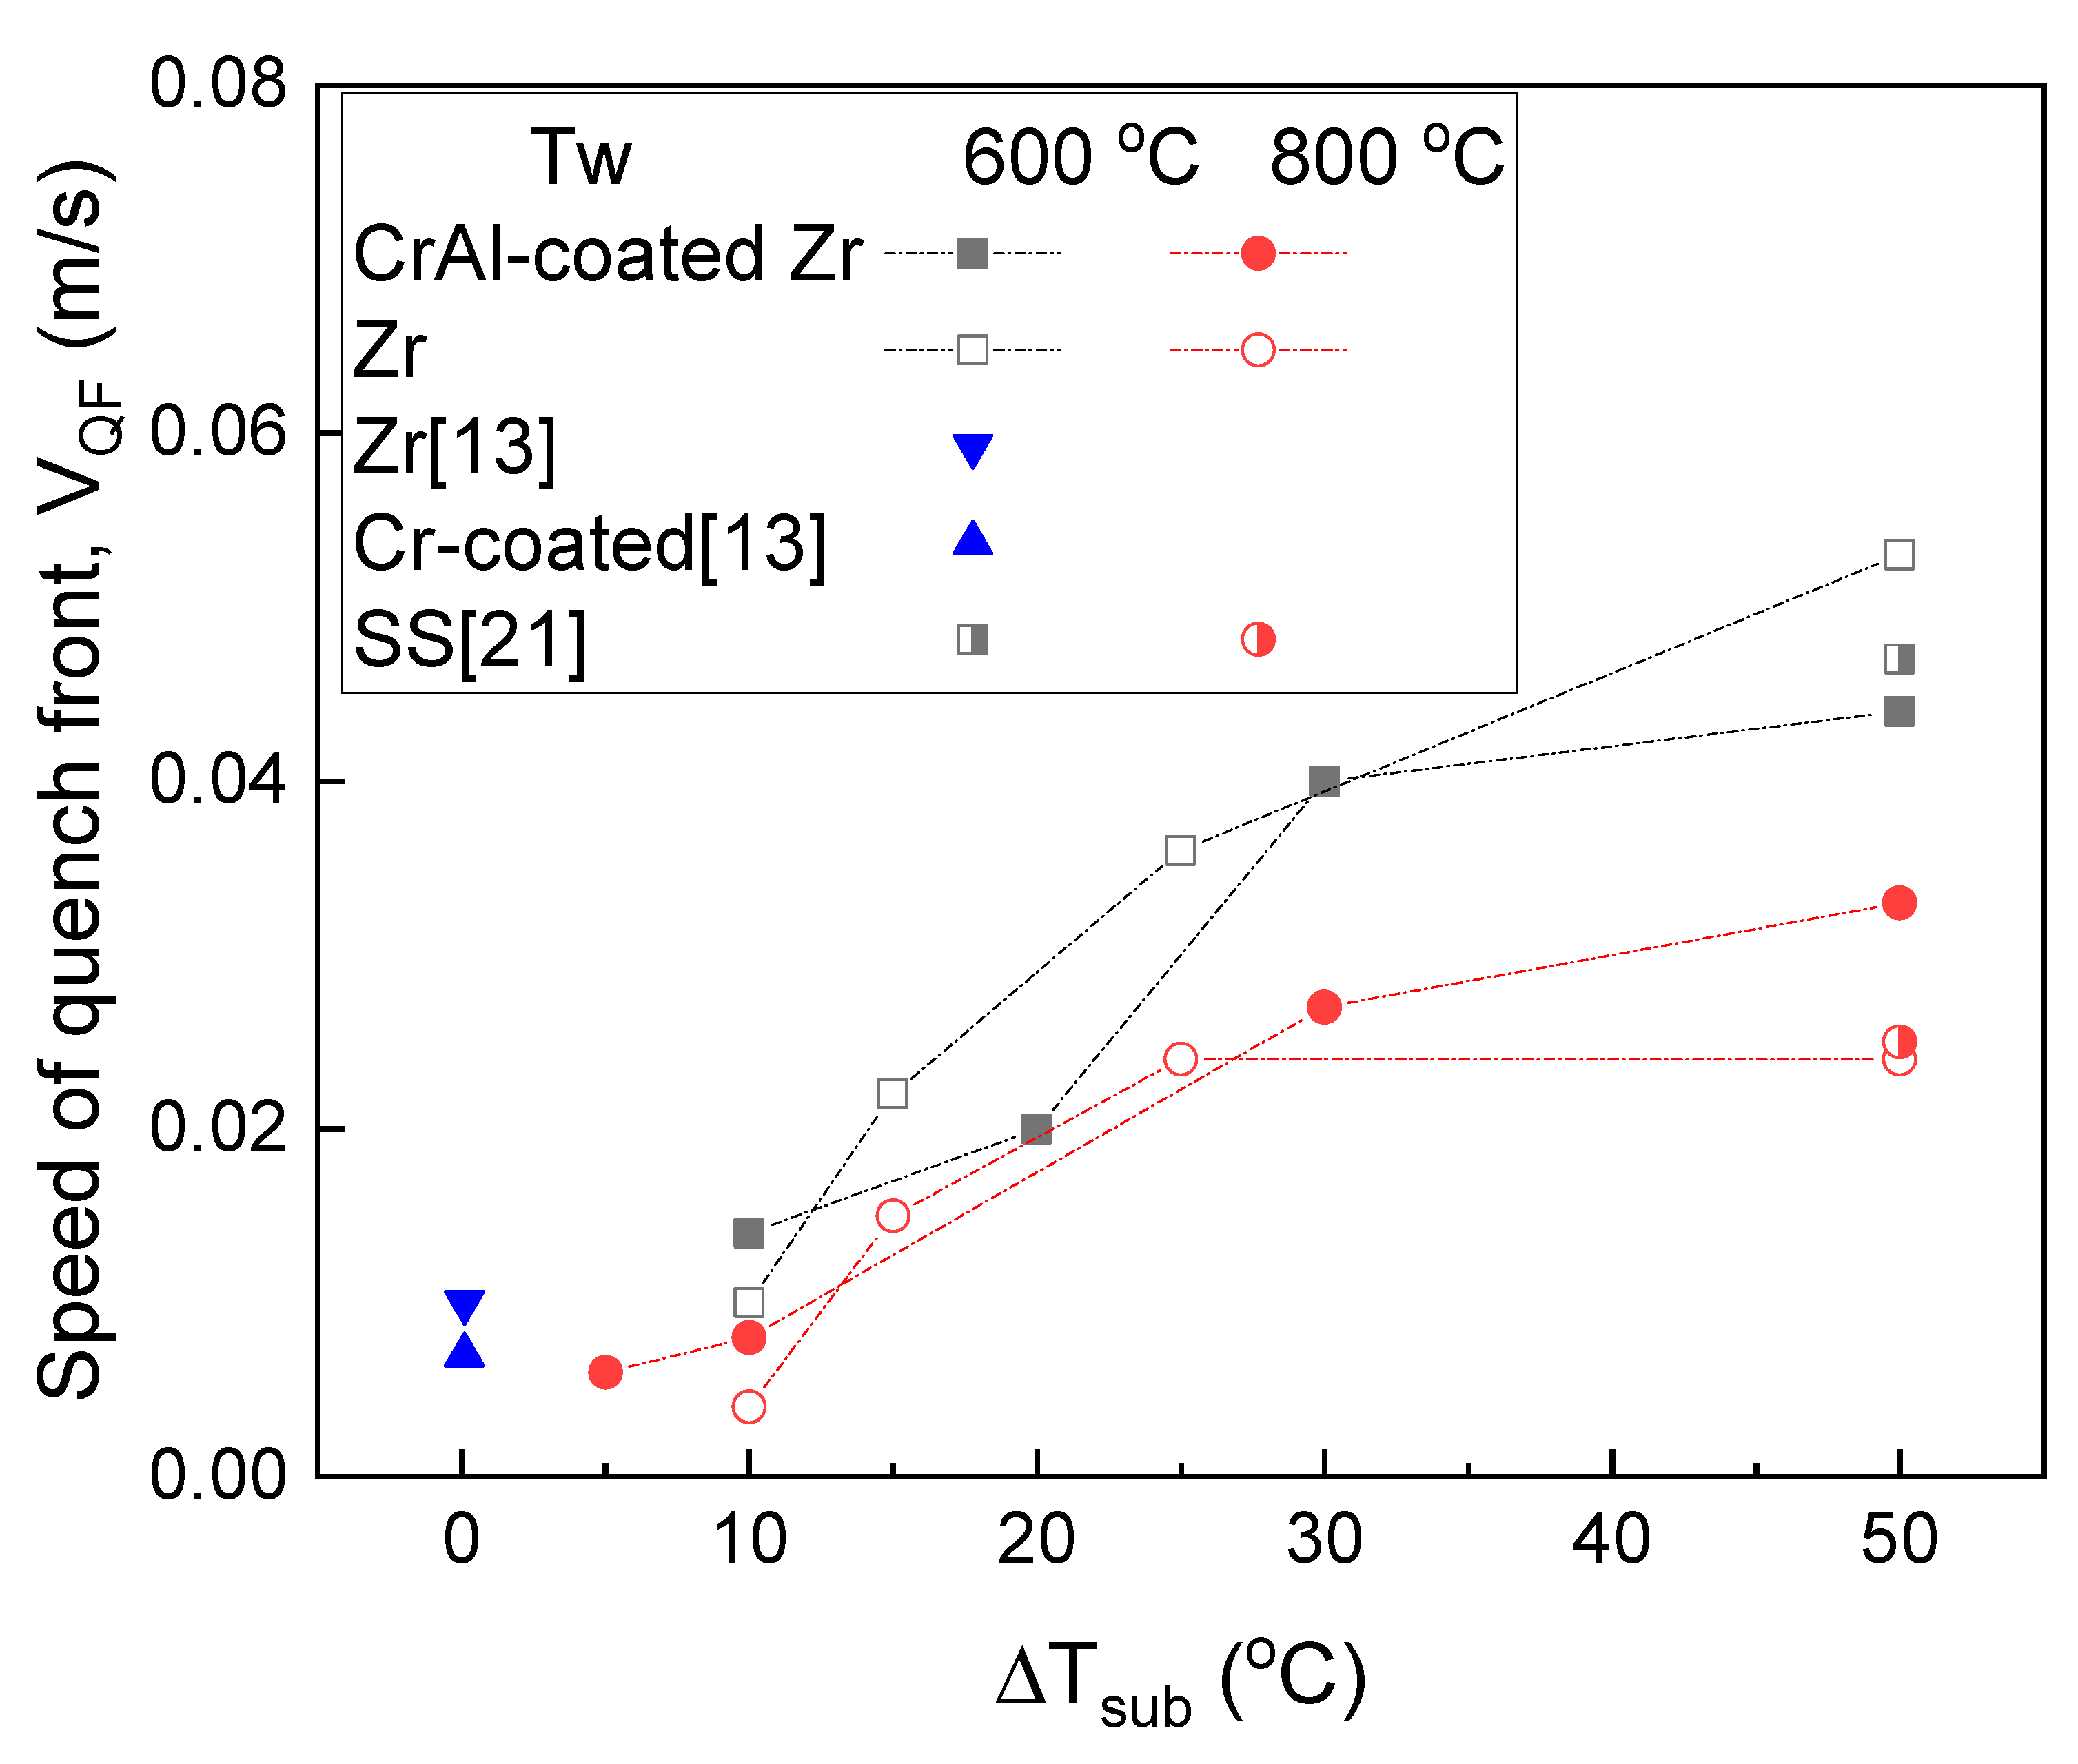
- (4)
- The quench front velocity of CrAl-coated Zr is slightly higher than the Zr one at low subcooling but becomes lower at high subcooling and low initial wall temperature. Hence, it can be concluded that the quench front velocity of CrAl-coated Zr is comparable to the Zr result.
- (5)
- The CrAl-coated Zry-4 cladding is quite promising for the ATF candidate which can result in acceptable quenching performance as well as suppression of hydrogen generation in the event of no active cooling in LWR. The future work is necessary to measure the film thickness and conduct the quenching experiment at initial wall temperature higher than the peak cladding temperature limit of LOCA.
Author Contributions
Funding
Institutional Review Board Statement
Informed Consent Statement
Data Availability Statement
Acknowledgments
Conflicts of Interest
References
- Zinkle, S.J.; Terrani, K.A.; Gehin, J.C.; Ott, L.J.; Snead, L.L. Accident tolerant fuels for LWRs: A perspective. J. Nucl. Mater. 2014, 448, 374–379. [Google Scholar] [CrossRef]
- Kurata, M. Research and development methodology for practical use of accident tolerant fuel in light water reactors. Nucl. Eng. Technol. 2016, 48, 26–32. [Google Scholar] [CrossRef]
- Yueh, K.; Terrani, K.A. Silicon carbide composite for light water reactor fuel assembly applications. J. Nucl. Mater. 2014, 448, 380–388. [Google Scholar] [CrossRef]
- Snead, L.L.; Terrani, K.A.; Katoh, A.; Silva, C.; Leonard, K.J.; Perez-Berquist, A.G. Stability of SiC-matrix microencapsulated fuel constituents at relevant LWR conditions. J. Nucl. Mater. 2014, 448, 389–398. [Google Scholar] [CrossRef]
- Terrani, K.A.; Zinkle, S.J.; Snead, L.L. Advanced oxidation-resistant iron-based alloys for LWR fuel cladding. J. Nucl. Mater. 2014, 448, 420–435. [Google Scholar] [CrossRef]
- Yan, Y.; Keiser, J.R.; Terrani, K.A.; Bell, G.L.; Snead, L.L. Post-quench ductility evaluation of Zircaloy-4 and select iron alloys under design basis and extended LOCA conditions. J. Nucl. Mater. 2014, 448, 436–440. [Google Scholar] [CrossRef]
- Nelson, A.T.; Sooby, E.S.; Kim, Y.-J.; Cheng, B.; Maloy, S.A. High temperature oxidation of molybdenum in water vapor environments. J. Nucl. Mater. 2014, 448, 441–447. [Google Scholar] [CrossRef]
- Koyanagi, T.; Ozawa, K.; Hinoki, T.; Shimoda, K.; Katoh, Y. Effects of neutron irradiation on mechanical properties of silicon carbide composites fabricated by nano-infiltration and transient eutectic-phase process. J. Nucl. Mater. 2014, 448, 478–486. [Google Scholar] [CrossRef]
- Ott, L.J.; Robb, K.R.; Wang, D. Preliminary assessment of accident-tolerant fuels on LWR performance during normal operation and under DB and BDB accident conditions. J. Nucl. Mater. 2014, 448, 520–533. [Google Scholar] [CrossRef]
- Ben-Belgacem, M.; Richet, V.; Terrani, K.A.; Katoh, Y.; Snead, L.L. Thermo-mechanical analysis of LWR SiC/SiC composite cladding. J. Nucl. Mater. 2014, 447, 125–142. [Google Scholar] [CrossRef]
- Pint, B.A.; Terrani, K.A.; Brady, M.P.; Cheng, T.; Keiser, J.R. High temperature oxidation of fuel cladding candidate materials in steam–hydrogen environments. J. Nucl. Mater. 2013, 440, 420–427. [Google Scholar] [CrossRef]
- Kim, H.G.; Kim, I.H.; Jung, Y.I.; Park, D.J.; Park, J.H.; Choi, B.K.; Lee, Y.H. Out-of-pile performance of surface-modified Zr cladding for accident tolerant fuel in LWRs. J. Nucl. Mater. 2018, 510, 93–99. [Google Scholar] [CrossRef]
- Seshadri, A.; Shirvan, K. Quenching heat transfer analysis of accident tolerant coated fuel cladding. Nucl. Eng. Des. 2018, 338, 5–15. [Google Scholar] [CrossRef]
- Lee, S.K.; Liu, M.; Brown, N.R.; Terrani, K.A.; Blandford, E.D.; Ban, H.; Jensen, C.B.; Lee, Y. Comparison of steady and transient flow boiling critical heat flux for FeCrAl accident tolerant fuel cladding alloy, Zircaloy, and Inconel. Int. J. Heat Mass Transf. 2019, 132, 643–654. [Google Scholar] [CrossRef]
- Kang, J.Y.; Kim, T.K.; Lee, G.C.; Kim, M.H.; Park, H.Y. Quenching of candidate materials for accident tolerant fuel-cladding in LWRs. Ann. Nucl. Energy 2018, 112, 794–807. [Google Scholar] [CrossRef]
- Wang, Z.; Xiong, J.; Yao, W.; Qu, W.; Yang, Y. Experimental investigation on the Leidenfrost phenomenon of droplet impact on heated silicon carbide surfaces. Int. J. Heat and Mass Transf. 2019, 128, 1206–1217. [Google Scholar] [CrossRef]
- Wang, Z.; Zhong, M.; Deng, J.; Liu, Y.; Huang, H.; Zhang, Y.; Xiong, J. Experimental investigation on the transient film boiling heat transfer during quenching of FeCrAl. Ann. Nucl. Energy 2021, 150, 107842. [Google Scholar] [CrossRef]
- Lee, K.G.; In, W.K.; Kim, H.G. Quenching experiment on Cr-alloy-coated cladding for accident-tolerant fuel in water pool under low and high subcooling conditions. Nucl. Eng. Des. 2019, 347, 10–19. [Google Scholar] [CrossRef]
- Kim, A.K.; Lee, Y. A correlation of rewetting temperature. Lett. Heat Mass Transf. 1979, 6, 117–123. [Google Scholar] [CrossRef]
- Drucker, M.; Dhir, V.K. Effects of High Temperature and Flow Blockage on the Reflood Behavior of a 4-Rod Bundle; EPRI Report, NP-2122; EPRI: Washington, DC, USA, 1981. [Google Scholar]
- Stepanek, J.; Blaha, V.; Dostal, V. Quench front propagation in the annular channel. Acta Polytech. CTU Proc. 2016, 4, 97–101. [Google Scholar] [CrossRef]


| Type/Device | Measuring Parameter | Accuracy |
|---|---|---|
| K-type TC | Temperature | ±3.7 °C |
| Electronic scale, EK6100i | Flowrate | 0.1 g |
| High-speed camera, FASTCAM SA3 | Flow pattern | 500 fps @512 × 1024 pixels |
| Digital camera, SONY alpha 6400 | Flow pattern | 30 fps @4K pixels |
| Phoenix 300 | Contact angle | 0.1° |
| Mitutoyo SJ-201 | Surface roughness | 0.02 μm |
| Parameter | Unit | Value |
|---|---|---|
| Initial cladding temperature | °C | 600, 800 |
| Coolant temperature | °C | 50–95 |
| Reflood velocity | m/s | 0.02, 0.05, 0.1 |
Publisher’s Note: MDPI stays neutral with regard to jurisdictional claims in published maps and institutional affiliations. |
© 2021 by the authors. Licensee MDPI, Basel, Switzerland. This article is an open access article distributed under the terms and conditions of the Creative Commons Attribution (CC BY) license (http://creativecommons.org/licenses/by/4.0/).
Share and Cite
In, W.K.; Lee, K.G. Quenching Experiments with CrAl-coated Zircaloy Cladding in Reflooding Water Flows. Energies 2021, 14, 1859. https://doi.org/10.3390/en14071859
In WK, Lee KG. Quenching Experiments with CrAl-coated Zircaloy Cladding in Reflooding Water Flows. Energies. 2021; 14(7):1859. https://doi.org/10.3390/en14071859
Chicago/Turabian StyleIn, Wang Kee, and Kwan Geun Lee. 2021. "Quenching Experiments with CrAl-coated Zircaloy Cladding in Reflooding Water Flows" Energies 14, no. 7: 1859. https://doi.org/10.3390/en14071859
APA StyleIn, W. K., & Lee, K. G. (2021). Quenching Experiments with CrAl-coated Zircaloy Cladding in Reflooding Water Flows. Energies, 14(7), 1859. https://doi.org/10.3390/en14071859