Abstract
The objective of this study was to modify an existing liquid desiccant and indirect/direct evaporative cooling-assisted 100% outdoor air system (LD-IDECOAS) for humidification operation in winter. The energy benefit of the liquid desiccant-assisted humidification approach during the operation of LD-IDECOAS over the conventional method with a steam humidifier was evaluated through a detailed energy simulation. The humidification and enthalpy effectiveness values of the liquid desiccant humidification measured from laboratory tests were 0.41 and 0.49, respectively, which were applied to the energy simulation for the modified system. Both systems with the proposed and conventional humidification approaches were simulated using an engineering equation solver combined with a TRNSYS 18 energy simulation program. The results demonstrated that the modified LD-IDECOAS consumes less energy for humidification compared to the existing system with a steam humidifier. The proposed system also exhibited considerable heating energy-saving potential. Consequently, modified LD-IDECOAS consumed 42% less primary energy during winter operation after being modified for liquid desiccant-assisted humidification.
1. Introduction
Liquid desiccant and indirect/direct evaporative cooling-assisted 100% outdoor air system (LD-IDECOAS) has recently been proposed in the open literature [1] as an energy conservative air handling system serving a building. This system comprises a liquid desiccant (LD) dehumidifier, indirect evaporative cooler (IEC), and direct evaporative cooler (DEC). During summer season operation, the introduced outdoor air (OA) is initially dehumidified by the LD dehumidifier, which is called the absorber (ABS), and then cooled by an IEC and/or DEC. The weakened desiccant solution leaving the ABS is delivered to the regenerator (REG) to regenerate the desiccant solution. To enhance the dehumidification performance of the ABS, the strong desiccant solution should be cooled before allowing entry into ABS, while the weak desiccant solution should be heated before allowing entry into REG to enhance the regeneration performance.
Consequently, a heat pump was selected as an energy conservative heat source for the concurrent cooling and heating of the strong and weak desiccant solutions during LD system operation [2,3,4,5]. Xie et al. [2] suggested a counter-flow heat pump driven liquid desiccant system. Energy performance was evaluated under various input parameters and the number of mass transfer units (NTU) was a key parameter for the system performance. Liu et al. [3] analyzed the performance of the internally cooled type liquid desiccant system for dehumidification. The heat pump was used for a heat source of the liquid desiccant system. Shin et al. [4] evaluated the energy benefits of heat pump driven liquid desiccant air-conditioning system. The heat pump driven liquid desiccant air-conditioning system could save 33% primary energy per year compared to conventional liquid desiccant air-conditioning system with cooling tower and gas boiler. Zhang et al. [5] proposed a hybrid air-conditioning system. The latent load was treated by a liquid desiccant system served by a heat pump, and another heat pump treated the sensible load.
Energy efficiency improvement and optimization of the heat pump-driven LD dehumidification approach were also investigated in previous studies [6,7,8]. Peng and Luo [6] evaluated the coefficient of performance (COP) of the liquid dehumidification and heat pump hybrid system. Many heat recovery devices, which have various heat recovery effectiveness, were considered for system performance. Zhang et al. [7] studied the performance optimization of heat pump driven liquid desiccant (HPLD) dehumidification systems. The heat pump system with a water-cooled condenser was investigated and showed that the system had 35% higher system COP than the basic HPLD system. Niu et al. [8] illustrated the configuration of the liquid desiccant and heat pump hybrid air-conditioning system and evaluated the matching effect between the liquid desiccant and the heat pump through novel matching indices.
However, the heat pump-driven LD system can be used for humidifying and heating the processed air in winter operation using a reversible heat pump [9,10] that can physically switch the ABS and REG. To examine the applicability of the regenerator for humidification, Huang et al. [9] conducted an experimental study on a crossflow regenerator with glycol aqueous solution under low air temperature. Zhang et al. [10] also tested the performance of the dehumidifier and regenerator in the typical air-conditioning systems operating ranges. The dehumidification and regeneration of the liquid desiccant system were evaluated for both the summer and winter modes in this research. However, the previous studies have been focused on the performance of the regenerator for humidification. The system integration or annual operation logic and energy performance of the heat pump-driven LD system also have not been studied. Moreover, this LD humidification approach is not considered in conventional LD-IDECOASs. Instead, the LD part of the LD-IDECOAS is deactivated during the heating season operation.
Consequently, in this study, existing LD-IDECOAS was modified to provide humidification during the heating season by activating the LD part driven by the reversible heat pump. The energy benefit of the proposed humidification approach over conventional steam humidification was also evaluated via detailed energy simulations performed using TRNSYS 18 and a commercial engineering equation solver program. In addition, the experiment was performed to estimate the humidification performance of the LD part for the detailed energy simulations because the humidification performance has not been investigated within the target range and solution type needed for the LD-IDECOAS.
2. System Overview
2.1. Existing System
Figure 1 illustrates the existing LD-IDECOAS, which comprises an LD part, IEC, DEC, a heating coil, and a steam humidifier. During the cooling season, the hot and humid process air is initially dehumidified in the ABS (i.e., LD dehumidifier), and then cooled by the IEC and DEC to meet the supply air (SA) temperature setpoint, as shown in Figure 1a. During the heating season, the pumps in the LD part are deactivated, and the cold and dry processed air bypasses the LD system. The IEC operating in dry mode works as a heat exchanger (HX), reclaiming wasted heat from the return air (RA) stream to preheat the processed air. DEC is deactivated, and the steam humidifier humidifies the processed air to meet the target humidity ratio of SA. A schematic of this season is illustrated in Figure 1b.
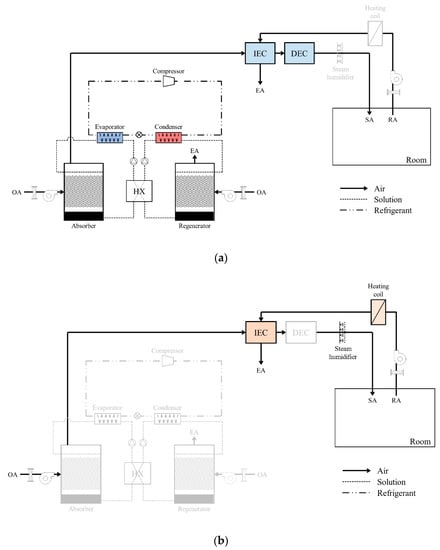
Figure 1.
Schematics of existing liquid desiccant and indirect/direct evaporative cooling-assisted 100% outdoor air system (LD-IDECOAS) for (a) cooling and (b) heating seasons. DEC: direct evaporative cooler, EA: exhaust air, HX: heat exchanger, IEC: indirect evaporative cooler, OA: outdoor air, RA: return air, and SA: supply air.
2.2. Modified System
The existing LD-IDECOAS was modified by adopting a reversible heat pump for concurrent cooling and heating of the desiccant solution before entering the ABS and the REG of the LD part, as shown in Figure 2. The cooling season operation of the modified system is identical to that of the existing one, while the heating season operation mode is different.
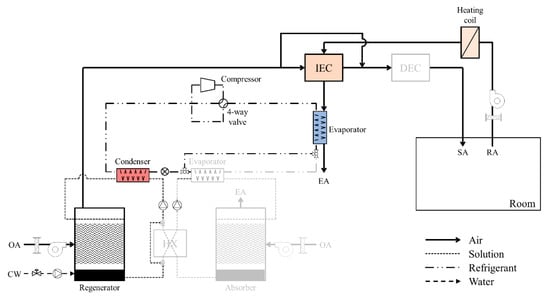
Figure 2.
Schematic of the modified LD-IDECOAS in the heating season. CW: city water.
During the heating season operation, the ABS and REG functions of the LD system operating in the cooling season are switched by reversing the refrigerant flow of the heat pump. Consequently, the processed air is humidified and preheated in the REG of the modified system during the heating season. The steam humidifier used in the existing system can be removed. If the processed air temperature after regeneration is lower than the RA temperature, the waste heat in the RA stream is reclaimed to heat the processed air in the IEC, working as an air-to-air sensible HX. The processed air is bypassed by the IEC when the processed air temperature after regeneration is higher than the RA temperature because of the preheating through the REG in the LD part. Thus, the DEC is deactivated.
A heat pump was selected as the heat source for the modified LD-IDECOAS because it can provide both cooling and heating. The heat pump can be operated in the reversible cycle through a four-way valve, as shown in Figure 2 [11,12,13]. During the heating season, there are two evaporators and one condenser. An air-side evaporator transfers the heat from the RA to the heat pump, and a solution side evaporator is bypassed. The refrigerant in the heat pump leaving the evaporator has a high temperature and releases heat to the REG inlet solution through the condenser.
2.3. Operation Mode
The operational logic of the modified system is based on the OA condition. As shown in Figure 3, the system operates in four modes [4]. In Mode 4, the dry-bulb temperature of the OA is lower than the target SA temperature. If the OA condition has a lower enthalpy than that of the room condition, the DEC is only operated to meet the target SA temperature. This strategy of this operation is used in Mode 3. Meanwhile, Modes 1 and 2 are separated for the OA humidity ratio. If the OA is more humid than the target condition, the LD system is operated to dehumidify the processed air. Subsequently, the processed air is cooled to the target temperature through the IEC and DEC. In Mode 2, the OA is dry enough to be cooled by the IEC and DEC. In general, Modes 4 and 1 are operated during the heating and cooling seasons, respectively. Modes 3 and 2 are generally operational in intermediate seasons.
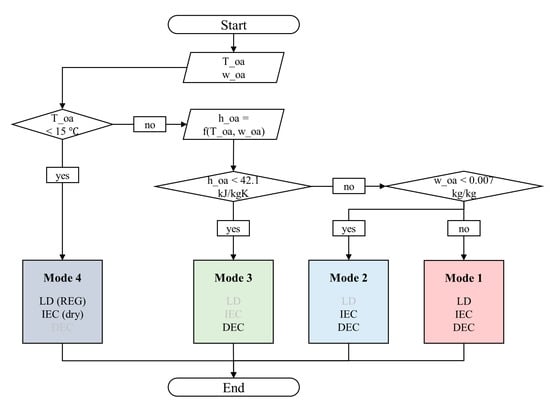
Figure 3.
Mode of operation in the modified LD-IDECOAS. LD: liquid desiccant, REG: regenerator.
The existing LD-IDECOAS and modified LD-IDECOAS operated as the same strategy in Mode 1, 2, and 3. In Mode 4 of the existing LD-IDECOAS, the LD system is deactivated, and the IEC is used in dry mode to recover the heat from the RA. In this case, a steam humidifier was used to humidify the processed air. In contrast, the LD system is used for the humidification and preheating of the processed air in the modified LD-IDECOAS. The LD system is operated by on/off control according to the latent load in the building, and the IEC is used in dry mode, similar to the existing LD-IDECOAS when the LD system is deactivated.
2.4. LD System
Figure 4a shows the LD system during the cooling season. The LD system comprises ABS, REG, solution HX, and two heat sources. The strong solution absorbs the water vapor from the air in the ABS; this process is a dehumidification process. As the dehumidification process is an exothermic reaction, the solution must be cooled before it enters the ABS. After leaving the ABS, the weak solution desorbs moisture to the air in the REG. This process is a regeneration process. The solution must be heated before entering the REG because the humidification process is an endothermic reaction. The LD system is continuously operated by repeating the dehumidification and regeneration processes [3,14,15]. The solution is cooled and heated by the heat sources, and a solution HX is used to reduce the heating and cooling load for the solution. In general, the hot and humid OA is dehumidified by the ABS, and the weak solution leaving the ABS is regenerated by the REG during the cooling season, as illustrated in Figure 4a.
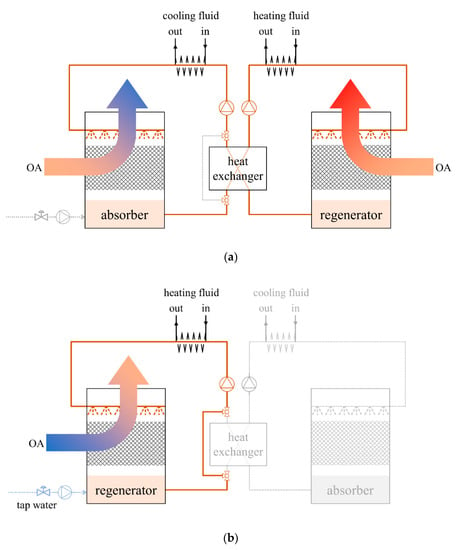
Figure 4.
LD system design diagrams for (a) cooling and (b) heating seasons.
The locations of the ABS and REG can be easily switched by the heat sources without exchanging other components. Thus, the REG can be used as a humidifier by the reversible heat pump cycle. As can be seen in Figure 4b, the ABS and REG are located on opposite sides. The cold and dry air is humidified and preheated by the solution in the REG, while the ABS is not operational. The solution HX is also bypassed because it is circulated in the REG loop. The solution was diluted, and the concentration was maintained by adding tap water during the heating season.
3. Experimental Setups
3.1. System Description
Many studies have indicated that the effectiveness of regeneration is related to operating conditions such as the air and solution temperature, air humidity ratio, solution concentration, and flow rates of air and solution [16,17,18]. However, previous studies have been conducted on the regeneration of desiccant solution for dehumidification cycles, and operating conditions were focused on the summer season. While the humidification performance has been tested in several studies [9,10] and the solution type is different from that used in the LD-IDECOAS.
Therefore, the effectiveness of regeneration was tested in the laboratory under various OA conditions for humidification. A schematic of the experimental setup is presented in Figure 5. The experimental equipment comprised an REG, a constant-speed fan, two tanks, two constant-speed pumps, and an electronic heating coil.
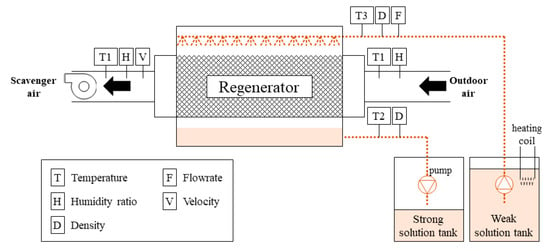
Figure 5.
Diagram of the experimental setup and sensor locations.
The processed air was blown into the REG when the air fan located outside of the wall was activated. The weak solution heated by the electronic heating coil was pumped and sprayed onto the packing material surface of the REG from the weak solution tank. The solution temperature was adjusted by the electronic heating coil in the weak solution tank to the target condition during the experiment. Heat and mass transfers occurred between the air and solution in the REG. The solution regenerated during this process was sent to the strong solution tank.
The actual experimental setup is shown in Figure 6. The specifications of each component used in this study are listed in Table 1. While the lithium chloride (LiCl) solution has corrosion issues, LiCl was selected as the working fluid because the LiCl solution shows high performance for dehumidification and regeneration [1]. CELdek 7090-15 was used as a packing medium in the REG with cross-sectional dimensions of . The packing media was in length and constituted cellulose rigid pads that enhance the transfer of heat and mass by large pores on the surface [14,19,20]. A Teflon heating coil material was used for solution heating because the coil surface can be corroded by the desiccant solution.
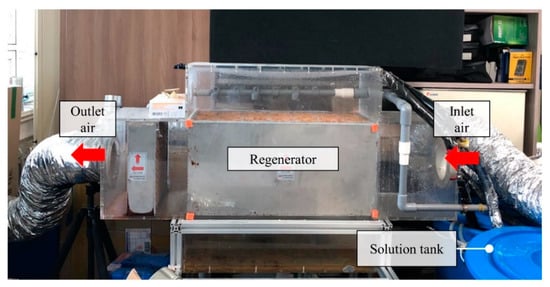
Figure 6.
Actual experimental setup of REG.

Table 1.
Physical information of each component in the experimental setup.
To calculate the humidification and enthalpy effectiveness of the REG, the dry-bulb temperature and humidity ratio of the inlet and outlet air were measured. To determine the solution concentration, the temperature and density of the weak and strong solutions were also measured. The velocity of the scavenger air was measured to check the air volume flowrate. The flow meter was also used to estimate the solution mass flow rate. The sensor locations are indicated in Figure 5 for monitoring the air and solution conditions, and the sensor specifications are summarized in Table 2. The sensors used for the experiment have been calibrated.

Table 2.
Specifications of each sensor. RH: relative humidity.
3.2. Experimental Conditions
The test conditions of the REG are presented in Table 3. The solution temperature entering the REG was set to 50 °C. As the modified system is operated as a ventilation system, the set temperature can be lower than this during the cooling season operation, which can also reduce the energy consumption. The solution concentration was maintained at 30%. The LD system was also used for the cooling season dehumidification; the solution concentration was maintained to allow dehumidification and humidification. In addition, because the crystallization temperature of the 30% LiCl is lower than the designed OA condition in the winter, the concentration of 30% is maintained to avoid the crystalizing problem of the LD solution [21]. The liquid-to-gas ratio (L/G) was set to 2 because the LD-IDECOAS was operated at L/G = 1 during the cooling season [1,4], and the air flow rate of the modified system was lower during the heating season when the pump speed was constant. In this experiment, the OA temperature and humidity ratio were not controlled because the OA was blown directly into the REG instead of using makeup air. The tested values of OA (i.e., temperature and humidity ratio) present typical winter conditions, although the OA conditions rarely affect the effectiveness of the REG [9]. The experiment was performed for 2 min after a steady-state condition was reached. The data measured by each sensor were collected by a data logger at 10 s intervals.

Table 3.
Test conditions. L/G: liquid-to-gas ratio.
3.3. Humidification Performance Indices
The effectiveness of humidification has been used as a performance metric for the REG of an LD system. The REG is activated as a humidifier in the modified system; thus, humidification performance can be expressed in terms of humidification effectiveness. The humidification effectiveness () is defined by the actual change ratio of the processed air to the theoretical maximum change in the humidity ratio Equation (1). The enthalpy effectiveness has also been used as a performance metric. Similarly, the enthalpy effectiveness () is the ratio of the actual change in the processed air to the theoretical maximum change in enthalpy Equation (2).
The equilibrium humidity ratio () is expressed by Equation (3) when the saturated vapor pressure () of the solution is given. The saturated vapor pressure of the LD solution can be calculated using the second-order polynomial Equation (4), with the coefficients presented in Table 4 [22].

Table 4.
Coefficients of the model for Equation (4).
The equilibrium enthalpy () is determined through the given solution temperature and equilibrium humidity ratio, as shown in Equation (5).
3.4. Experimental Results and Validation
3.4.1. Experimental Results
Laboratory-scale experimental tests were conducted to investigate the effectiveness of the REG in heating operations. Figure 7 presents the experimental results of the effectiveness of humidification and enthalpy according to the OA temperature and humidity ratio. The inlet air temperature ranged from −2.6 to 4.6 °C, and the humidity ratio ranged from 0.0008 to 0.0017 kg/kg. While various OA conditions were tested, the humidification effectiveness was maintained at approximately 0.41. Meanwhile, the enthalpy effectiveness was 0.48 on average. Thus, the effectiveness values of humidification and enthalpy were assumed to be 0.41 and 0.48, respectively, to conduct the energy simulation described in Section 4, and they have been used with other parameters to maintain the design conditions. More detailed experimental values are presented in Table 5.
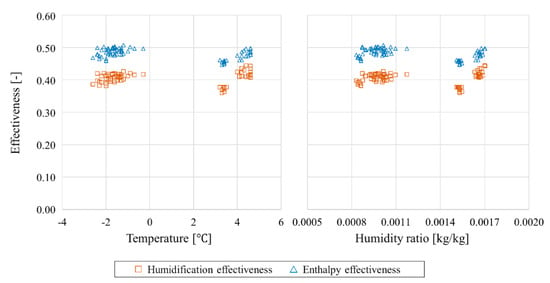
Figure 7.
Humidification and enthalpy effectiveness data according to OA conditions.

Table 5.
Experimental results for REG in humidification mode.
3.4.2. Validation
The energy balance was analyzed to validate the experimental results. The internal energy variations of the solution and air were predicted using Equations (6) and (7) [1]. The mass flow rates of the solution and air, the temperatures of the inlet and outlet solutions, and the enthalpies of the inlet and outlet air were measured.
The internal energy variations of the solution and air are compared in Figure 8. As shown, the relative difference is within 15% of the internal energy variation. This is an acceptable result. Thus, the values of the humidification and enthalpy effectiveness can be used to predict the regeneration performance of the LD system.
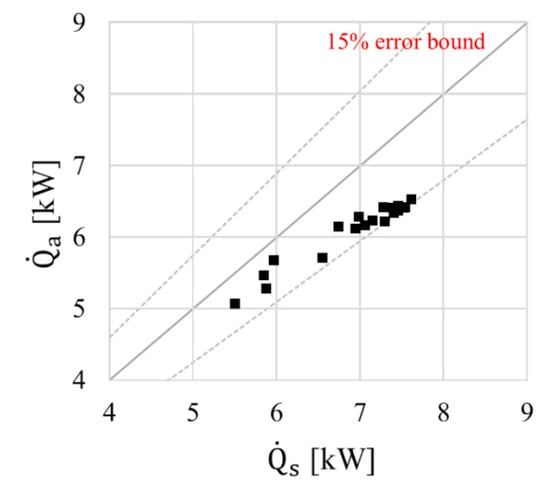
Figure 8.
Internal energy variations of the solution and air.
4. Energy Simulation
4.1. Model Space
The sensible and latent loads of a model building, which are served by the modified and existing systems, were calculated using TRNSYS 18. The model building is an office building located in Seoul, South Korea. Its area and ceiling height were assumed to be and , respectively. There were two 10 m2 windows at the south and north exterior walls; thus, the window-to-wall ratio was 0.17. The total heat generation rate from an occupant was , and the internal heat generation from the lighting equipment was . The typical occupancy, system, and lighting schedules for an office building were extracted from the ASHRAE Standard 90.1 [23]. The target points of the conditioned zone were as follows: dry-bulb temperature of 20 °C and relative humidity of 50% for heating. The physical information of the model building is detailed in Table 6.

Table 6.
Model building information.
4.2. LD System
4.2.1. Outlet Condition of Regenerator
The LD system comprises a REG during the winter season. The condition of the processed air leaving the LD system can be represented using the humidification and enthalpy effectiveness values, which were assumed to be 0.41 and 0.48, respectively, based on the experimental results presented in Section 3. Furthermore, Equations (1) and (2) were used to predict the outlet condition of the processed air.
The concentration and temperature of the solution leaving the REG can be determined using Equations (8)–(11) from the heat and mass balance equations. The humidification rate () and the mass flow rate of the solution () leaving the REG were determined using Equations (8) and (9). The humidification rate is the amount of moisture transferred from the solution to the processed air. The solution outlet mass flow rate can be calculated by subtracting the humidification rate from the inlet mass flow rate of the solution. The concentration of the solution () leaving the REG can be estimated using Equation (10), with the mass balance of the REG inlet and outlet conditions. The leaving REG solution enthalpy () was obtained based on the energy balance represented by Equation (11).
4.2.2. Sump Solution Condition
The LD system also constitutes a solution sump. The temperature of the sump solution was changed hourly in the simulation, while the concentration remained fixed. The temperature of the solution was varied depending on the solution leaving the REG, tap water for solution concentration maintenance, and the solution leaving the sump. The solution leaving the REG and tap water for solution concentration maintenance was considered as the heat gain () of the sump, and the solution leaving the sump was considered as the heat loss (). The sump temperature variation was affected by the heat gain and loss, and the heat flow can be expressed in terms of the thermal capacity (Equation (12)) [24].
The initial weight of solution in the sump was assumed to be 20 kg, considering the size of the LD system. Moreover, the initial temperature of the sump solution was set assuming, that the solution temperature converged to the indoor air temperature (20 °C) when the system was switched on.
4.3. Heat Pump Model
During the heating season, the heat pump was used for solution heating, transferring heat from the indoor air to the solution. In this study, variable-speed compressor control was used to meet the heating load. The heat pump system was also designed for heating priority, and R410A was selected as the refrigerant in the heat pump. The subcooled and superheated degrees could be neglected.
The calculation process is detailed in Figure 9. The surface temperature of the condenser () was assumed through the target solution temperature entering the REG and the effectiveness of the HX. The effectiveness of the condenser was assumed to be 0.75 [25]. Further, the initial surface temperature of the evaporator was assumed to be 7 °C based on the variation in temperature between the evaporator and heat source [26]. The mass flow rate of the refrigerant () was calculated using Equation (16), based on the heating priority. Using the process detailed in Figure 8, the surface temperature of the evaporator () was adjusted to balance the heat in the heat pump. Finally, the compressor power () could be estimated using Equation (19).
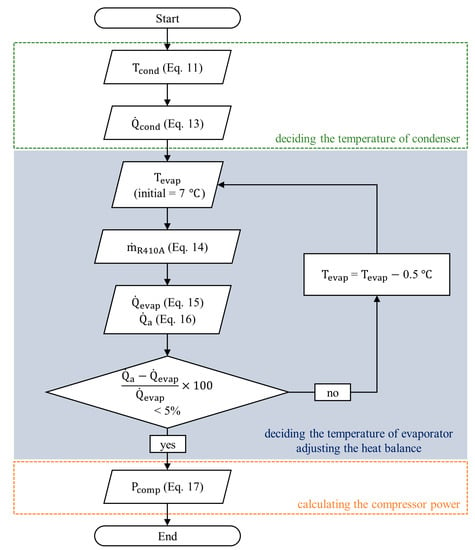
Figure 9.
Calculation process flowchart in the heat pump.
4.4. Direct-Injection Steam Humidifier
The direct-injection steam humidifier meets the target humidity ratio of the processed air to control the amount of steam. Thus, the target humidity ratio () of the SA can be calculated through the latent load of the conditioned zone using Equation (20). The humidification rate () is also assumed from the target humidity ratio and airflow rate in Equation (21). The required amount of steam () is a function of the rate and efficiency of humidification. It can be calculated by dividing the humidification rate by the efficiency (), as shown in Equation (22) [27,28]. The boiler load for providing steam to the humidifier is expressed using the temperature variation and the latent heat of the vaporization of water, given by Equation (23). The temperatures of steam and water leaving and entering the boiler are assumed to be 120 and 20 °C, respectively. Additionally, the efficiency of humidification is assumed to be 90% [27]. Then, the operational energy of the boiler can be estimated using the boiler load obtained by Equation (23) and the model based on EnergyPlus [29].
The enthalpy of the processed air leaving the direct-injection steam humidifier () was calculated using Equation (24) based on the energy balance [29]. The humidity ratio of air leaving the humidifier is the same as the target humidity ratio obtained from Equation (20). While the SA temperature can be obtained using the enthalpy and humidity ratio of the processed air from the psychrometric chart, the temperature of the processed air rarely changes because the steam humidifier is an isothermal process.
4.5. Other Components
4.5.1. Parallel Heating Unit
While the processed air is heated by the LD system, a parallel heating unit is required to meet a sensible load in the modified system because the modified system is operated for ventilation and humidification during the heating season. Furthermore, a parallel heating unit is required because the existing system also operates as a ventilation system. The parallel heating load () was estimated by subtracting the heating capacity of the SA from the sensible heating load for the building Equation (25).
4.5.2. Boiler
In the modified system, a conventional gas boiler was used for the parallel heating unit in the room. It was also used for preheating the processed air, providing steam at the direct-injection steam humidifier, and as a parallel heating unit in the existing system. As in Equation (26), the natural gas consumption () was derived using a general boiler model in the engineering reference from EnergyPlus [29] according to the required heating load in each component. The boiler efficiency curve is a cubic curve of the part-load ratio, which is the ratio of the required heating load to the boiler capacity. The theoretical efficiency () of the boiler was assumed to be 0.82 [30]. The reference capacity of the boiler was assumed to be 5 kW in the modified system and 10 kW in the existing system.
4.5.3. Fan and Pump
There are two fans in the modified system, one for the SA and another for the exhaust air, because the scavenger air fan does not operate in the heating mode. There are also two fans in the existing system for the SA and exhaust air. The energy consumption of the fan () can be estimated using a simplified model based on the generic fan power curve, given by Equation (31). The design fan power () was calculated using Equation (29) with the fan efficiency of 0.5 [31]. The pressure drop () values of all components are summarized in Table 7 [31].

Table 7.
Pressure drop value of each system component.
The pump is used for solution circulation in the modified system. However, in the existing system, a steam pump is used to provide steam to the direct-injection steam humidifier. The design pump power () was derived using Equation (32) when the pump efficiency () was assumed to be 0.6. The actual pump power () was estimated according to the actual fluid flow rate using Equation (33) based on the affinity law. The total head of each system was assumed to be 13 m for the solution pump and 25 m for the steam pump [32].
5. Results
5.1. Thermal Behavior of Modified LD-IDECOAS
5.1.1. Sump solution temperature
The temperature of the sump solution in the LD system varies, as illustrated in Figure 10. The solution temperature rises when the HVAC schedule is switched on. While the HVAC schedule is on, the sump temperature is maintained at approximately 45 °C because of the heat gain and loss in the sump. The assumption is also made to maintain the sump solution temperature, although the LD system is not operated when the LD is off. The solution temperature converges to the neutral temperature only when the HVAC schedule is off. Maintaining the sump solution temperature affects the condenser temperature, and the condenser affects the energy consumption of the compressor that is located in the heat pump unit. Thus, the heat pump size is designed to increase the temperature of the solution from approximately 45 °C, which is the solution temperature in the LD sump to 50 °C, which is the target temperature for the REG.
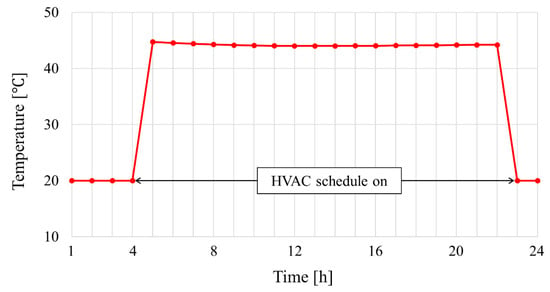
Figure 10.
Variation in solution temperature of the sump on a peak day.
5.1.2. Surface Temperature of Heat Pump
Figure 11 details the surface temperatures of the two HXs in the heat pump on a peak day. As the sump solution temperature affects the condenser temperature, there seems to be similar behavior with the sump temperature. The sump temperature is stable when the HVAC schedule is on, and the condenser temperature is stable at approximately 51 °C. This was designed to achieve the target temperature for the solution entering the REG to perform the humidification. The evaporator temperature is affected by the RA temperature and heat balance in the heat pump because it is used as the heat source of the evaporator. As heat is transferred from the RA to the refrigerant in the heat pump, the difference of the temperature between the air and refrigerant in the evaporator is higher than the difference in the temperature between the solution and refrigerant in the condenser. Therefore, the evaporator temperature is more unstable than the condenser temperature, which remains between −4 and −7 °C, as shown in Figure 11. The evaporator and condenser temperatures also converge to the neutral temperature, similar to the sump solution temperature when the HVAC schedule is off.
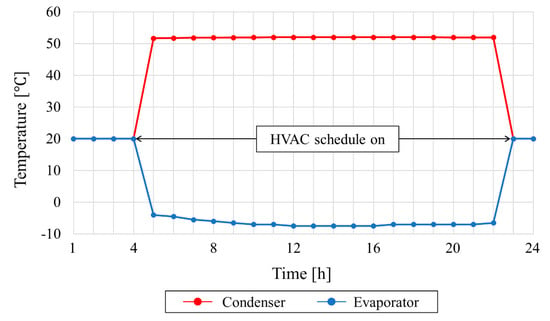
Figure 11.
Condenser and evaporator temperatures on a peak day.
5.2. Comparison of Supply Air (SA) Conditions
5.2.1. Thermal Behavior of the Air
To evaluate the performance of the modified LD-IDECOAS, the state parameters of the air under typical winter conditions were plotted on psychrometric charts, as shown in Figure 12. The OA is heated and humidified directly inside the REG over the target supply condition (i.e., 20 °C) in the modified system. As the temperature of the solution is higher (i.e., 50 °C) than that of the OA, the temperature of the processed air increased when it passed the REG by heat exchange with the solution. As mass transfer between the air and solution also occurred because of the difference in the vapor pressure in each fluid, the processed air is humidified into the REG. Whereas, the OA is preheated through the IEC dry mode operation and humidified using a steam humidifier in the existing system. The heat exchange effectiveness of the IEC in dry mode is set to 0.8, and the RA is heated before entering the HX to meet the target SA temperature. The steam humidifier is also operated to humidify the air and remove the latent load in the building. Thus, the humidity ratio of the SA in the existing system is lower than that in the modified system.
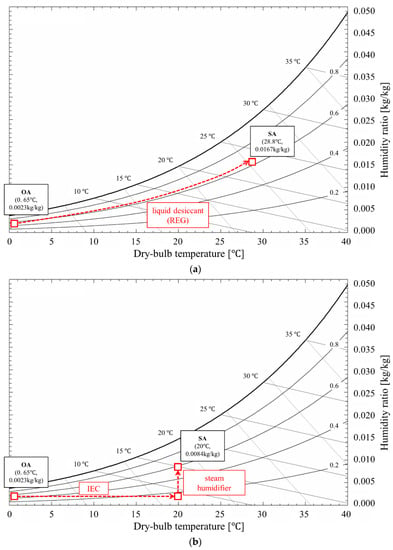
Figure 12.
Performances of (a) modified and (b) existing systems on the psychrometric chart.
5.2.2. SA Conditions
The temperature of the SA in the modified system varies according to the OA temperature, as indicated in Figure 13. In the modified system, the temperature of the SA in January is lower than that in other periods during the heating season. It can be observed that the OA conditions affect the SA, but not the humidification and enthalpy effectiveness of the LD system. Meanwhile, the SA temperature in the existing system is constant at a neutral temperature (i.e., 20 °C) because the humidification process of a steam humidifier is an isothermal process.
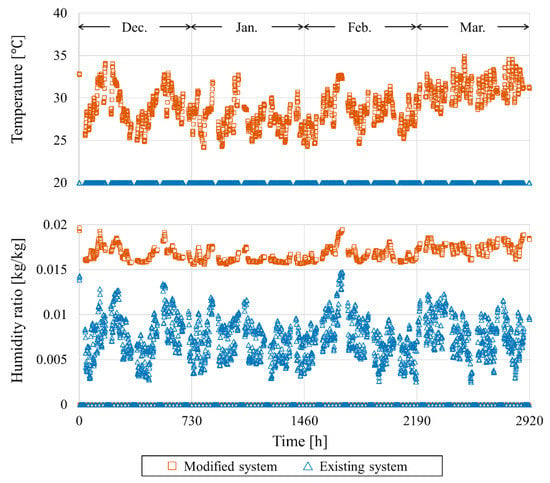
Figure 13.
Temperature and humidity ratio of the SA in each system.
The humidity ratio of the SA is also detailed in Figure 13. In the modified system, the humidity ratio of the processed air is not controlled because of the characteristics of the REG. Similar to the temperature, the humidity ratio of the SA is affected by the OA, and the humidity ratio in January is lower than that in other months. The humidity ratio of the OA in the existing system is controlled by the latent load in the building. Therefore, the humidity ratio of the SA is lower than that of the modified system.
5.3. Primary Energy Consumption
A comparison of the primary energy consumption of the modified system with that of the existing system is shown in Figure 14 during the heating season. To compare the overall energy consumption when the systems are operating, the energy consumption was converted into primary energy consumption for each heat source. The primary energy factors were 2.75 for electricity and 1.1 for natural gas [33].
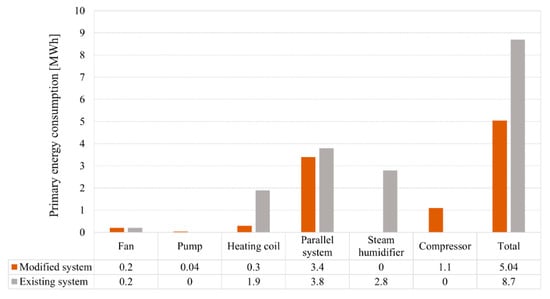
Figure 14.
Comparison of primary energy consumptions.
The operating energy for humidification reduces the total primary energy consumption of the modified system. While the existing system uses natural gas for a steam humidifier that has a lower primary energy factor than electricity, the heat pump compressor consumes less energy than that consumed by the steam humidifier. The compressor in the modified system consumes approximately 1.1 MWh per heating season, whereas the steam humidifier in the existing system consumes approximately 2.8 MWh in the same period. As the heat pump in the modified system reclaimed the heat from RA to solution and the heating coefficient of performance of the heat pump was higher than the efficiency of the boiler for a steam humidifier, the humidification energy can be reduced in the modified system, although both systems provide the same amount of humidification.
The main energy-saving potential is also achieved from the heating components according to Figure 14. In the process of humidification of the modified system, the temperature of the processed air rises because of the heat and mass transfers with the solution. As the temperature of the SA is higher than the neutral temperature, the parallel heating energy could be reduced compared to the existing system. Moreover, the SA recovers the heat from the RA at the IEC when the humidification mode is off; the heating coil energy can also provide savings over the existing system. The modified and existing systems consume approximately 3.7 and 5.7 MWh for heating, respectively.
Furthermore, the fan energies of both systems are the same because the modified and existing systems have the same air flow rate. The pump in the modified system consumes more energy because of the solution pump. As the pump for providing steam in the existing system consumes less energy than other components, the pump energy can be expressed as zero.
An analysis of the difference patterns between the monthly primary energy consumptions is illustrated in Figure 15. As the sensible load is the highest in January, the primary energy for heating is the highest in both systems. The latent loads in December, January, and February were similar. The primary energies for humidification are also similar in the same period; 0.28, 0.33, and 0.3 MWh are consumed in the modified system, and 0.78, 1.00, and 0.67 MWh are consumed in the existing system. In March, the latent load of the building is lower than that in other months, and the humidification energy is low.
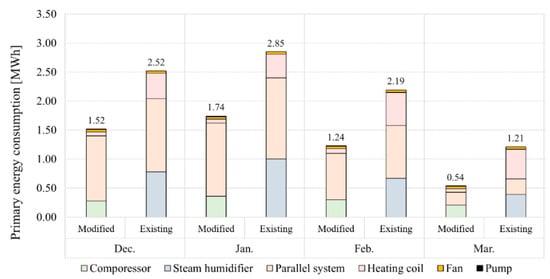
Figure 15.
Monthly primary energy consumption of each system.
The primary energy consumed by the modified system is lower than that consumed by the existing system during the entire heating operation period. The comparison of primary energy consumption indicates that the main energy-saving factors are the heating and humidification components.
5.4. Discussion
As the results of the experiment and simulation, the humidification and enthalpy effectiveness of the REG was sufficient to meet the target humidity ratio. The energy consumption for humidification is also affected by the humidification and enthalpy effectiveness values because the temperature of the SA is variable according to these parameters.
The results of this study also show that not only the existing system modification, but the humidification approach using the regenerator can be more efficient than other humidification methods. In Table 8, the performance of the proposed humidification approach was compared to other humidification devices such as an ultrasonic humidifier.

Table 8.
The performance of each humidification approach.
The average humidification rates of the proposed system and ultrasonic humidifier are 1.46 kg/h and 0.063 kg/h, respectively. The operating time of the LD system was 0.34 h, while eight or more ultrasonic humidifiers are required for the target humidity in the model building per hour; thus, the heat pump-driven LD humidification could save the average energy consumption per hour than the ultrasonic device. Consequently, the LD-assisted humidification is an efficient humidification approach that not only achieves energy benefits over the existing LD-IDECOAS, but also has the potential to replace current humidification methods, including the ultrasonic humidifier.
Meanwhile, the temperature and concentration of the desiccant solution remained constant in this study; however, the energy-saving potential could differ because the temperature and concentration of the solution are the key factors influencing the humidification and enthalpy effectiveness values. While the SA temperature is also high to reduce the heating energy for building, the total energy-saving potential could be reduced because of the compressor power for solution heating when the temperature of the solution is high. The control of the REG for humidification is on/off, and the concentration of the solution should be designed for an ideal humidification rate. Therefore, the design of the LD system is variable because the concentration of the solution could influence not only the humidification rate during winter operation for humidification, but also the dehumidification rate in summer operation for dehumidification.
6. Conclusions
A modification of an existing LD-IDECOAS was proposed in this paper, considering the load and capacity for humidification in an LD system and heat pump. Based on the experimental results of the humidification and enthalpy effectiveness in an LD system, the primary energy consumption of the modified system was estimated and compared to that of the existing system to evaluate the energy-saving potential. The considered model building was an office located in Seoul, South Korea. It is expected that the results of this research considering the estimated energy benefits of the humidification achieved by an LD system will provide practical information concerning the use of an LD system.
The LD system for humidification was found to achieve significant temperature and humidity ratios of the SA. It was also found that the proposed heat pump-driven LD-IDECOAS could save on the primary energy consumption compared to the existing LD-IDECOAS, despite the different patterns of monthly load in the building. In addition, the modified system achieved significant energy savings of 42%, as compared to the existing system during the heating season. Using a heat pump for solution heating has considerable primary energy-saving potential. Preheating the processed air in the LD system and recovering heat from the RA also contributes to the reduction in the operating energy consumption. This finding suggests that using an LD system for humidification and preheating is critical to achieve an improvement in the energy-saving potential of the heat pump-driven LD-IDECOAS. Additionally, the proposed humidification approach could achieve significant energy savings than not only the system with the steam humidifier, but also the individual humidification such as ultrasonic humidifier.
Many studies have shown that a heat pump-driven LD system can be used for both dehumidification and humidification; however, energy consumption for humidification and suitable system design are still being developed. The results of this study indicate that an LD system for humidification can be beneficial for reducing the total primary energy consumption in an office building, and a detailed analysis of the experimental results and energy simulation for estimating the humidification performance can be helpful as a reference for the design of air-conditioning systems based on an LD system.
Author Contributions
S.-J.L., H.L. and J.-W.J. performed the experiments, simulation, data analysis and wrote this paper based on the obtained results. All authors have read and agreed to the published version of the manuscript.
Funding
This work was supported by a National Research Foundation of Korea (NRF) grant (No. 2019R1A2C2002514) and the Korean Institute of Energy Technology Evaluation and Planning (KETEP) (No. 20184010201710).
Institutional Review Board Statement
Not applicable.
Informed Consent Statement
Not applicable.
Conflicts of Interest
The authors declare no conflict of interest.
Nomenclature
| model coefficients | |
| specific heat (kJ/kg K) | |
| enthalpy (kJ/kg) | |
| vaporization heat of water (= 2257 kJ/kg) | |
| mass (kg) | |
| mass flow rate (kg/s) | |
| power (kW) | |
| vapor pressure (kPa) | |
| load (kW) | |
| temperature (°C) | |
| time (s) | |
| volume flow rate () | |
| concentration (-) |
Abbreviations
| absorber | |
| coefficient of performance (-) | |
| direct evaporative cooler | |
| exhaust air | |
| heat exchanger | |
| indirect evaporative cooler | |
| outdoor air | |
| part load ratio (-) | |
| return air | |
| regenerator | |
| supply air |
Greek Symbols
| difference (-) | |
| pressure drop in fan (kPa) | |
| effectiveness (-) | |
| efficiency (-) | |
| humidity ratio (kg/kg) |
Subscripts
| air | |
| compressor | |
| condenser | |
| equilibrium | |
| evaporator | |
| enthalpy | |
| inlet | |
| latent | |
| humidification | |
| outdoor air | |
| outlet | |
| parallel heating | |
| return air | |
| regeneration rate | |
| solution | |
| sensible | |
| supply air | |
| water |
References
- Kim, M.H.; Park, J.S.; Jeong, J.W. Energy saving potential of liquid desiccant in evaporative-cooling-assisted 100% outdoor air system. Energy J. 2013, 59, 726–736. [Google Scholar] [CrossRef]
- Xie, Y.; Zhang, T.; Liu, X. Performance investigation of a counter-flow heat pump driven liquid desiccant dehumidification system. Energy J. 2016, 115, 446–457. [Google Scholar] [CrossRef]
- Liu, J.; Liu, X.; Zhang, T. Performance of heat pump driven internally cooled liquid desiccant dehumidification system. Energy Convers. Manag. 2020, 205, 112447. [Google Scholar] [CrossRef]
- Shin, J.H.; Park, J.Y.; Jo, M.S.; Jeong, J.W. Impact of heat pump-driven liquid desiccant dehumidification on the energy performance of an evaporative cooling-assisted air conditioning system. Energies 2018, 11, 345. [Google Scholar] [CrossRef]
- Zhang, L.; Dang, C.; Hihara, E. Performance analysis of a no-frost hybrid air conditioning system with integrated liquid desiccant dehumidification. Int. J. Refrig. 2010, 33, 116–124. [Google Scholar] [CrossRef]
- Peng, D.; Luo, D. Influence of heat recovery on the performance of a liquid desiccant and heat pump hybrid system. Appl. Therm. Eng. 2020, 165, 114491. [Google Scholar] [CrossRef]
- Zhang, T.; Liu, X.; Jiang, Y. Performance optimization of heat pump driven liquid desiccant dehumidification systems. Energy Build. 2012, 52, 132–144. [Google Scholar] [CrossRef]
- Niu, X.; Xiao, F.; Ma, Z. Investigation on capacity matching in liquid desiccant and heat pump hybrid air-conditioning systems. Int. J. Refrig. 2012, 35, 160–170. [Google Scholar] [CrossRef]
- Huang, S.; Lv, Z.; Zhang, X.; Liang, C. Experimental investigation on heat and mass transfer in heating tower solution regeneration using packing tower. Energy Build. 2018, 164, 77–86. [Google Scholar] [CrossRef]
- Zhang, L.; Hihara, E.; Matsuoka, F.; Dang, C. Experimental analysis of mass transfer in adiabatic structured packing dehumidifier/regenerator with liquid desiccant. Int. J. Heat Mass Transf. 2010, 53, 2856–2863. [Google Scholar] [CrossRef]
- Jiang, Y.; Ge, T.; Wang, R. Performance simulation of a joint solid desiccant heat pump and variable refrigerant flow air conditioning system in EnergyPlus. Energy Build. 2013, 65, 220–230. [Google Scholar] [CrossRef]
- Blanco, D.L.; Nagano, K.; Morimoto, M. Experimental study on a monovalent inverter-driven water-to-water heat pump with a desuperheater for low energy houses. Appl. Therm. Eng. 2013, 50, 826–836. [Google Scholar] [CrossRef]
- Ji, L.; Pei, G.; Chow, T.T.; He, W.; Zhang, A.; Dong, J.; Yi, H. Performance of multi-functional domestic heat-pump system. Appl. Energy 2005, 80, 307–326. [Google Scholar] [CrossRef]
- Dai, Y.J.; Zhang, H.F. Numerical simulation and theoretical analysis of heat and mass transfer in a cross flow liquid desiccant air dehumidifier packed with honeycomb paper. Energy Convers. Manag. 2004, 45, 1343–1356. [Google Scholar] [CrossRef]
- Chung, T.W. Predictions of moisture removal efficiencies for packed-bed dehumidification systems. Gas Sep. Purif. 1994, 8, 265–268. [Google Scholar] [CrossRef]
- Sultan, G.I.; Hamed, A.M.; Sultan, A.A. The effect of inlet parameters on the performance of packed tower-regenerator. Renew. Energy 2002, 26, 271–283. [Google Scholar] [CrossRef]
- Longo, G.A.; Gasparella, A. Experimental and theoretical analysis of heat and mass transfer in a packed column dehumidifier/regenerator with liquid desiccant. Int. J. Heat Mass Transf. 2005, 48, 5240–5254. [Google Scholar] [CrossRef]
- Elsarrag, E. Performance study on a structured packed liquid desiccant regenerator. Sol. Energy 2006, 80, 1624–1631. [Google Scholar] [CrossRef]
- Dong, H.W.; Cho, H.J.; Park, J.Y.; Jeong, J.W. Optimum regeneration temperature of a desiccant solution in a packaged liquid desiccant-assisted air conditioning unit. Int. J. Refrig. 2019, 101, 155–166. [Google Scholar] [CrossRef]
- Beshkani, A.; Hosseini, R. Numerical modeling of rigid media evaporative cooler. Appl. Therm. Eng. 2006, 26, 636–643. [Google Scholar] [CrossRef]
- Conde, M.R. Properties of aqueous solutions of lithium and calcium chlorides: Formulations for use in air conditioning equipment design. Int. J. Therm. Sci. 2004, 43, 367–382. [Google Scholar] [CrossRef]
- Goswami, D.Y.; Fumo, N. Study of an aqueous lithium chloride desiccant system: Air dehumidification and desiccant regeneration. Sol. Energy 2002, 72, 351–361. [Google Scholar]
- American Society of Heating and Air-Conditioning Engineers Inc. American Society of Heating, ANSI/ASHRAE/IES Standard 90.1-2013 (SI Edition): Energy Standard for Buildings except Low-Rise Residential Buildings; American Society of Heating and Air-Conditioning Engineers Inc.: Atlanta, GA, USA, 2013; pp. 404–636. [Google Scholar] [CrossRef]
- Duffie, J.A.; Beckman, W.A. Solar Engineering of Thermal Processes; John Wiley & Sons: New York, NY, USA, 1991. [Google Scholar]
- Oppermann, R.H. Principles of Heating, Ventilating and Air Conditioning; ASHRAE: Atlanta, GA, USA, 1936. [Google Scholar] [CrossRef]
- Yao, Y.; Jiang, Y.; Deng, S.; Ma, Z. A study on the performance of the airside heat exchanger under frosting in an air source heat pump water heater/chiller unit. Int. J. Heat Mass Transf. 2004, 47, 3745–3756. [Google Scholar] [CrossRef]
- Jo, M.S.; Shin, J.H.; Kim, W.J.; Jeong, J.W. Energy-saving benefits of adiabatic humidification in the air conditioning systems of semiconductor cleanrooms. Energies 2017, 10, 1774. [Google Scholar] [CrossRef]
- AHRI Standard. Performance Rating of Commercial and Industrial Humidifiers; ANSI/AHRI Standard 640-2005; Air-Conditioning, Heating and Refrigeration Institute: Arlington, VA, USA, 2005. [Google Scholar]
- EnergyPlus. Engineering Reference; US Department of Energy: Washington, DC, USA, 2019; pp. 1–1741. Available online: https://energyplus.net/sites/all/modules/custom/nrel_custom/pdfs/pdfs_v9.2.0/EngineeringReference.pdf (accessed on 2 March 2021).
- Boranian, A.P. An Investigation of Optimal Control of Desiccant-Enhanced Evaporative Air Conditioning; University of Colorado: Boulder, CO, USA, 2012. [Google Scholar]
- Kozubal, E.; Woods, J.; Judkoff, R. Development and Analysis of Desiccant Enhanced Evaporative Air Conditioner Prototype; National Renewable Energy Lab.: Golden, CO, USA, 2012. [Google Scholar]
- Lim, H.; Jeong, J.W. Energy saving potential of thermoelectric modules integrated into liquid desiccant system for solution heating and cooling. Appl. Therm. Eng. 2018, 136, 49–62. [Google Scholar] [CrossRef]
- Regulations for the Operation of Building Energy Efficiency Rating System; Korea Energy Agency: Seoul, Korea, 2016; pp. 1–43.
- Samsung Ultrasonic Humidifier Product Specification. Available online: https://www.samsung.com/sec/small-appliances/humidifier-shu-m45bk/SHU-M45BK/ (accessed on 24 February 2021).
Publisher’s Note: MDPI stays neutral with regard to jurisdictional claims in published maps and institutional affiliations. |
© 2021 by the authors. Licensee MDPI, Basel, Switzerland. This article is an open access article distributed under the terms and conditions of the Creative Commons Attribution (CC BY) license (http://creativecommons.org/licenses/by/4.0/).