1. Introduction
The main measures of assessing traffic conditions at signal-controlled intersections include delays incurred by vehicle drivers and the queue lengths at the approach. In the oldest models, the delays and queue lengths were determined using the theory of mass service (also known as the queue theory). Queue theory models belong to the group of traffic micromodels and, like meso- and macromodels, they can be divided into deterministic and stochastic (with or without elements of randomness). The models of the mass service theory use the Kendall’s designation scheme, written as
A/B/m, where
A is the distribution of a random variable in the access process,
B is the distribution of a random variable according to which the service process takes place, and
m is the total number of positions for handling in the process [
1,
2,
3,
4]. The queuing process is stochastic, both for the time headways to the system and the times of service by the system [
3,
5,
6].
The idea of the modeling process of delays and the queues at signal-controlled intersections is presented in
Figure 1. As the process of servicing vehicles begins, the queue length begins to decrease. It can be concluded that the queue length is completely dependent on the number of arrivals at the approach. It should also be noted that in the cycle presented in
Figure 1, there is a period of free inflow of vehicles to the intersection approach while transmitting the effective green signal. In the existing models, the impact of this type of vehicles on the queue formed at the intersection approach is usually not taken into account.
The use of queue theory models to describe the road traffic process usually requires the introduction of certain simplifications resulting from an ambiguous interpretation of some phenomena that occur in road traffic along a road section or at an intersection. As an example, you can provide the process of arrivals for servicing in the system, e.g., vehicle access to the intersection. As the model does not represent the road section leading to the intersection approach, service is assumed to be at the stop line. This has its consequences in the access process, where the moments of access by vehicles are replaced by moments of theoretical arrivals at the approach [
1,
2,
3,
7,
8].
A certain drawback of mass service models, due to the very high randomness of the road traffic process on the street network, is their reference only to the so-called steady-state (queue in a stochastic equilibrium state), Both the IN and OUT process are constant over time, and therefore the parameters describing the distribution of random variables of these processes are constant. Hence, mass service models cannot be used to describe the road traffic process in situations of the high variability of traffic volumes, which often occur during peak periods in large- and medium-sized cities. Nevertheless, the most popular model that allows estimating the value of delays incurred by vehicle drivers and the average queue lengths at the intersections approach with signal controllers is the Webster model [
9]. This model and its subsequent updates [
10], until now constitute the canon of the methodology for estimating the capacity and measures for assessing traffic conditions at signal-controlled intersections. The undoubted disadvantage of these models was their use only when the intersection was loaded with traffic volumes not exceeding its capacity, which, however, did not have a significant impact on those years.
The development of models based on the queue theory was dealt with, inter alia, in [
11,
12,
13]. The mathematical functions used in these works were indirectly based on the method of estimating delays with the use of waiting queues. The subsequent evolution of mathematical models allowed these models to be classified into the group of time-dependent models. In this case, the technique of coordinate transformation was used concerning the delay curve derived for the steady-state [
4,
11,
14]. This modeling approach assumes that for small values of load levels for a given lane, in unsaturated traffic conditions, the queue length is approximately equal to the product of the constant intensity of reports and the time of arrival. On the other hand, in the conditions of high traffic load, i.e., in the conditions of saturated and oversaturated demand flow rate, the maximum back-of-queue can be approximated with the use of a linear model, which assumes proportionality to the analysis time and the amount of overload. The use of a coordinate transformation “shifts” the asymptotic of the estimated delay curve (queue length), from the equilibrium point between the inflow and outflow intensity (volume-to-capacity ratio
X = 1) for the steady-state towards the deterministic overload loss line. The algorithm of this solution was included, inter alia, in the works [
11,
15].
Further effects of work on the improvement time-dependent models of delays and queues are presented, inter alia, in the works [
16,
17,
18,
19,
20,
21,
22,
23,
24,
25,
26,
27,
28]. The result of this work was the penultimate significant update of the HCM guidelines [
29], considered one of the most reliable studies on road infrastructure design guidelines in the world. The mathematical model developed as part of this update for estimating the average delays and the average back-of-queues at signal-controlled intersections is still used in practice by most countries around the world. Only some countries have developed their calculation methods based on the guidelines presented in HCM.
The models for estimating the maximum queue length usually consist of two separate estimators:
the length of the queue formed during the red signal (kZ),
the length of the queue remaining after the end of green signal (kP).
It is worth emphasizing that from the aforementioned design guidelines, only the American HCM model from 2010 [
30] includes an estimator taking into account the condition of the queue from the period preceding the analysis period. This is the so-called initial queue (
k0). Other models do not have such an estimator in their formula or take this queue into account indirectly (e.g., in the HCM 2000 guidelines [
30] in the estimator of the remaining queue length).
Based on the analysis of the form of mathematical models concerning the queue length at signal-controlled intersections from Australia [
31,
32], Canada [
33], Germany [
34,
35], Poland [
36], Denmark, France, Ireland and Sweden, Great Britain [
10,
15] and USA [
29,
30,
37] the following conclusions were made:
calculations of the average back-of-queues for a given computational group of traffic lanes consist in determining the queue length that may form in the analyzed period of analysis in an average signaling cycle,
for the given initial conditions, the results of calculating the maximum queue lengths using various methods applied in the world do not differ significantly from each other (except for the Canadian [
33] and American [
29,
30,
37] methods),
most of the calculation models of the average queue length are based mainly on the simplified description of vehicle operation in the “system”, which takes place in the analyzed period of the analysis, without taking into account the earlier periods and significant fluctuations in the value of the inflow intensity in short periods (equal to or less than 15 min); the only exception are US models [
29,
30,
37]; however, the specificity of the process of forming the queue of vehicles by such maneuvers as starting, stopping and moving in a column of vehicles during the signaling cycle is not taken into account at all, which may affect the length of the maximum queue in a completely different way than in the case of data only about demand and supply (traffic volume/arrival flow rate/of vehicles moving to the intersection approach and the capacity/saturation flow rate/of the computational group of lanes),
the existing calculation methods do not take into account with sufficient accuracy the process of shifting vehicle queues between individual signaling cycles and their accumulation, which is of significant importance, in particular, for cases of saturation or oversaturation traffic for a long time; hence, in this respect—to the best of the authors’ knowledge—none of the analyzed guidelines for calculating traffic conditions at traffic light intersections do not include a sufficiently precise method for calculating the initial lengths of vehicle queues [
38,
39,
40],
the calculation models do not take into account the phenomenon of interaction between vehicle streams of different computational groups of traffic lanes (operated at the same or different times) before intersection approach, which has a significant impact on the actual degree of traffic load for individual lanes (so-called: volume-to-capacity ratio).
The article presents a model that allows for the estimation of the maximum back-of-queues at signal-controlled intersections in a single cycle. This model takes into account the most important traffic characteristics of vehicles forming the queue. For this purpose, the process of starting vehicles in the maximum queue in the states of saturation and oversaturation with the traffic of the signal-controlled intersection approach was subjected to a detailed analysis. The conducted analyzes allowed for the conclusion that the intensity of starting has a direct impact on the final result of the process of forming the maximum queue range, taking into account the remaining queue lengths and the initial queue lengths.
The article consists of seven sections. After the introduction, the second section presents a literature review on the subject in the field of modeling the queue length at the signal-controlled intersections. The third section defines in detail the subject of research, the testing ground, and the measurement method used, which by definition had to enable the simultaneous measurement of all phases of the vehicle queue formation, synchronized with all traffic light signals in individual signaling cycles. The next, fourth section presents the analysis of the research results. Section five presents the developed model of the maximum back-of-queue at the signal-controlled intersection approach. In turn, the verification and calibration of the proposed model is presented in section six. The paper ends with the discussion and conclusions section.
2. Literature Review
The problem of modeling the back-of-queue size at signal-controlled intersections is mainly related to the improvement of calculation methods and their adaptation to the needs of adaptive traffic control at city intersections. Models used to estimate the queue lengths are most often developed based on the following mathematical formulas:
Markov chain—used, among others in Alfa [
41], Chen et al. [
42], Viti et al. [
43],
time series methods—used, among others in Gasz [
44],
fuzzy logic—used, among others in Shou et al. [
45], Kafash et al. [
46], Musci et al. [
47],
probability distribution—used, among others in von Zuylen et al. [
48], Viti et al. [
49],
shockwave analysis—used, among others in Cao et al. [
50], Ng et al. [
51],
cell transmission model—used, among others in Srivastawa et al. [
52].
The mathematical models are often theoretical and suitable for practical implementation as part of the traffic control program algorithm using signal heads. So far, a significant group of works has been devoted to researching the process of forming queues of vehicles at the approach of insulated signal-controlled intersections, e.g., Hao et al. [
53], Anokye et al. [
54], as well as elements of main streets in the city, e.g., Bie et al. [
55] and Fu et al. [
56]. A frequently discussed research issue is also the search for a more precise than before method of traffic control using adaptive light signaling, e.g., Kafash et al. [
46], Viti et al. [
57], Yu et al. [
58] or network analyses, dealing with the problem of selection of the optimal vehicle speed trajectory on a signalized arterial with consideration of vehicle queue, e.g., He et al. [
59], Zhang et al. [
60], Cao et al. [
61], Zhao et al. [
62] as well as works on microscopic simulation for signal-controlled intersections, e.g., Naghawi et al. [
63], Ma et al. [
64], or Li et al. [
65].
Verifications of models used to estimate the queue length at signal-controlled intersections together with proposals for updates are presented, among others in the works of Anantharam [
66], Chaudhry et al. [
67], Szczuraszek et al. [
39], and Viti [
68]. Often, models of the queue lengths at intersections with signal controllers are a component of complex virtual reality models of the simulated road traffic process, e.g., Liu et al. [
69], Xu et al. [
70] and Vigos et al. [
71].
Nowadays, the emerging advanced intelligent transportation systems, such as connected vehicles and cooperative vehicle-to-infrastructure systems, attract much research attentions. Scientific descriptions on the improvement of automated driving systems and the dynamic development of autonomous vehicle technology have resulted in the need to research the impact of autonomous vehicles on the process of queuing at signal-controlled intersections. In this group of works, we can distinguish works in the field of microscopic analyzes taking into account key operational parameters like vehicles speed, acceleration, inter-vehicle headway, and key performance metrics like degrees of load and delay, e.g., Le Vine et al. [
72], Ramezani et al. [
73], Yang et al. [
74]. One can also distinguish works on macroscopic analyses aimed at optimizing the speed of connected autonomous vehicles and coordinating traffic light programs in transport networks by minimizing the queue lengths at intersections with signal controls, e.g., Wang et al. [
75], Kong et al. [
76], Iwasaki [
77] and Liu et al. [
78].
Moreover, in order to improving traffic control at intersections, it is necessary to have a reliable information collection system and apply modern effective methods of processing the collected information. Remote sensing tools are an effective way to detect vehicles and traffic conditions on the transport network. Digital camera images it is well suited to derive various traffic parameters such as average vehicle speed, vehicle density, beginning and end of congestion, length of congestion or for other traffic monitoring applications e.g., Anusha et al. [
79,
80], or Cai et al. [
81]. This method is based on the vehicle detection on the road segment by change detection between two images with a short time lag, the usage of a priori information such as road data base, vehicle sizes and road parameters and a simple linear traffic model based on the spacing between vehicles. The studies are also used standalone video processing algorithms and based on this information is stored in databases, for example, trajectories of traffic streams of vehicles, lengths of queues of vehicles, etc. Data from passive remote sensing methods were used to describe the process of forming queues of vehicles at signal-controlled intersections, e.g., in the works of Cetin et al. [
82], Chang et al. [
83], Hao et al. [
84], Mukhopadhyay et al. [
85], Iwanowicz et al. [
86], while the data from active remote sensing methods were used e.g., in the works of Liu et al. [
87], Milla et al. [
88], Khan et al. [
89], Sun et al. [
90], and Xie et al. [
91]. Most often, the result of these works were proposals for the methodology of testing road traffic characteristics or proposals for improving the existing methods of estimating traffic conditions at signal-controlled intersections or improving traffic control programs.
In recent years, light unmanned aerial vehicles have also been willingly used to collect data on vehicle queues at traffic light intersections, e.g., Zhou et al. [
92], Wan et al. [
93] or Salvo et al. [
94].
3. Materials and Methods
3.1. Subject of Study and Testing Ground
The subject of the research was the process of forming queues of vehicles on a single traffic lane of the intersection approach with signal controllers. The examination of this process must take place both at the approach and before the approach of a given intersection, along the longest formed queue reach, so that it is possible to fully observe the individual phases of the queue forming and discharging process in time. This means that the tests should be conducted to select signal-controlled intersections, on which the section of the road leading to the approach has a relatively large accumulation zone of vehicles, undisturbed by access points, i.e., additional traffic inflows and outlets (intersections without traffic controllers), parkings or bus stops and of course crossing for pedestrians or cyclists.
The traffic lane at the approach of the signal-controlled intersection was adopted as the model section for the tests, which is devoid of additional side on and off streets (switches), on which vehicles of the same route through the intersection are accumulated, having the same sequence of transmitted traffic light signals. The service of vehicles for all lanes at the approach is collision-free. Only under such conditions is it possible to obtain an undisturbed system of both inflow and outflow of the vehicle stream and it will be possible to observe the actual changes formed in particular phases of vehicle queues in time. An example of a measuring section adopted as a reference section for conducting research is shown in
Figure 2.
The testing ground consisted of a total of 20 signal-controlled intersections located in cities in Poland with a large (>0.50 million inhabitants) or average population (0.20 ÷ 0.50 million inhabitants). The test grounds were located in cities such as Bydgoszcz (TGa1 ÷ TGa8, TGb1 ÷ TGb8), Torun (TGb9, TGb10) and Warsaw (TGb11, TGb12). The collected data was divided into two groups. Based on the data from 12 test sites, a model was developed to calculate the numerical values of the maximum range of back-of-queue (TGb1 ÷ TGb12). However, this model was verified on the basis of data from 8 research polygons (TGa1 ÷ TGa8). On these proving grounds, only the throught movements were analyzed. The traffic control parameters did not change during the measurements, i.e., the traffic at the intersections was controlled by means of fixed-time signaling. Measurements were carried out in 2014–2019.
The research covered the following features of the process of forming queues of vehicles at intersections with signal controllers in relation to a single signaling cycle as well as the features of the traffic streams flow:
arrival (demand) flow rate,
departure flow rate,
starting-up flow rate of vehicles from the maximum queue,,
stopping flow rate of vehicles from the remaining (initial) queue,
and:
the fact of the formed range of the maximum back-of-queue in a given signaling cycle,
generic groups of vehicles of a given traffic stream (arrival, departue, starting, stopping).
The collected research material also made it possible to determine the basic characteristics of the traffic signal program (start and change times of individual signals of the analyzed period). During the processing of the collected research material, the starting maneuvers that took place during the transmission of the green signal were also clearly distinguished from those that were performed after the commencement of transmitting the red signal in the next cycle.
Measurements were carried out in weather conditions favorable to traffic (no precipitation, good visibility). The sample sizes for the analyzes were selected from the Lapunov formula assuming a significance level of
α = 0.05.
Table 1 presents the characteristics of the most important features of the studied intersection approaches and the collected data. In further analyzes, data on only the group of passenger cars was used, without taking into account the characteristics of other generic groups of vehicles (e.g., starting-up or slowing down in the queues of heavy vehicles and buses), i.e., type structure of vehicles [
96,
97]. The number of vehicles in the queues takes into account all vehicle types.
3.2. Measurement Method
The basic condition for selecting the measurement method was to ensure that all phases of the vehicle queue formation process were measured simultaneously, synchronized precisely with all traffic light signals in individual signaling cycles. Moreover, the observations of the road traffic process had to take place practically simultaneously along the entire length of the interstitial section between the established cross-section of the inflow and outflow.
The characteristics of traffic signal programs and traffic characteristics were tested with the use of digital cameras, which are classified as passive remote sensing tools. This test method is characterized by very high measurement accuracy. Moreover, this method is often used to study road traffic characteristics at various intersections, including signal-controlled intersections [
98]. The measurements were performed with first-generation YI Action digital cameras, which enable recording images in Full HD 1920 × 1080 px resolution with a recording speed of at least 24 fps. This resolution is sufficient to scale the video image and add or arrange additional graphics on it. These cameras are connected via a Wi-Fi network, enabling observe the image recorded by them, e.g., on the screen of a smartphone or tablet. For 24-h continuous measurement, it was necessary to equip the camera with an external battery with a capacity of 20,000 mAh with lithium-ion cells (so-called power-bank).
At all test sites, digital cameras were installed on streetlights at a height of 5.5 ÷ 7.5 m above the level of traffic lanes so that the image recorded with their help captures as wide a fragment of the road section as possible (
Figure 3). Such a location of digital cameras ensured good visibility of each vehicle and the spaces between them (the vehicle was not obstructed by the bodies of larger vehicles). For such a height, it was established that the distance between the cameras should be within 40 ÷ 60 m from each other, due to the need to overlay the images of frames from subsequent cameras. In most cases, this distance is the distance between two or three consecutive street lamps. The first of the cameras was installed as close as possible to the stop line cross-section. That was possible to correctly read the sequence changes of the traffic signal times.
After the measurements, the collected video material was compiled from film frames from individual cameras into one main image. Thus, it was possible to observe the flow of the vehicle streams along the entire research section, recorded on the frames from individual cameras using one monitor. The collected measurement material was processed using the DVideo Player. Details of the measurement method were developed in [
86].
4. Model of the Maximum Back-of-Queue
The following definitions were adopted to characterize the model of the process of forming queues at intersection approach with signal controllers:
The queue at the signal-controlled intersection approach on a single lane is a stream of vehicles made up of vehicles arriving at the intersection, constituting a compact column of vehicles in the impact space of this intersection, waiting to be able to pass through the intersection (service). In the queue, vehicles may be:
- ◯
stopped—this applies to vehicles which, due to conditioned by red signal duration on a signal heads, have stopped and their drivers are waiting for the possibility of passing in green signal duration,
- ◯
partially in motion, (crawl speed)—this applies to vehicles moving at a very low speed (≤8 km/h [
37]) because they attach a standing column of vehicles in front of the intersection approach or they are vehicles whose drivers alternately start and stop maneuvers due to the oversaturation of the queue (only a change of position in the queue without departure from the intersection after starting-up maneuver),
- ◯
in motion—this applies to vehicles whose drivers have starting-up maneuvered to leave the intersection at the green signal duration, but are still in the intersection approach area (not serviced yet); this also applies to those vehicles which have failed to leave the intersection approach during the green signal interval and which are moving towards the approach after the red signal has started in order to come to a closer position in front of intersection in the queue than before starting-up maneuver.
A vehicle in the queue is understood as the one that reaches the intersection and leaves it with a delays resulting from the process of servicing vehicles controlled by signal heads. Thus, it is a vehicle that forms a stopped queue or is only under the influence of the queue formed at the intersection approach (losing speed). A vehicle that crosses the intersection on the green signal duration without being influenced by the queue of vehicles (undisturbed flow) is not a queue-forming vehicle,
Back-of-queue length—k—means the actual number of vehicles in the queue at the intersection approach on a single lane [Veh.], [m],
Back-of-queue range (size)—K—means the hypothetical length of the queue, measured by the hypothetical number of vehicles between the stop line at the intersection approach and the last stopped vehicle in the queue on a single lane [Veh.], [m],
Maximum back-of-queue range (“maximum queue”)—KM—means the highest theoretical number of stopped vehicles that would line up in the lane from the stop line to the last stopped vehicle in the queue on a given signaling cycle and on a single lane. The maximum queue most often occurs after the start of the green signal duration. The number of vehicles in the maximum queue is a theoretical value due to the dispersion (inertia) of vehicles from the beginning of the queue that performs the starting-up maneuver after a green signal duration, while the vehicles from the end of the queue have not yet performed this maneuver (and can even only join the queue as a arrivals in back-of-queue interaction). Hence, the range of the queue takes up a space composed of hypothetically stopped vehicles [Veh.], [m].
The geometric dependencies of the physical process of forming the maximum queue at the signal-controlled intersection approach are shown schematically in
Figure 4.
The meaning of the notations used in the description of the process of the volatility of the back-queue size in time and the formation of the maximum back-queue size in a given signaling cycle
i and also used on the
Figure 4 have been presented in
Table 2.
The maximum queue can be also formed when the duration of the next interval (red or green effective signal time in i + 1 cycle), and even in subsequent cycles. In this most likely scenario, the maximum queue size will be formed at the crossing of the two functions below:
starting-up of the stopped vehicles in the queue at the intersection approach after the effective green time began,
arriving of the inflow vehicles taking into account the initial queue length at the intersection approach.
The assumption is that the course of these functions is approximately linear i.e., there are constant time headways between vehicles in both of these processes. Hence, to obtain the crossing of these two functions, one should solve the following system of equations:
Taking the above into account, we obtain a dependence that allows determining the maximum queue formation time
tx,i:
In Equation (2), two components were obtained. The first represents the extension of the maximum queue formation time due to the presence of the initial queue k0. The second component of Equation (2) represents the maximum queue formation time in a given signaling cycle i. In this second component, the queue consists only of vehicles arriving at the intersection approach during the analyzed signaling cycle.
Assuming the following variable designations:
Equation (2) can be written as follows:
Therefore, the maximum back-of-queue size on the cycle
i will be equal:
However, assuming the following variable designations:
where:
ci—lane capacity on the cycle
i, [Veh./s], hence the final form of the model takes the form:
Unlike the existing models, the proposed model of the maximum queue at the signal-controlled intersection approach in a given lane in the i-th signaling cycle (10), additionally takes into account:
To define a model that allows for the determination of numerical values of the initial queue length for the
i-th cycle, which is the remaining queue length for the
i − 1 cycle, the geometric dependencies of this process were used, presented in
Figure 5 (where all variables are as previously defined). Taking into account the data presented on
Figure 5, can be written:
and because of:
the form of the model can be determined:
Although it contains some common features and identical variables, the proposed model (14) allows for the determination of numerical values of the initial queue length for the
i-th cycle, is a completely different estimate of the remaining queue length compared to the models that can be found in various existing design guidelines (models based on of work [
11,
15]). A similar mathematical formula to the model (14) can be found in [
29]. It is used to determine the initial queue length for a given analysis period (0.25 h or 1.00 h), indirectly used in the calculation of the remaining queue length and the volume of lane group inflow rate.
5. Field Survey Data Analysis
The collected data made it possible to carry out detailed statistical analyzes of the processes taking place at signal-controlled intersections, including in particular the process of starting vehicles in the maximum queue, which hypothetically determines the final range of the queue in a given signaling cycle. The analyzes used the values of the time headways on the lanes at the signal-controlled intersections in the appropriate signaling cycles. In the analyzes, using the 95% confidence interval, statistically uncertain results i.e., gross errors. Additionally, to confirm the validity of rejection of gross errors, the D. Dixon test was performed, assuming the significance level
α = 0.05, which also allowed to identify of outliers in the sample. In the end, 2.5% of the shortest and 2.5% of the longest intervals between vehicles in the approach queue were rejected. In total, 1791 signaling cycles were used to build the model, in which 18,377 vehicles reported for service at the intersection approach. These vehicles performed a total of 24,641 starting maneuvers in the given signaling cycles. From
Figure 6,
Figure 7 and
Figure 8, selected examples of the raw results of the research on the process of forming queues of vehicles at the signal-controlled intersections approach are presented.
The average values of cumulative time intervals of the stream of vehicles starting from the maximum queue after the start of transmitting a green signal were analyzed (
Figure 9). During the analysis of the research results, it was found that the intensity of starting may depend on the level of service at the green signal duration. In connection with the above, it was checked whether there is a correlation between the average values of the starting-up flow rate during green signal and the average values of the maximum departure flow rate (and so saturation flow rate) in the given traffic lanes (
Figure 10).
The analysis of the dependence of the average values of the starting-up flow rate from the maximum back-of-queue in green signal duration as a function of the average values of the maximum departure flow rate in the given lanes was performed for the state of saturation and oversaturation traffic conditions using the least-squares method. Due to the small share of heavy vehicles in a modal split in cities, the analysis did not take into account the impact of these types of vehicles. The time headways analysis of the starting process concerned only passenger cars.
The form of the linear regression function was established without the intercept, which corresponds to the situation where no vehicles are departing from the queue, both in real traffic conditions and in the conducted analyzes. As a result of the analysis, the following model describing the average value of the intensity of starting-up vehicles from the queue was obtained:
where:
—average value of starting-up flow rate [Veh./s] and
—average value of maximum departure flow rate during green signal in saturated and oversaturated traffic condition at intersection approach [Veh./s].
The results of the regression and correlation analysis confirm the existence of a relationship between the average value of the intensity of starting vehicles from the maximum queue and the average maximum value of the outflow intensity during green signal interval. This relationship is reflected in reality and represents the behavior of vehicle drivers. Each progressive vehicle from the queue takes part in the stream of maximum outflow, i.e., in the conditions of the so-called saturation flow rate. Even if the driver is unable to perceive the displayed signal on the signalization e.g., due to its distant position in the queue or the possible obstruction of the field of view by a vehicle of larger dimensions, when performing a starting-up maneuver, it does so under the influence of the vehicle in front of it. It is related to the behavior of drivers in line with the model of the so-called “Driving behind the leader”. In the case under consideration, the analysis of vehicles starting-up from a stopped queue, the vehicle in front of it which has already performed such a maneuver. From
Figure 9 it can be seen that the approximation of the starting-up flow rate function can be applied by a simple linear model. However, a slight decrease in this intensity is noticeable along with the increase in the number of vehicles in a queue (after about 20–25 position).
6. Model Verification
The proposed model of the maximum queue size at signal-controlled intersection approach on a given lane has been verified. The verification of the model consisted of a comparative analysis of the empirical values of the maximum back-of-queue size (
KM,i(emp)) with the theoretical values (
KM,i) determined based on the model (10). The verification was carried out on data obtained from remote sensing of the process of forming queues of vehicles at eight signal-controlled intersections. Comparative analyzes were performed for two states of traffic conditions at the intersection approach, i.e., in unsaturated inflow (ie when the volume-to-capacity ratio
X did not exceed one) and in saturated or oversaturated inflow, when remaining queues formed at the approach (ie when the volume-to-capacity ratio
X was equal to or greater than one) and jointly for both states. In total, 1406 signaling cycles were verified, including 655 in unsaturated traffic conditions and 751 in saturated or oversaturated traffic conditions occurring at intersection approach. The values of errors in estimating the maximum back-of-queues are presented in
Table 3.
The results of the regression analysis for the maximum back-of-queue, determined basis of the proposed model, and empirical data are in
Figure 11. The mean value of the starting-up flow rate determined from model (15) was used for each
i-th signaling cycle. To fully reflect the process of back-of-queue formation at the signal-controlled intersection approach, the linear regression equation was determined without the expression of an intercept function, which corresponds to the situation that there is no maximum queue in reality and the theoretical maximum queue in the calculations.
At a later stage of the analysis, an error distribution graph was made (
Figure 12). Ideally, the relative error values should be distributed around the mean value of the Gaussian curve. Thus, the errors should compensate each other.
Using the χ2 Pearson test (assuming the significance level α = 0.05), the proportion of the error distribution with the normal distribution was tested. Statistical compliance tests showed a positive result in all analyzed cases. It was also found that the values of the maximum queue, calculated using the proposed model, are in most cases slightly lower than the empirical values. Based on the analysis of the causes, it was found that the lower values of the maximum queue size, calculated with the variables of the model, are not affected by the traffic signals control parameters, the initial queue length, or the value of the starting-up intensity.
The values of the maximum back-of-queue size at signal-controlled intersection approach determined by the model were corrected by applying the appropriate coefficient expressing the increase in the empirical value of the maximum queues compared to the value determined based on the model. The primary value for determining the correction coefficient was the maximum back-of-queue size at the signal-controlled intersection approach in the ideal road-traffic conditions. Hence, the correction factor
fk was determined as the quotient of the empirical maximum queue size to the value calculated using the model:
where:
fk—correction factor after model verification [−] and
KM,i(emp)—empirical value of the maximum back-of-queue size [Veh.].
The value of correction factor
fk was calculated as
fk = 1.08 [−]. Hence, the value of the maximum back-of-queue at signal-controlled intersection approach on a given lane was finally determined from the relationship:
The accuracy of the model was analyzed again for that corrected model. In
Table 4, the values of errors in estimating the maximum queues after model calibration are presented. In
Figure 13, the results of linear regression analysis for the maximum back-of-queue size at signal-controlled intersection approach are presented, determined based on the corrected model and empirical data. As a result of regression and correlation analysis, high values of the correlation coefficient (
R = 0.877) and determination (
R2 = 0.769) were obtained. The obtained value of the correlation coefficient shows a strong relationship between the values estimated based on the model presented in the article and those observed in reality. This is also confirmed by a regression coefficient equal to one.
The distribution of errors in estimating the maximum back-of-queue size at signal-controlled intersection approach using a calibrated model is presented on the
Figure 14.
Based on the obtained results, it can be concluded that in most cases the relative error is less than 10%. The low values of these errors prove that the maximum queue size at signal-controlled intersection approach, estimated by the calibrated model, is very consistent with the empirical results. An additional part that ensured the most accurate mapping of traffic at signal-controlled intersections was performed with passive remote sensing tools, such as digital cameras, which significantly increased the accuracy of recording and understanding the measured values. The compliance of the error distribution with the normal distribution was re-examined using the χ2 Pearson test (assuming the significance level α = 0.05). As before, statistical compliance tests showed a positive result in all analyzed cases. After the model calibration, the values of the χ2 test statistic had lower values than the values previously. That proves the improvement of the quality of the model fit to empirical data. Also, the descriptive parameters of the error distribution, such as the mean and standard deviation, assume lower values in each case.
The results obtained from the verification prove the high compliance of the constructed model with the real road and traffic conditions at the signal-controlled intersections located in urban areas. It confirms a satisfactory level of model accuracy. The obtained compliance proves the possibility of using the model for practical applications in the calculation of the maximum back-of-queue size at signal-controlled intersection approach.
7. Discussion and Conclusions
The accuracy of estimating the maximum queue sizes at signal-controlled intersection approach with the proposed model in the article proves its good adjustment to the empirical values. It is confirmed by both the high value of the coefficient of determination ~0.8 and the relatively small errors in calculations, amounting to ~4 vehicles per signaling cycle. The use of digital cameras in measurements probably contributed to the construction of a model that allows estimating the maximum back-of-queue size at signal-controlled intersections with high accuracy, which ensured high accuracy of the research, including in particular measurements parameters of the process of the starting-up flow rate of vehicles stopped in the queue. The arrangement of cameras on the sections of the intersection approach made it possible to study the analyzed process along the entire section of the road, which was influenced by increasing and decreasing the queue size. The analysis presented in the article concerned the so far unrecognized from the mathematical point of view of the process of starting progressive vehicles stopped in the queue at the intersection approach in a given lane.
At a further stage of work on calculations of the maximum queue sizes at signal-controlled intersection approach, the authors plan to take into account the influence of subsequent factors on the course of the maximum queue formation process, as well as to characterize the course of this process during a single cycle and a given analysis period, e.g., 15 min. Moreover, further work will also concern the study of the configuration and form of functions describing the relationships between the variables, i.e., the headways between vehicles in streams of arriving, departure, starting-up of the maximum queue, and stopping of the remaining (initial) queue. The analysis performed so far is based on averaged values of both the intensity of starting-up and saturation flow rate after starting the effective green time.
It is also recognized that this model may be useful for adaptive control at intersections approach, which uses a green signal length adjustment in its traffic control algorithms. It may be based on the prediction of road traffic characteristics in short time horizons (e.g., 5–15 min), using the maximum back-of-queue size forecast for this purpose. Despite a much smaller share of heavy vehicles in a modal split in urban traffic than commuter traffic, conduct further detailed work in this area and taking into account the influence of heavy vehicles and buses on the course of the analyzed queue formation process is also planned.
The results of the estimation are considered promising, despite the above-mentioned simplifications applied at the stage of model construction. In particular, that is in the case of the worst traffic conditions at urban streets, i.e., conditions of oversaturated vehicle flow rates. Thence, the presented model can be the basis for further analysis. The purpose of these analyzes will be a develop more precise relationships characterizing the process of formation the back-of-queue size at signal-controlled intersections.
Author Contributions
Conceptualization, D.I. and E.M.; methodology, D.I. and E.M.; software, D.I.; validation, D.I. and E.M.; formal analysis, E.M.; investigation, D.I.; resources, D.I. and E.M.; data curation, D.I.; writing—original draft preparation, D.I. and E.M; writing—review and editing, E.M.; visualization, D.I.; supervision, E.M.; project administration, E.M.; funding acquisition, E.M. All authors have read and agreed to the published version of the manuscript.
Funding
This research received no external funding.
Institutional Review Board Statement
Not applicable.
Informed Consent Statement
Not applicable.
Data Availability Statement
Not applicable.
Acknowledgments
Authors would like to thank you very much the late Professor Tomasz Szczuraszek, founder and long term Head of the Department of Road Engineering and Transport at the University of Technology and Life Sciences in Bydgoszcz, for valuable substantive advice and thorough scientific care, which allowed to explore the topic of the process of forming queues of vehicles at the signal-controlled intersections. Honor His memory.
Conflicts of Interest
The authors declare no conflict of interest.
References
- Drew, D.R. Traffic Flow Theory & Control; Series in Transportation; McGRAW-HILL: New York, NY, USA, 1968. [Google Scholar]
- Homburger, W.S.; Hall, J.W.; Loutzenheiser, R.C.; Reilly, W.R. Fundamentals of Traffic Engineering, 14th ed.; University of California: Berkeley, CA, USA, 1996. [Google Scholar]
- Newell, G.F. Application of Queuing Theory, 2nd ed.; Chapman and Hall: London, UK, 1982. [Google Scholar]
- Rouphail, N.; Tarko, A.; Li, J. Traffic flow at signalized intersections (Chapter 9). In Revised Monograph on Traffic Flow Theory; original publication: Special Report 165: “Traffic Flow Theory”, published in 1975; Federal Highway Administration Research and Technology: Washington, DC, USA, 1992. [Google Scholar]
- Mathew, T.V. Transportation Systems Engineering. Lecture Notes (Online Reading); Indian Institute of Technology Bombay: Maharashtra, India, 8 March 2017; Available online: https://www.civil.iitb.ac.in/tvm/1100_LnTse/ceTseLn/ceTseLn.html (accessed on 30 September 2018).
- Szczuraszek, T.; Macioszek, E. Analysis of time intervals distribution between vehicles on the roadway around central island of small roundabouts. Drog. Mosty 2010, 9, 87–99. [Google Scholar]
- Macioszek, E. Changes in Values of Traffic Volume—Case Study Based on General Traffic Measurements in Opolskie Voivodeship (Poland). In Directions of Development of Transport Networks and Traffic Engineering; Macioszek, E., Sierpiński, G., Eds.; Springer International Publishing: Cham, Switzerland, 2019; Volume 51, pp. 66–76. [Google Scholar]
- Macioszek, E. Analysis of driver behaviour at roundabouts in Tokyo and the Tokyo surroundings. In Modern Traffic Engineering in the System Approach to the Development of Traffic Networks; Macioszek, E., Sierpiński, G., Eds.; Springer International Publishing: Cham, Switzerland, 2020; Volume 1083, pp. 216–227. [Google Scholar]
- Webster, F.V. Traffic Signal. Settings; Road Research Technical paper No 39; Department of Scientific and Industrial Research: New Delhi, India, 1958. Available online: https://www.sinaldetransito.com.br/artigos/traffic_signals_webster.pdf (accessed on 21 November 2017).
- Webster, F.V.; Cobbe, B.M. Traffic Signals; Road Research Technical paper No 56; Road Research Laboratory: London, UK; H.M.S.O.: London, UK, 1966. [Google Scholar]
- Kimber, R.M.; Hollis, E.M. Traffic Queues and Delays at Road Jucttions; TRRL Report. LR 909; Transport and Road Research Laboratory (TRRL): Wokingham, UK, 1979. [Google Scholar]
- Miller, A.J. Settings for fixed-cycle traffic signals. Oper. Res. Q. 1963, 14. [Google Scholar] [CrossRef]
- Newell, G.F. Approximation methods for queues with application to the fixed-cycle traffic light. SIAM Rev. 1965, 7, 223–240. [Google Scholar] [CrossRef]
- Van Zuylen, H.J.; Taale, H. Dynamic and Stochastic Aspects of Queues at Signal Controlled Intersections. Available online: https://citeseerx.ist.psu.edu/viewdoc/download?doi=10.1.1.541.7437&rep=rep1&type=pdf (accessed on 20 November 2018).
- Kimber, R.M.; Daly, P.; Barton, J.; Giokas, C. Predicting time-dependent distributions of queues and delays for road traffic at roundabouts and priority junctions. J. Oper. Res. Soc. 1986, 37. [Google Scholar] [CrossRef]
- Akçelik, R.; Besley, M. Microsimulation and Analytical Methods for Modelling Urban Traffic; Conference papers from Advance Modeling Techniques and Quality of Service in Highway Capacity Analysis; Sidra Solutions: Truckee, CA, USA, 2001. [Google Scholar]
- Akçelik, R.; Besley, M. Queue discharge flow and speed models for signalized intersections. In Proceedings of the 15th International Symposium on Transportation and Traffic Theory, Adelaide, Australia, 16–18 July 2002. [Google Scholar]
- Akçelik, R.; Rouphail, N.M. Overflow queues and delays with random and platooned arrivals at signalized intersections. J. Adv. Transp. 1994, 28, 227–251. [Google Scholar] [CrossRef]
- Akçelik, R. Progression factor for queue length and other queue-related statistics. Transp. Res. 1996. [Google Scholar] [CrossRef]
- Akçelik, R. Progression Factors in the HCM 2000 Queue and Delay Models for Traffic Signals; Technical note; Akcelik and Associates Pty Ltd.: Greythorn, Australia, 2001. [Google Scholar]
- Akçelik, R. Stops at traffic signals. In Proceedings of the 10th ARRB Conference, Sydney, Australia, 25–29 August 1980; Volume 10. [Google Scholar]
- Akçelik, R. The Highway Capacity Manual delay formula for signalised intersections. ITE J. 1988, 56, 23–27. [Google Scholar]
- Akçelik, R. Time-Depent Expressions for Delay, Stops Rate and Queue Length at Traffic Signals; Internal Report AIR 367-1; Australian Road Research Board: Port Melbourne, Australia, 1980. [Google Scholar]
- Olszewski, P. Modelling of queue probability distribution at traffic signals. In Proceedings of the 11th International Symposium on Transportation and Traffic Theory, Yokohama, Japan, 18–20 July 1990. [Google Scholar]
- Olszewski, P. Modelling probability distribution of delay at signalized intersections. J. Adv. Transp. 1994, 28. [Google Scholar] [CrossRef]
- Olszewski, P. Overall delay, stopped delay, and stops at signalized intersections. J. Transp. Eng. 1993, 119. [Google Scholar] [CrossRef]
- Wu, N. Estimation of queue lengths and their percentiles at signalized intersections. In Proceedings of the Third International Symposium on Algorithmic Number Theory; Springer: Berlin/Heidelberg, Germany, 1998. [Google Scholar]
- Wu, N. Wartezeit und Leistungsfähigkeit von Lichtsignalanlagen unter Berücksichtigung von Instationarität und Teilgebundenheit des Verkehrs. Ph.D. Thesis, Schriftenreihe des Lehrstuhls. für Verkehrswesen der Ruhr-Universität Bochum, Bochum, Germany, 1990. [Google Scholar]
- Highway Capacity Manual 2000 (HCM 2000); Transportation Research Board: Washington, DC, USA, 2000.
- Highway Capacity Manual 2010 (HCM 2010); Transportation Research Board: Washington, DC, USA, 2010.
- Akçelik, R. Traffic Signals: Capacity and Timing Analysis; 7th reprint; Australian Road Research Board: Port Melbourne, Australia, 1998. [Google Scholar]
- Guide to Traffic Management Part 3: Traffic Studies and Analysis; Austroads: Sydney, Australia, 2020.
- Canadian Capacity Guide for Signalized Intersections, 3rd ed.; The Institute of Transportation Engineers: Washington, DC, USA, 2008.
- Handbuch für die Bemessung von Straßenverkehrsanlagen (HBS); Forschungsgesellschaft für Straßen- und Verkehrswesen e. V.: Berlin, Germany, 2001.
- Handbuch für die Bemessung von Straßenverkehrsanlagen (HBS 2015); Forschungsgesellschaft für Straßen- und Verkehrswesen e. V.: Berlin, Germany, 2015.
- Tracz, M.; Chodur, J.; Gaca, S.; Gondek, S.; Kieć, M.; Ostrowski, K. Metoda Obliczania PrzepustowośCI SkrzyżOwań Z Sygnalizacją śWietlną; Generalna Dyrekcja Dróg Krajowych i Autostrad: Krakow, Poland, 2004. [Google Scholar]
- Highway Capacity Manual 2016, Sixth Edition: A Guide for Multimodal Mobility Analysis (HCM 2016); Transportation Research Board: Washington, DC, USA, 2016.
- Iwanowicz, D.; Szczuraszek, T. Dylematy przy ustalaniu stanu przesycenia ruchem wlotów skrzyżowań z sygnalizacją świetlną. Czas. Inż. Lądowej Śr. Architekt. 2016, 63. [Google Scholar] [CrossRef]
- Szczuraszek, T.; Iwanowicz, D. The impact of the analysis period on the estimation accurary of queue lengths at intersection inlets with traffic lights. In Recent Advances in Traffic Engineering for Transport Networks and Systems; Lecture Notes in Networks and Systems; Macioszek, E., Sierpiński, G., Eds.; Springer International Publishing: Berlin/Heidelberg, Germany, 2018; Volume 21. [Google Scholar]
- Iwanowicz, D. Assessment of Selected Methods of Estimating the Maximum Queue Length in Intersection Inlets with Traffic Lights. In 66. Scientific Conference Krynica-Zdrój. Poland. 2020; (publication under review). [Google Scholar]
- Alfa, A.S. Modelling traffic queues at a signalized intersection with vehicle-actuated control and marcovian arrival processes. In Computers & Mathematics with Applications; Elsevier Science Ltd.: Amsterdam, The Netherlands, 1995; Volume 30, pp. 105–119. [Google Scholar]
- Chen, P.; Liu, H.; Qi, H.; Wang, F. Analysis of delay variability at isolated signalized intersections. J. Zhejiang Univ. 2013, 14, 691–704. [Google Scholar] [CrossRef]
- Viti, F.; van Zuylen, H.J. Markov mesoscopic simulation model of overflow queues at multilane signalized intersections. Adv. OR AI Methods Transp. 2005, 475–481. Available online: http://www.iasi.cnr.it/ewgt/16conference/ID87.pdf (accessed on 18 November 2019).
- Gasz, K. Zastosowanie szeregów czasowych do opisu długości kolejek na wlotach skrzyżowań. In Proceedings of the 50. Jubileuszowa Konferencja Naukowa Komitetu Inżynierii Lądowej i Wodnej PAN i Komitetu Nauki PZITB “Krynica 2004”, Krynica, Poland, 12–17 September 2004. [Google Scholar]
- Shou, Y.; Xu, J. Multi-objective optimization of oversaturated signalized intersection based on fuzzy logic. In Proceedings of the 8th World Congress on Intelligent Control and Automation, Jinan, China, 6–9 July 2010. [Google Scholar]
- Kafash, M.; Sharif, M.J.; Menhaj, M.B.; Maleki, A. Designing fuzzy controller for traffic lights to reduce the length of queues in according to minimize extension of green light time and reduce waiting time. In Proceedings of the 13th Iranian Conference on Fuzzy Systems (IFSC), Qazvin, Iran, 27–29 August 2013; pp. 1–6. [Google Scholar]
- Mucsi, K.; Khan, A.M.; Ahmadi, M. An adaptive neuro-fuzzy inference system for estimating the number of vehicles for queue management at signalized intersections. Trans. Res. Part C 2011, 19, 1033–1047. [Google Scholar] [CrossRef]
- Van Zuylen, H.J.; Viti, F. Uncertainty and the dynamics of queues at controlled intersections. IFAC Proc. 2003, 36, 43–48. [Google Scholar] [CrossRef]
- Viti, F.; van Zuylen, H.J. The dynamics and the uncertainty of queues at fixed and actuated controls: A probabilistic approach. J. Intell. Transp. Syst. Technol. Plan. Oper. 2009, 13, 39–51. [Google Scholar] [CrossRef]
- Cao, J.; Hu, D.; Hadiuzzaman, M.; Wang, X.; Qiu, T.Z. Comparison of queue estimation accuracy by shockwave-based and input-output-based models. In Proceedings of the 17th International IEEE Conference on Intelligent Transportation Systems (ITSC), Qingdao, China, 8–11 October 2014; pp. 2687–2692. [Google Scholar]
- Ng, K.M.; Reaz, M.I. A Comparative Study of the LWR-IM Traffic Model and Shockwave Analysis. In Proceedings of the 2015 IEEE Conference on Systems, Process and Control (ICSPC 2015), Bandar Sunway, Malaysia, 18–20 December 2015; pp. 39–43. [Google Scholar]
- Srivastawa, A.; Jin, W.L.; Lebacque, J.P. A modified Cell Transmission Model with realistic queue discharge features at signalized intersections. Transp. Res. Part B Methodol. 2015, 81, 302–315. [Google Scholar] [CrossRef][Green Version]
- Hao, J.; Hou, Z.; Bu, X. The iterative learning approach for vehicle queuing length balanced-control of the signalized isolated intersection. In Proceedings of the 30th Chinese Control Conference, Yantai, China, 22–24 July 2011; pp. 5556–5561. [Google Scholar]
- Anokye, M.; Abdul-Aziz, A.R.; Annin, K.; Oduro, F.T. Application of queuing theory to vehicular traffic at signalized intersection in Kumasi-Ashanti Region, Ghana. Am. Int. J. Contemp. Res. 2013, 3, 23–29. [Google Scholar]
- Bie, Y.; Mao, C.; Yang, M. Development of vehicle delay and queue length models for adaptive traffic control at signalized roundabout. Procedia Eng. 2016, 137, 141–150. [Google Scholar] [CrossRef]
- Fu, L.; Hellinga, B.; Zhu, Y. An adaptive model for real-time estimation of overflow queues on congested arterials. In Proceedings of the 2001 IEEE Intelligent Transportation Systems Conference Proceedings, Oakland, CA, USA, 25–29 August 2001; pp. 219–226. [Google Scholar]
- Viti, F.; van Zuylen, H.J. Probabilistic models for queues at fixed control signals. Transp. Res. Part B 2010, 44, 120–135. [Google Scholar] [CrossRef]
- Yu, X.; Sulijoadikusumo, G.; Prevedouros, P. Analysis of downstream queues on upstream capacity expansion of urban signalized intersection. J. Transp. Syst. Eng. Inf. Technol. 2012, 12, 98–108. [Google Scholar] [CrossRef]
- He, X.; Liu, H.X.; Liu, X. Optimal vehicle speed trajectory on a signalized arterial with consideration of queue. Transp. Res. Part C Emerg. Technol. 2015, 61, 106–120. [Google Scholar] [CrossRef]
- Zhang, H.; Liu, H.X.; Chen, P.; Yu, G.; Wang, Y. Cycle-Based End of Queue Estimation at Signalized Intersections Using Low-Penetration-Rate Vehicle Trajectories. IEEE Trans. Intell. Transp. Syst. 2019, 21, 3257–3272. [Google Scholar] [CrossRef]
- Cao, P.; Fan, Q.; Liu, X. Real-time detection of end-of-queue shockwaves on freeways using probe vehicles with spacing equipment. IET Intell. Transp. Syst. 2018, 12, 1227–1235. [Google Scholar] [CrossRef]
- Zhao, Y.; Zheng, J.; Wong, W.; Wang, X.; Meng, Y.; Liu, H.X. Various methods for queue length and traffic volume estimation using probe vehicle trajectories. Transp. Res. Part C Emerg. Technol. 2019, 107, 70–91. [Google Scholar] [CrossRef]
- Naghawi, H.; Idewu, W. Analyzing delay and queue length using microscopic simulation for the unconventional intersection design superstreet. J. S. Afr. Inst. Civ. Eng. 2014, 56, 100–107. [Google Scholar]
- Ma, W.; Wan, L.; Yu, C.; Zou, L.; Zheng, J. Multi-objective optimization of traffic signals based on vehicle trajectory data at isolated intersections. Transp. Res. Part C Emerg. Technol. 2020, 120, 102821. [Google Scholar] [CrossRef]
- Li, Y.; Ma, S.; Li, W.; Wang, H. Microscopic urban traffic simulation with multi-agent system. In Proceedings of the Fourth International Conference on Information, Communications and Signal Processing, 2003 and the Fourth Pacific Rim Conference on Multimedia, Kuching, Malaysia, 1–4 December 2013; pp. 1835–1839. [Google Scholar]
- Anantharam, V. Queuing analysis with traffic models based on deterministic dynamical systems. Comput. Sci. J. Mold. 2004, 12, 154–170. [Google Scholar]
- Chaudhry, M.S.; Ranjitkar, P. Delay Estimation at Signalized Intersections with Variable Queue Discharge Rate. Proc. East. Asia Soc. Transp. Stud. 2013, 9, 1764–1775. [Google Scholar]
- Viti, F. Overflow queues at urban corridors and with time-dependent control. In Trail conference proceedings 2001, A World of Transport, Infrastructure and Logistics; Bovy, P.H.L., Ed.; Dup Science: Delft, The Netherlands, 2004; pp. 399–421. [Google Scholar]
- Liu, H.; Liang, W.; Rai, L.; Teng, K.; Wang, S. A Real-Time Queue Length Estimation Method Based on Probe Vehicles in CV Environment. IEEE Access 2019, 7, 20825–20839. [Google Scholar] [CrossRef]
- Xu, H.; Ding, J.; Zang, Y.; Hu, J. Queue length estimation at isolated intersections based on intelligent vehicle infrastructure cooperation systems. In Proceedings of the 2017 IEEE Intelligent Vehicles Symposium (IV), Los Angeles, CA, USA, 11–17 June 2017; pp. 655–660. [Google Scholar]
- Vigos, G.; Papageorgiou, M. A Simplified Estimation Scheme for the Number of Vehicles in Signalized Links. IEEE Trans. Intell. Transp. Syst. 2010, 11, 312–321. [Google Scholar] [CrossRef]
- Le Vine, S.; Liu, X.; Zheng, F.; Polak, J. Automated cars: Queue discharge at signalized intersections with ‘Assured-Clear-Distance-Ahead’ driving strategies. Transp. Res. Part C 2016, 62, 35–54. [Google Scholar] [CrossRef]
- Ramezani, M.; Geroliminis, N. Exploiting probe data to estimate the queue profile in urban networks. In Proceedings of the 16th International IEEE Annual Conference on Intelligent Transportation Systems, The Hague, The Netherlands, 6–9 October 2013; pp. 1817–1822. [Google Scholar]
- Yang, H.; Rakha, H.; Ala, M.V. Eco-cooperative adaptive cruise control at signalized intersections consedering queue effects. IEEE Trans. Intell. Transp. Syst. 2017, 18, 1575–1585. [Google Scholar]
- Wang, P.; Jiang, Y.; Xiao, L.; Zhao, Y.; Li, Y. A joint control model for connected vehicle platoon and arterial signal coordination. J. Intell. Transp. Syst. Technol. Plan. Oper. 2020, 24, 81–92. [Google Scholar] [CrossRef]
- Kong, J.; Hou, Z.; Ren, Y. Findings on Queue Length Based Macroscopic Fundamental Diagrams with Enhanced Floating Car Estimation Method. In Proceedings of the 37th Chinese Control Conference (CCC), Wuhan, China, 25–27 July 2018; pp. 7874–7879. [Google Scholar]
- Iwasaki, Y. An image processing system to measure vehicular queues and an adaptive traffic signal control by using the information of the queues. Proceedings of Conference on Intelligent Transportation Systems, Boston, MA, USA, 9–12 November 1997; pp. 195–200. [Google Scholar]
- Liu, X.; Dai, S.; Lu, S. Macroscopic model for interrupted traffic flow of signal controlled intersection. In Proceedings of the 2009 ISECS International Colloquium on Computing, Communication, Control, and Management, Sanya, China, 8–9 August 2009; pp. 78–81. [Google Scholar]
- Anusha, S.P.; Vanajakshi, L.D.; Sharma, A. A simple method for estimation of queue length. Civ. Eng. Fac. Publ. 2013, 12, 1–5. [Google Scholar]
- Anusha, S.P.; Vanajakshi, L.; Subramanian, A.C.; Sharma, A. Performance comparison of two model based schemes for estimation of queue and delay at signalized intersections. In Proceedings of the IEEE Intelligent Vehicles Symposium (IV), Seoul, Korea, 29 June–1 July 2015; pp. 988–993. [Google Scholar]
- Cai, Q.; Wang, Z.; Guo, X.; Wu, B. New calculating method for HCM 2000 queue length estimation procedures with the application of floating car data. Procedia Soc. Behav. Sci. 2013, 96, 2201–2210. [Google Scholar] [CrossRef][Green Version]
- Cetin, M.; Comert, G. Estimating queues at signalized intersections: Value of location and time data from instrumented vehicles. In Proceedings of the Intelligent Vehicles Symposium, Istanbul, Turkey, 13–15 June 2007; pp. 1138–1143. [Google Scholar]
- Chang, J.; Talas, M.; Muthuswamy, S. A simple methodology to estimate queue lengths at signalized intersections using detector data. Transp. Res. Rec. J. Transp. Res. Board 2014, 1–14. [Google Scholar] [CrossRef]
- Hao, P.; Ban, X. Long queue estimation for signalized intersections using mobile data. Transp. Res. Part B Methodol. 2015, 82, 54–73. [Google Scholar] [CrossRef]
- Mukhopadhyay, S.; Pramod, M.J.; Kumar, A. An approach for analysis of mean delay at a signalized intersection with indisciplined traffic. In Proceedings of the Intelligent Transportation System Workshop, Bangalore, India, 6–10 January 2015; pp. 1–6. [Google Scholar]
- Iwanowicz, D.; Chmielewski, J. Analysis of the Methods of Traffic Evaluation at the Approaches of Urban Signalised Intersections. In Nodes in Transport Networks—Research, Data Analysis and Modelling; Macioszek, E., Kang, N., Sierpiński, G., Eds.; Springer International Publishing: Berlin/Heidelberg, Germany, 2020; pp. 180–198. [Google Scholar]
- Liu, H.X.; Wu, X.; Ma, W.; Hu, H. Real-time queue length estimation for congested signalized intersections. Transp. Res. Part C 2009, 17, 412–427. [Google Scholar] [CrossRef]
- Milla, J.M.; Toral, S.L.; Vargas, M.; Barrero, F.J. Dual-rate backgraund subtraction approach for estimating traffic queue parameters in urban scenes. IET Intell. Transp. Syst. 2013, 7, 122–130. [Google Scholar] [CrossRef]
- Khan, M.A.; Ectors, W.; Bellemans, T.; Janssens, D.; Wets, G. Unmanned Aerial Vehicle-Based Traffic Analysis: A Case Study for Shockwave Identification and Flow Parameters Estimation at Signalized Intersections. Remote Sens. 2018, 10, 458. [Google Scholar] [CrossRef]
- Sun, Z.; Ban, X. Vehicle trajectory reconstruction for signalized intersections using mobile traffic sensors. Transp. Res. Part C Emerg. Technol. 2013, 36, 268–283. [Google Scholar] [CrossRef]
- Xie, X.; van Lint, H.; Verbraeck, A. A generic data assimilation framework for vehicle trajectory reconstruction on signalized urban arterials using particle filters. Transp. Res. Part C Emerg. Technol. 2018, 92, 364–391. [Google Scholar] [CrossRef]
- Zhou, J.; Jin, L.; Wang, X.; Sun, D. Resilient UAV Traffic Congestion Control Using Fluid Queuing Models. IEEE Trans. Intell. Transp. Syst. 2020, 1–12. [Google Scholar] [CrossRef]
- Wang, L.; Chen, F.; Yin, H. Detecting and tracking vehicles in traffic by unmanned aerial vehicles. Autom. Constr. 2016, 72, 294–308. [Google Scholar] [CrossRef]
- Salvo, G.; Caruso, L.; Scordo, A. Urban Traffic Analysis through an UAV. Procedia Soc. Behav. Sci. 2014, 111, 1083–1091. [Google Scholar] [CrossRef]
- Chmielewski, J. Zastosowanie systemu WZDR do zarządzania bezpieczeństwem ruchu drogowego. Drog. Bud. Infrastrukt. 2011, 2, 52–61. [Google Scholar]
- Macioszek, E. The Passenger Car Equivalent Factors for Heavy Vehicles on Turbo Roundabouts. Front. Built Environ. Sect. Transp. Transit. Syst. 2019, 5, 68. [Google Scholar] [CrossRef]
- Granà, A.; Giuffrè, T.; Macioszek, E.; Acuto, F. Estimation of Passenger Car Equivalents for two-lane and turbo roundabouts using AIMSUN. Front. Built Environ. 2020, 6, 86. [Google Scholar] [CrossRef]
- Macioszek, E. Roundabout entry capacity calculation—A case study based on roundabouts in Tokyo, Japan, and Tokyo surroundings. Sustainability 2020, 12, 1533. [Google Scholar] [CrossRef]
Figure 1.
The idea of the modeling of delays and the back-of-queues at signal-controlled intersection approach in a typical period of vehicle service (in the period of no traffic overload). Source: Own research based on [
3,
4].
Figure 1.
The idea of the modeling of delays and the back-of-queues at signal-controlled intersection approach in a typical period of vehicle service (in the period of no traffic overload). Source: Own research based on [
3,
4].
Figure 2.
An example of a measuring section adopted as a model for research (Poland, Torun city, intersection approach Czerwona Droga Street/west/): (
a). measuring section location; (
b). view of the queue of the vehicle on a measuring section; (
c). situational plan. Source: Own work based on Open Street map, Google Earth and WZDR System [
95].
Figure 3.
Arrangement of measurement kits along Kamienna Street in Bydgoszcz, Poland (where: 1—camera, 2—power bank, 3—memory card, 4—power supply cable, 5—camera holder, 6—weatherproof enclosure, 7—support sections, 8—clamps).
Figure 3.
Arrangement of measurement kits along Kamienna Street in Bydgoszcz, Poland (where: 1—camera, 2—power bank, 3—memory card, 4—power supply cable, 5—camera holder, 6—weatherproof enclosure, 7—support sections, 8—clamps).
Figure 4.
Diagram of the process of the volatility of the back-of-queue size in time and the formation of the maximum back-of-queue size in a given signaling cycle i.
Figure 4.
Diagram of the process of the volatility of the back-of-queue size in time and the formation of the maximum back-of-queue size in a given signaling cycle i.
Figure 5.
Diagram of the process of forming the remaining queue length in a given signaling cycle i (or a process of forming the initial queue length for the next signaling cycle i + 1).
Figure 5.
Diagram of the process of forming the remaining queue length in a given signaling cycle i (or a process of forming the initial queue length for the next signaling cycle i + 1).
Figure 6.
Distribution of the number of vehicles from the arrival stream in signaling cycles in a given measurement period taking into account the portion of heavy vehicles.
Figure 6.
Distribution of the number of vehicles from the arrival stream in signaling cycles in a given measurement period taking into account the portion of heavy vehicles.
Figure 7.
Distribution of the number of vehicles in the maximum back-of-queue for a given lane at the approach in individual signaling cycles in a given measurement period (including vehicles
Figure 8. Starting-up times for the vehicles forming the maximum back-of-queues for a given lane controlled by traffic signal heads with the same signal control parameters, i.e., green signal and cycle length.
Figure 8.
Starting-up times for the vehicles forming the maximum back-of-queues for a given lane controlled by traffic signal heads with the same signal control parameters, i.e., green signal and cycle length.
Figure 8.
Starting-up times for the vehicles forming the maximum back-of-queues for a given lane controlled by traffic signal heads with the same signal control parameters, i.e., green signal and cycle length.
Figure 9.
Results of the analysis of average values of cumulative time headways in the stream of starting-up vehicles from the maximum back-of-queue after turning on the green signal in a given cycle for subsequent vehicles.
Figure 9.
Results of the analysis of average values of cumulative time headways in the stream of starting-up vehicles from the maximum back-of-queue after turning on the green signal in a given cycle for subsequent vehicles.
Figure 10.
Results of the correlation analysis of the average values of the intensity of starting vehicles from the maximum queue as a function of the average values of the maximum intensity of the service.
Figure 10.
Results of the correlation analysis of the average values of the intensity of starting vehicles from the maximum queue as a function of the average values of the maximum intensity of the service.
Figure 11.
Results of regression and correlation analysis between empirical values of maximum queue size and theoretical values determined by the proposed model.
Figure 11.
Results of regression and correlation analysis between empirical values of maximum queue size and theoretical values determined by the proposed model.
Figure 12.
Distribution of errors in estimating the maximum queue size at signal-controlled intersection approach obtained by the proposed model.
Figure 12.
Distribution of errors in estimating the maximum queue size at signal-controlled intersection approach obtained by the proposed model.
Figure 13.
Results of regression and correlation analysis between empirical values of maximum queue size and calibrated theoretical values determined by the proposed model.
Figure 13.
Results of regression and correlation analysis between empirical values of maximum queue size and calibrated theoretical values determined by the proposed model.
Figure 14.
Distribution of errors in estimating the maximum queue size at signal-controlled intersection approach obtained by the proposed model after calibration.
Figure 14.
Distribution of errors in estimating the maximum queue size at signal-controlled intersection approach obtained by the proposed model after calibration.
Table 1.
The summary of the characteristics of the examined intersections and the collected data.
Table 1.
The summary of the characteristics of the examined intersections and the collected data.
| Parameters Type | Parameter Name | The Scope of Data |
|---|
| General | Function of a road in spatial development | Collective and distributing |
| Entry movements through the intersection | Through, through and left, through and right |
| | | |
| Geometric | Length of the accumulation zone [m] | 250–620 |
| Lane width [m] | 3.0–3.5 |
| | | |
| Traffic control signals | Type of control | Fixed-time |
| Signaling cycle time [s] | 96.0–140.0 |
| Green signal time [s] | 18.0–34.0 |
| Traffic movements while servicing | There is no conflict movements |
| | | |
| Traffic volumes | Arrival flow rate [Veh./s] | 0.00–0.25 |
| Departure flow rate [Veh./s] | 0.32–0.61 |
| Starting-up flow rate [Veh./s] | 0.37.1.35 |
| Stopping flow rate [Veh./s] | 0.18–0.93 |
| Remaining queue range [Veh./cycle] | 0–49 |
| Maximum back-of-queue range [Veh./cycle] | 5–61 |
Table 2.
The summary of the characteristics of the examined intersections and the collected data.
Table 2.
The summary of the characteristics of the examined intersections and the collected data.
| Parameter | Parameter Description | Unit |
|---|
| i | Number of signaling cycle (interval of analysis) | [−] |
| Ti | Cycle length of interval i | [s] |
| Re,i | Effective red time of interval i | [s] |
| Ge,i | Effective green time of interval i | [s] |
| qD,i | Arrival flow rate of interval i | [Veh./s] |
| qO,i | Departure flow rate on interval i, (i.e., saturation flow rate) | [Veh./s] |
| qR,i | Starting-up flow rate of vehicles in the maximum queue of interval i | [Veh./s] |
| qZ,i | Stopping flow rate of vehicles in the initial queue of interval i | [Veh./s] |
| qX,i | Decreasing flow of maximum queue range during effective green time Ge,i due to service time at intersection approach of interval i | [Veh./s] |
| qY,i | Decreasing flow of maximum queue range after start effective red time Re,i including vehicles arriving to queue qD,i on interval i | [Veh./s] |
| KZ,i | Back-of-queue size at the moment of starting effective green time duration Ge,i on interval i; generally the number of vehicles in KZ,i is equal to maximum queue length kmax,i, | [Veh.] |
| KC,i+1 | Back-of-queue size at the moment of starting effective red time duration Re,i on next interval i+1; the number of vehicles in KC,i+1 is equal to remaining queue length (kP,i) | [Veh.] |
| KM,i | Maximum back-of-queue size on interval i | [Veh.] |
| tx,i | Formation time of the maximum queue size on interval i | [s] |
| k0,i | Initial queue lenght on interval i | [Veh.] |
| kmac,i | Maximum queue length (maximum number of stopped vehicle) on interval i | [Veh.] |
| kP,i | Remaining queue length on interval i, equivalent with initial queue length on interval i + 1 | [Veh.] |
| ω | A hypothetical point in time defining the end of the service process of vehicles from the maximum queue, if the green signal was still duration at the intersection approach | [s] |
| ci | Lane capacity of interval i | [Veh./s] |
| Green effective period ratio | [−] |
| Arrivals-to-Starts ratio | [−] |
| Capacity-to-Starts ratio | [−] |
| Volume-to-Capacity ratio | [−] |
Table 3.
Values of errors in estimating the maximum back-of-queue size at the signal-controlled intersection approach [Veh.].
Table 3.
Values of errors in estimating the maximum back-of-queue size at the signal-controlled intersection approach [Veh.].
| Testing Ground | Traffic Conditions at the Intersection Approach: |
|---|
Unsaturated Inflow
[Veh.] | Saturated or Oversaturated Inflow
[Veh.] | All Together
[Veh.] |
|---|
| TGa1 | 2.50 | 3.28 | 2.95 |
| TGa2 | 1.24 | 8.55 | 6.03 |
| TGa3 | 1.74 | 3.09 | 2.75 |
| TGa4 | 1.03 | 8,25 | 5.78 |
| TGa5 | 1.97 | 4.67 | 4,19 |
| TGa6 | 1.77 | 4.97 | 3.34 |
| TGa7 | 1.22 | 5.74 | 4.51 |
| TGa8 | 1.75 | 2.97 | 2.08 |
| In all together | 1.76 | 5.23 | 4.01 |
Table 4.
Values of errors in estimating the maximum back-of-queue size at the signal-controlled intersection approach [Veh.] after calibration.
Table 4.
Values of errors in estimating the maximum back-of-queue size at the signal-controlled intersection approach [Veh.] after calibration.
| Testing Ground | Traffic Conditions at the Intersection Approach: |
|---|
Unsaturated Inflow
[Veh.] | Saturated or Oversaturated Inflow
[Veh.] | Unsaturated Inflow
[Veh.] |
|---|
| TGa1 | 2.98 | 4.24 | 3.72 |
| TGa2 | 1.28 | 7.65 | 5.42 |
| TGa3 | 1.95 | 3.12 | 2.82 |
| TGa4 | 1.10 | 7.49 | 5.27 |
| TGa5 | 2.35 | 4.33 | 3.95 |
| TGa6 | 1.73 | 4.11 | 2.86 |
| TGa7 | 1.34 | 5.03 | 3.98 |
| TGa8 | 1.89 | 2.64 | 2.08 |
| In all together | 1.95 | 4.91 | 3.83 |
| Publisher’s Note: MDPI stays neutral with regard to jurisdictional claims in published maps and institutional affiliations. |
© 2021 by the authors. Licensee MDPI, Basel, Switzerland. This article is an open access article distributed under the terms and conditions of the Creative Commons Attribution (CC BY) license (http://creativecommons.org/licenses/by/4.0/).


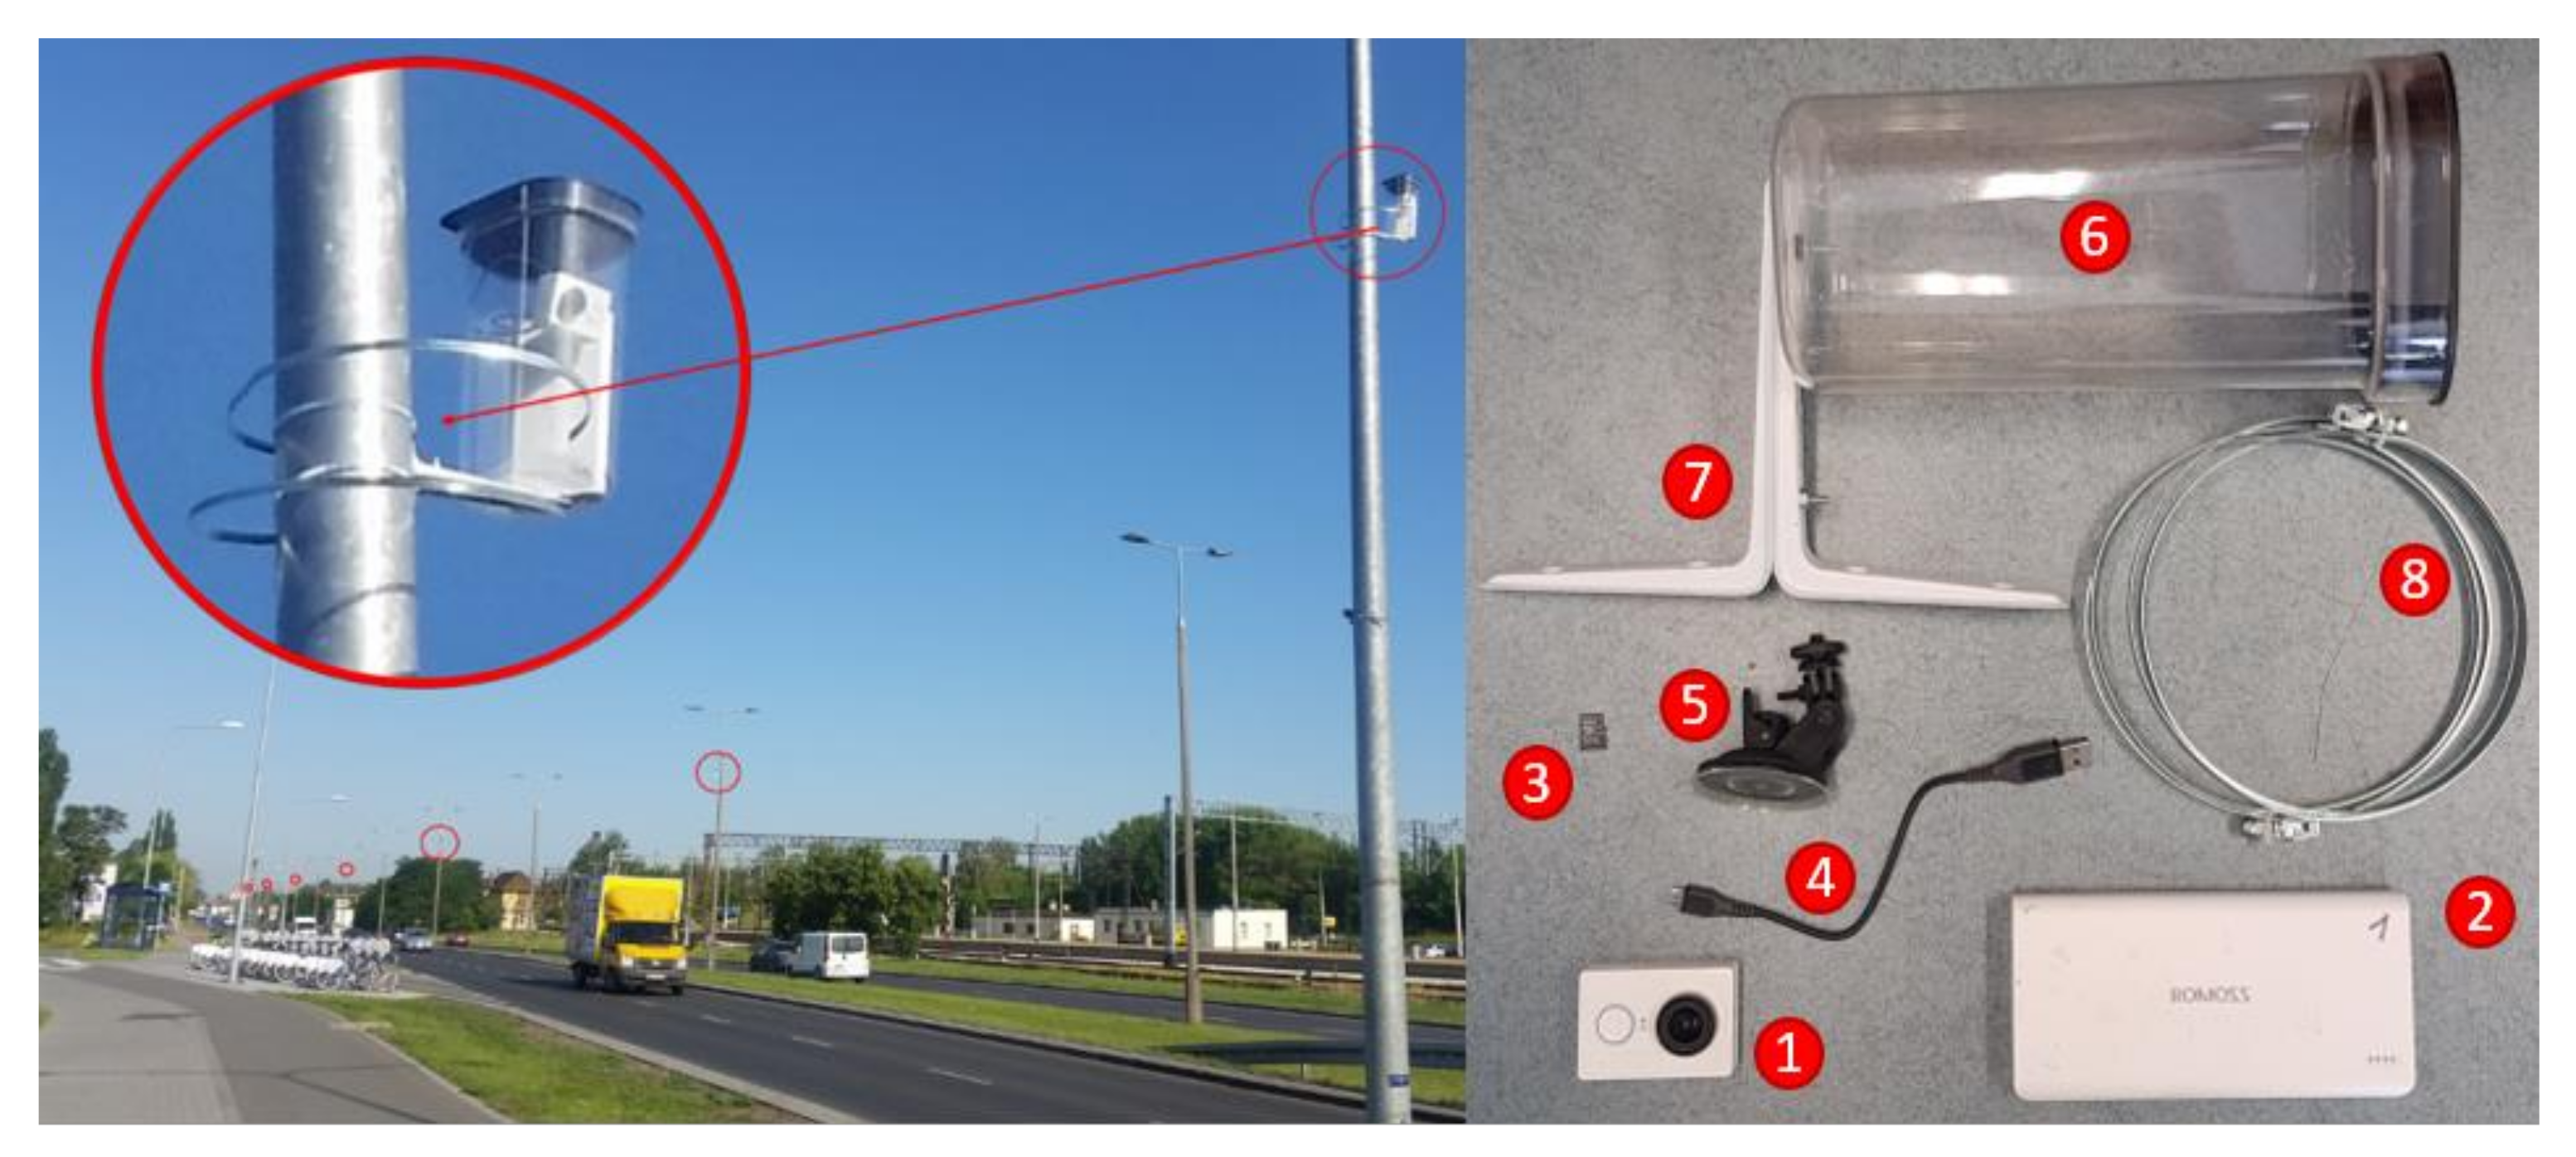
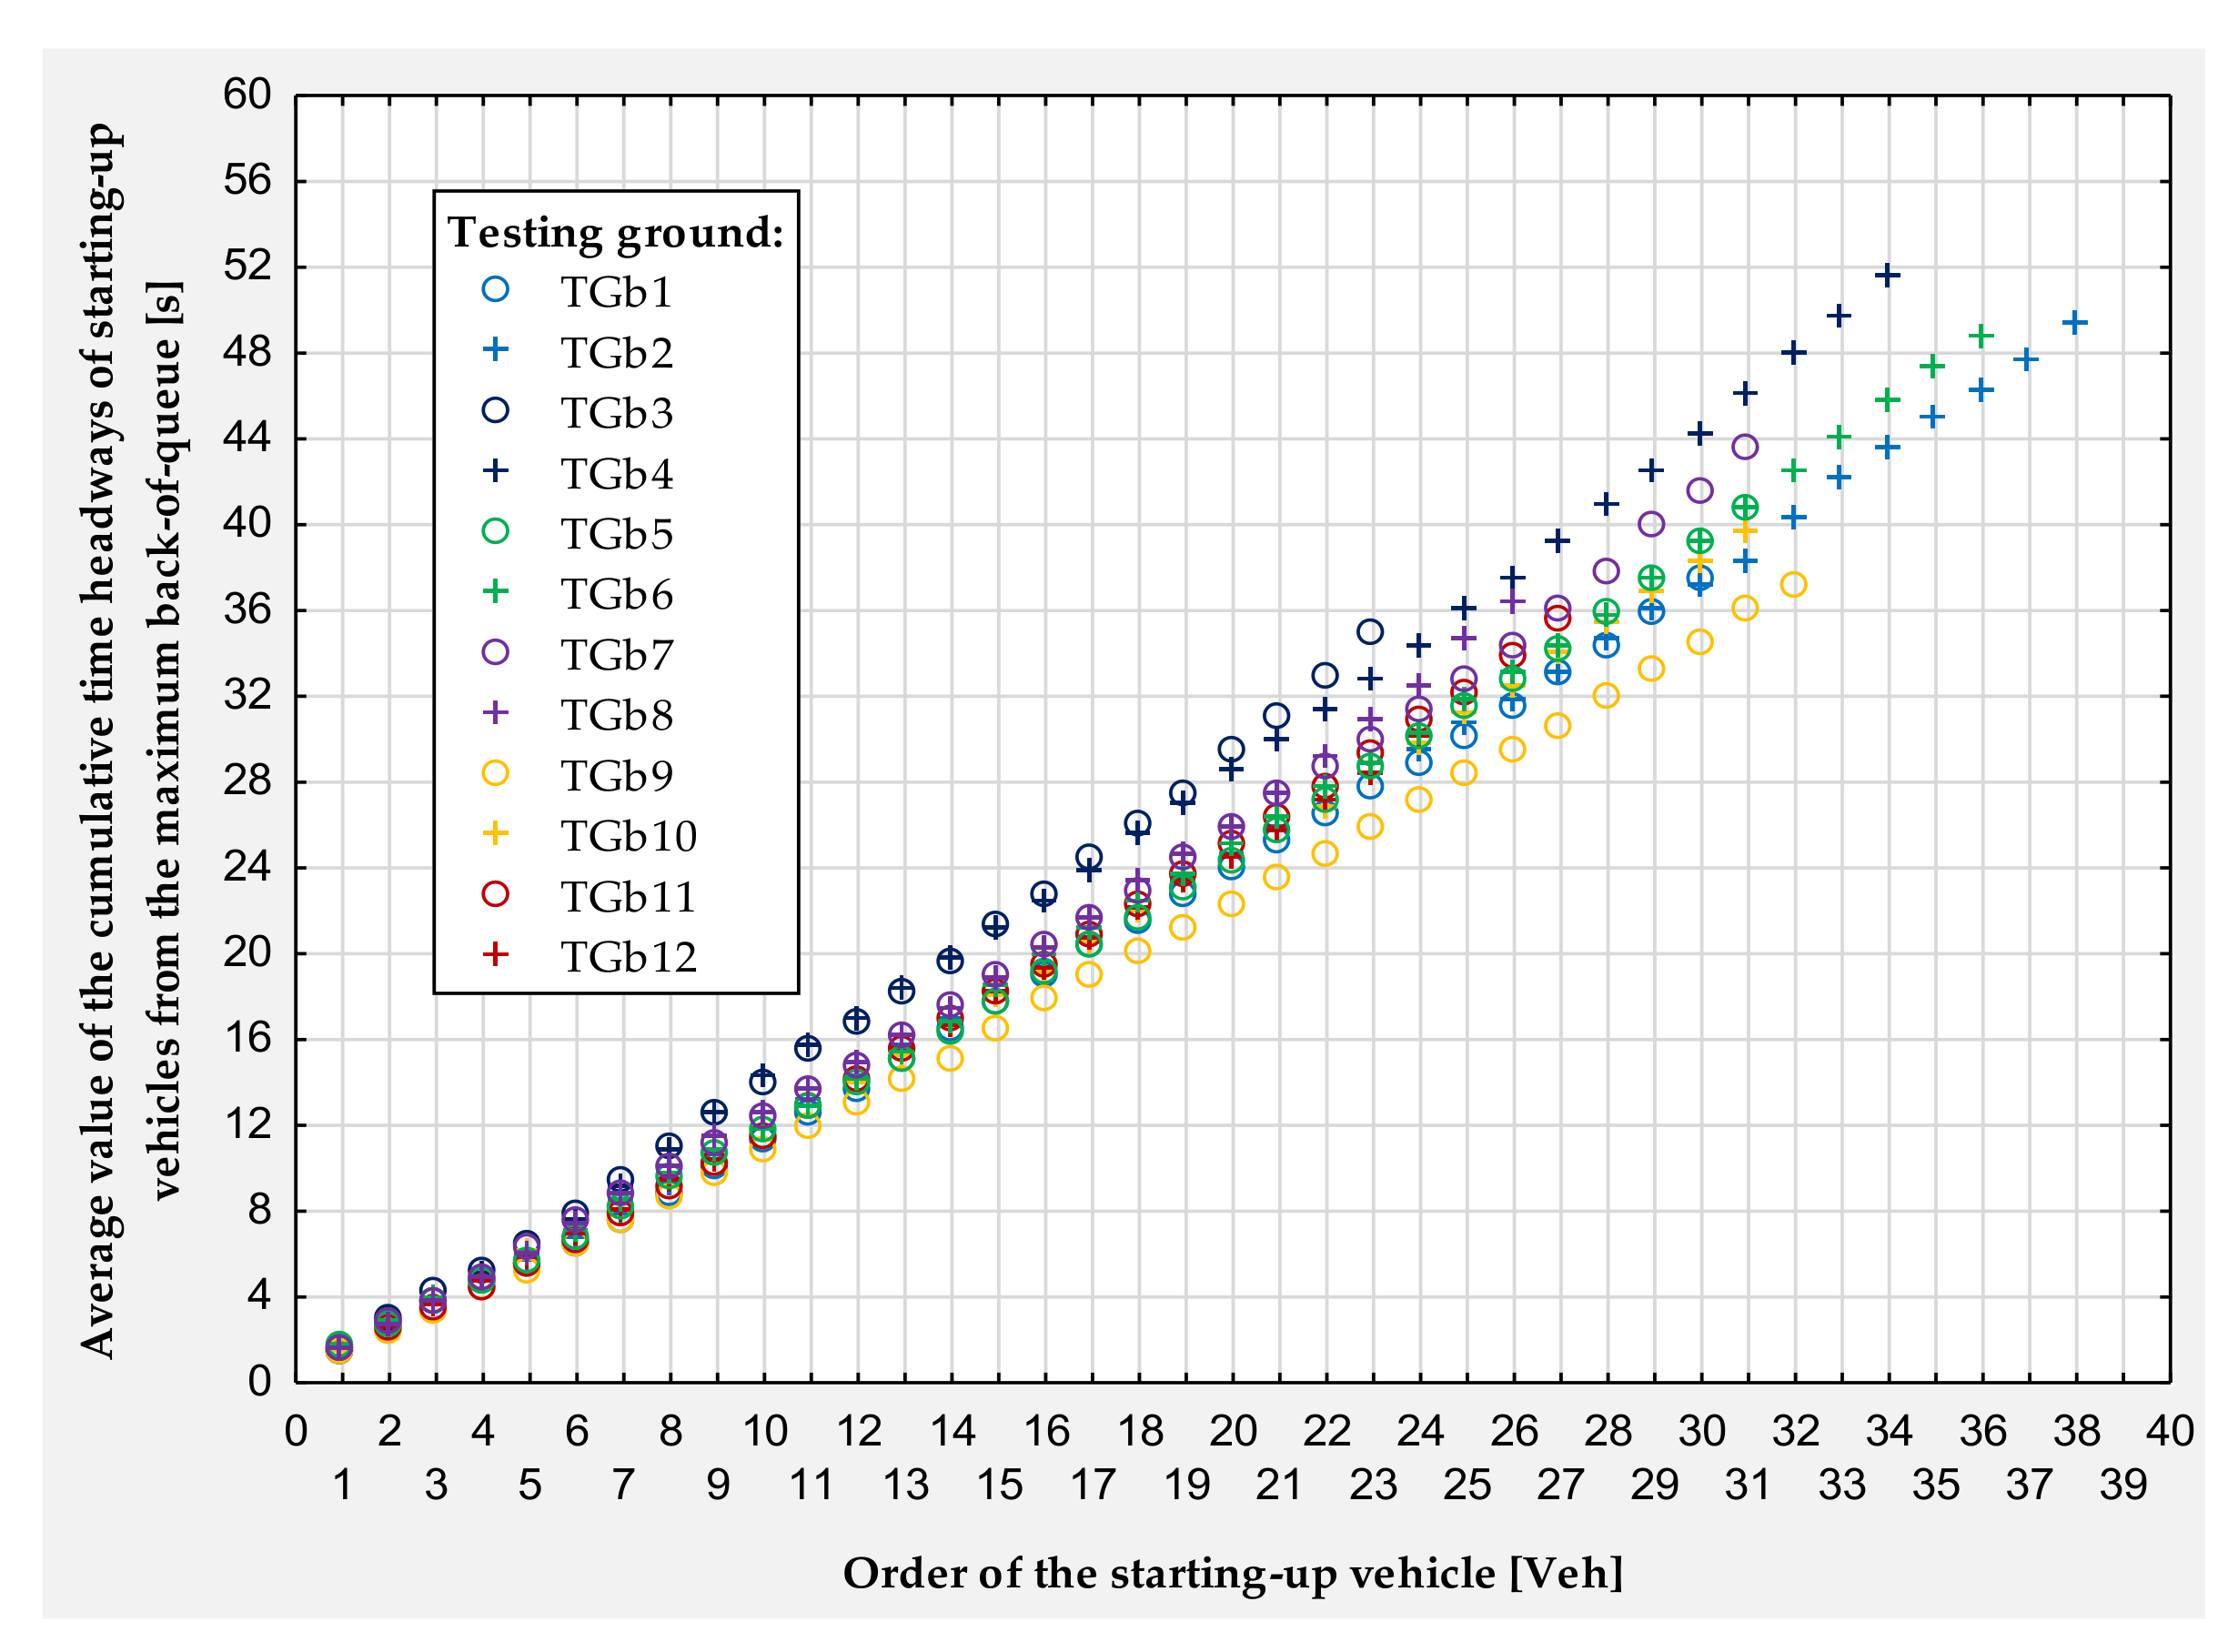
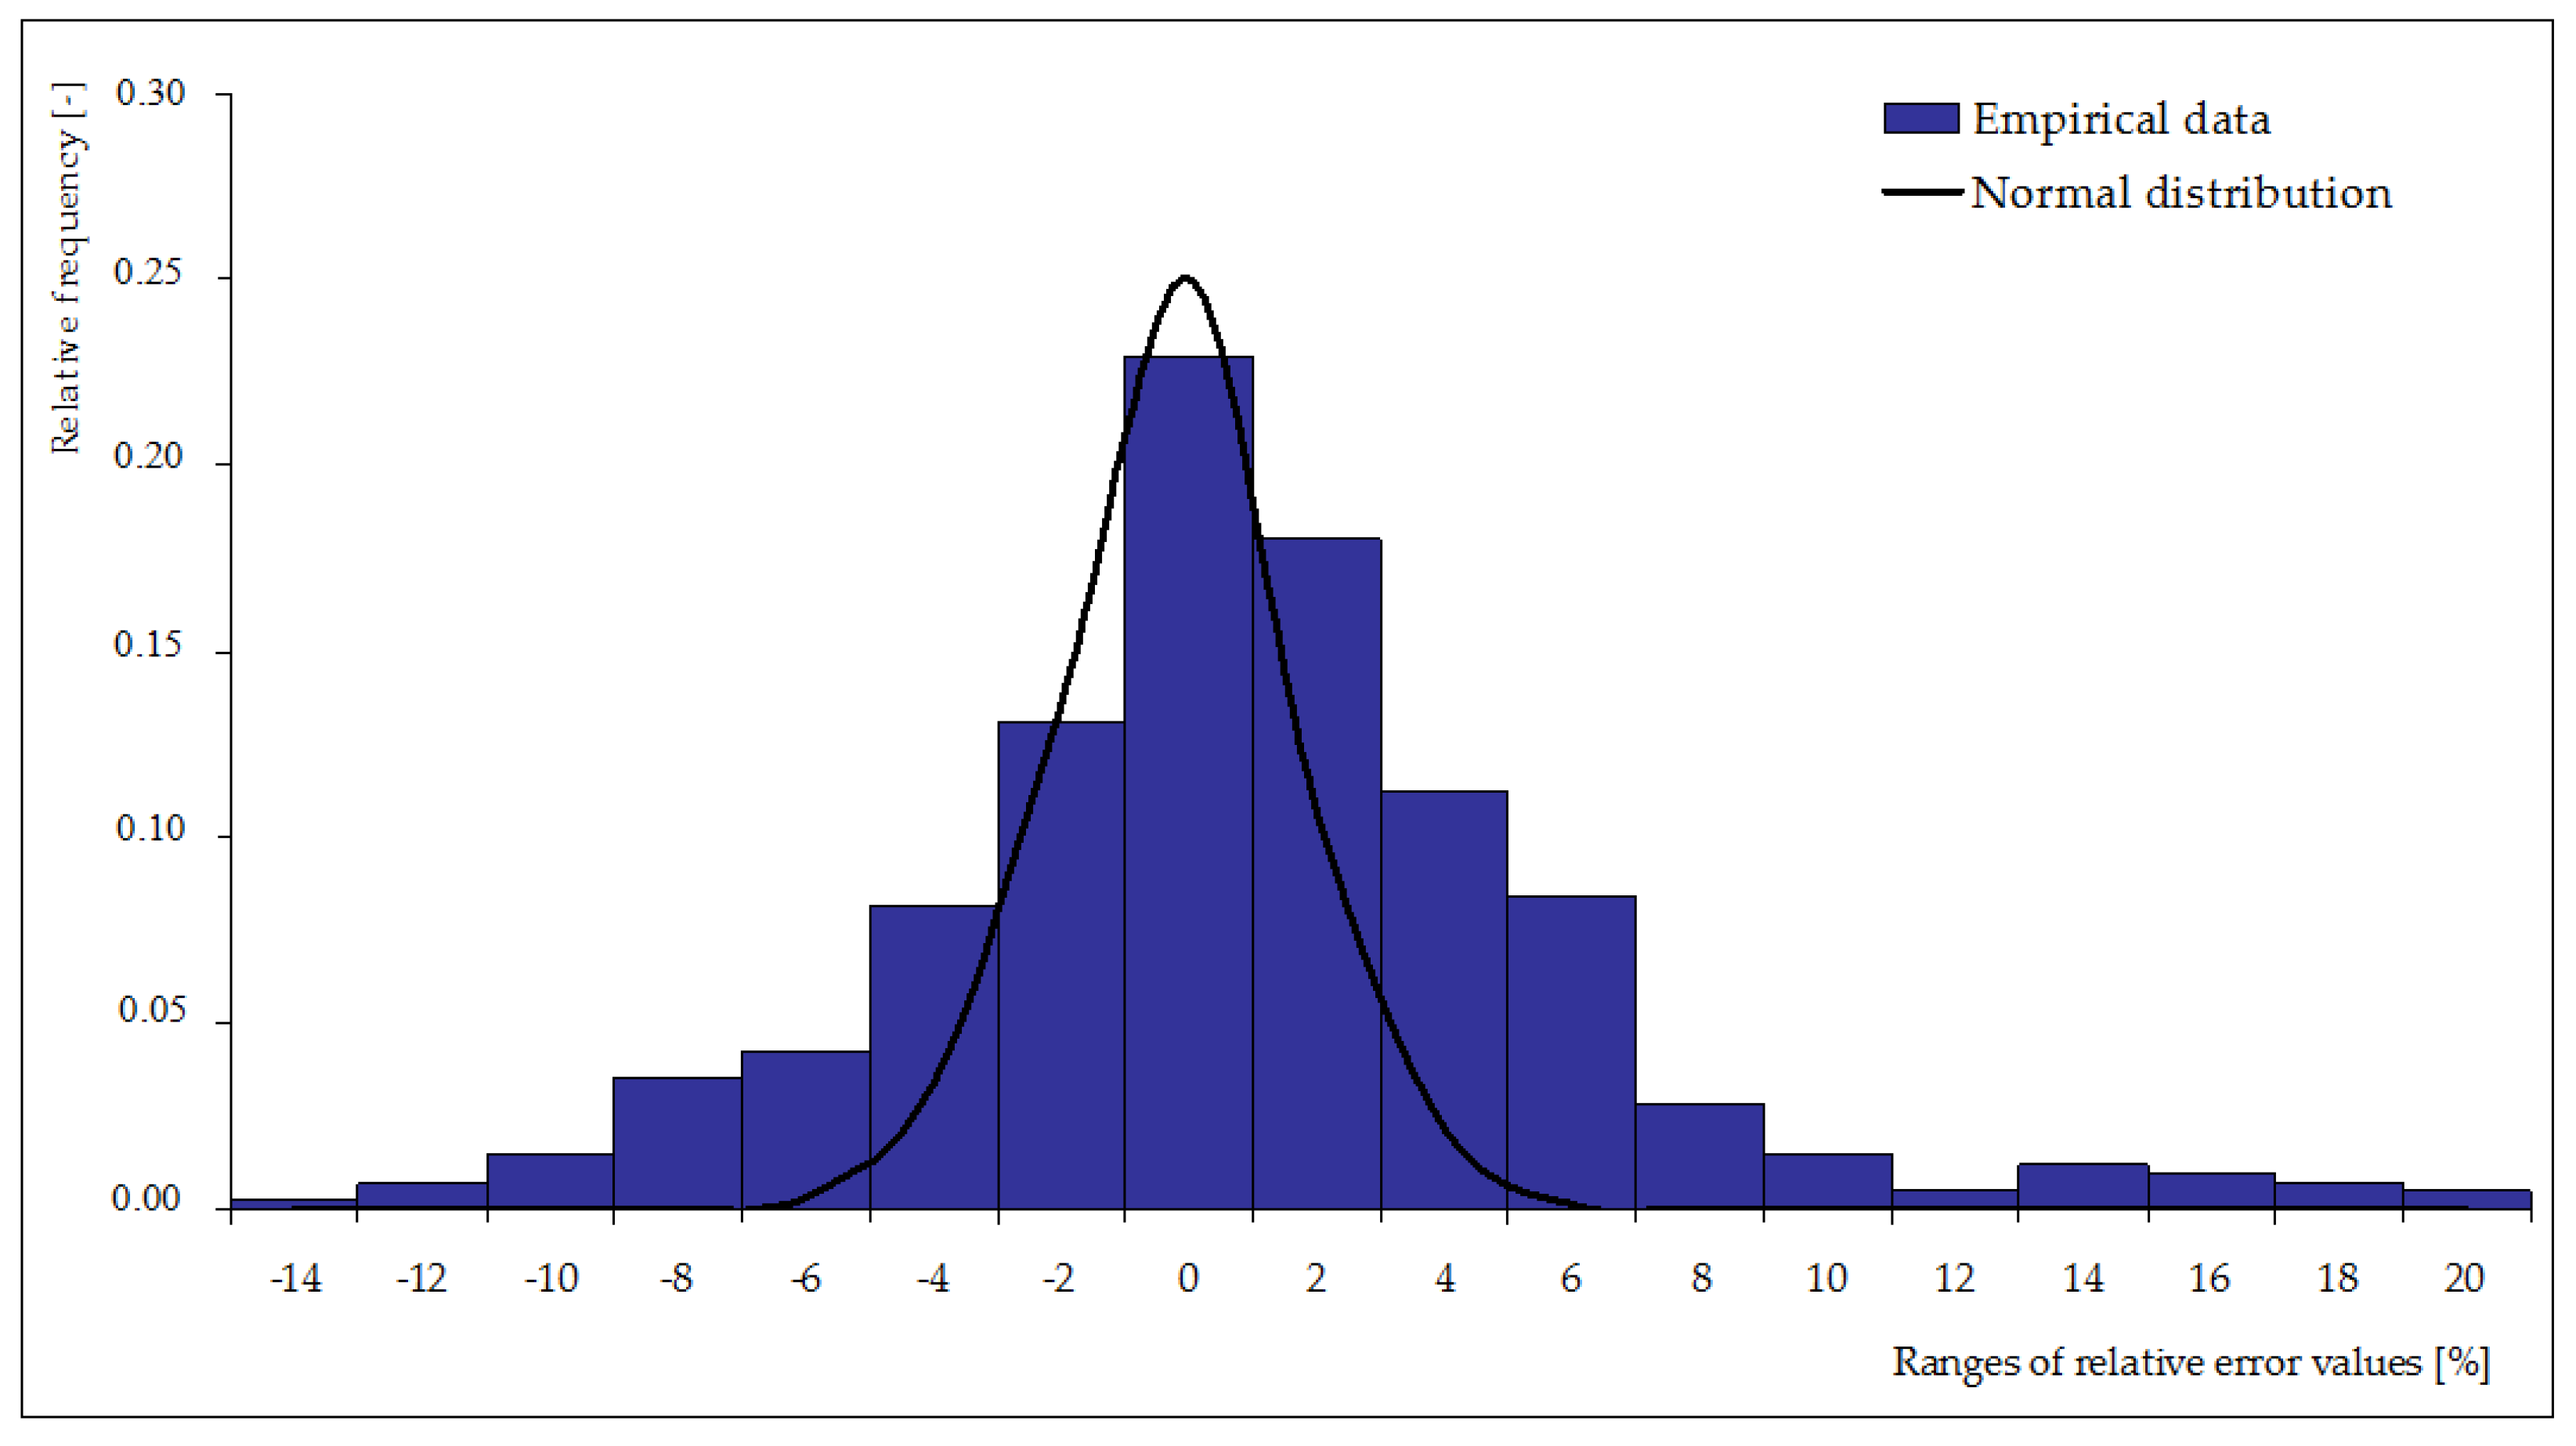