Article

The Carbon Footprint of Electrified City Buses: A Case Study in Trondheim, Norway

1
Department of Energy and Process Engineering & ENERSENSE, Norges Teknisk-Naturvitenskapelige Universitet, 7491 Trondheim, Norway
2
Department of Electronic Systems & ENERSENSE, Norges Teknisk-Naturvitenskapelige Universitet, 7034 Trondheim, Norway
*
Author to whom correspondence should be addressed.
Energies 2021, 14(3), 770; https://doi.org/10.3390/en14030770
Submission received: 4 January 2021 / Revised: 20 January 2021 / Accepted: 28 January 2021 / Published: 1 February 2021
(This article belongs to the Special Issue Advanced Technology to Improve Energy Efficiency and Storage)

Abstract

:
In August 2019, a new bus fleet of 36 electric and 58 hybrid buses were implemented in Trondheim, Norway. This paper examines the carbon footprint of electrified city buses, by addressing the achieved and potential reduction for the new bus fleet. Important aspects such as geographical location of production, charging electricity mix, and impact from production and operation on lifetime emissions, are also examined. A meta-analysis on life cycle assessment studies was undertaken to investigate greenhouse gas emissions and energy demand in different parts of bus production. This is followed by the production of a bus model using the findings and comparing electrified buses with diesel and HVO buses. The models were then used in a case study of the bus fleet in Trondheim, to understand the specific parameters affecting the carbon footprint. The results show that the overall carbon footprint has been considerably reduced (37%) by implementing biofuel and electrified buses, and that a further reduction of 52% can be achieved through full electrification. The operation emissions for the fleet were found to be 49 g CO2-eq/person-km, which is lower than the average city bus and passenger car in Norway.

1. Public Transport and Global Warming

In order to achieve the goals of the Paris agreement, clear climate strategies are essential. Both the EU [1] and Norway (Klimakur 2030 [2]) have actively developed strategies to work towards these goals, outlining the emission cuts required to meet the Non-Emission-Trading-System outlined by the EU. The transportation sector is a dominant area of GHG emissions both globally and in Norway (Figure 1a,b, [3,4]). The EU has recently set a goal to reduce GHG emissions from transport by a minimum of 60% by 2050, compared to 1990 levels [5]. This requires a significant reduction in fossil fuels, while increasing renewable alternatives [6]. Nordic countries are amongst the leading countries in transportation electrification in Europe [7], and in August of 2019, a new low emission bus fleet with 36 electric and 58 hybrid buses was implemented in Trondheim, Norway.

1.1. Current Status and Future Plans

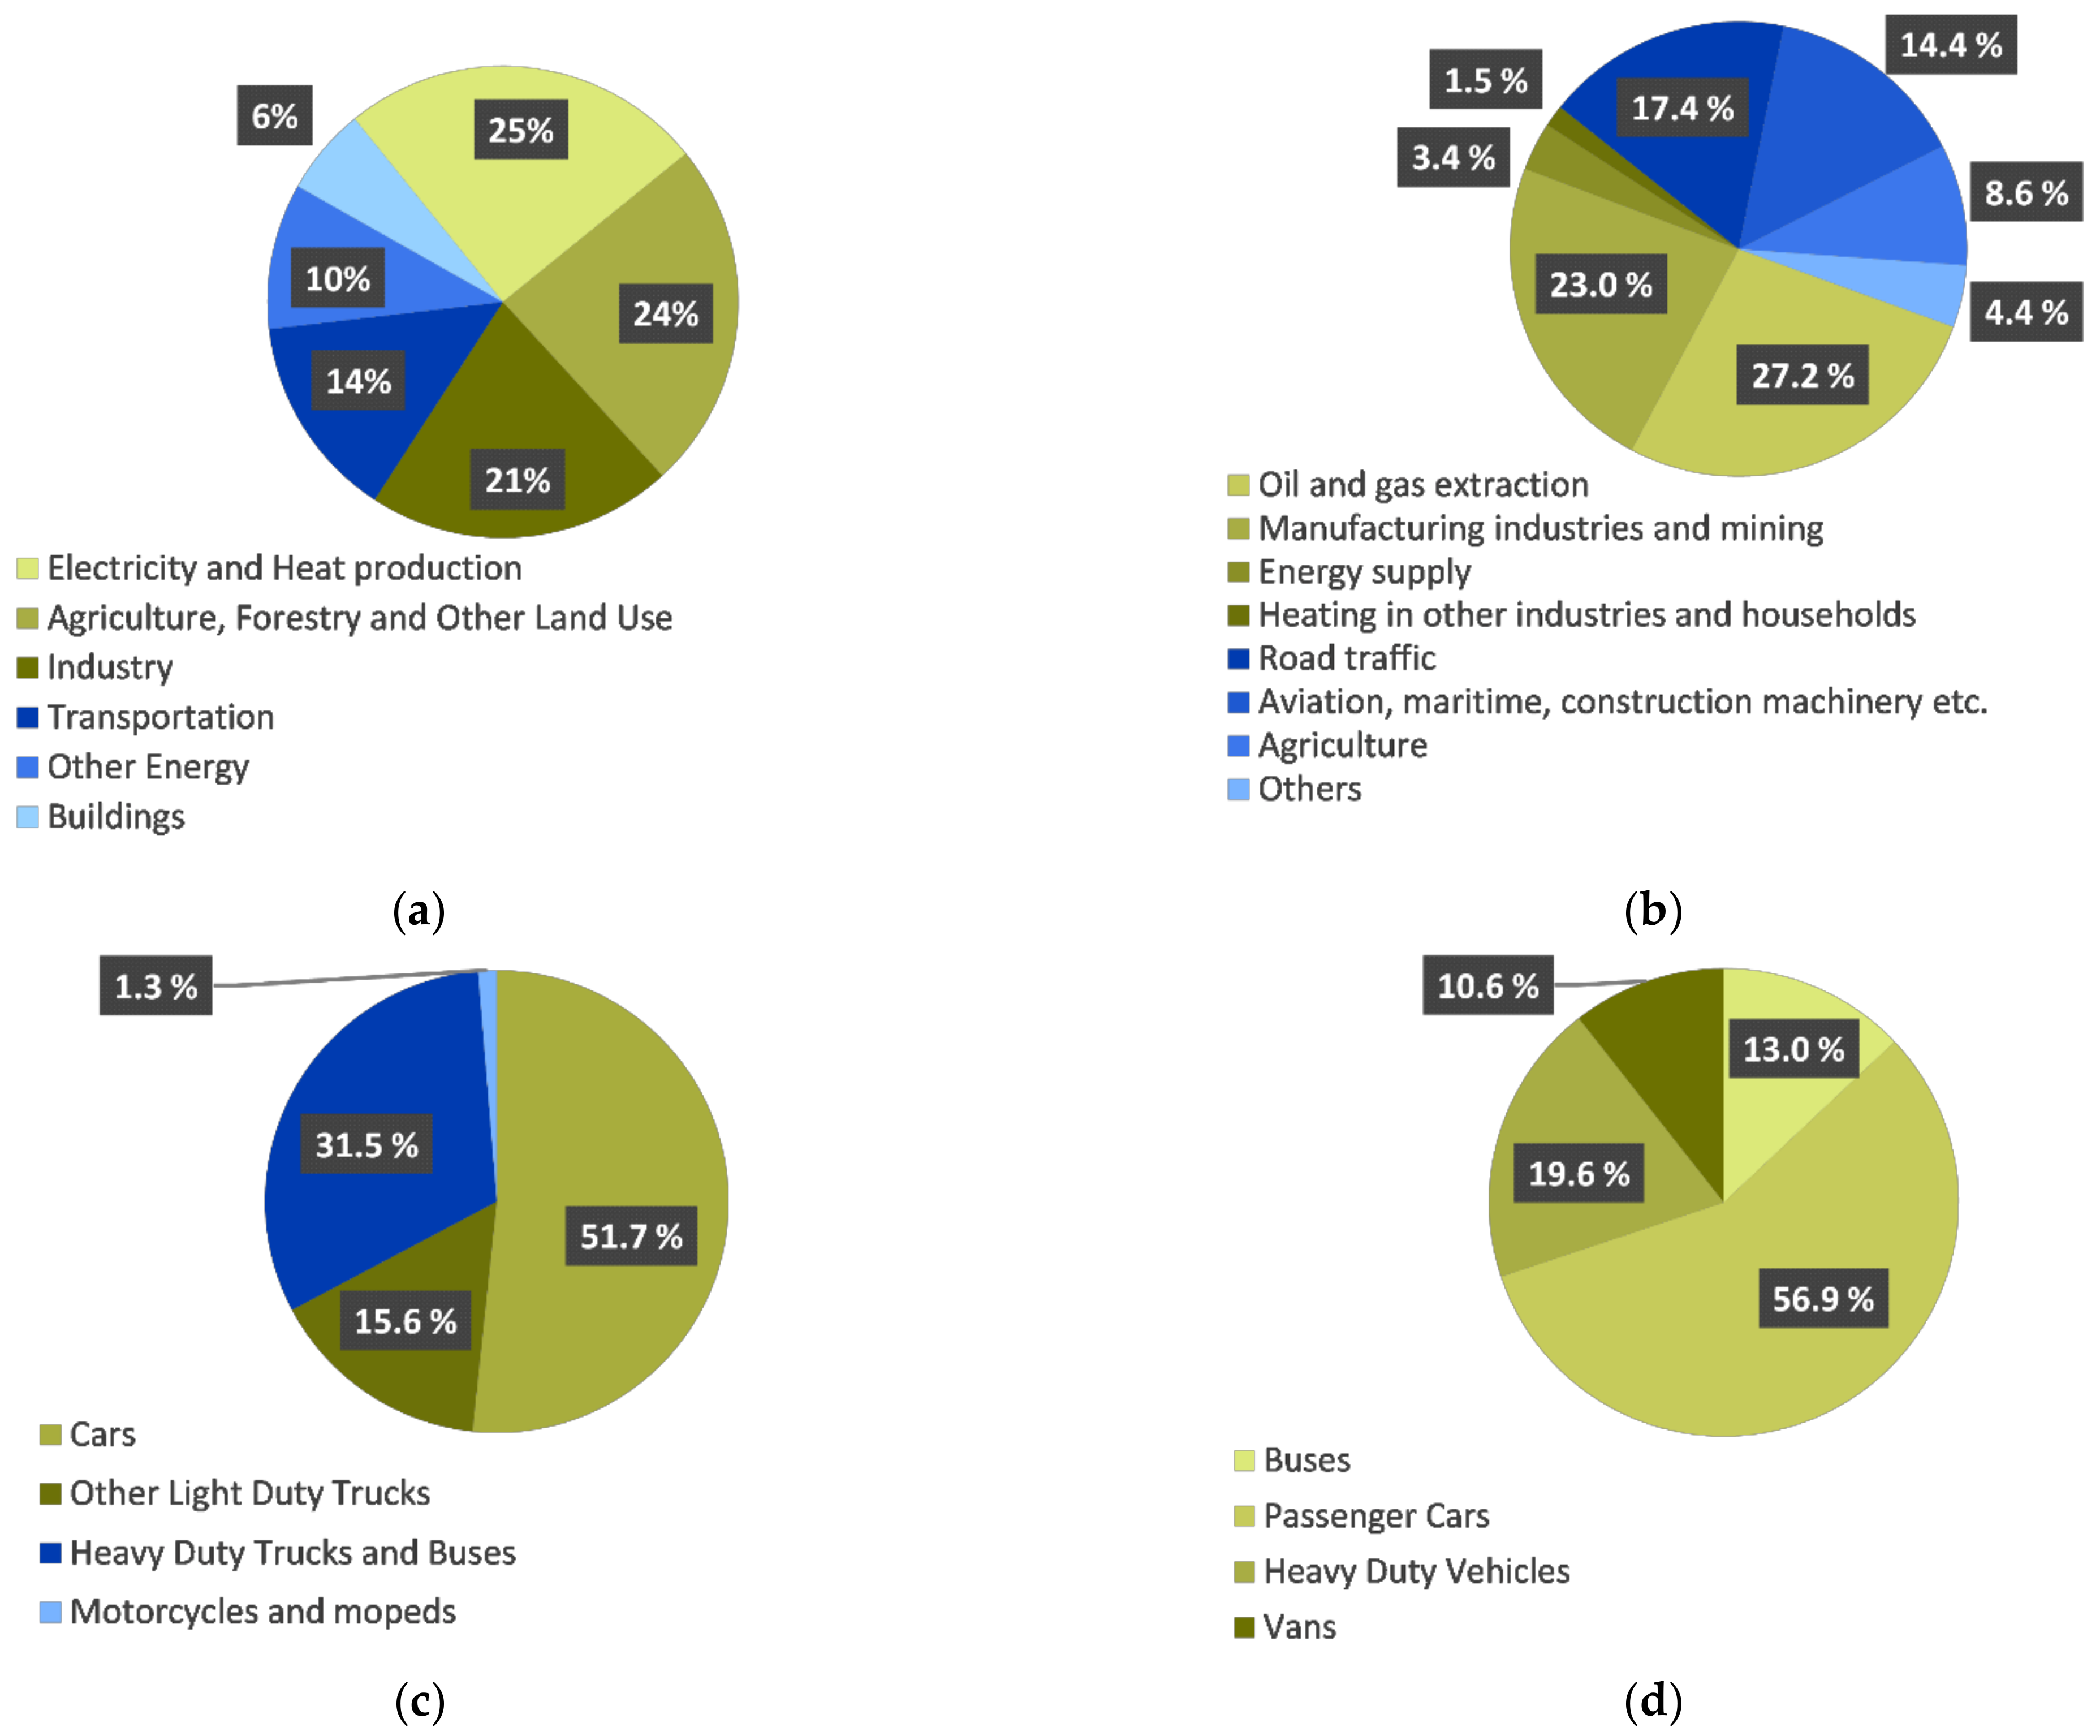
1.1.1. Transportation Emissions in Norway

Norway emitted 52 million tonnes of GHGs in 2018 [4], where over 17% was emitted from road transport (Figure 1c). Public transportation buses do not have their own registered emission category nationally, but are included in the emissions from heavy-duty vehicles (HDV), which emitted around one third of the emissions in 2018 [4,8]. In 2015, the emissions from road transport reached an all-time high with 9.98 million tonnes GHGs emitted [4]. The registered national and local emissions only include emissions that are emitted in the registered area (i.e., only local or direct emissions from combustion); therefore, on a national level, it is often falsely assumed that electrified transport and use of biofuels have almost zero emissions.
At the start of 2019, Statistics Norway (SSB) presented emissions per person-kilometre in Norway for passenger cars and city buses [9]. Even with an increase of kilometres driven from 1990 to 2018, emissions for both cars and city buses have decreased. This is due to increased use of low emission energy sources and more efficient drivetrains. However, in 2018, Trondheim buses had higher emissions per person-kilometres than passenger cars. This was suggested to be due to the increase of electric passenger cars on the road, and a low amount of the population utilising the public transportation system. Moreover, road transport constituted 34.2% of the total emissions in 2018 (156,000 tonnes of CO2-eq), an increase of more than 6% from 2017 [10]. Buses constitute 13% of the emissions, resulting in 20,000 tonnes of CO2-eq (Figure 1d). For the public transportation fleets to be competitive in the environmental aspect, new low emission fleets are essential [9].

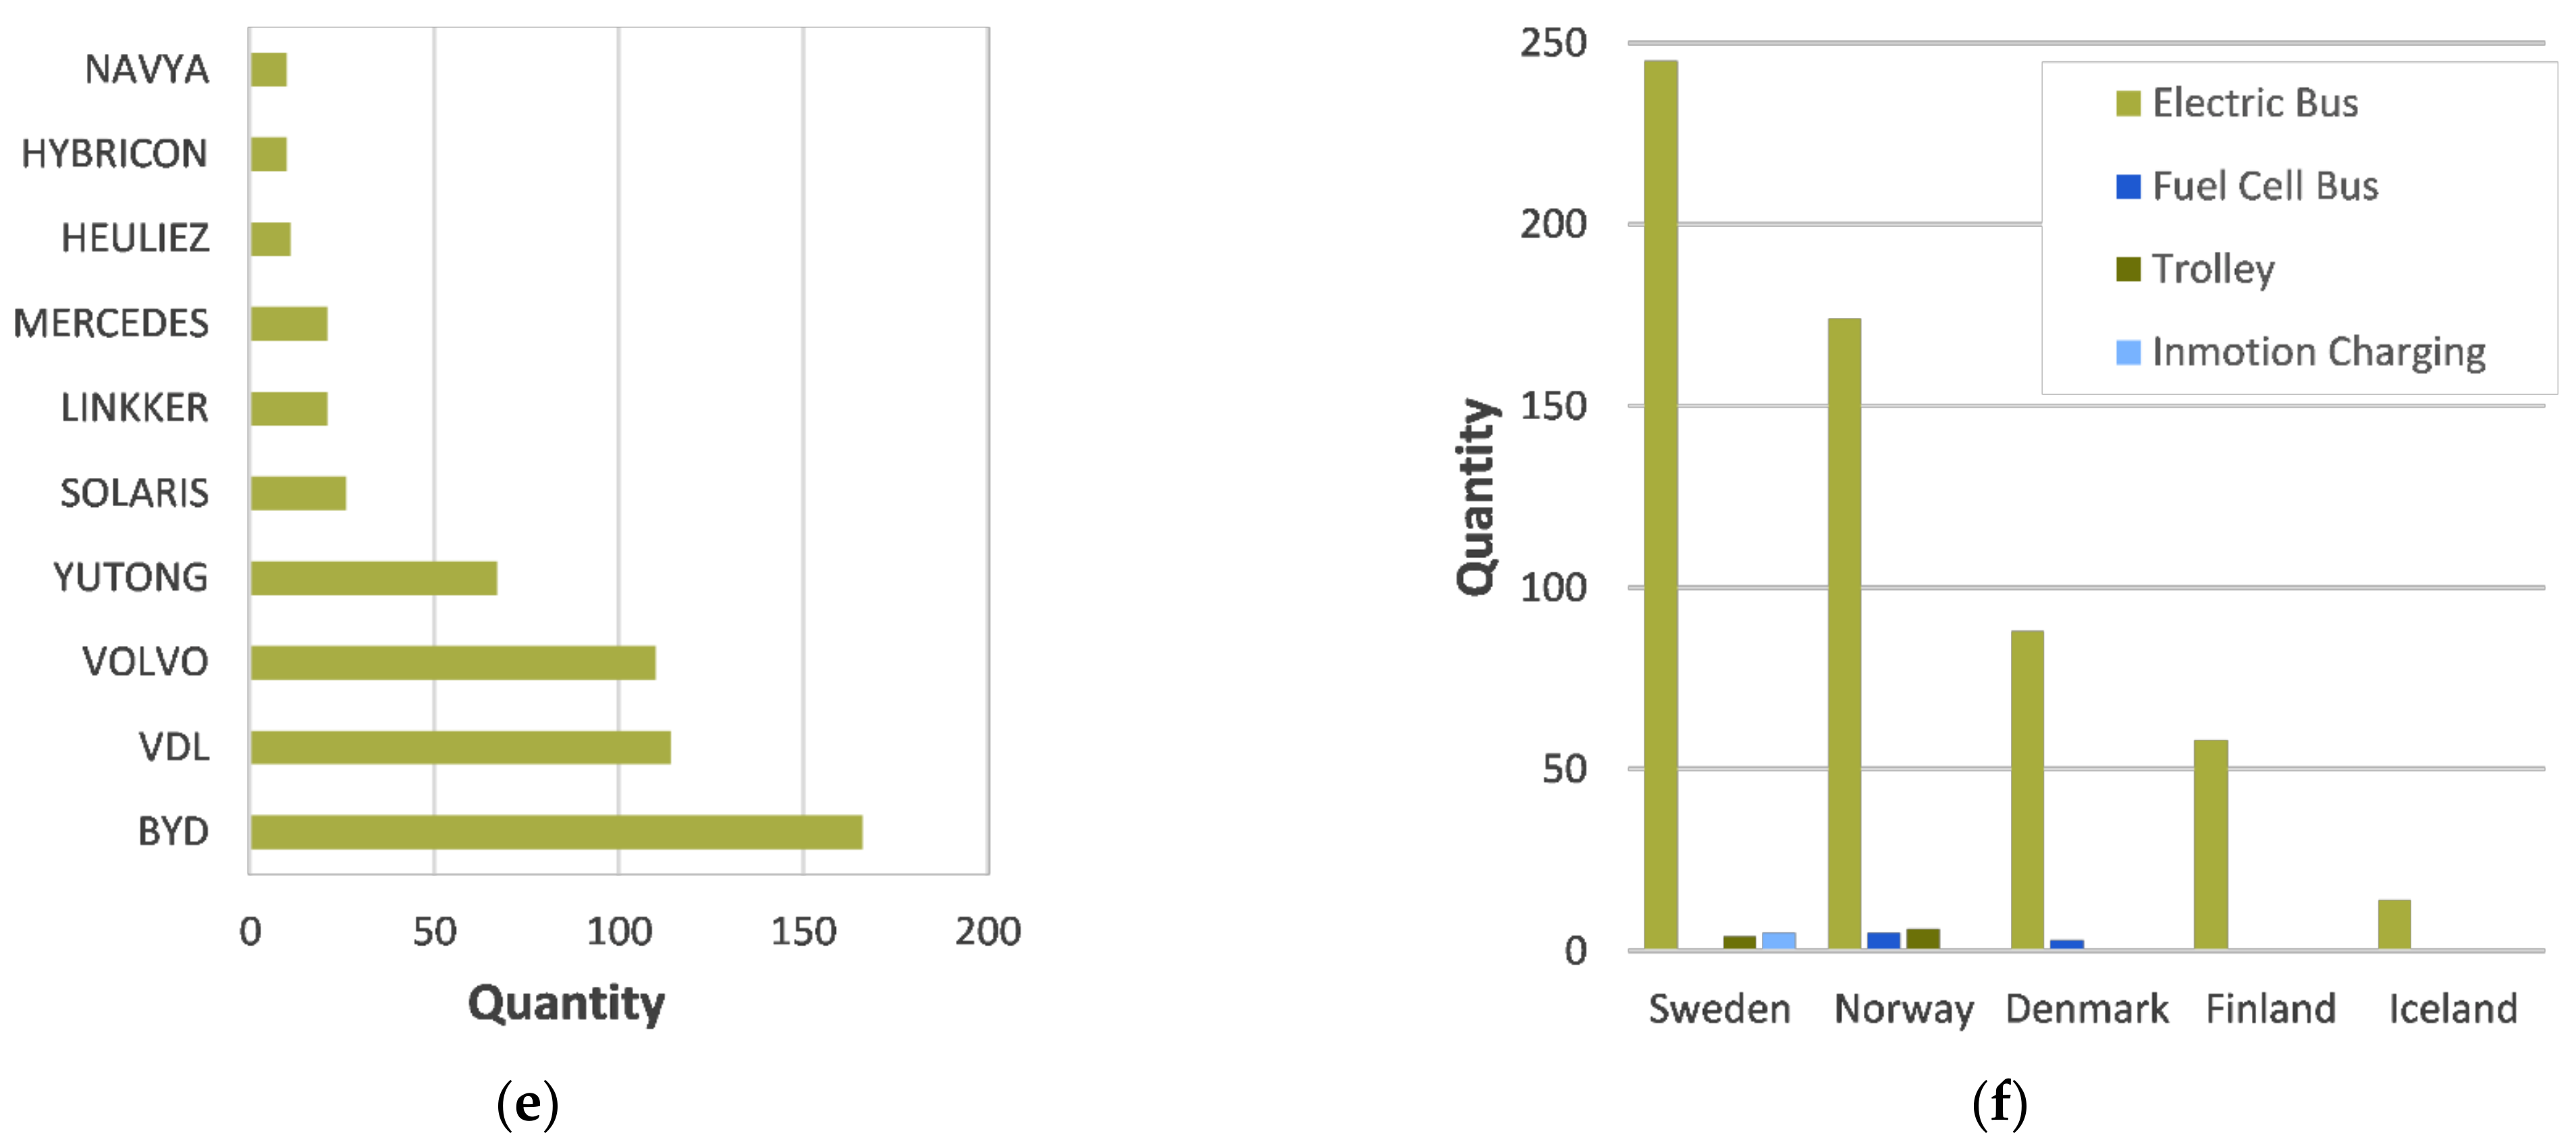
1.1.2. Current Public Transportation Fleets

In 2017, there were three million city buses operating globally, where 385,000 (mainly operating in China) were electrified. Multiple electrification projects were reported throughout Europe and America in 2019, and electrified bus fleets have become a reality in The Netherlands, UK, Germany and the Nordic countries [12,13]. There are multiple suppliers of electric buses in the Nordic countries (Figure 1e) [14]; however, the investments in Europe are miniscule compared to the investments in China [11,12,15]. Despite this, the implementation of electric buses is rapidly increasing. By the end of 2019, a total of 913 electric buses have been deployed in Nordic countries (Figure 1f) [11,12].

1.1.3. Political, Social and Economic Strategies

The total predicted emissions from road transport in Norway from 2021 to 2030 is 70.8 million tonnes of CO2-eq [2]. The measures defined to reduce these are divided into activity measures, electrification measures and increased usage of biofuel [2]. This is further defined in the various counties, with Trøndelag having the goal of a sustainable transport structure and climate neutral shuttle service by 2030 [16]. In 2017, they established a climate plan for 2030 where prominent climate goals were determined [17].
Norway has benefitted economically through the export of fossil energy reserves in recent decades. It has been shown that in many fossil energy-producing countries, the expansion of fossil exports has led to higher gross domestic product and higher wages per capita [18,19]. Interestingly, this has also been connected to the rapid drop in fossil fuels in the electricity mix of these countries, and the re-emersion of the tertiary industries. This suggests that fossil fuel producing countries (e.g., Norway) are rapidly transitioning from high to low GHG industries and energy mixes, and consigning fossil energy as a back-up technology for sustainable and renewable electrification [20].

1.2. Objective

This paper investigates how the electrification has impacted the bus fleet’s operating emissions, and considers the embedded emissions. Through a meta-analysis, different bus fleet scenarios are evaluated. The purpose is to give an insight into the environmental consequences pertaining to production and operation of electric buses.

2. Greenhouse Gases and Energy

2.1. GHG and LCA

The magnitude of the impact of greenhouse gases (GHGs) on climate change is calculated using a Global Warming Potential (GWP) [21], making it possible to compare different GHGs [22,23]. This GWP is used to calculate the emissions from different GHGs into what are coined CO2-eq [24]. By analysing the entire life cycle of a product through life cycle assessment (LCA), the total environmental impact can then be determined in several categories, including the GWP [25,26,27].

2.2. Energy

To analyse the impact of the fuel cycle, well-to-wheel (WTW) analysis is an important tool [28]. The emissions originate from both production (well-to-tank; WTT), and combustion (tank-to-wheel; TTW). Therefore, global and local emissions are an important aspect of energy emissions.
Renewable energy sources such as hydro, wind, solar and bioenergy have a smaller carbon footprint compared to fossil energy (Table 1) [29,30], whereas, fossil energy sources are non-renewable and emit large quantities of GHGs into the atmosphere during WTT and TTW [31]. Hydro, wind and solar energy are mostly converted to electric energy, while biomass can be utilised for transportation, heat and electricity production [32,33,34,35]. There are three ways to harvest the energy stored in biomass to produce thermal energy (Bio-Power): combustion, microbial digestion (e.g., anaerobic digestion), or conversion to a gas or liquid fuel (gasification) [33,36,37].

2.3. Power Market

Calculating GHG emissions from electricity can be intricate, as physical power flow from specific sources is difficult to track. Therefore, the power market consists of electricity mixes (el-mixes) produced from different sources. To account for the energy source, producers can request to be issued guarantees of origin (GOs). The purpose of the GO system is to give the consumer increased control to choose cleaner energy and increase the incentives to produce renewable energy [38]. Norway has mainly renewable power production (98% in 2018), but only a small part (about 15%) of the GOs are bought in Norway, with the rest being sold to other countries to give extra income, and replaced with a European attribute mix (EAM) in the national disclosure to avoid double counting [30,39,40]. The carbon intensity for Norwegian power production is 18.9 g CO2-eq/kWh (2018), but consumers who have not bought GOs have to declare 520 g CO2-eq/kWh (2018) [30] (Table 2).
Recently, a lifecycle thinking approach was conducted to assess the electricity sources for electric vehicles [41]. It was observed that the lowest GHG emissions were found in electricity generated by biomass, wind and solar; municipal waste incineration and natural gas had a medium impact; and, peat, coal, lignite and diesel had a high impact. Biomass, wind and solar derived electricity have also been shown to have a low impact in terms of human health, ecosystem damage and resource requirements [42].

3. Bus Production and Emissions

3.1. Electric Public Transport

There are three main types of electric vehicles: hybrid electric vehicles (HEV), plug-in hybrid electric vehicles (PHEV) and battery all-electric vehicles (BEV) (Figure S1). Both HEVs and PHEVs are driven by both an internal combustion engine (ICE) and an electric motor, with a fuel tank and a battery for their energy storage, respectively. Hybrid systems are advantageous over ICEs as the electric powertrain improves the efficiency of the ICE. Hybrids use batteries to power the vehicle, and the ICE is used to help when either extra range or power is required. In BEVs, the battery pack is often much larger than in hybrids, which results in a greater travelling distance and power for the electric motor [47,48].
A bus is constructed of many different components, which consist of various materials, including the powertrain. The typical method of describing the construction of a bus is by dividing it into two categories, the powertrain and the glider. The powertrain consists of all the components that provide power to the wheels (e.g., motor and controller), and the glider consists of the remaining components of the vehicle (e.g., body and wheels). This allows study and comparison of different powertrains, while keeping the glider consistent [49]. Volvo were the first bus manufacturer to stop the production of diesel buses, and are now on their third generation Volvo 7900 Electric bus, starting with a 12 m 76 kWh bus, to an 18 m or 18.7 m articulated bus with 396 kWh. The data obtained on the Volvo 7900 models were gathered from the LCA completed by Nordelöf et al. [50] for this study (Figures S2 and S3; Tables S1 and S2).
The most common battery technology used today is the lithium-ion battery (LiB), due to their high specific energy, power and energy density [51,52]. Currently, the majority of LiB production takes place in Asia where high-GHG energy is used, having significant environmental loads [49,53,54,55,56,57,58,59,60,61]. With the required reductions in carbon footprints and an increasing electrification of the transport sector, the demand for LiBs and the importance of clean energy for production are increasing. Therefore, Europe must boost their battery production activity, and several companies are investing heavily in this with clean energy production lines [62,63,64].

3.2. Production Theory

Bus production is a comprehensive process that includes several process chains [65]. The production starts with raw material extraction and material processing, continued by material production and component manufacturing. Finally, the bus is assembled with the glider and powertrain (Figure S4). Steel is a major component in buses, and the manufacturing can be either through a basic oxygen steelmaking (BOS; [66,67]) process or through an electric arc furnace (EAF; processed from recycled steel) process. The steel industry is energy intensive, as the BOS process requires a significant amount of thermal energy, while the EAF uses electricity. Primary aluminium production is much more energy demanding process compared to steel [68,69], which can have considerable GHG emissions. Alternatively, secondary aluminium production uses scrap aluminium, in a process similar to EAF for steel, which is an energy efficient method and can be more environmentally friendly compared to primary production (depending on the electrical energy used).
LiB battery packs consist of many different parts and can be divided into four main components (i.e., battery cells and packaging). The first step is to extract the materials, process them, manufacture components and form battery modules. Several modules are then combined into a battery pack [52,61,70]. The energy requirements for LiB production can vary widely depending on the local environment, the LiB chemistry and the production engineering [71,72,73,74]. Some studies have been made for the energy requirement, but these highlight that the energy required for production is not a static, scalable value, and can range from 44.7 to 138.4 kWh/kg of LiB produced [71,72,73,74,75]. The main contributors to energy consumption during the manufacturing process are seen in the electrode drying and the dry room facilities (Figure S4).

3.3. Bus Production

Full LCA studies on buses are limited; however, the reviewed studies [50,76,77,78] all analyse twelve-meter-long buses with comparable mass, with an assumed lifetime of twelve years (Figure 2a; Table S3). The studies observed considerable variations in emission results, which could be due to the year of the research, the quality and accuracy of the data obtained, electricity mix and differences in study boundaries. Technology has improved greatly in the last decades, explaining the decrease in production emissions, but this does not cohere with the results in some studies [76,77,78]. Their data is based on generic databases produced years before the study was conducted, which could result in higher emissions. The research performed by Nordelöf et al. [50] is based on manufacturing data as well as an Ecoinvent database from 2016, providing more up-to-date results. They observed the lowest emissions despite being the only study to include maintenance for the buses, new parts and oil. However, all studies are vague when explaining the boundaries of the production of buses, which makes it difficult to compare the difference in boundaries and processes.

3.4. Component Production

For a deeper understanding of the embodied emissions in a bus, it is necessary to analyse the component production, yet few detailed LCA studies are available. An alternative route is to scale component production emissions data from personal vehicles, as performed by Hawkins et al. [49], to a bus where component emissions were comparable to Nordelöf et al. [50] (Figure 2b; Table S4). Generally, the conventional and electric bus from Hawkins et al. [49] emits lower emissions than Nordelöf et al. [50], but the emissions from the body and chassis, are relatively similar for all models. The differences in emissions between the two studies could originate from imperfect estimations; however, the emissions provide a comparison for the validity of Nordelöf et al. [50]. The chassis, frame and body constitute the highest emissions in the various buses. The reason is that it constitutes a larger proportion of the bus weight. Interestingly, the powertrain in Hawkins et al. [49] has almost zero emissions compared to Nordelöf et al. [50].

3.5. Material Processing

Majority of the metals used in a bus consist of steel and aluminium (Table S5). Two dominant factors vital for the emissions are the boundaries (i.e., included steps in the process analysis) and electricity mix used.

3.5.1. Primary Production

Aluminium emits ca. 16,500 kg CO2-eq per tonne produced, while steel emit between 2000 and 2500 kg CO2-eq per tonne produced [89]. Several LCA studies support these emissions for primary steel and aluminium (Figure 2c) [79,80,81,82,83,84,85]. The variations in emissions observed between studies might be due to the carbon intensity in the respective electricity grids and the boundaries of the individual studies. In contrast to steel, the aluminium production chain emissions depend significantly on the carbon intensity off the electricity used (Figure 2d). This is supported by the study from the Aluminium Association, where 70 % of the electricity is from hydro power, leading to very low emissions [84].

3.5.2. Secondary Production

The increasing volumes of scrap metal in the world will have a bigger importance for the metal production in the future, with secondary metal production having generally reduced GHGs (Figure 2e,f). Burchart-Korol [81] showed that the energy demand and emissions in EAF are considerably reduced compared to BOS. However, Gao et al. [82] observed higher emissions in EAF compared to the BOS steel production, which might be described by the recycling process for steel, constituting 20% of their final reported emissions. Burchart-Korol [81] do not include the recycling process, which is an important factor on the GHG emissions in secondary metals. The Aluminium Association reports notably reduced energy consumption in secondary production, compared to primary production [84]. Lower energy consumption leads to lower emissions in production, reducing the total emissions by 86%. Hydro also present emissions data on their secondary aluminium product CIRCAL, produced from recycled material [85].

3.6. Battery Production

Several studies [86,90,91] have been completed to try to understand the impact from production and operation on energy consumption and GHG emissions (Table 3). There are big differences in the results, and this can be explained by examining the scope and boundaries of the studies. Additionally, the fast development in battery technology and renewable energy generation, as well as the collection and quality of data for the value chain of the battery production materials are important factors to consider when reviewing studies [92].
The 2014 study by Ellingsen et al. [61] investigates the environmental impact from a LiB vehicle pack with GHGs of 172 kg CO2-eq/kWh for LiBs. It concludes that the production impact of the battery is mainly caused by the manufacture of battery cells, production of electrode paste, drying and the anode current collector. Also, it is stated that it is possible to reduce the GWP impact from production by more than 60% if the el-mix used in cell manufacturing is based on hydroelectric power. The el-mix used in the study had a carbon intensity similar to natural gas-based electricity generation. The 2016 study by Ellingsen et al. [60] examined how the size and range of an electric vehicle influences the GHG emissions, leading to lower GHGs of 119 kg CO2-eq/kWh for LiBs. Peters et al. [58] identified and reviewed 113 available LCA studies on LiB production and electric mobility. They examined cumulative energy demand (average 1182 MJ/kWh) and GWP (average 110 kg CO2-eq/kWh) from different LiB chemistries and considered the impact of cycle life and charging. The study found large variations in results from the reviewed publications and suggests this is due to differing assumptions regarding key parameters like lifetime, energy density and manufacturing demand.
Romare and Dahllöf [87] examined the life cycle energy consumption and GHG emissions from a lithium-ion battery pack with focus on light vehicles. They reported an energy demand of 350–650 MJ/kWh and a carbon intensity of 150–200 kg CO2-eq/kWh. The authors state that the data suggests a near-linear scale-up of GHG emissions with capacity and weight. Another conclusion is that the el-mix used for production greatly impacts the results. Dai et al. [88] estimated the energy consumed for an NMC111 battery is 1125 MJ/kWh. They also argue that the energy use in cell production and battery pack assembly is much lower than found in earlier studies, with 216.2 MJ/kWh cell produced. This differs from the value found by Ellingsen et al. [61], but is more in line with the updated value by Ellingsen et al. [60]. However, Dai et al. [88] includes a much higher heat and electricity consumption in their observations. The study by Emilsson and Dahllöf [75] is an update on the study by Romare and Dahllöf [87], and is heavily based on the data presented by Dai et al. [88]. The authors conclude that the GHG emissions are 61–106 kg CO2-eq/kWh LiB capacity for the NMC111 chemistry. The difference mainly depends on the el-mix used in cell production, and they state that the maximum value would be 146 kg CO2-eq/kWh if less transparent data were used. The battery production emissions and energy requirements from the different studies can be seen in Figure 2g. The emissions have significantly decreased over the last years, yet the energy demand seems to have increased [88].

4. Case Study-Trondheim, Norway

Three fleet scenarios have been studied (Table 4). For simplicity, it is assumed that all the bus lengths are 12 m. The bus fleets are complex, and many factors are important for the outcome of the results; therefore, to be able to conduct the calculations and analyses, it was necessary to define some assumptions and simplifications (Table 5). The battery data was obtained from Nordelöf et al. [50] and AtB, and the yearly driven distance and lifetime from AtB.

4.1. Bus Model

Since most of the electric buses implemented in the Trondheim area are the Volvo 7900, the case study focuses on this bus model based on data presented by Nordelöf et al. [50]. First- and second-generation Volvo 7900s are examined, to achieve a thorough analysis of both the material and component production. The material analysis is based on the emissions from the first generation [50], and the component analysis is based on the third generation, where a larger battery pack of 200 kWh is used. The carbon intensities used for the production are 119 kg CO2-eq/kWh battery, 2.24 tonnes CO2-eq/tonne steel and 16.5 tonnes CO2-eq/tonne aluminium (Section S1).

4.1.1. Battery and Bus Construction Estimations

To provide realistic bus models, the weight of the batteries is estimated based on data from Ellingsen et al. [60] (Figure S5; Tables S6–S8).

4.1.2. Material Emissions

Analysed upstream processing emissions for different buses are visualised in Figure 3a. The conventional aluminium bus in Kärnä’s [65] study is a conventional bus with an aluminium chassis and reports the steel and aluminium emissions, while they were estimated for the Volvo models (total Volvo 7900 emissions are presented in Figure 3b). It is important to note that in the electric model steel accounts for over 50% of the bus weight, but only 19% of the material processing emissions, while aluminium accounts for only 9% of the bus weight, but constitutes around 24% of the material emissions. The conventional bus has the lowest embedded emissions, while the all-electric has the highest (Figure 3b). The upstream material emissions constitute the largest proportion of the total emissions in the Volvo 7900 models. Moreover, steel and aluminium account for 27% of the total embedded emissions in the all-electric, and 32% in the conventional model. The emissions from steel and aluminium are similar for all four models (Tables S7 and S8).
The carbon footprint from bus usage will depend on which powertrain is used. An all-electric bus charged with the Norwegian el-mix will emit 78% less than the conventional diesel bus over its lifetime (Figure 4c). The largest differences are caused by the emissions from operation, but there are also some differences in the embedded emissions for the different powertrains. The largest difference in embedded emissions is found between the electric and conventional bus models, where the electric bus emits 47 tonnes CO2-eq more than the conventional bus due to battery production (Figure 3c). Material emissions from the HEV, PHEV and all-electric models are very similar (Figure 3b), implying that the battery material production has a low impact, yet battery capacity can significantly alter these. These results imply that the main contributor to the emissions from the battery production is the manufacturing and maintenance, not the material production. This is in-line with the earlier studies [60,61,87,93] on battery production emissions, but contradicts recent findings [75,88], suggesting the upstream material production is a significant contributor to the emissions, and the difference in the material emissions should be higher than documented.

4.1.3. Component Emissions

The component emissions from Nordelöf et al. [50] are visualised in Figure 3C, with estimated battery emissions of 119 kg CO2-eq/kWh [60]. The electric model emits the most GHGs, while the conventional emits the least (Table S7). The chassis and body constitute the largest share of the emissions for all models, but the proportion depends on the degree of electrification. The chassis and body emit the same for each of the Volvo models, while the powertrain and battery emissions vary. For the all-electric bus, the battery emits 48 tonnes CO2-eq, accounting for 31% of the emissions. The chassis and body account for 90% and 61% of the emissions in the conventional and electric bus, respectively.

4.1.4. Carbon Payback Time

The carbon payback time (CPBT) is defined as the number of kilometres the all-electric bus must drive to emit the same amount of GHGs as the other buses. Figure 4a shows the simulations conducted for calculating the CPBT for the various technologies. The slope of the PHEV models vary based on its charging mix; therefore, to get the CPBT compared to the PHEVs, a simulation was performed for each charging mix (Table 6; Figure 4b; Section S1). The electric bus has a short CPBT compared to the conventional diesel bus, regardless of the charging el-mix. It increases slightly for the HEV diesel, and even more for the PHEV diesel. Compared to the HVO buses, the CPBT will also be longer for the more electrified options, excluding the EU-mix for charging, as the CPBT will be shorter for the PHEV than the HEV in this case. The electric bus charged with the NO-GO el-mix will never get on par with the HVO-HEV and HVO-PHEV. This means with this el-mix, the all-electric bus has a higher emission intensity per kilometre driven, and will be worse than the HVO buses, independent of the lifetime.

4.1.5. Lifetime Emissions

GHG emissions for the whole lifetime of a bus with different powertrain technologies are presented in Figure 4c. The error bars for the PHEVs represent the difference in emissions for charging with the NO-GO el-mix (highest GHGs) and the Norwegian production el-mix (lowest GHGs). By utilising a diesel HEV and PHEV, the GHG emissions compared to the conventional option can be reduced by one-third and by a half, respectively. The embedded emissions become a larger contribution to the carbon footprint as the operation emissions decreases. The embedded emissions contribute between 12–26% of the total lifetime emissions for the diesel options, 22–41% for the HVO options and 40–80% for the all-electric options. For the all-electric option with Nordic el-mix, the embedded emissions constitute 67% of the carbon footprint, and of these, the battery production emissions constitute 22%. The carbon footprint reduction compared to conventional diesel bus is 30–49% for the diesel PHEV and 58% for HVO-HEV. For the electric options charging with different el-mixes, the reduction is 56% for the EU-mix, 74% for the Nordic mix, 78% for the Norwegian mix and 38% for the Norwegian without GO. Comparing the all-electric scenario with NO el-mix to the NO-GO el-mix, there is a reduction of 64% in the carbon footprint.
The amount of GHG emissions from the PHEV options depends on the charging el-mix. Charging with a mix corresponding to the final residual mix for Norway (NO-GO), the emissions would almost be the same over the lifetime as for the diesel options. However, for the HVO, the PHEV would have a larger carbon footprint. Therefore, choosing between the HVO-HEV and PHEV will not be a universal decision, but depend on the carbon intensity for the charging el-mix. An electric bus charging with the EU-mix will have less emissions than all the diesel options and the conventional HVO, but higher emissions than the HVO-HEV and PHEV. By taking a wide approach with a European perspective, it seems HEV and PHEV buses running on HVO can be more environmental friendly than the all-electric buses. This means if all of Europe with the current EU el-mix are going to buy new buses, HEV and PHEV with HVO could be the better alternatives to achieve minimal GHG emissions over the lifetime.

4.2. Results

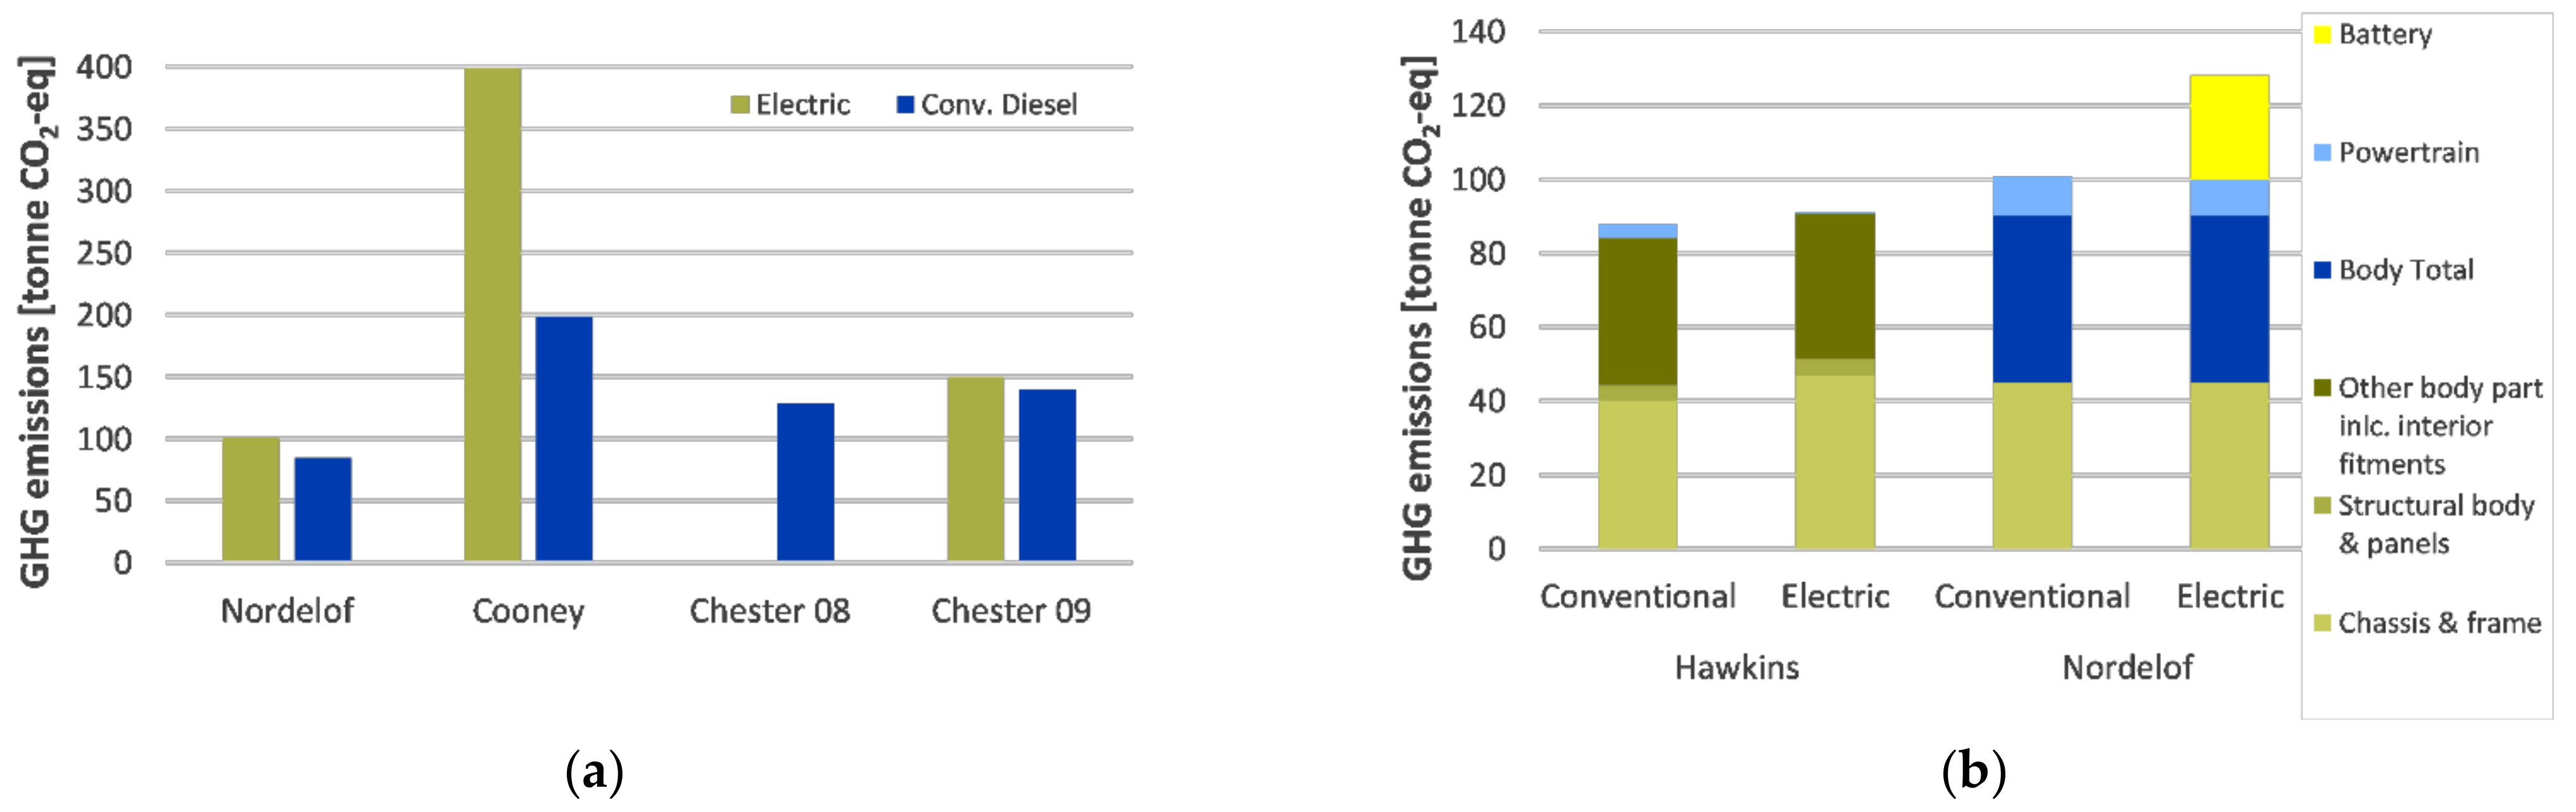
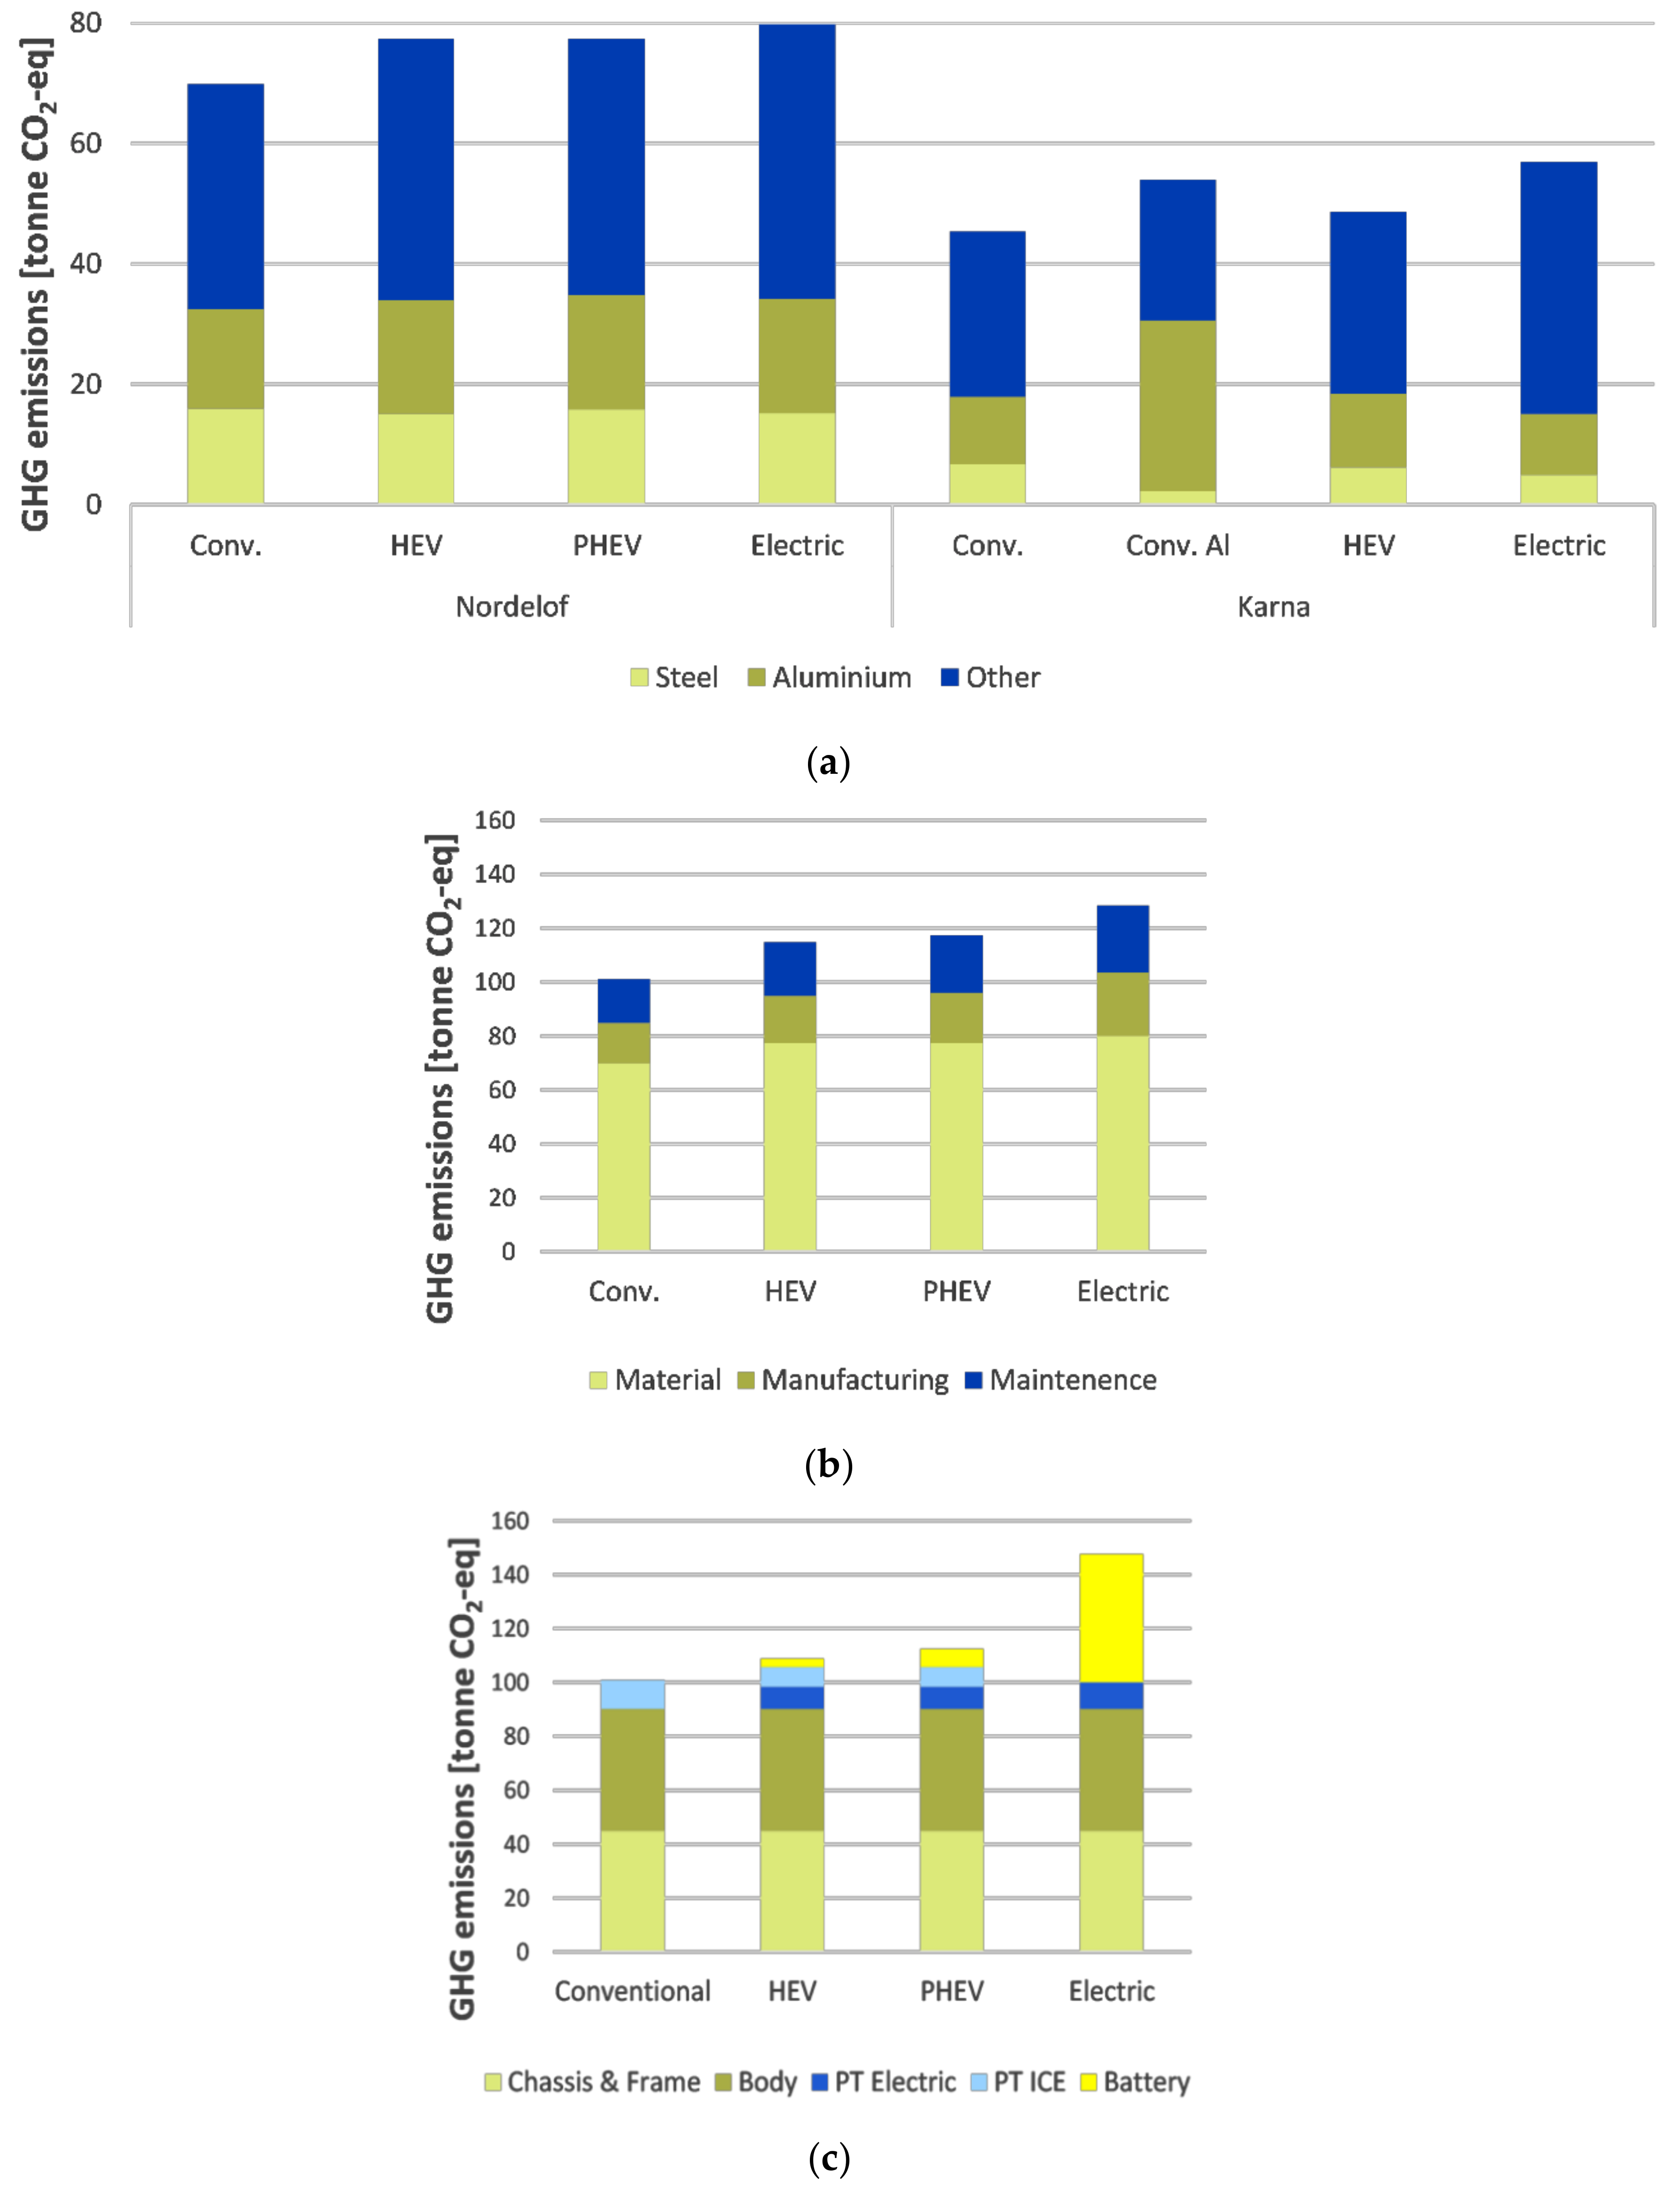
4.2.1. Production Emissions

The embedded emissions of the buses accumulate to the total emissions of the bus fleets depending on the bus type (Figure 5a), and are evenly allocated to each kilometre based on the total lifetime. The embedded emissions for the current and previous fleet is similar, while the electric fleet has larger embedded emissions. The difference mainly stems from the battery, which constitutes one third of the emissions. Throughout the lifetime, the fleet scenarios emit 0.17 (2018), 0.18 (from August 2019) and 0.25 (all-electric) kg CO2-eq per kilometres driven (Table S9). The chassis and body encompass the greatest share of each fleet scenario’s emissions. The bus fleet transition from 2018 to 2019 has an increase of embedded emissions of 6%, while further electrification increases the embedded emissions by 38% from the 2019 fleet.

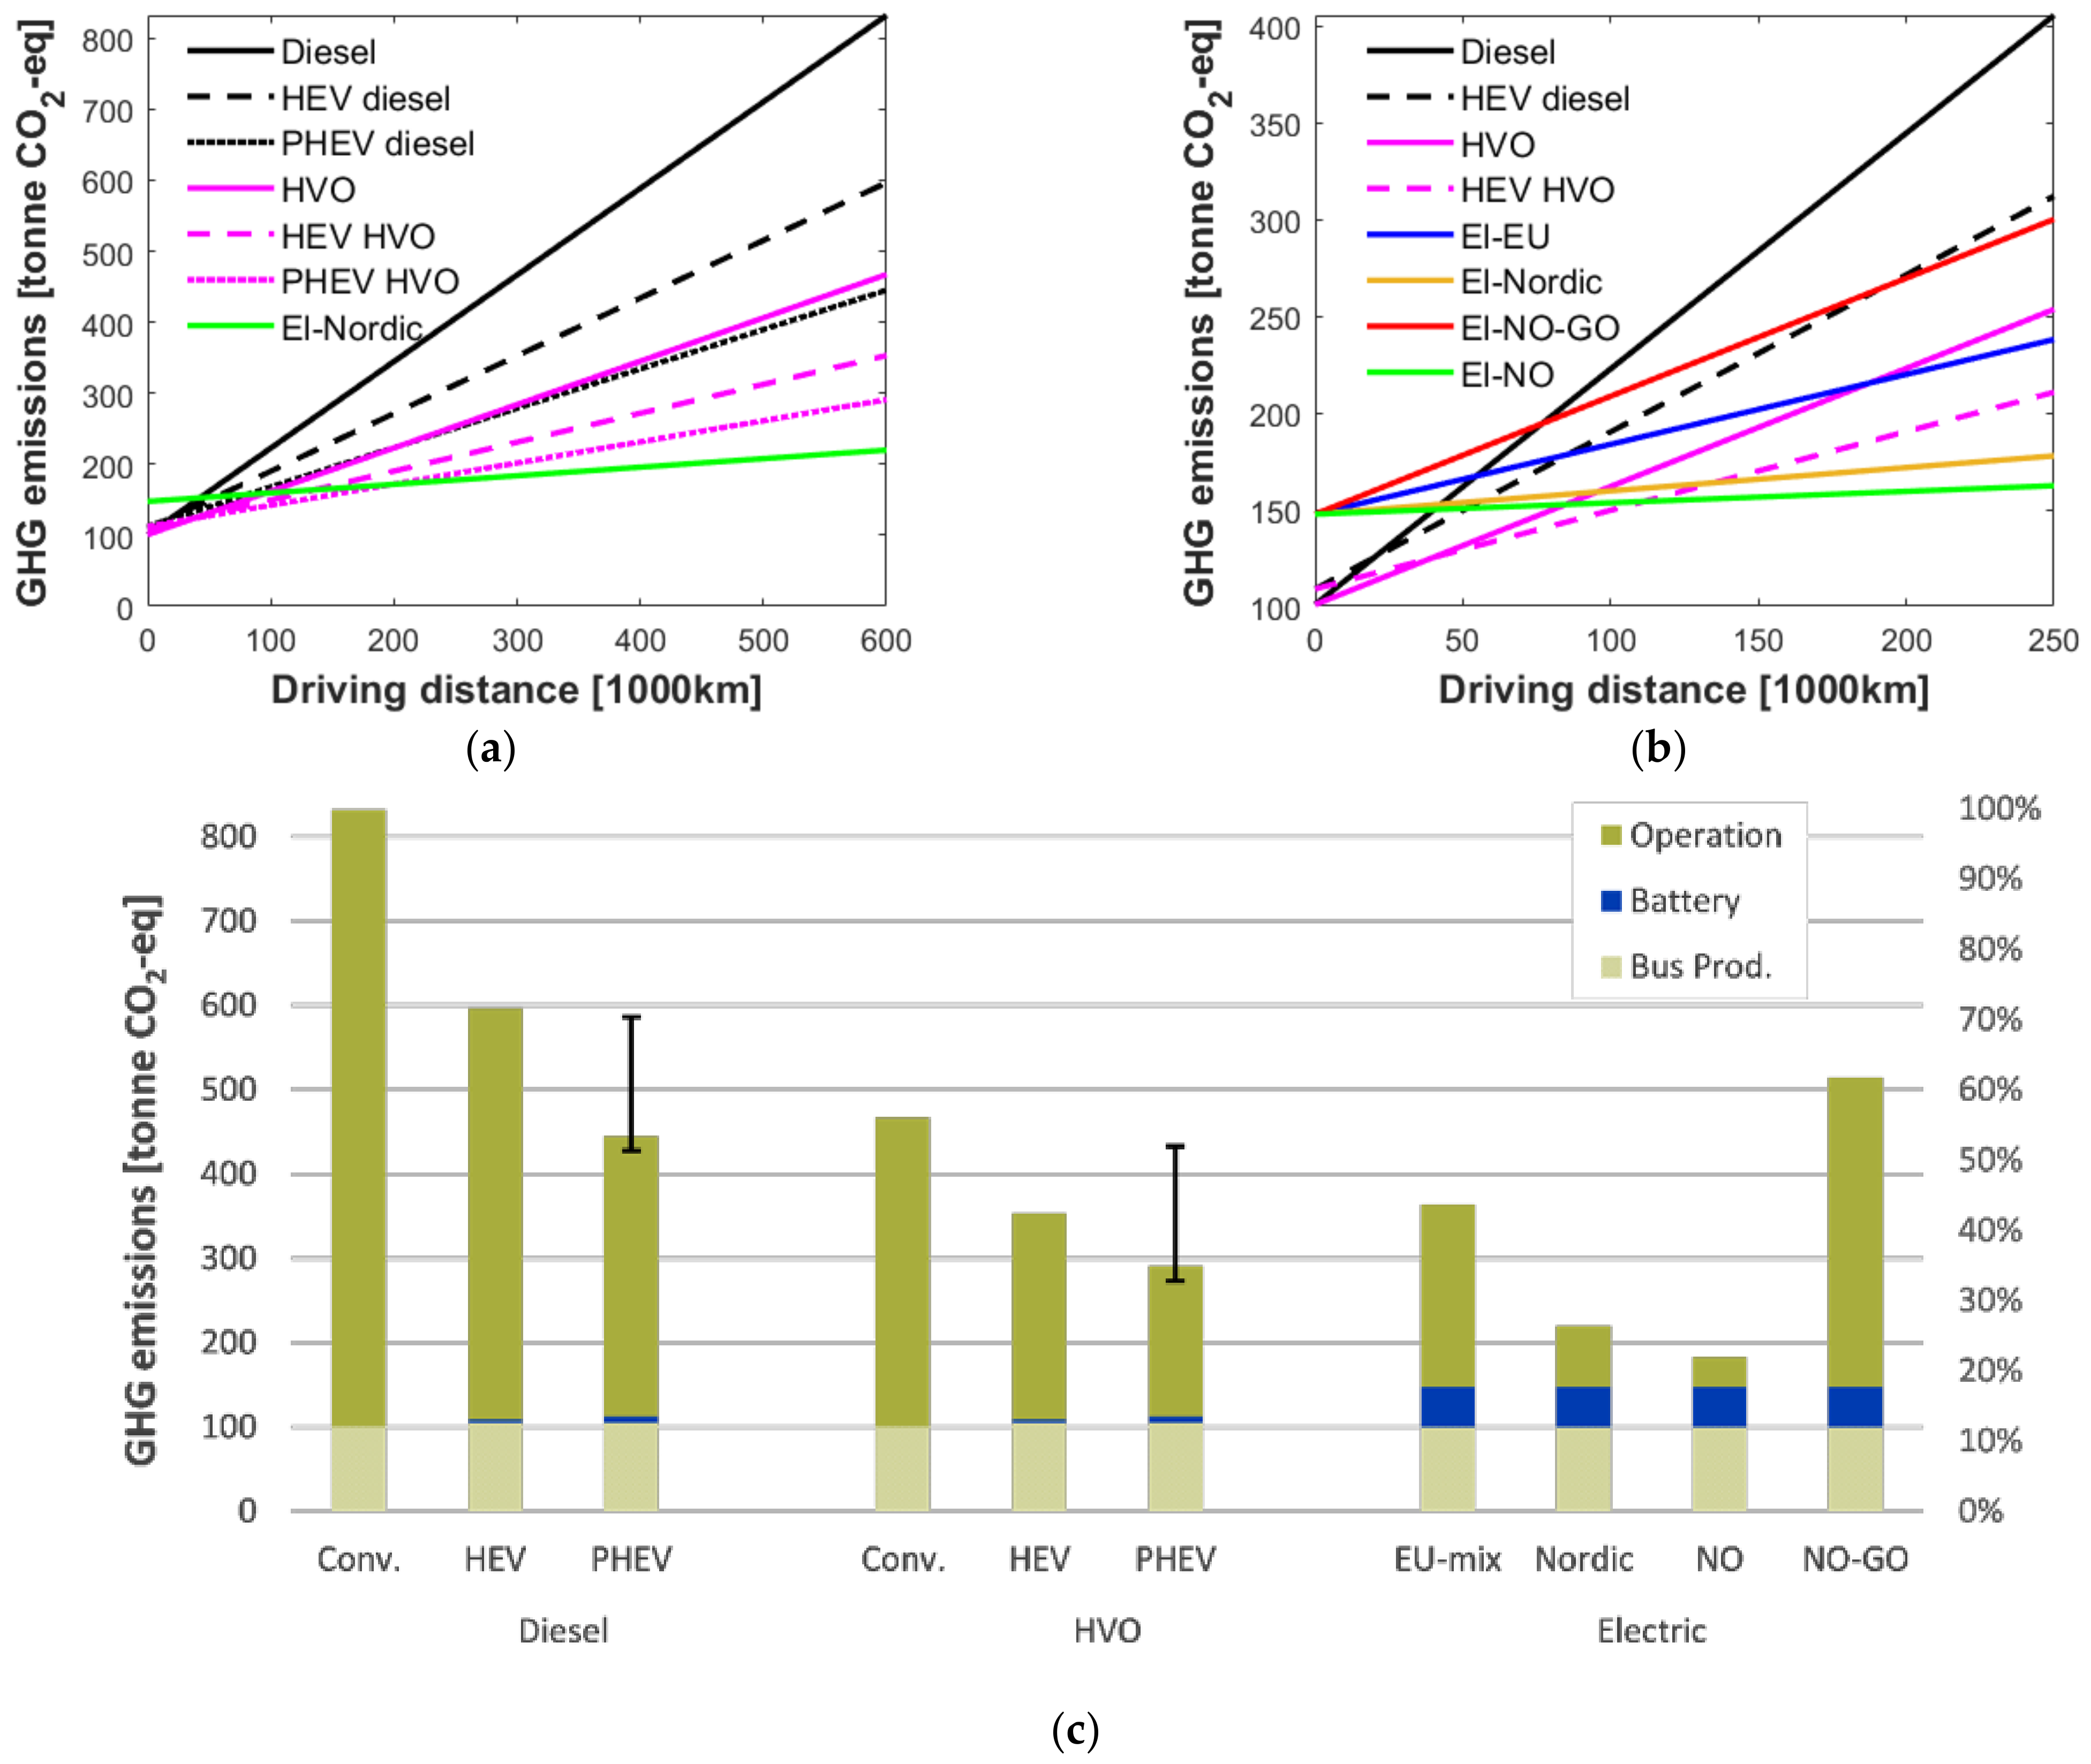
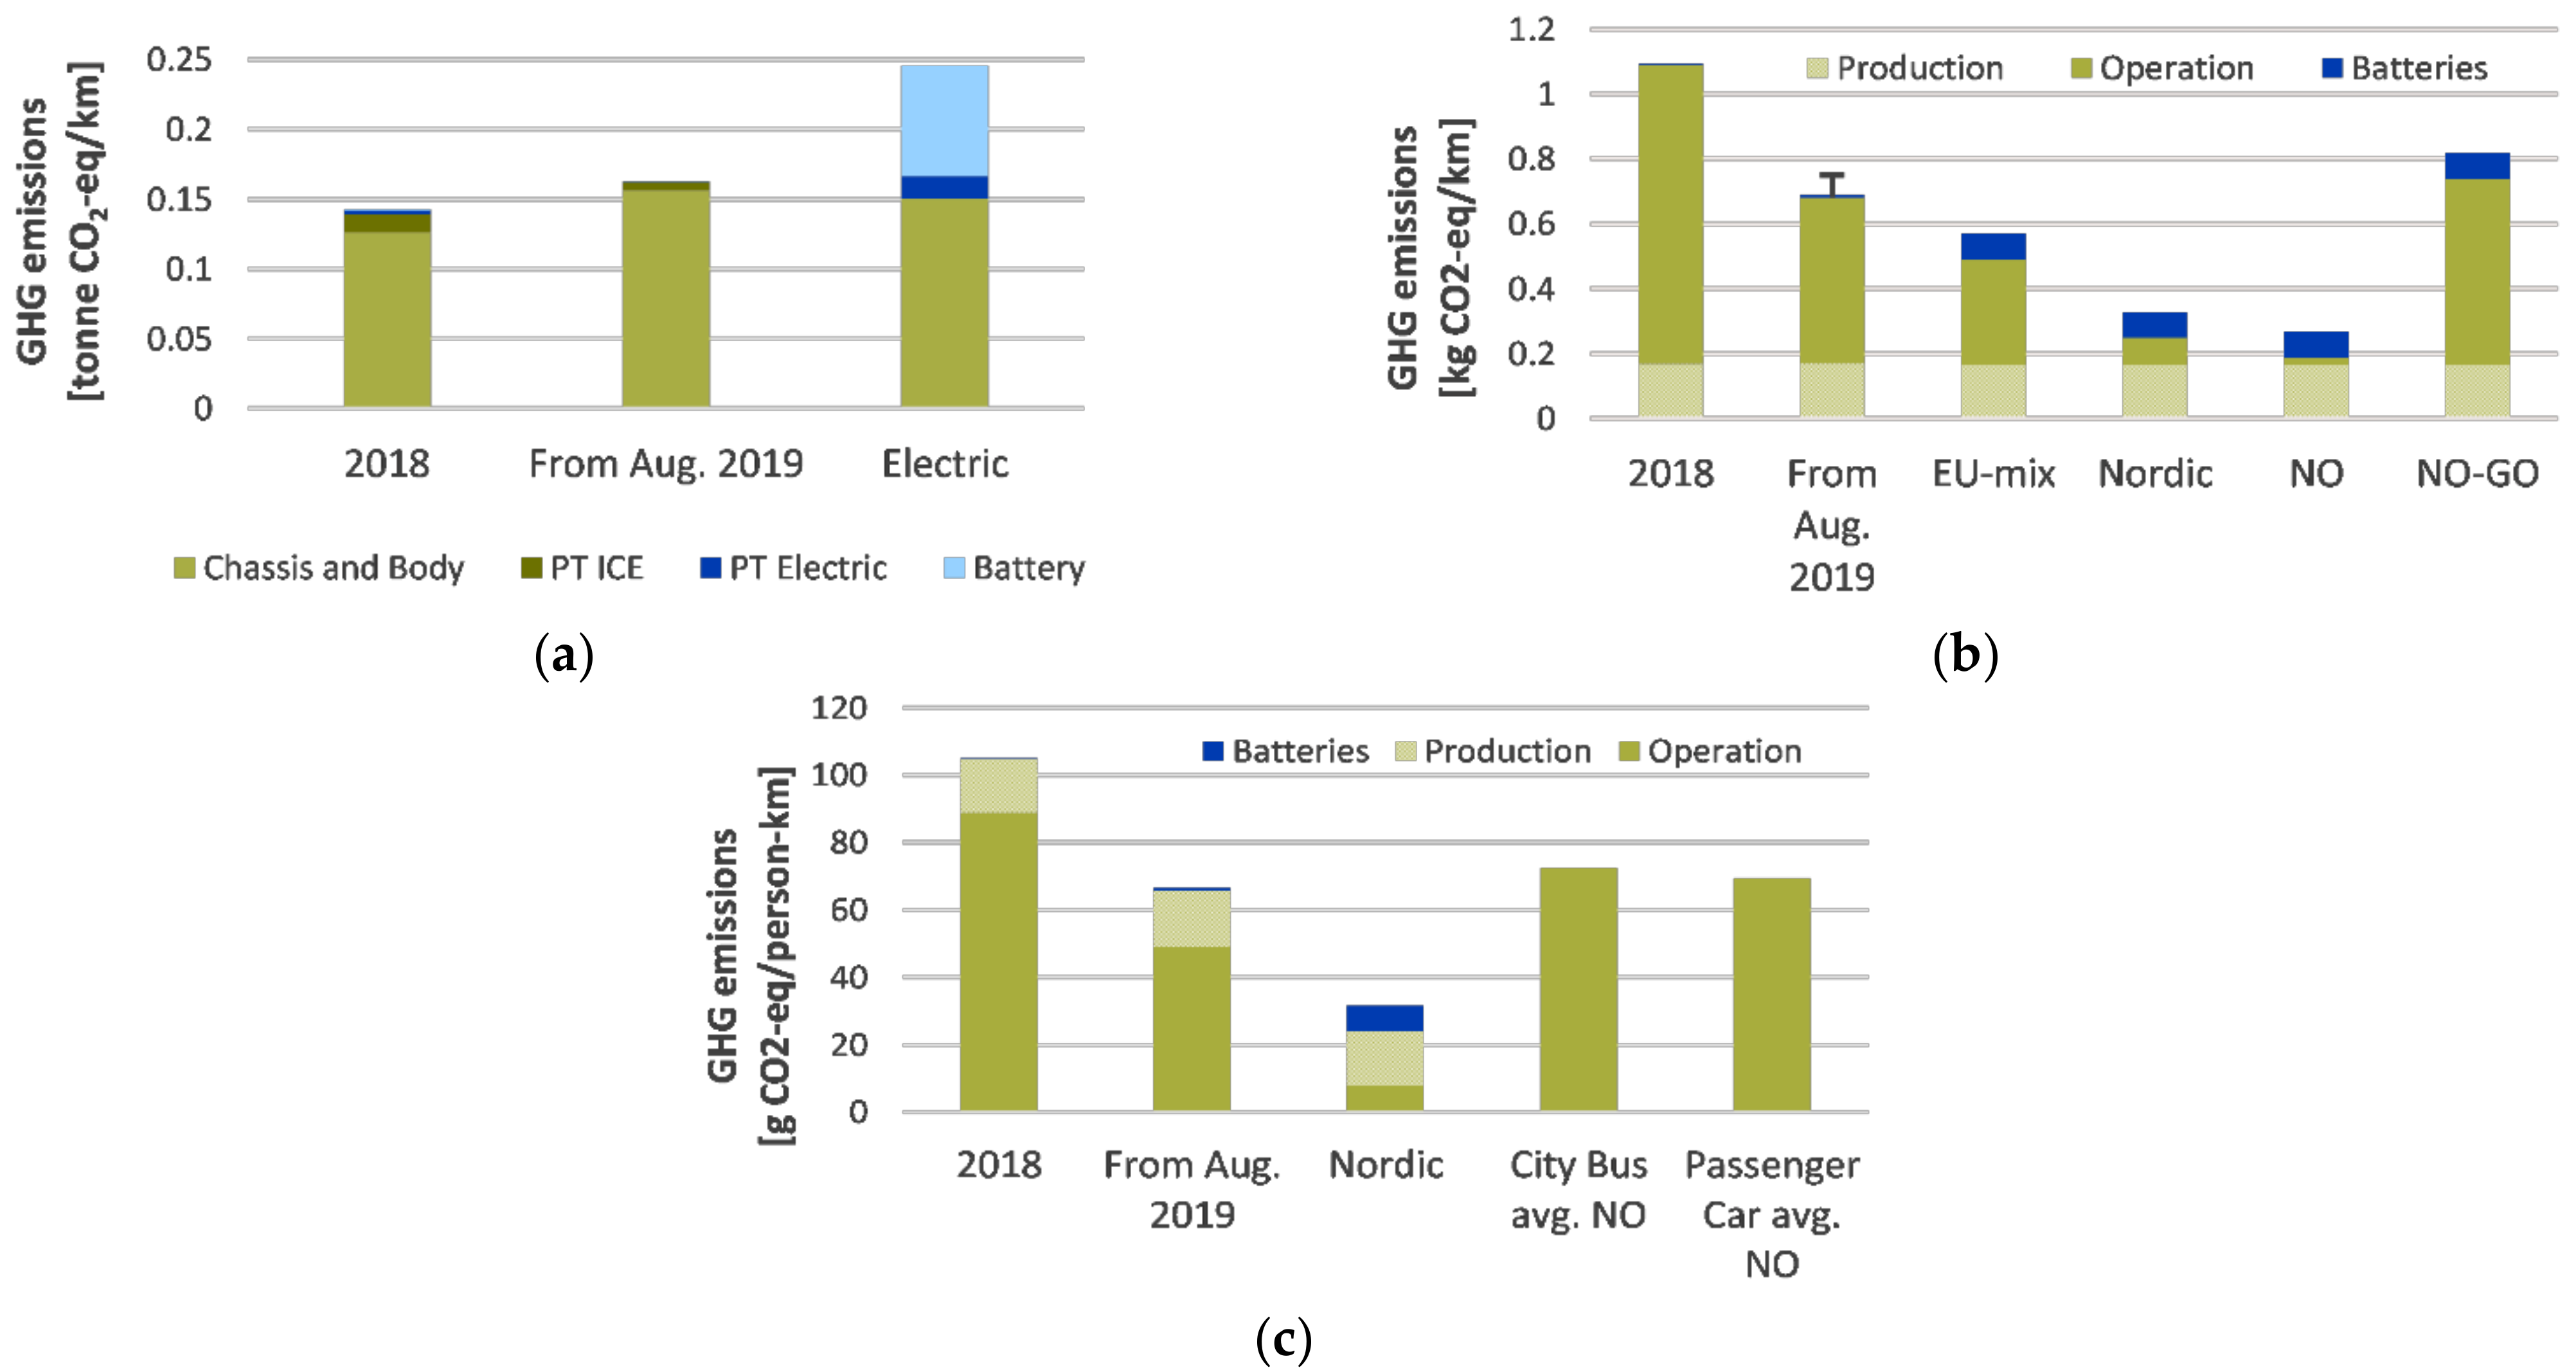
4.2.2. Lifetime Emissions

Figure 5b presents total emissions from the fleet scenarios in Trondheim. The data from the 2018 and 2019 operations are GHG emissions provided by AtB, in addition to the electricity consumption for the electric buses in the electric scenarios (Section S1). The carbon footprint is reduced by 37% from 2018 to after August 2019. The August 2019 bus fleet also has lower emissions than the electric fleet charged with NO-GO el-mix. Charging an all-electric bus fleet with Nordic el-mix or Norwegian production el-mix, will lead to a large reduction of the carbon footprint. When comparing an all-electric fleet with the current fleet, the GHGs can decrease up to 52% and 61% for the Nordic el-mix or Norwegian production el-mix, respectively. Charging the current fleet with NO el-mix will lead to a 10% reduction compared to charging with the NO-GO el-mix, as represented by the error bar.
The fleet emissions are also analysed for person kilometres to provide the possibility to compare the bus fleet in Trondheim to passenger cars and city bus averages (Figure 5c). The emissions from city buses and passenger cars are averages from 2018, and are presented as a comparison to the emissions from the bus fleets. These averages do not account for the emissions from charging electricity and production, and all-electric vehicles are defined as having zero emissions. The operation emissions were 89 g CO2-eq/person-km for the 2018 bus fleet, and it was reduced to 49 g CO2-eq/person-km by introducing the new fleet. The average values for 2018 in Norway for city buses and passenger cars were 72.5 g CO2-eq/person-km and 69.5 g CO2-eq/person-km, respectively (Table S10).
The new bus fleet has a lower carbon footprint than both the average car and city bus even though the averages only include the operation and assume zero emissions from charging electricity. Assuming that electric- and biofuel buses have zero emissions is misleading, and is done in most climate accounts in Norway [2]. If only the operation emissions are compared, the new bus fleet shows an even greater reduction per person-km. This implies that travelling with any bus in the Trondheim area will on average be more environmentally friendly than travelling with an average car or city bus in Norway.

4.3. Sensitivity

A sensitivity analysis was performed for electricity carbon intensity and battery capacity, as they were identified as key parameters that can have a significant impact.

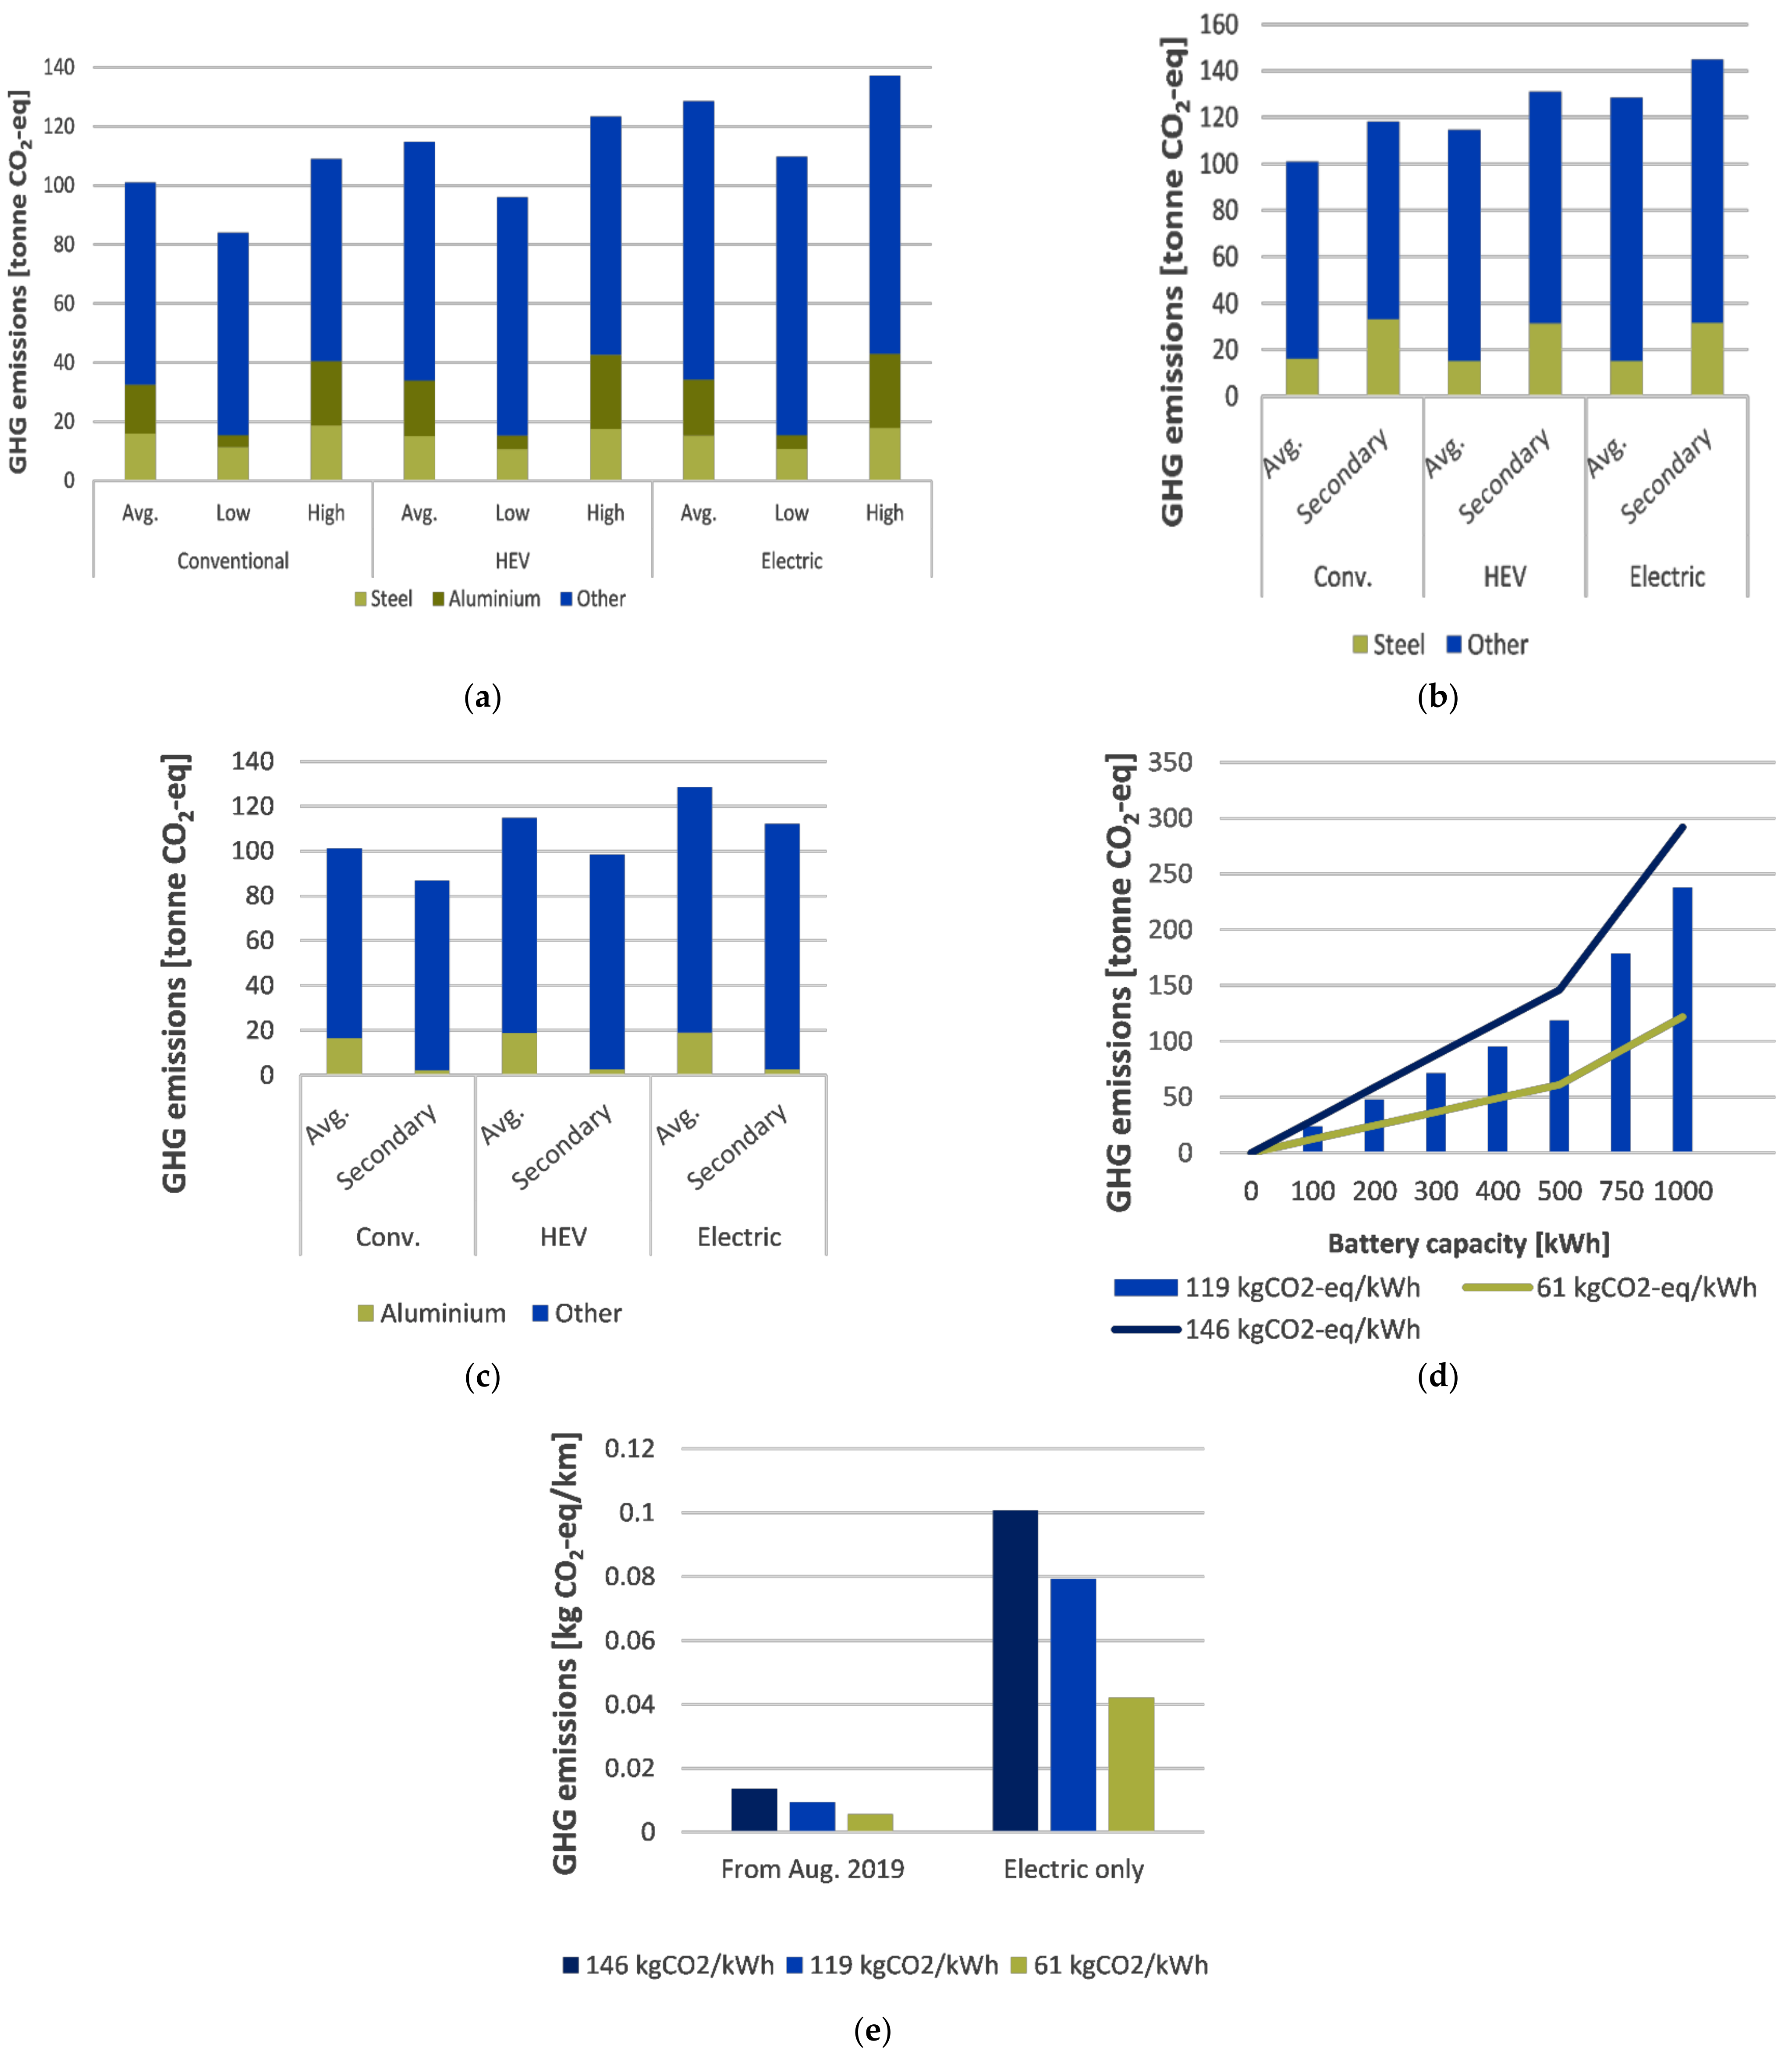
4.3.1. Primary Material Processing on Bus Models

To analyse how the electricity carbon intensity in production of steel and aluminium influenced the production emissions, we used a renewable scenario (low GHGs) [79,85] and a coal and thermal power scenario (high GHGs) [82,83] (Figure 6a). By implementing renewable energy sources and energy efficient production of steel and aluminium, the electric, conventional and HEV bus reduces the embodied emissions by 15%, 17% and 17%, respectively. If the production of the materials were to use coal and thermal power, it would result in an increase of 7%, 8% and 8% for the electric, conventional and HEV bus models, respectively. Aluminium has the greatest variations between the high and low GHGs due to the large requirement of electrical energy. The primary emissions used for calculating the sensitivity are 1.6 and 2.6 tonnes CO2-eq per tonne steel, and 4.0 and 22 tonnes CO2-eq per tonnes aluminium (Table S11).

4.3.2. Secondary Material Processing on 2019 Bus Fleet

An alternative production path is material processing from recycled scrap (Figure 6b,c; Table S12) [82]. For secondary steel production, the emissions increase for each model; however, the emissions decrease for secondary aluminium production. The all-electric model increases 13% with secondary steel production, while it decreases by 13% with secondary aluminium production. The secondary emissions used for calculating the sensitivity are 4.7 tonnes CO2-eq per tonne steel, and 1.2 tonnes CO2-eq per tonne aluminium.

4.3.3. Battery

A sensitivity analysis on the battery capacity was completed to understand how this may affect the GHG emissions using a high GHG emission value of 146 g CO2-eq/kWh [75] and a low GHG emission value of 61 g CO2-eq/kWh [75] (Figure 6d,e; Tables S13 and S14). It becomes evident that the choice of CI becomes an increasingly important factor as battery capacities increase, and the battery emissions will be reduced by almost 50% if it is produced with renewable energy. By calculating the emissions with the low scenario, the reduction per kilometre will be 0.037 kg CO2-eq/km for the electric bus fleet. The difference between the high and low scenarios is 0.058 kg CO2-eq/km. The difference between the high and low for the 2019 bus fleet are only 0.0079 kg CO2-eq/km.

5. Discussion and Conclusions

Based on the results, the carbon footprint from the bus fleet in Trondheim was reduced by 37% by implementing biofuel and electrified buses in August 2019. The fleet is more environmentally friendly than an average city bus and passenger car in Norway, with operation emissions of 49 g CO2-eq/person-km. The increase in embedded emissions from the new bus fleet is insignificant, compared to the achieved reduction of the carbon footprint over the lifetime. A further reduction of 52% can be achieved with full electrification with use of the Nordic charging el-mix in Trondheim. In addition, utilising European or Norwegian electricity mix will lead to lower GHG emissions than the current fleet.
It is important to outline that assuming zero emissions is not a reasonable assumption for all-electric buses. The embodied GHG emissions from production, and upstream emissions from both biofuels and charging electricity, must be accounted for. When the electrification increases, these constitute an increasing proportion of the carbon footprint, and makes the assumption more influential. Therefore, climate accounts should consider the entire carbon footprint. The geographical location of the production processes will have a large impact on embodied emissions from bus production, mainly because of the on-site electricity mix. A prevailing factor regarding production is the lack of information from manufacturers on upstream processing, which limits the evaluation of the geographic impact.
HVO buses can have a lower carbon footprint than battery electric buses, depending on the carbon intensity of the el-mix used. However, all-electric buses charging with an electricity mix with low carbon intensity is the best option. The embodied emissions constitute 67% of the carbon footprint from an all-electric bus, charging with the Nordic el-mix. The additional emissions from the increase in battery capacity due to electrification contributes significantly to the embedded carbon footprint, and more focus should be put towards reducing the embodied emissions.
The embodied emissions and energy generation emissions need to be taken into consideration in climate accounts. Therefore, a framework for the acquisition of new buses is essential to reduce the carbon footprint and should be clearly defined in local, national and international frameworks to avoid shifting emissions to other regions. This will be essential to reduce the global carbon footprint, and not only local greenhouse gas emissions. To avoid shifting emissions to other regions, stakeholders could set requirements for the carbon intensity of the electricity used in production phases, helping the development of renewable energy production.

Supplementary Materials

The following are available online at https://www.mdpi.com/1996-1073/14/3/770/s1, Figure S1: Schematic of four powertrains where the magnitude of electrification increases to the right. Figure S2: A: Weight percentage of the different bus components in the Volvo 7900 Electric. Data from Nordelöf et al. B: Weight percentage of the different material in the Volvo 7900 Elec-tric. Data from Nordelöf et al. Figure S3: A: Weight percentage of the different bus components in the Volvo 7900 Conventional. Data from Nordelöf et al. B: Weight percentage of the different material in the Volvo 7900 Conventional. Data from Nordelöf et al. Figure S4: Life cycle and production chain for a bus, Figure S5: Battery Manufacturing Energy Consumption. The distribu-tion of energy consumption during the production of 1 kg of LiBs. Data from (Yuan, C., Deng, Y., Li, T., Yang, F.). Figure S6: Estimated component weight configuration for the Volvo 7900 Electric. Table S1: Volvo 7900 models component specifications from Nordelöf et al. Table S2: Volvo 7900 models material specifications from Nordelöf et al. Table S3: Life cycle process emissions from var-ious bus models (unit tonnes CO2-eq). Table S4: Component emissions for various bus models, with estimated component emissions in Hawkins et al. and Nordelöf et al. (unit tonnes CO2-eq/bus). Table S5: GHG emissions and energy consumption from primary and secondary steel and alu-minium production from nine studies (tonnes CO2-eq per tonne metal and GJ per tonne metal). Table S6: Volvo 7900 component specifications with estimated battery weight for three bus mod-els. Table S7:Component emissions for various bus models, with estimated battery (Nordelöf et al., Ellingsen et al.) (unit tonnes CO2-eq). Table S8: Estimated material emissions from steel and alu-minium, based on Volvo models by Nordelöf et al. and extracted emissions from Kärnä (unit tonne CO2-eq). Table S9: Embodied emissions from the components in the three bus fleet scenarios (unit tonne CO2-eq/km). Table S10: GHG emissions for the different bus fleet scenarios (Statistic Norway. Passasjer-og godsbelegg brukt til beregning av utslipp per person-og tonnkilometer fra veitrafikk, Statistic Norway. Elbiler reduserer utslipp per personkilometer [Internet]. Statistic Norway). Table S11: Sensitivity analysis results for primary steel and aluminium production for three bus models with average, low and high emissions for the various bus models (unit tonnes CO2-eq). Table S12: Sensitivity analysis results for secondary steel and aluminium production for three bus models (unit tonne CO2-eq). Table S13: Sensitivity analysis for GHG emissions from dif-ferent battery capacities and carbon intensities. Table S14: Sensitivity on battery production car-bon intensity (CI) impact on bus fleet battery emissions (Unit g CO2-eq/km).

Author Contributions

Conceptualization, K.W.L., T.A.S., J.J.L. & K.M.L.; methodology, K.W.L., T.A.S., J.J.L. & K.M.L.; software, K.W.L., T.A.S., J.J.L. & K.M.L.; validation, K.W.L., T.A.S., J.J.L. & K.M.L.; formal analysis, K.W.L., T.A.S., J.J.L. & K.M.L.; investigation, K.W.L., T.A.S., J.J.L. & K.M.L.; resources, K.W.L., T.A.S., J.J.L. & K.M.L.; data curation, K.W.L., T.A.S., J.J.L. & K.M.L.; writing—original draft preparation, K.W.L., T.A.S., J.J.L. & K.M.L.; writing—review and editing, K.W.L., T.A.S., J.J.L. & K.M.L.; visualization, K.W.L., T.A.S., J.J.L. & K.M.L.; supervision, J.J.L. & K.M.L.; project administration, J.J.L. & K.M.L.; funding acquisition, J.J.L. & K.M.L. All authors have read and agreed to the published version of the manuscript.

Funding

This research was supported by funding from BIOKRAFT AS and The Research Council of Norway, project “Digitalization in the operation, monitoring and control of large-scale biogas plants” (project number 102019264).

Institutional Review Board Statement

Not applicable.

Informed Consent Statement

Not applicable.

Data Availability Statement

Not applicable.

Acknowledgments

The authors acknowledge the support from the Norwegian University of Science and Technology (NTNU), ENERSENSE. A thank you is also directed to AtB, the mobility company responsible for the public transport in Trøndelag, who provided valuable data.

Conflicts of Interest

The authors declare no conflict of interest.

References

  1. European Commission. Regulation of the European Parliament and of the Council on Establishing the Framework for Achieving Climate Neutrality and Amending Regulation (EU) 2018/1999 (European Climate Law); The Publications Office of the European Union: Brussels, Belgium, 2020. [Google Scholar]
  2. Norwegian Environment Agency. Klimakur 2030—Tiltak og virkemidler mot 2030. M-1625. 2020. Available online: https://www.miljodirektoratet.no/klimakur (accessed on 4 April 2020).
  3. Intergovernmental Panel on Climate Change. Climate Change 2014 Mitigation of Climate Change; Cambridge University Press: New York, NY, USA, 2014; ISBN 9781107654815. [Google Scholar]
  4. Norwegian Environment Agency. Klimagassutslipp fra Transport. Available online: https://miljostatus.miljodirektoratet.no/tema/klima/norske-utslipp-av-klimagasser/klimagassutslipp-fra-transport/ (accessed on 27 April 2020).
  5. EURACTIV, EU. Parliament Votes for 60% Carbon Emissions Cut by 2030—EURACTIV.com. Available online: https://www.euractiv.com/section/energy-environment/news/eu-parliament-votes-for-60-carbon-emissions-cut-by-2030/ (accessed on 5 November 2020).
  6. Regis, N.; Heinrich, M.T.E.E.; Kelch, F.; Magne, P.; Emadi, A.; Zhang, M.; Huang, Q.; Liu, S.; Li, H.; Khoury, J.; et al. Electrification of the transport system: Studies and reports. Renew. Sustain. Energy Rev. 2017, 10, 1–49. [Google Scholar] [CrossRef]
  7. Norsk Elbilforening Norway Reaches Historical Electric Car Market Share|Norsk Elbilforening. Available online: https://elbil.no/norway-reaches-historic-electric-car-market-share/ (accessed on 28 September 2019).
  8. Statistic Norway. Utslipp til Luft. Available online: https://www.ssb.no/klimagassn (accessed on 23 April 2020).
  9. Statistic Norway. Elbiler Reduserer Utslipp per Personkilometer. Available online: https://www.ssb.no/transport-og-reiseliv/artikler-og-publikasjoner/elbiler-reduserer-utslipp-per-personkilometer (accessed on 23 April 2020).
  10. Norwegian Environment Agency. Utslipp av Klimagasser i Kommuner. Available online: https://www.miljodirektoratet.no/tjenester/klimagassutslipp-kommuner/?area=705&sector=-2 (accessed on 12 May 2020).
  11. Danchell, J. A Overview of Zero Emission Buses in the Nordic Countries—by the End of 2019; Sustainable Bus: Copenhagen, Denmark, 2019. [Google Scholar]
  12. Sustainable Bus. Electric Bus, Main Fleets and Projects around the World. Available online: https://www.sustainable-bus.com/electric-bus/electric-bus-public-transport-main-fleets-projects-around-world/ (accessed on 10 April 2020).
  13. Sustainable Bus. 500,000 e-Buses Today in Operation. They’ll Take 67 of the Global Bus Fleet by 2040, BNEF Says. Available online: https://www.sustainable-bus.com/news/electric-vehicle-outlook-2020-bnef-electric-buses/ (accessed on 10 April 2020).
  14. Volvo. Volvo Receives Order for 17 Electric Buses From Oslo in Norway. Available online: https://www.volvobuses.com/en-en/news/2018/jun/volvo-recieves-order-for-electric-buses.html (accessed on 20 July 2020).
  15. Fortune Business Insights Global. Electric Bus Market Size, Share and Industry Analysis, by Type (Battery Electric Vehicle, Plug-in Hybrid Electric Vehicle, Fuel Cell Electric Vehicle), and Regional Forecasts, 2020–2027; Fortune Business Insights: Maharashtra, India, 2019. [Google Scholar]
  16. Trøndelag Fylkeskommune. Sånn gjør vi det; Trøndelag Fylkeskommune: Trøndelag, Norway, 2020. [Google Scholar]
  17. Trondheim, kommune. Kommunedelplan: Energi og Klima 2017–2030; Trondheim kommune: Trondheim, Norway, 2017. [Google Scholar]
  18. Sadik-Zada, E.R.; Gatto, A. The puzzle of greenhouse gas footprints of oil abundance. Socioecon. Plann. Sci. 2020, 100936. [Google Scholar] [CrossRef]
  19. Sadik-Zada, E.R.; Loewenstein, W. Drivers of CO2-Emissions in Fossil Fuel abundant settings: (Pooled) mean group and nonparametric panel analyses. Energies 2020, 13, 3956. [Google Scholar] [CrossRef]
  20. Sadik-Zada, E.R. Natural resources, technological progress, and economic modernization. Rev. Dev. Econ. 2020. [Google Scholar] [CrossRef]
  21. EPA. Overview of Greenhouse Gases. Available online: https://www.epa.gov/ghgemissions/overview-greenhouse-gases (accessed on 27 March 2020).
  22. Barbera, A.C.; Vymazal, J.; Maucieri, C. Greenhouse Gases Formation and Emission. In Enclopedia of Ecology, 2nd ed.; Fath, B., Ed.; Elsevier: Oxford, UK, 2019; pp. 329–333. ISBN 978-0-444-64130-4. [Google Scholar]
  23. Houghton, J.E.T.; Ding, Y.; Griggs, D.; Noguer, M.; van der Linden, P.; Dai, X.; Maskell, M.; Johnson, C. Climate change 2001: The scientific basis. In Contribution of Working Group I to the Third Assessment Report of the Intergovernmental Panel on Climate Change (IPCC); THE PRESS SYNDICATE OF THE UNIVERSITY OF CAMBRIDGE: Cambridge, UK, 2001; Volume 881, p. 881. [Google Scholar]
  24. EPA. Understanding Global Warming Potentials. Available online: https://www.epa.gov/ghgemissions/understanding-global-warming-potentials (accessed on 27 March 2020).
  25. Klopffer, W.; Grahl, B. Life Cycle Assessment (LCA)—A Guide to Best Practice; Wiley-VCH: Weinheim, Germany, 2014; ISBN 9783527330997. [Google Scholar]
  26. Life Cycle Initiative. What is Life Cycle Thinking? Available online: https://www.lifecycleinitiative.org/starting-life-cycle-thinking/what-is-life-cycle-thinking/ (accessed on 27 April 2020).
  27. Ellen MacArthur Foundation. What Is a Circular Economy? Available online: https://www.ellenmacarthurfoundation.org/circular-economy/concept (accessed on 27 April 2020).
  28. Kukreja, B. Life Cycle Analysis of Electric Vehicles—Quantifying the Impact; UBC Sustainability: Vancouver, WA, USA, 2018. [Google Scholar]
  29. National Renewable Rnergy Laboratory. Life Cycle Greenhouse Gas Emissions from Electricity Generation; Natl. Renew. Energy Lab.: Denver, CO, USA, 2013. [Google Scholar]
  30. The Norwegian Water Resources and Energy Directorate. Nasjonal varedeklarasjon 2018. Available online: https://www.nve.no/energiforsyning/varedeklarasjon/nasjonal-varedeklarasjon-2018/ (accessed on 3 April 2020).
  31. Department of Energy. Energy Sources. Available online: https://www.energy.gov/science-innovation/energy-sources (accessed on 1 July 2020).
  32. Gregorie, E.F.J.; Lamb, J.J.; Lien, K.M.; Pollet, B.; Burheim, O.S. Hydrogen and biogas. In Micro-Optics and Energy: Sensors for Energy Devices; Springer: Berlin, Germany, 2020. [Google Scholar]
  33. Lamb, J.J.; Hillestad, M.; Rytter, E.; Bock, R.; Nordgård, A.S.R.; Lien, K.M.; Burheim, O.S.; Pollet, B. Traditional routes for hydrogen production and carbon conversion. In Hydrogen, Biomass and Bioenergy: Integration Pathways for Renewable Energy Applications; Academic Press: Cambridge, MA, USA, 2020. [Google Scholar]
  34. Lamb, J.J. Impact assessment. In Anaerobic Digestion—From Biomass to Biogas; SCIO Publishing: Trondheim, Norway, 2020; pp. 391–414. ISBN 9788269203325. [Google Scholar]
  35. Lamb, J.J. Uses of biogas and biomethane. In Anaerobic Digestion—From Biomass to Biogas; SCIO Publishing: Trondheim, Norway, 2020; Volume 1, pp. 333–364. ISBN 9788269203325. [Google Scholar]
  36. Heyne, S.; Bokinge, P.; Nyström, I. Global Production of Bio-Methane and Synthetic Fuels -Overview; CIT Industriell energi AB: Göteborg, Sweden, 2019. [Google Scholar]
  37. Rytter, E.; Hillestad, M.; Austbø, B.; Lamb, J.J.; Sarker, S. Thermochemical production of fuels. In Hydrogen, Biomass and Bioenergy: Integration Pathways for Renewable Energy Applications; Academic Press: Cambridge, MA, USA, 2020. [Google Scholar]
  38. Assosiation of Issuing Bodies Renewable Energy Guarantees of Origin. Available online: https://www.aib-net.org/certification/certificates-supported/renewable-energy-guarantees-origin (accessed on 2 April 2020).
  39. The Norwegian Water Resources and Energy Directorate. Opprinnelsesgarantier. Available online: https://www.nve.no/energiforsyning/opprinnelsesgarantier/?ref=mainmenu (accessed on 27 March 2020).
  40. Oslo Economics. Analysis of the Trade in Guarantees of Origin. 2018. Available online: https://www.energinorge.no/contentassets/ac0b5a4fc38b4111b9195a77737a461e/analysis-of-the-trade-in-gos.-oslo-economics.pdf (accessed on 24 April 2020).
  41. Rapa, M.; Gobbi, L.; Ruggieri, R. Environmental and economic sustainability of electric vehicles: Life cycle assessment and life cycle costing evaluation of electricity sources. Energies 2020, 13, 6292. [Google Scholar] [CrossRef]
  42. Malandrino, O.; Rapa, M.; Ruggieri, R.; Vinci, G. Is the electric mobility really green? A life cycle thinking approach. In Proceedings of the 2020 IEEE International Conference on Environment and Electrical Engineering and 2020 IEEE Industrial and Commercial Power Systems Europe (EEEIC/I&CPS Europe), Madrid, Spain, 9–12 June 2020; pp. 1–4. [Google Scholar]
  43. Assosiaction of Issuing Bodies. European Residual Mixes. Results of the Calculation of Residual Mixes for the Calendar Year 2018; Assosiaction of Issuing Bodies: Brussels, Belgium, 2019. [Google Scholar]
  44. EEA. CO2 Intensity of Electricity Generation in the EU. Available online: https://www.eea.europa.eu/data-and-maps/data/co2-intensity-of-electricity-generation (accessed on 30 April 2020).
  45. EPA. Emission Factors for Greenhouse Gas Inventories; 2020. Available online: https://www.epa.gov/sites/production/files/2018-03/documents/emission-factors_mar_2018_0.pdf (accessed on 15 April 2020).
  46. Climate Transparency. Brown to Green: The G20 Transition to a Low-Carbon Economy; Climate Transparency: Berlin, Germany, 2018. [Google Scholar]
  47. EVgo Types of Electric Vehicles. Available online: https://www.evgo.com/why-evs/types-of-electric-vehicles/ (accessed on 14 May 2020).
  48. MIT Electric Vehicle Team. Electric Powertrains. 2018. Available online: http://web.mit.edu/evt/summary_powertrains.pdf (accessed on 20 April 2020).
  49. Hawkins, T.R.; Singh, B.; Majeau-Bettez, G.; Strømman, A.H. Comparative environmental life cycle assessment of conventional and electric vehicles. J. Ind. Ecol. 2013, 17, 53–64. [Google Scholar] [CrossRef]
  50. Nordelöf, A.; Romare, M.; Tivander, J. Life cycle assessment of city buses powered by electricity, hydrogenated vegetable oil or diesel. Transp. Res. Part D Transp. Environ. 2019, 75, 211–222. [Google Scholar] [CrossRef]
  51. Ding, Y.; Cano, Z.P.; Yu, A.; Lu, J.; Chen, Z. Automotive li-ion batteries: Current status and future perspectives. Electrochem. Energy Rev. 2019, 2, 1–28. [Google Scholar] [CrossRef]
  52. Zubi, G.; Dufo-López, R.; Carvalho, M.; Pasaoglu, G. The lithium-ion battery: State of the art and future perspectives. Renew. Sustain. Energy Rev. 2018, 89, 292–308. [Google Scholar] [CrossRef]
  53. Majeau-Bettez, G.; Hawkins, T.R.; Strømman, A.H. Life cycle environmental assessment of lithium-ion and nickel metal hydride batteries for plug-in hybrid and battery electric vehicles. Environ. Sci. Technol. 2011, 45, 4548–4554. [Google Scholar] [CrossRef]
  54. Dunn, J.B.; Gaines, L.; Kelly, J.C.; James, C.; Gallagher, K.G. The significance of Li-ion batteries in electric vehicle life-cycle energy and emissions and recycling’s role in its reduction. Energy Environ. Sci. 2015, 8, 158–168. [Google Scholar] [CrossRef]
  55. Kim, H.C.; Wallington, T.J.; Arsenault, R.; Bae, C.; Ahn, S.; Lee, J. Cradle-to-gate emissions from a commercial electric vehicle Li-ion battery: A comparative analysis. Environ. Sci. Technol. 2016, 50, 7715–7722. [Google Scholar] [CrossRef] [PubMed]
  56. Desjardins, J. Battery Megafactory Forecast: 400% Increase in Capacity to 1 TWh by 2028. Available online: https://www.visualcapitalist.com/battery-megafactory-forecast-1-twh-capacity-2028/ (accessed on 29 April 2020).
  57. Peters, J.F.; Weil, M. Providing a common base for life cycle assessments of Li-Ion batteries. J. Clean. Prod. 2018, 171, 704–713. [Google Scholar] [CrossRef]
  58. Peters, J.F.; Baumann, M.; Zimmermann, B.; Braun, J.; Weil, M. The environmental impact of Li-Ion batteries and the role of key parameters–A review. Renew. Sustain. Energy Rev. 2017, 67, 491–506. [Google Scholar] [CrossRef]
  59. Ambrose, H.; Kendall, A. Effects of battery chemistry and performance on the life cycle greenhouse gas intensity of electric mobility. Transp. Res. Part D Transp. Environ. 2016, 47, 182–194. [Google Scholar] [CrossRef] [Green Version]
  60. Ellingsen, L.A.-W.; Singh, B.; Strømman, A.H. The size and range effect: Lifecycle greenhouse gas emissions of electric vehicles. Environ. Res. Lett. 2016, 11, 54010. [Google Scholar] [CrossRef]
  61. Ellingsen, L.A.W.; Majeau-Bettez, G.; Singh, B.; Srivastava, A.K.; Valøen, L.O.; Strømman, A.H. Life cycle assessment of a lithium-ion battery vehicle pack. J. Ind. Ecol. 2014. [Google Scholar] [CrossRef] [Green Version]
  62. Northvolt a Blueprint for Next-Generation Battery Manufacturing. Available online: https://northvolt.com/production (accessed on 11 May 2020).
  63. Klingenberg, M.; Den Svenske Monsterfabrikken Skal Produsere Verdens Grønneste Batterier. Teknisk Ukeblad; 2020. Available online: https://www.tu.no/artikler/den-svenske-monsterfabrikken-skal-produsere-verdens-gronneste-batterier/490502 (accessed on 3 May 2020).
  64. Sustainable Bus. Electric Bus Market is Booming, We Are Ready. Interview with Akasol’s CEO Sven Schulz. Available online: https://www.sustainable-bus.com/news/electric-bus-market-is-booming-we-are-ready-interview-with-akasols-ceo-sven-schulz/ (accessed on 20 March 2020).
  65. Kärnä, P. Carbon Footprint of the Raw Materials of an Urban Transit Bus: Case study: Diesel, Hybrid, Electric and Converted Electric Bus; LAHTI UNIVERSITY OF APPLIED SCIENCES: Lahti, Finland, 2012. [Google Scholar]
  66. WORLD COAL ASSOCIATION How is Steel Produced? Available online: https://www.worldcoal.org/coal/uses-coal/how-steel-produced (accessed on 17 March 2020).
  67. Bell, T. The Modern Steel Manufacturing Process. Available online: https://www.thebalance.com/steel-production-2340173 (accessed on 17 March 2020).
  68. Hydro Aluminium Life Cycle. Available online: https://www.hydro.com/en-NO/about-aluminium/aluminium-life-cycle/ (accessed on 23 March 2020).
  69. All About Aluminium HOW ALUMINIUM IS PRODUCED. Available online: https://www.aluminiumleader.com/production/how_aluminium_is_produced/ (accessed on 23 March 2020).
  70. Lowe, M.; Tokuoka, S.; Trigg, T.; Gereffi, G. Lithium-ion Batteries for Electric Vehicles: The U.S. Value Chain; Center on Globalization, Governance & Competitiveness Duke University: Durham, NC, USA, 2010. [Google Scholar]
  71. Schünemann, J.-H. Modell zur Bewertung der Herstellkosten von Lithiumionenbatteriezellen; Technische Universität Braunschweig: Schierke, Germany, 2015; ISBN 3868447032. [Google Scholar]
  72. Pettinger, K.H.; Dong, W. When does the operation of a battery become environmentally positive? J. Electrochem. Soc. 2017, 164, A6274–A6277. [Google Scholar] [CrossRef]
  73. Yuan, C.; Deng, Y.; Li, T.; Yang, F. Manufacturing energy analysis of lithium ion battery pack for electric vehicles. CIRP Ann. 2017, 66, 53–56. [Google Scholar] [CrossRef]
  74. Thomitzek, M.; Von Drachenfels, N.; Cerdas, F.; Herrmann, C.; Thiede, S. Simulation-based assessment of the energy demand in battery cell manufacturing. Procedia CIRP 2019, 80, 126–131. [Google Scholar] [CrossRef]
  75. Emilsson, E.; Dahllöf, L. Lithium-Ion Vehicle Battery Production Status 2019 on Energy Use, CO2 Emissions, Use of Metals, Products Environmental Footprint, and Recycling; IVL Swedish Environmental Research Institute: Stockholm, Sweden, 2019. [Google Scholar]
  76. Cooney, G.; Hawkins, T.R.; Marriott, J. Life cycle assessment of diesel and electric public transportation buses. J. Ind. Ecol. 2013, 17, 689–699. [Google Scholar] [CrossRef] [Green Version]
  77. Chester, M. Life-cycle environmental inventory of passenger transportation in the United States. Inst. Transp. Stud. 2008. [Google Scholar]
  78. Chester, M.; Horvath, A. Life-cycle Energy and Emissions Inventories for Motorcycles, Diesel Automobiles, School Buses, Electric Buses, Chicago Rail, and New York City Rail; Institute of Transportation Studies, UC Berkeley/Institute of Transportation Studies, Research Reports, Working Papers, Proceedings: Berkeley, CA, USA, 2009. [Google Scholar]
  79. Renzulli, P.A.; Notarnicola, B.; Tassielli, G.; Arcese, G.; Di Capua, R. Life cycle assessment of steel produced in an Italian integrated steel mill. Sustainability 2016, 8. [Google Scholar] [CrossRef] [Green Version]
  80. Norgate, T.E.; Jahanshahi, S.; Rankin, W.J. Assessing the environmental impact of metal production processes. J. Clean. Prod. 2007, 15, 838–848. [Google Scholar] [CrossRef]
  81. Burchart-Korol, D. Life cycle assessment of steel production in Poland: A case study. J. Clean. Prod. 2013, 54, 235–243. [Google Scholar] [CrossRef]
  82. Na, H.; Gao, C.; Zhang, M.; Qi, Z.; Ye, Z. Life cycle assessment analysis of the environment load from typical chinese steel enterprises. J. Environ. Account. Manag. 2017, 5, 1–9. [Google Scholar] [CrossRef]
  83. Yang, Y.; Guo, Y.-q.; Zhu, W.-s.; Huang, J.-b. Environmental impact assessment of China’s primary aluminum based on life cycle assessment. Trans. Nonferrous Met. Soc. China 2019, 29, 1784–1792. [Google Scholar] [CrossRef]
  84. Gloria, T.P. The Environmental Footprint of Semi-Finished Aluminum Products in North America; The Aluminum Association: Arlington, VA, USA, 2013. [Google Scholar]
  85. Hydro Low-Carbon, Greener Aluminium: Hydro REDUXA and Hydro CIRCAL. Available online: https://www.hydro.com/en-NO/products-and-services/low-carbon-aluminium/ (accessed on 1 February 2020).
  86. Ellingsen, L.A.W.; Hung, C.R.; Strømman, A.H. Identifying key assumptions and differences in life cycle assessment studies of lithium-ion traction batteries with focus on greenhouse gas emissions. Transp. Res. Part D Transp. Environ. 2017. [Google Scholar] [CrossRef]
  87. Romare, M.; Dahllöf, L. The Life Cycle Energy Consumption and Greenhouse Gas Emissions from Lithium-Ion Batteries; IVL Swedish Environmental Research Institute: Stockholm, Sweden, 2017; ISBN 9789188319609. [Google Scholar]
  88. Dai, Q.; Kelly, J.C.; Gaines, L.; Wang, M. Life cycle analysis of lithium-ion batteries for automotive applications. Batteries 2019. [Google Scholar] [CrossRef] [Green Version]
  89. Held, V. LCA—The Steel Cycle. Available online: https://www.voestalpine.com/blog/en/innovation-en/lca-the-steel-cycle/ (accessed on 24 April 2020).
  90. Hao, H.; Mu, Z.; Jiang, S.; Liu, Z.; Zhao, F. GHG Emissions from the production of lithium-ion batteries for electric vehicles in China. Sustainability 2017, 9. [Google Scholar] [CrossRef] [Green Version]
  91. Kelly, J.; Dai, Q.; Wang, M. Globally regional life cycle analysis of automotive lithium-ion nickel manganese cobalt batteries. Mitig. Adapt. Strateg. Glob. Chang. 2019. [Google Scholar] [CrossRef]
  92. Weimer, L.; Braun, T.; Hemdt, A. vom Design of a systematic value chain for lithium-ion batteries from the raw material perspective. Resour. Policy 2019, 64, 101473. [Google Scholar] [CrossRef]
  93. Ellingsen, L.A.-W.; Hung, C.R. Part 2: Research for TRAN Committee—Resource and Climate Aspects of Lithium-Ion Traction Batteries and Battery Electric Vehicles; European Parliament, Policy Department for Structural and Cohesion Policies: Brussels, Belgium, 2018; ISBN 9789284626687. [Google Scholar]
Figure 1. (a), global greenhouse gas emissions in 2010 illustrated by sectors [3]; (b), Norwegian greenhouse gas emissions in 2018 illustrated by sectors [8]; (c), greenhouse gas emissions in road transportation in Norway divided by sectors [4]; (d), local emissions from road transport in Trondheim municipality in 2018 [10]; (e), total number of electric buses provided to the Nordic countries from producers by the end of 2019 [11]; and, (f), total number of electric buses per country by the end of 2019 [11].
Energies 14 00770 g001aEnergies 14 00770 g001b
Figure 2. (a), total bus production emissions of electric and conventional diesel buses from four LCA studies [50,76,77,78]; (b), estimated bus component production emissions from Hawkins et al. [49] compared to component emissions from Nordelöf et al. [50]; (c), GHG emissions and energy consumption per tonne of steel from four LCA studies for primary steel production [79,80,81,82]; (d), GHG emissions and energy consumption per tonne of aluminium from four LCA studies for primary aluminium production [68,80,83,84,85]; (e), GHG emissions and energy consumption per tonne of steel from two LCA studies for secondary steel production [81,82]; (f), GHG emissions and energy consumption per tonne of aluminium from two sources for secondary aluminium production [68,84]; and, (g), carbon intensity and energy demand in battery production from 6 different studies [61,75,86,87,88].
Energies 14 00770 g002aEnergies 14 00770 g002b
Figure 3. (a), upstream material production emissions from electric, diesel, PHEV and HEV bus from two LCA studies [50,65]; (b), embodied GHG emissions from the first-generation Volvo bus models presented with material, manufacturing and maintenance emissions [50]; and, (c), Estimated component GHG emissions from four Volvo bus models [50,60]. Conv, conventional; Al, aluminium; PT, powertrain; ICE, internal combustion engine.
Energies 14 00770 g003
Figure 4. (a), GHG emissions versus driven distance for different fuel technologies (Nordic charging el-mix is used for the electrified options); (b), segment of 0–250,000 km for GHG emissions from the four simulations; and, (c), carbon footprint for the bus models. NO-GO represents charging with electricity in Norway without buying Guarantees of Origin (520 g CO2-eq/kWh). The error bars represent the range for the PHEVs from charging with a Norwegian el-mix as the lowest, and NO-GO el-mix as the highest.
Energies 14 00770 g004
Figure 5. (a), embodied production emissions from the fleet scenarios; (b), carbon footprint from the bus fleet scenarios; and, (c), Carbon footprint of bus fleets compared to average city bus and passenger car in Norway. NO-GO represents charging with electricity in Norway without buying Guarantees of Origin (520 g CO2-eq/kWh). The error bar represents the range for electric buses from charging with a Norwegian el-mix as the lowest and NO-GO el-mix as the highest. PT, Powertrain; ICE, internal combustion engine.
Energies 14 00770 g005
Figure 6. (a), sensitivity analysis on primary steel and aluminium production emissions; (b), sensitivity analysis on secondary steel production emissions; (c), sensitivity analysis on secondary aluminium production emissions; (d), sensitivity analysis on battery capacity and carbon intensity for production emissions; and, (e), sensitivity analysis on bus fleet battery production emissions. Avg. represents the average material emissions in production. Low and high depicts low and high emissions in material production. Secondary depicts emissions that accumulate from producing material in a secondary pathway.
Energies 14 00770 g006
Table 1. GHG emissions from electricity production [29,30].
CoalGasNGBiogasPVGeothermalBio-PowerWindNuclearHydro
Emissions [ g   C O 2 e q k W h ] NREL98048044404011127
Emissions [ g   C O 2 e q k W h ]
NVE
566176206
NG, natural gas; PV, photovoltaics.
Table 2. Carbon intensity for electricity mix in different regions.
RegionCarbon Intensity [g CO2-eq/kWh]Ref
Norway19 [30]
Sweden12 [43]
Denmark209 [43]
Nordic countries75As used by AtB in 2020
Italy327 [43]
Poland846 [43]
EU294 [44]
US-avg.432 [45]
China555 [46]
Japan506 [46]
Table 3. Studies on battery production emissions.
StudyProduction
Location
YearEl-MixCIEnergy DemandRef
Ellingsen et al.East Asia2014Similar to natural gas based electricity generation.172586 [61]
Ellingsen et al.East Asia2016Similar to natural gas based electricity generation.119 1293 [60]
Peters et al.20171101182 [58]
Romare & Dahllöf2017Range of renewable to non-renewable el-mix of 0.05–1 kg CO2-eq/kWh consumed150–200350–650 [88]
Dai et al. USA2019US avg. national grid mix72.91125[88]
Emilsson & Dahllöf 2019Range of renewable to non-renewable el-mix of 0.05–1 kg CO2-eq/kWh consumed 61–106 21127 [75]
1 Estimated by emissions from a luxury car and removing the use phase emissions for easier comparison. 2 59 kg CO2-eq/kWh from the upstream material production and 2–47 kg CO2-eq/kWh from the cell and battery pack manufacture. The latter was calculated by using the process energy of 170 MJ/kWh from Dai et al. [88] and include a range of renewable to non-renewable el-mix of 0.05–1 kg CO2-eq/kWh consumed.
Table 4. Bus fleet scenarios.
Bus FleetDieselGasBio-
Diesel
HybridElectricTotalNote
2018321394100320
From Aug.20190113 (only biogas)9858 (Van Hool)36 (25 Volvo 7900 Electric and 11 Heuliez)305Nordic charging el-mix
All-electric0000305 (only Volvo 7900 Electric)305Four charging el-mix scenarios: (1) EU-mix, (2) Nordic, (3) Norwegian (NO), (4) Norwegian without GOs (NO-GO)
Table 5. Case study assumptions.
Bus Length12 m
Volvo Electric battery200 kWh
Heuliez Electric battery106 kWh
Van Hool HEV battery36 kWh
Volvo HEV Battery8.9 kWh
Volvo PHEV battery19 kWh
Yearly distance per bus60,000 km
Lifetime10 years
Battery Change Electric1
Battery Change HEV2
Battery Change PHEV2
Table 6. Carbon payback time for the electric bus model.
Charging MixDiesel [1000 km]HVO [1000 km]
ElectricConv.HEVPHEVConv.HEVPHEV
EU mix5586114188846671
Nordic43568195135198
NO40517585111168
NO-GO7719119563,000
Publisher’s Note: MDPI stays neutral with regard to jurisdictional claims in published maps and institutional affiliations.

