Article

Variable-Order Equivalent Circuit Modeling and State of Charge Estimation of Lithium-Ion Battery Based on Electrochemical Impedance Spectroscopy

School of Electrical and Information Engineering, Tianjin University, Tianjin 300072, China
*
Author to whom correspondence should be addressed.
Energies 2021, 14(3), 769; https://doi.org/10.3390/en14030769
Submission received: 29 December 2020 / Revised: 21 January 2021 / Accepted: 22 January 2021 / Published: 1 February 2021
(This article belongs to the Section D1: Advanced Energy Materials)

Abstract

:
In the battery management system, it is important to accurately and efficiently estimate the state of charge (SOC) of lithium-ion batteries, which generally requires the establishment of a equivalent circuit model of the battery, whose accuracy and rationality play an important role in accurately estimating the state of lithium-ion batteries. The traditional single order equivalent circuit models do not take into account the changes of impedance spectrum under the action of multiple factors, nor do they take into account the balance of practicality and complexity of the model, resulting the low accuracy and poor practicability. In this paper, the theory of electrochemical impedance spectroscopy is used to guide and improve the equivalent circuit model. Based on the analysis of the variation of the high and intermediate frequency range of the impedance spectrum with the state of charge and temperature of the battery, a variable order equivalent model (VOEM) is proposed by Arrhenius equation and Bayesian information criterion (BIC), and the state equation and observation equation of VOEM are improved by autoregressive (AR) equations. Combined with the unscented Kalman filter (UKF), a SOC online estimation method is proposed, named VOEM-AR-UKF. The experimental results show that the proposed method has high accuracy and good adaptability.

1. Introduction

Lithium-ion batteries have the advantages of high energy density, high safety and low pollution, so recent years have witnessed their widespread application in aerospace, electric vehicles (EVs), photovoltaic power grids and other fields [1,2]. Equipped with battery management system (BMS), we can master the working state of the lithium-ion battery and manage it more scientifically. However, the state of the battery cannot be directly measured by a sensor, and must be estimated quantitatively by mathematical algorithms based on some measurable external characteristics of the battery.
The state of charge (SOC) of a Li-ion battery represents the remaining charge of the battery, which is one of the core problems of the BMS, and it is of great significance to accurately estimate SOC for efficient utilization and extending the service life of batteries. At present, SOC estimation methods are mainly divided into two categories. Some, such as the ampere hour integration method derived from the definition and the open circuit voltage method by measuring the open circuit voltage during the charging and discharging [3] do not need to establish an equivalent model of the Li-ion battery. However, these are open-loop methods, which are easily affected by any deviation from the initial value, and without correction and compensation estimation errors will accumulate over time, therefore, data acquisition equipment with high precision is required. The others are closed-loop methods based on an equivalent model of Li-ion battery, represented by the Kalman filter [4] or observer [5] and their improved algorithms [6], which can correct the deviations of initial values and alleviate the accumulation of measurement error, thus having good adaptive ability. The accuracy of these methods largely depends on the accuracy of the established model.
The lithium-ion battery models mainly include electrochemical models and equivalent circuit models. Electrochemical models, among which the pseudo two dimensional model (P2D) [7] is the most popular, are established according to the electrochemical mechanism, and a series of electrochemical equations are deducted to analyze the electrochemical reaction and thermodynamic phenomena inside the battery. However, the electrochemical model is not suitable for on-line battery state estimation as a result of its involving plenty of partial differential equations, which results in complex calculations. By comparison the equivalent circuit model [8] (EM) is more commonly used in practice for its advantage in online estimation. Ignoring the complex physical and chemical reaction mechanism inside the battery, the EM is constructed with resistance, capacitance, voltage source and other circuit components describing the external characteristics of a lithium-ion battery in the process of charge and discharge, represented by the Thevenin model [9], PNGV model [10], and fraction order model [11]. The adaptability of equivalent circuit models is relatively poor, and they are confined to the working conditions where the model parameters are identified, mainly due to the lack of physical and chemical significance of the parameters of EM, resulting in the difficulty in maintaining high accuracy under different working conditions. In view of this situation, the combination of electrochemical theory and equivalent circuit model, should be conducted in a way focusing on the high accuracy, good practicability, as well as clear physical meaning [12,13].
The AC impedance of the battery can connect the internal mechanism and external state of the battery, which is the important parameter for battery modeling and state estimation. Electrochemical impedance spectroscopy [14] (EIS) testing can obtain the AC impedance of the battery, which is a technique that applies sinusoidal disturbances with different frequencies on the impedance measurement of lithium-ion batteries. EIS testing is a powerful tool for battery modeling and state estimation as it contains the impedance information in a wide frequency range. The measured EIS can be fitted by the equations of the equivalent circuit model and then the dynamic behaviors during the electrode reaction process of the battery can be specifically described [15] by establishing the correspondence between the characteristics of the EIS and the parameters of the EM. Therefore, this modeling method can combine the theory of electricity and electrochemistry, which makes the equivalent circuit model to have practical physical significance.
In conclusion, establishing a more reasonable model is an important basis for realizing the accurate SOC estimation of lithium-ion batteries, and an efficient SOC estimation algorithm matters as well. In this paper, the theory of electrochemical impedance spectroscopy (EIS) is used to guide and improve the equivalent circuit model. By analyzing the variation of high and intermediate frequency range of impedance spectrum with SOC and temperature, a variable order equivalent model (VOEM) is proposed, and the autoregressive equation (AR) is adopted to replace the RC resistance capacitance equation to improve the computational efficiency. By combining the proposed model with an unscented Kalman filter (UKF) algorithm, a novel SOC estimation method is proposed, named VOEM-AR-UKF. The experimental results show that under various operating conditions, the proposed model can simulate the actual external characteristics of the battery better than conventional 1-RC or 2-RC models, ans meanwhile, the SOC estimation can be achieved by the proposed method combined with VOEM and AR equations, in less time and with higher accuracy compared with the traditional SOC estimation methods, which are combined with single order RC models and RC resistance capacitance equations.

2. Characteristic Analysis of Lithium-Ion Battery Based on EIS

2.1. Electrochemical Impedance Spectroscopy

According to Barsoukov [16], a typical electrochemical impedance spectrum is shown in Figure 1, whose abscissa and ordinate represent the real part and negative imaginary part of the impedance, respectively. The applied frequency ranges from 0.01 to 100 kHz, and the frequency increases logarithmically along the direction of the red arrow. The EIS in Figure 1 mainly includes the following five parts:
(1)
Ultra-high frequency region (above 10 kHz), mainly affected by the wiring and windings, which is inductive, is represented by RL//L parallel circuit, earmarked by purple rectangle in the figure.
(2)
Ohmic internal resistance, the intersection of impedance spectrum and real axis, represented by R0.
(3)
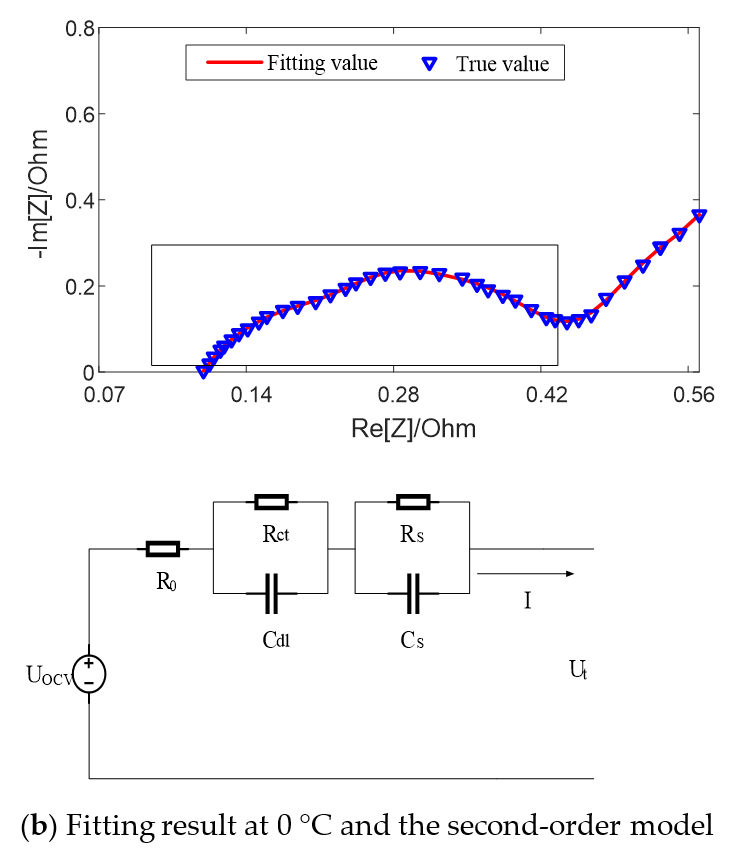
High frequency region, characterized by a semicircle related to the diffusion and migration of lithium ions through the insulating layer on the surface of active electrode material particles, is represented by RS//CS parallel circuit, earmarked by red rectangle in the figure. Among them, RS is the resistance of lithium ion diffusion migration through the surface film on the positive and negative electrodes, which is approximately equal to the semicircle diameter [15], and capacitance CS describes the capacitance effect of surface films.
(4)
Middle frequency region, characterized by a semicircle related to the charge transfer process in the electrode reaction, is represented by Rct//Cdl parallel circuit, earmarked by green rectangle in the figure. Rct is the charge transfer resistance, which is approximately equal to the semicircle diameter, and the capacitance Cdl is the electric double layer capacitor.
(5)
Low frequency region, characterized by an oblique line associated with the solid diffusion process of lithium ions inside the active material particles, is represented by a Warburg impedance, earmarked by cyan rectangle in the figure.

2.2. The Experiment of EIS

The characteristics of EIS are greatly affected by temperature and SOC [17,18], the following experiment is designed to study this effect. The research object of this paper is 18,650 ternary lithium-ion battery with a rated capacity of 2A h and a nominal voltage of 3.6 V. As shown in Figure 2, the test platform is composed of the test battery, electrochemical analyzer, battery charging and discharging equipment, host computer and incubator. The electrochemical analyzer can calculate the impedance according to the input and output signals of the battery, so as to carry out EIS measurement. The charging and discharging equipment can configure different charging and discharging test conditions through the host computer to charge and discharge the battery. A thermostat is used to control the ambient temperature of the battery.
In order to explore the change of battery EIS under different SOC and temperature, seven SOC points (10% SOC, 20% SOC, 30% SOC, 50% SOC, 70% SOC, 90% SOC and 100% SOC) and two temperature points (T = 0 °C and 25 °C) were selected for EIS measurement. The specific test steps are shown in Table 1.
As shown in Figure 3 and Figure 4, the semicircle corresponding to the charge transfer impedance can be observed at different SOC values at 25 °C and 0 °C, respectively, while the smaller semicircle can only be distinguished under certain conditions. At the same temperature, the resistance Rct (semicircle diameter) for charge transfer process is relatively large at low SOC and high SOC, and relatively small at medium SOC [19]. Therefore, with the change of SOC, the middle frequency semicircle representing charge transfer process presents a trend of large at both ends and small in the middle, while the high frequency semicircle representing surface film impedance remains basically unchanged as a result of the RS’s insensitivity to the change of SOC [19], so in the middle section of the SOC, the two semicircles merge into one semicircle when the electrochemical reaction time constants are close and overlap [20].
However, the impedance of the surface film is greatly affected by temperature and its properties are stable at low temperatures, thus the RS is larger [21], making it easy to distinguish the semicircle in the high frequency band, therefore, the two semicircles appear in the impedance spectrum. High temperatures will destroy the surface film and decrease RS, which leads to the fact that at higher temperatures, the time constants of two semicircles are close to each other and overlap [22], thus causing the two semicircles to merge into one.
Because the middle and high frequency band are the common frequency bands of Li-ion batteries, the resistive element in the ultra-high frequency band and the Warburg impedance in the low frequency band are omitted, and the RC parallel elements are retained to fit the impedance spectrum in the middle and high frequency band.
Figure 5 shows the fitting results of equivalent circuit model with SOC = 50% at different temperatures. It can be seen that when the temperature is high, such as 25 °C, there exists a semicircle in the middle and high frequency band earmarked by rectangle in the figure, which can be fitted by the first-order model with an RC parallel element. When the temperature is low, such as 0 °C, there exist two semicircles in the middle and high frequency band, which can be fitted by the second-order model with two RC parallel elements.
The fitting results of the equivalent circuit model for different SOC values at 25 °C are shown in Figure 6. When the SOC value is high (SOC = 90%) and low (SOC = 20%), two semicircles can be distinguished on the middle and high frequency of impedance spectrum earmarked by rectangle in the figure, which can be fitted by the second-order model; when the SOC value is in the middle (SOC = 70%), only one semicircle can be distinguished, which can be fitted by the first-order model. Both models can well fit the impedance semicircles in the middle and high frequency band at different temperatures or different SOC.
At high SOC and high temperature, there exists one semicircle in the intermediate and high frequency band of EIS, while two semicircles at low SOC and low temperature earmarked by rectangle in the figure, which can be described by one RC parallel element or two RC parallel elements, respectively, representing the two different polarization processes, namely SEI layer and charge transfer process. Therefore, considering the influence of temperature and SOC on the impedance characteristics, a variable order equivalent circuit model (VOEM) is proposed.

3. Variable Order Equivalent Circuit Model

3.1. RC Equivalent Circuit Model

According to the number of capacitive reactance arcs shown in the impedance spectrum, the equivalent circuit model can be divided into first-order RC model and second-order RC model, shown in Equations (1) and (2), respectively:
U t = U O C V + I R 0 + U p d U p d t = 1 C p R p U p + 1 C p I
U t = U O C V + I R 0 + U 1 + U 2 d U 1 d t = 1 C d l R c t U 1 + 1 C d l I d U 2 d t = 1 C S R S U 2 + 1 C S I
In (1) and (2), I represents the input current, UOCV represents the open circuit voltage, which is the function of SOC, that is, UOCV = f (SOC), where f can be the mixture of polynomial and exponential function. The expression of SOC is:
S O C ( t ) = S O C ( t 0 ) 1 C Q t 0 t i ( t ) d t
In (3), CQ represents the available capacity of the battery at present, which is the function of temperature and number of cycles, that is:
C Q = 3600 C N f 1 ( C y c l e ) f 2 ( T e m p )
In (4), CN represents the standard capacity, and the factor 3600 is introduced for the transition of capacity from Ah to As. f1 and f2 are cycle life and temperature correction factors respectively. Battery aging is not taken into consideration in this paper, so, f1 = 1. The temperature correction factor, f2, can correct the actual capacity under different temperature so as to improve the accuracy of model parameter identification and SOC estimation.
The f2 is established according to the well-known Arrhenius formula [23]:
f 2 ( T e m p ) = a T exp ( b T / T )
In (5), aT and bT are coefficients to be identified, which are related to the activation energy and molar gas constant [24], T represents the working temperature of the battery. To identify the coefficients aT and bT, the constant current pulse (CCP) experiments at different temperatures are carried out to acquire the actual capacity of the battery at specific temperature and the necessary data as well to establish to establish the variable order equivalent circuit model (VOEM) in the next section. The experiment steps are shown in Table 2.
The OCV-capacity curves under different temperatures are shown in Figure 7.
The coefficients aT and bT in the Equation (5) can be identified by fitting the actual capacities under different temperatures and the results are shown in Table 3. It can be seen that the fitting error is small.

3.2. The Determination of the Order of Model

3.2.1. Bayesian Information Criterion

Bayesian Information Criterion (BIC) is widely used to determine the order of model [25], which can quantify the accuracy and practicability of the model at different orders. The definition is as follows:
B I C = S ln σ 2 + ( k + 1 ) ln S
In (6), S represents the amount of experiment data, and k represents the order of model, and σ2 is the mean square error of the model output, that is:
σ 2 = 1 S k 1 i = 1 S ( y i y ^ i ) 2
In (7), y i and y ^ i are the real value and output of the model, respectively. The left term of (6) represents accuracy of the model fitting, which means that the smaller the value, the higher the accuracy of the model. The right side of (6) evaluates the practicability of the model. When BIC value is the smallest, the corresponding order is the optimal order of the model.
The order of the model at the i-th moment is determined by substituting S data points before that time into Equations (6) and (7), and k = 3 for first-order RC model, 5 for second-order RC model. After inputting temperature, current and true value of voltage, the first-order RC model and the second-order RC model are used to obtain the estimation value of terminal voltage respectively, and then the BIC value is calculated by Equation (6). Then, the order can be determined according to the smaller BIC value.

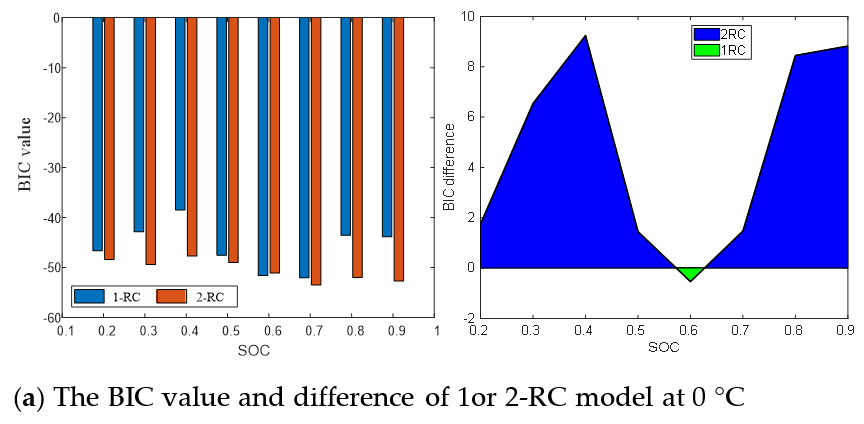
3.2.2. Result and Analysis of the Determination of Model Order

The model parameters of 1-RC and 2-RC are identified by hybrid pulse power characteristic (HPPC) [13]. The model orders are determined by constant current pulse (CCP) discharge experiments under different temperatures, which aim to study the fitting effect of 1 or 2-RC model so as to determine the model order choice under different SOC and temperatures. The input of 1-RC and 2-RC model established is the pulse current, while the output is the estimation value of terminal voltage. And then the voltage error is the difference between the estimated voltage of 1RC or 2RC model and the true voltage of CCP experiment.
Figure 8 shows the terminal voltage estimation errors of the 1 or 2-RC model at different SOC under T = 0 °C, 25 °C and 45 °C. It can be seen that the estimation errors of the first-order model and the second-order model at higher temperature are closer than those at low temperature. The difference of estimation errors between the two models still shows a trend of large at both ends and small in the middle with the change of SOC value, and the range of SOC values corresponding to similar errors is also expanded with the rising of the temperature.
Obviously, when the SOC is high or low, the 2-RC model should be selected due to the larger error of 1-RC model; when the SOC is medium, similarly though the estimation results of the two models are, the complexity of the 2-RC model is higher, so the first-order model should be selected.
According to the BIC criteria, the BIC difference BIC’ can be calculated by Equation (8):
B I C = B I C ( 1 ) B I C ( 2 )
In (8), BIC(1) means the BIC value of 1-RC model and BIC(2) of 2-RC model. By judging whether the BIC difference is greater than 0 or not, the order of model can be determined quantitatively.
Figure 9 presents the BIC values and differences of the 1-RC model and the 2-RC model under different SOC at 0 °C, 25 °C and 45 °C. It can be seen that when the BIC difference at the lower and higher SOC is greater than 0, and then the 2-RC model is selected; when the BIC difference is less than 0 at the medium SOC, the first-order model is selected; and at different temperatures, the SOC range corresponding to BIC difference greater than 0 changes. The determination result of Figure 9 is the quantization of the analysis of Figure 8, which are consistent. Therefore, the model order determination based on BIC is reasonable and effective, which not only takes into account the accuracy and practicability of the model but can also well reflect the characteristics of EIS in the middle and high frequency band.
For on-line application, BIC difference is taken as the z-axis, while SOC and temperature are taken as the x-axis and y-axis, respectively, and then the 3D order determination drawing is plotted as shown in Figure 10. The difference of BIC has a one-to-one relationship with temperature and SOC. In this way, when SOC is estimated online, the order of model can be automatically selected according to real-time data. Figure 11 shows the order determination diagram of dividing line 0. The yellow part means the 2-RC model is selected when the BIC difference is greater than 0, and the blue part the 1-RC model when the BIC difference is less than 0. With the increase of temperature, the SOC range corresponding to the 1-RC model tends to expand.

4. SOC Estimation Method Based on VOEM-AR-UKF

4.1. Autoregressive Equation

SOC estimation method based on RC equivalent circuit model generally selects SOC and polarization voltages as state variables. Taking the 2-RC model as an example, the state equation and observation equation are established as Equation (9):
S O C ( k ) U 1 ( k ) U 2 ( k ) = 1 0 0 0 e Δ t R c t C d l 0 0 0 e Δ t R S E I C S E I S O C ( k 1 ) U 1 ( k 1 ) U 2 ( k 1 ) + T s C Q R c t ( 1 e Δ t R c t C d l ) R S E I ( 1 e Δ t R S E I C S E I ) i ( k 1 ) U ( k ) = U O C V ( S O C k ) U 1 ( k ) U 2 ( k ) R 0 i ( k )
where Δt means sampling time.
Not only does this SOC estimation method based on Equation (9) need to identify the model parameters, but has introduced the exponential computing as well, which takes a lot resources. In addition, the RC parameters need to be solved further during on-line estimation to form the Equation (9), and.the unreasonable initial value may lead to divergence of solution. The autoregressive (AR) equation [26] solves this problem well. Take the 2-RC model as an example, let V(k) = UOC(k) − VL(k), VL(k) and I(k) be the terminal voltage and current value of the kth sampling point, respectively. Then the difference form can be deduced from the transfer function of V and I by Laplace inverse transformation [27]:
V ( k ) = a 1 V ( k 1 ) a 2 V ( k 2 ) + b 0 I ( k ) + b 1 I ( k 1 ) + b 2 I ( k 2 )
In (10), a1, a2, a3, b1 and b2 can be identified by forgetting factor recursive least squares (FFRLS) [27] online, and then, the state equation and observation equation based on AR equation are written in the form of (11):
S O C ( k + 1 ) V ( k + 1 ) V ( k ) = 1 0 0 0 a 1 a 2 0 1 0 S O C ( k ) V ( k ) V ( k 1 ) + T s C Q 0 0 b 0 b 1 b 2 0 0 0 i ( k + 1 ) i ( k ) i ( k 1 ) y ( k ) = U O C V ( k ) S O C ( k ) 1 0 S O C ( k ) V ( k ) V ( k 1 )
The state variable vector x = S O C ( k ) V ( k ) V ( k 1 ) T . Equation (11) can be rewritten in the following compact form:
x ( k + 1 ) = A x ( k ) + B u ( k ) + w k y ( k ) = C x ( k ) + D u ( k ) + v k
where:
A = 1 0 0 0 a 1 a 2 0 1 0 ,   B = T s / C Q 0 0 b 0 b 1 b 2 0 0 0 C = U O C V ( k ) S O C ( k ) 1 0 ,   D = 0
The case of the 1-AR equation is similar to that and will not be repeated here. It can be seen from Equation (11) that the coefficient of AR equation does not contain resistance and capacitance values, thus avoiding the influence of inaccurate identification of resistance and capacitance parameters on SOC estimation. The variable order model proposed in this paper is presented in the autoregressive form (12), which is, the order switching is realized by the transformation of the 1-AR equation and 2-AR equation, which can improve the computational efficiency, as well as excempt the model from the dependance on the identification results of RC parameters, and further improve the robustness of the model.

4.2. VOEM-AR-UKF Algorithm

The unscented Kalman filter (UKF) is adopted in this paper to estimate SOC of the battery, which is based on UT transformation technology, that is, the distribution of sampling points (sigma points) is applied to approximate the probability distribution of nonlinear functions. Compared with other SOC estimation methods based on Kalman filter, UKF algorithm avoids derivative operation, requires lower for state and observation equation, and estimates more accurately [28].
The UKF algorithm mainly includes system initialization, prediction phase and update phase. See reference [29] for specific implementation process for UKF algorithm.
In conclusion, the proposed SOC estimation method based on VOEM-AR-UKF can be divided into two stages:
(1)
Off line phase: the 3D drawing for order determination is generated according to BIC and the characteristic of EIS. The 1-RC and 2-RC model for order selection can be established by hybrid pulse power characteristic [30] (HPPC).
(2)
Online phase: input the real-time temperature, current and voltage values, and the model order is determined by looking up the 3D drawing, and then the order determination result can be arranged into corresponding autoregressive form, whose coefficients can be identified by FFRLS online. Finally, the UKF algorithm is adopted to estimate SOC, which is fed back to determine the model order at the next moment. Figure 12 shows the flow chart of the proposed method.

5. Results and Analysis

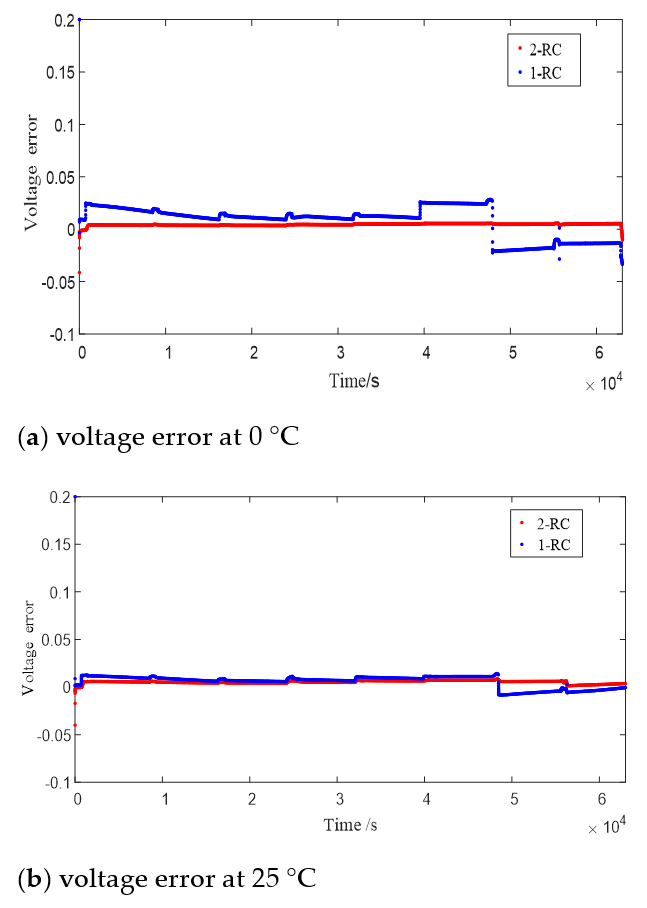
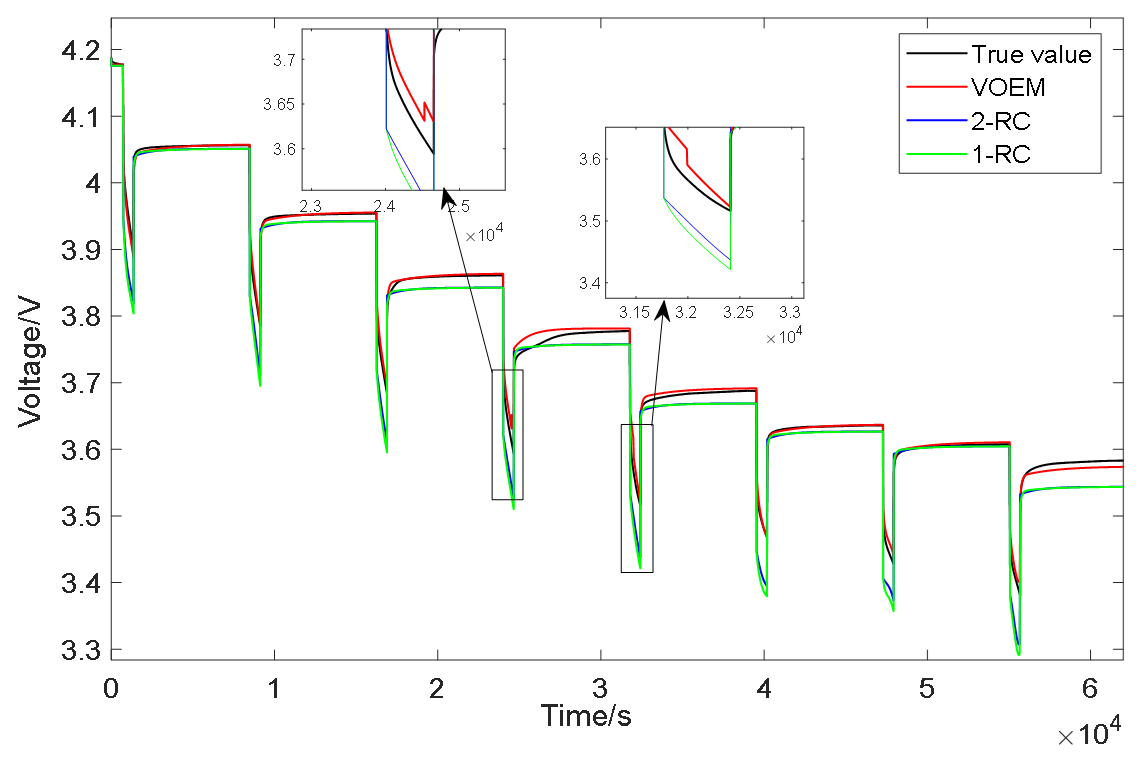
5.1. Model Validation

5.1.1. Constant Current Pulse Test

In order to verify the accuracy of the proposed variable order equivalent circuit model to describe the actual state of the battery, the model is verified by comparing the output results of the battery terminal voltage under different working conditions. Figure 13 shows comparison results of the variable order model and the traditional 1-RC and 2-RC model under the condition of constant current pulse discharge which was carried out at 0 °C. It can be seen from Figure 13 that the output value of the VOEM is closer to the experimental value than that of the conventional 1-RC and 2-RC model whether in the static stage or the discharge stage of the battery, which indicates that the VOEM can better describe the dynamic characteristics of the battery voltage; when the SOC is between 60% and 70%, the VOEM will switch from the 2-RC model to the 1-RC model, and when the SOC is between 50% and 60%, the VOEM will switch from the 1-RC model to the 2-RC model. When switching from the 2-RC model to the 1-RC model, it will deviate from the real value slightly, that is to say, the model accuracy will be slightly reduced, but at the same time, the model parameters are fewer and the structure is simpler, which also reflects that the BIC can comprehensively consider the model accuracy and model complexity when selecting the model order. Overall, the voltage estimation error of the VOEM is significantly lower than that of the conventional 1-RC and 2-RC models, which proves the superiority of the VOEM based on BIC order determination and temperature correction factor.

5.1.2. BJDST Test

The Beijing dynamic stress test (BJDST) is adopted to verify the proposed model further. The experiment is carried out at 45 °C. Figure 14 shows the terminal voltage output results of the VOEM, 1-RC and 2-RC model under this working condition. It can be seen from Figure 14 that when the SOC is between 70% and 80%, the VOEM switches from the 2-RC model to the 1-RC model; when the SOC is between 20% and 30%, the model switches from the 1-RC to the 2-RC; at the switching point of the model, the transition of voltage estimation value is smooth. At the same time, the voltage prediction error of the variable order model is significantly lower than that of the traditional 1-RC and 2-RC model, which reflects that the proposed VOEM can still describe the actual working state of the battery under different temperature and drastic condition, indicating good adaptability.

5.2. SOC Estimation

5.2.1. Constant Current Pulse Test

In order to verify the effectiveness of VOEM-AR-UKF algorithm for on-line SOC estimation, firstly, under the condition of constant current pulse discharge which is conducted at 0 °C, the proposed method is compared with the SOC estimation method based on the conventional 1-RC and 2-RC model. The state equation and observation equations of the 1-RC and 2-RC model are in the form of resistance capacitance Equation (9), and UKF is adopted to estimate SOC.
The mean absolute error (MAE) and root mean square error (RMSE) are adopted to describe the accuracy of the estimated results, see Equations (13) and (14):
M A E = 1 M i = 1 M s ^ i s i
R M S E = 1 M i = 1 M ( s ^ i s i ) 2
where M means total amount of the experimental data, and s i and s ^ i represents the ith true and estimated value of SOC, respectively. The calculation time Ttotal is adopted to present the efficiency of the these methods.
Figure 15 shows the SOC estimation results of the three methods under the constant current pulse discharge experiment. Obviously, the SOC estimation value of the proposed method is obviously closer to the real value than the SOC estimation method based on the 1-RC and 2-RC model. As shown in the enlarged part of Figure 13, when the SOC is between 60% and 70%, the VOEM will switch from the 2-RC model to the 1-RC model, while when the SOC is between 50% and 60%, the VOEM will switch from the 1-RC model to the 2-RC model, and the transition of SOC estimation value at the switching point is smooth. Table 4 shows the estimation error and computing time of the three methods. It can be seen that the total time of the proposed method in this paper is lower than that of the other two methods. The reason is that the state equation and observation equation in autoregressive form have the advantage of avoiding exponential computing and parameter inversion, which improves the calculation speed. Test result indicates that the proposed method is better than the conventional method in terms of estimation accuracy and efficiency.

5.2.2. DST Test

In order to further verify the applicability of the proposed SOC estimation method, the dynamic stress test (DST) is carried out at 45 °C, and the result is compared with the SOC estimation method combined with the 1-RC and 2-RC resistance capacitance equation and UKF algorithm, and Figure 16 shows the SOC estimation results of the three methods under DST condition.
As shown in the enlarged part of Figure 16, when the SOC is between 70% and 80%, the VOEM will switch from the 2-RC model to the 1-RC model, while when the SOC is between 20% and 30%, the VOEM will switch from the 1-RC model to the 2-RC model, and the transition of SOC estimation value at the switching point is smooth. Table 5 shows the estimation error and time of the three methods. It can be seen that the total calculation time of the proposed method is shorter than that of the traditional method, and the SOC estimation error is also far less than that of the traditional method, which indicates that the proposed method can still realize SOC online estimation accurately and efficiently under complex working conditions.

6. Conclusions

In view of the fact that the conventional single order RC models don’t take into account the variation of impedance characteristic under the coupling of temperature and SOC, as well as the balance between practicability and complexity of the model, this paper proposes a variable order equivalent circuit model by analyzing the influence of temperature and SOC on the impedance characteristics of lithium-ion battery based on the theory of electrochemical impedance spectroscopy. The Arrhenius equation and Bayesian information criterion are adopted to realize the reasonable choice of model order under different SOC and temperature. The introduction of an autoregressive equation can exempt the model from the dependence on parameter identification results of resistance and capacitance, as well as improve the calculation efficiency. Combined with an unscented Kalman filter algorithm, a new SOC estimation method for lithium-ion batteries is proposed: VOEM-AR-UKF, which has advantages over both in SOC estimation effect and calculation efficiency.
Constant current pulse tests at 0 °C and BJDST tests at 45 °C are carried out to validate the accuracy of the proposed model, which indicate the VOEM can simulate the actual voltage of a battery more accurately compared with 1-RC and 2-RC model. On this basis, SOC estimation experiments which are constant current pulse test at 0 °C and DST test at 45 °C are carried out to validate the SOC estimation effect of the proposed method, which indicate the VOEM-AR-UKF can achieve more accurate and efficient SOC estimation compared with conventional 1RC-UKF and 2RC-UKF method under different working conditions. As shown in Table 4 and Table 5, the MAE and RMSE of the proposed method are improved by at least one order of magnitude, compared with 1RC-UKF and 2RC-UKF, and the total computing time is shortened moderately, with improvements by 7.46% and 4.36%, respectively, under the two working conditions, compared with the more simpler 1-RC model, however, considering the SOC estimation with long time and multiple batteries, the improvement of computing time will be considerable. The electrochemistry impedance spectrum test offline is needed in the implement of the proposed method, which is not needed in the traditional method, but with the development of real-time impedance spectrum measurement technology, online impedance spectrum measurement technology based on BMS has been realized, which faciliates the online SOC estimation by the proposed method.
In practice, for different type of the batteries, the EIS testing before putting into use can help us acquire the impedance characteristic and determine the model order choice, and then on-line modelling of the battery and SOC estimation are carried out according to the determination results. The proposed method can be applied in the situations where SOC estimation of the lithium-ion battery is required, such as electric vehicle, DC substation, photovoltaic grid and so on, as a result of the universal applicability of EIS testing and the superior performance of the variable-order equivalent circuit model combined with the AR equation, which can achieve a more accurate and reasonable description of the working state of the battery and estimate the SOC online more efficiently.

Author Contributions

Conceptualization, J.Z.; Funding acquisition, P.W.; Methodology, J.Z. and Z.C.; Software, J.Z.; Writing—original draft, Y.L. All authors have read and agreed to the published version of the manuscript.

Funding

This research was funded by National Natural Science Foundation of China, grant number: 61873180.

Institutional Review Board Statement

Not applicable.

Informed Consent Statement

Not applicable.

Data Availability Statement

Not applicable.

Conflicts of Interest

The authors declare no conflict of interest.

References

  1. Rahimi-Eichi, H.; Ojha, U.; Baronti, F.; Chow, M.Y. Battery Management System: An Over-view of Its Application in the Smart Grid and Electric Vehicles. IEEE Ind. Electron. Mag. 2013, 7, 4–16. [Google Scholar] [CrossRef]
  2. Han, X.; Ouyang, M.; Lu, L.; Li, J. A comparative study of commercial lithium ion battery cycle life in electric vehicle: Capacity loss estimation. J. Power Sourse 2014, 268, 658–669. [Google Scholar] [CrossRef]
  3. Ng, K.S.; Moo, C.S.; Chen, Y.P.; Li, J. State-of-Charge Estimation for Lead-Acid Batteries Based on Dynamic Open-Circuit Voltage. In Proceedings of the IEEE International Power & Energy Conference, Johor Bahru, Malaysia, 1–3 December 2008. [Google Scholar]
  4. Pang, H.; Guo, L.; Wu, L.; Jin, X. An enhanced temperature-dependent model and state-of-charge estimation for a Li-Ion battery using extended Kalman filter. Int. J. Energy Res. 2020, 44, 7254–7267. [Google Scholar] [CrossRef]
  5. Yan, M.; Bingsi, L.; Guangyuan, L.; Li, G.; Zhang, J.; Chen, H. A Nonlinear Observer Approach of SOC Estimation Based on Hysteresis Model for Lithium-ion Battery. IEEE/CAA J. Autom. Sin. 2017, 4, 195–204. [Google Scholar]
  6. Gholizadeh, M.; Yazdizadeh, A. Systematic mixed adaptive observer and EKF approach to estimate SOC and SOH of lithium-ion battery. IET Electr. Syst. Transp. 2020, 10, 135–143. [Google Scholar] [CrossRef]
  7. Fuller, T.F.; Doyle, M.; Newman, J. Simulation and Optimisation of the Dual Lithium Ion Insertion Cell. J. Electrochem. Soc. 1994, 141, 1–10. [Google Scholar] [CrossRef] [Green Version]
  8. Lai, X.; Gao, W.K.; Zheng, Y.J.; Ouyang, M.; Li, J.; Han, X.; Zhou, L. A comparative study of global optimization methods for parameter identification of different equivalent circuit models for Li-ion batteries. Electrochim. Acta 2019, 295, 1057–1066. [Google Scholar] [CrossRef]
  9. Ding, X.; Zhang, D.; Cheng, J.; Wang, B.; Luk, P.C.K. An improved Thevenin model of lithium-ion battery with high accuracy for electric vehicles. Appl. Energy 2019, 254, 113615. [Google Scholar] [CrossRef]
  10. Castano-Solis, S.; Serrano-Jimenez, D.; Fraile-Ardanuy, J.; Sanz-Feito, J. Hybrid characterization procedure of Li-ion battery packs for wide frequency range dynamics applications. Electr. Power Syst. Res. 2019, 166, 9–17. [Google Scholar] [CrossRef]
  11. Wang, J.; Zhang, L.; Xu, D.; Zhang, P.; Zhang, G. A Simplified Fractional Order Equivalent Circuit Model and Adaptive Online Parameter Identification Method for Lithium-Ion Batteries. Math. Probl. Eng. 2019, 2019, 6019236. [Google Scholar] [CrossRef]
  12. Zhang, X.; Lu, J.; Yuan, S.; Yang, J.; Zhou, X. A novel method for identification of lithium-ion battery equivalent circuit model parameters considering electrochemical properties. J. Power Sources 2017, 345, 21–29. [Google Scholar] [CrossRef]
  13. Hu, M.; Li, Y.; Li, S.; Fu, C.; Qin, D.; Li, Z. Lithium-ion battery modeling and parameter identification based on fractional theory. Energy 2018, 165, 153–163. [Google Scholar] [CrossRef]
  14. Middlemiss, L.A.; Rennie, A.J.R.; Sayers, R.; West, A.R. Characterisation of batteries by electrochemical impedance spectroscopy. Energy Rep. 2020, 6, 232–241. [Google Scholar] [CrossRef]
  15. Xiong, R.; Tian, J.; Mu, H.; Wang, C. A systematic model-based degradation behavior recognition and health monitoring method for lithium-ion batteries. Appl. Energy 2017, 207, 372–383. [Google Scholar] [CrossRef]
  16. Barsoukov, E.; Macdonald, R.J. Impedance Spectroscopy: Theory, Experiment, and Applications; John Wiley & Sons, Inc.: Hoboken, NJ, USA, 2005. [Google Scholar]
  17. Farmann, A.; Waag, W.; Sauer, D.U. Application-specific electrical characterization of high power batteries with lithium titanate anodes for electric vehicles. Energy 2016, 112, 294–306. [Google Scholar] [CrossRef]
  18. Waag, W.; Kaebitz, S.; Sauer, D.U. Experimental investigation of the lithium-ion battery impedance characteristic at various conditions and aging states and its influence on the application. Appl. Energy 2013, 102, 885–897. [Google Scholar] [CrossRef]
  19. Caiping, Z.; Jiuchun, J.; Weige, Z.; Qiujiang, L.; Yan, L. Characterization of Electrochemical Impedance Equivalent Model and Parameters for Li-ion Batteries Echelon Use. Autom. Electr. Power Syst. 2013, 37, 54–58. [Google Scholar]
  20. Galeotti, M.; Lucio, C.; Giammanco, C.; Cordiner, S.; Carlo, A.D. Performance analysis and SOH (state of health) evaluation of lithium polymer batteries through electrochemical impedance spectroscopy. Energy 2015, 89, 678–686. [Google Scholar] [CrossRef]
  21. Momma, T.; Matsunaga, M.; Mukoyama, D.; Osaka, T. Ac impedance analysis of lithium ion battery under temperature control. J. Power Sources 2012, 216, 304–307. [Google Scholar] [CrossRef]
  22. Svens, P.; Eriksson, R.; Hansson, J.; Behm, M.; Gustafsson, T.; Lindbergh, G. Analysis of aging of commercial composite metal oxide-Li4Ti5O12 battery cells. J. Power Sources 2014, 270, 131–141. [Google Scholar] [CrossRef]
  23. Coman, P.T.; Darcy, E.C.; Veje, C.T.; White, R.E. Modelling Li-Ion Cell Thermal Runaway Triggered by an Internal Short Circuit Device Using an Efficiency Factor and Arrhenius Formulations. J. Electrochem. Soc. 2017, 164, A587–A593. [Google Scholar] [CrossRef] [Green Version]
  24. Zhang, Y.; Wang, C.Y. Cycle-Life Characterization of Automotive Lithium-Ion Batteries with LiNiO2 Cathode. J. Electrochem. Soc. 2009, 156, A527–A535. [Google Scholar] [CrossRef]
  25. Lee, E.R.; Noh, H.; Park, B.U. Model selection via Bayesian information criterion for quantile regression models. J. Am. Stat. Assoc. 2014, 109, 216–229. [Google Scholar] [CrossRef]
  26. Fang, L.; Jie, M.; Weixing, S.; Ruzhen, D. State of Charge Estimation Method of Electric Vehicle Power Battery Life Cycle Based on Auto Regression Extended Kalman Filter. Trans. China Electrotech. Soc. 2020, 35, 698–707. (In Chinese) [Google Scholar]
  27. Long, H.-Y.; Zhu, C.-Y.; Huang, B.-B.; Piao, C.H.; Sun, Y.Q. Model Parameters Online Identification and SOC Joint Estimation for Lithium-Ion Battery Based on a Composite Algorithm. J. Electr. Eng. Technol. 2019, 14, 1485–1493. [Google Scholar] [CrossRef]
  28. Jinlong, Z.; Yanjun, W.; Xiangli, L.; Di, Z.; Hanhong, Q. Battery SOC Estimation Based on Online Parameter Identification. Trans. China Electrotech. Soc. 2014, 29, 23–28. [Google Scholar]
  29. He, Z.; Chen, D.; Pan, C.; Chen, L.; Wang, S. State of charge estimation of power Li-ion batteries using a hybrid estimation algorithm based on UKF. Electrochim. Acta 2016, 211, 101–109. [Google Scholar]
  30. Yang, Q.; Xu, J.; Li, X.; Xu, D.; Cao, B. State-of-health estimation of lithium-ion battery based on fractional impedance model and interval capacity. Electr. Power Energy Syst. 2020, 119, 105883. [Google Scholar] [CrossRef]
Figure 1. Typical structure of electrochemical impedance spectroscopy of lithium ion battery.
Energies 14 00769 g001
Figure 2. The experimental device.
Energies 14 00769 g002
Figure 3. EIS measurement results at 25 °C.
Energies 14 00769 g003
Figure 4. EIS measurement results at 0 °C.
Energies 14 00769 g004
Figure 5. Fitting results of equivalent circuit model with SOC = 50% at different temperatures.
Energies 14 00769 g005aEnergies 14 00769 g005b
Figure 6. Fitting results of equivalent circuit model for different SOC values at 25 °C.
Energies 14 00769 g006aEnergies 14 00769 g006b
Figure 7. OCV-capacity relationship at different temperatures.
Energies 14 00769 g007
Figure 8. Error of model estimated voltage.
Energies 14 00769 g008aEnergies 14 00769 g008b
Figure 9. BIC value and difference between first-order model and second-order model.
Energies 14 00769 g009aEnergies 14 00769 g009b
Figure 10. 3D order determination drawing of BIC.
Energies 14 00769 g010
Figure 11. Order determination with 0 as the dividing line.
Energies 14 00769 g011
Figure 12. The flow chart of VOEM-AR-UKF algorithm for SOC online estimation.
Energies 14 00769 g012
Figure 13. Voltage simulation results of constant current pulse discharge experiment.
Energies 14 00769 g013
Figure 14. Voltage simulation result of BJDST experiment.
Energies 14 00769 g014
Figure 15. SOC estimation results of three methods under constant current pulse discharge experiment.
Energies 14 00769 g015
Figure 16. SOC estimation results of three methods under DST condition experiment.
Energies 14 00769 g016
Table 1. Test steps of EIS.
StepContent
1Charge with constant current of 1.5 A at room temperature until the terminal voltage reaches 4.2 V
2Charge at constant voltage of 4.2 V until the current is less than 150 mA, that is, the battery is fully charged.
3Adjust the incubator to T °C and let the battery stand for 3 h
4EIS measurement, frequent range: 0.01 Hz—10 kHz
5The battery is discharged at constant current 1C to 90% SOC, 70% SOC, 50% SOC, 30% SOC, 20% SOC and 10% SOC respectively, and then repeat steps 3–5 until EIS under all SOC is measured.
Table 2. Constant current pulse experiment steps.
StepContent
1Charge with constant current of 1.5 A at room temperature until the terminal voltage reaches 4.2 V
2Charge at constant voltage of 4.2 V until the current is less than 150 mA, that is, the battery is fully charged.
3Standing for 3 h at −10 °C
4The discharge at constant current of 1C is suspended when the battery SOC drops by 0.1, and the OCV is recorded after standing for 1 h, and then continues until the battery is empty. Data were collected every 0.2 s.
5Standing for 3 h and repeat steps 1–2
6Change the temperature T = 0 °C, 25 °C and 45 °C respectively, and then repeat the test steps 4–6
Table 3. Parameter fitting results.
aTbTSSER-Square
17.5860844.13880.001620.99164
Table 4. Estimation results of three methods under constant current pulse discharge experiment.
1RC-UKF2RC-UKFVOEM-AR-UKF
MAE0.01140.01070.0008
RMSE0.01280.01230.0015
Ttotal/s6.838.596.32
Table 5. Estimation error of three methods under DST experiment.
1RC-UKF2RC-UKFVOEM-AR-UKF
MAE0.01690.01030.0007
RMSE0.01760.01150.0055
Ttotal/s4.355.224.16
Publisher’s Note: MDPI stays neutral with regard to jurisdictional claims in published maps and institutional affiliations.

