Abstract
Renewable microgrids are new solutions for enhanced security, improved reliability and boosted power quality and operation in power systems. By deploying different sources of renewables such as solar panels and wind units, renewable microgrids can enhance reducing the greenhouse gasses and improve the efficiency. This paper proposes a machine learning based approach for energy management in renewable microgrids considering a reconfigurable structure based on remote switching of tie and sectionalizing. The suggested method considers the advanced support vector machine for modeling and estimating the charging demand of hybrid electric vehicles (HEVs). In order to mitigate the charging effects of HEVs on the system, two different scenarios are deployed; one coordinated and the other one intelligent charging. Due to the complex structure of the problem formulation, a new modified optimization method based on dragonfly is suggested. Moreover, a self-adaptive modification is suggested, which helps the solutions pick the modification method that best fits their situation. Simulation results on an IEEE microgrid test system show its appropriate and efficient quality in both scenarios. According to the prediction results for the total charging demand of the HEVs, the mean absolute percentage error is 0.978, which is very low. Moreover, the results show a 2.5% reduction in the total operation cost of the microgrid in the intelligent charging compared to the coordinated scheme.
1. Introduction
A renewable microgrid is a new competitive and cleaner generation of microgrids, which can make the situation for power generation low cost [1] and result in very low emissions [2], mitigating the amount of carbon emission per year [3]. In this way, different renewable energy sources, such as wind units [4], solar units, hydro units, and biomass units [5], can significantly help in achieving this goal. The results of such a new technology is reduced power losses, costs [6], voltage deviation and enhanced power quality and operation results. Solar energy is captured through some panels that are located in the microgrid, making a flat space for energy trapping in a renewable way [7]. Similarly, the wind units convert the kinetic energy of speed into electricity through some blades that are installed on top of the tower. Other than these renewable sources, the battery storages are always an inevitable part of renewable microgrids due to the highly volatile and non-dispatchable nature of the units [8]. In fact, all power produced by the renewable sources need to be purchased after generation since these units are uncontrollable in terms of power dispatch. A good solution is to store them in storage units and use the energy for peak-load hours later [9]. This is a wise policy, which not only mitigates the operating costs but also supports the ever growing progress of the renewable sources. In fact, it is not possible to think of renewable energy sources without the storage units. This shows the necessity of the research in this field specially when considering the new modern devices such as electric vehicles or automation systems. In recent years, many research works have been implemented, and a summary on the most significant topics on the energy management is given here.
Wang et al. [10] assessed the optimal energy management in renewable microgrids considering wind units, solar panels and battery. The proposed method optimizes the total operation costs by regarding the practical constraints. The role of hybrid wind-solar units on the management of a renewable microgrid is assessed in [11]. It is shown there that a higher penetration of the hybrid renewables can give promising solutions if managed properly. In [12], a stochastic method based on Monte Carlo is developed to model the uncertainty effects associated with the renewable sources in a stochastic framework. The results show that considering the uncertainty effects can bridge to a realistic solution that has considered the possible fuzziness injected into the grid. In [13], a data-driven framework is suggested for operation and management of renewable microgrids. The model uses big data for making economic and technical decisions and operating the system carefully. The same research but with a focus on the wireless sensor networks [14] is implemented in [15] in the microgrids. It is seen that a renewable microgrid is equipped with many sensors, which are always vulnerable against cyber hacking. In order to secure the decision-making process, a data intrusion detection approach based on prediction intervals is developed. This method would create a lower and an upper bound around the sample points and let the operator detect any abnormality in the model behavior. In [16], hydrogen production and thermal energy recovery of the fuel cell are investigated in a renewable microgrid. It is shown that considering the thermal aspect and hydrogen storage can enhance the efficiency of the units between 9 and 18% at peak load. In [17], a multi-objective structure is devised, which optimizes the power losses and costs in the renewable sources by optimal switching. Similar work on the effect of switching on the optimal policy and management of the microgrids is implemented in [18]. In [19], authors assessed the effect of electric vehicles on the microgrids operation. It is shown in [20] that the charging demand of electric vehicles needs to be modeled based on accurate inspection and investigation of their random behavior [21] in a complex environment [22]. While modeling the real effects of electric vehicles on the system is a necessity, finding a way to mitigate their effects and change it to opportunities for the microgrid is a research challenge [23]. In response to this need, the vehicle to grid (V2G) idea [24] is well assessed in the microgrids by the researchers to reduce the operation costs and provide a win-win game [25] for both the car owners and the microgrid operators. In this idea, the vehicle attends the charging and discharging plans based on an incentive program and thus may be regarded as mobile storage in the system. By drawing the unused stored energy of the car and injecting it into the smart grid, V2G technology is also known as “vehicle-grid integration” that can help energy supply at the peak load hours.
This paper investigates the policy development and energy management in the renewable microgrids considering wind units, solar panels, battery storage and hybrid electric vehicles (HEVs). In order to check the demand response problem in the microgrids, adjustable loads of two types including the shiftable loads and curtailable loads are modeled and considered in the model. A comprehensive model is proposed to model all components of the microgrid and optimize the total operation cost over a 24 h time horizon. The proposed method uses advanced machine learning based on support vector regression (SVR) to predict the total amount of charging demand by the electric vehicles. In contrast to the conventional machine learning methods, such as artificial neural network (ANNs), the SVR model can make a reliable prediction with high accuracy without the risk of overfitting due to the complex data [26]. Considering the highly chaotic and nonlinear nature of the data, a new optimization method based on dragonfly is introduced to optimize the setting parameters of the SVR such that more optimal hyperplanes would be attained. Due to the high complexity of the proposed discrete optimization problem, a new optimization algorithm based on the dragonfly algorithm (DA) is developed to manage the optimal scheduling of the units, loads, storages and switches in the microgrid. DA is a new heuristic optimization algorithm that mimics the fly of some insects and makes a powerful algorithm for solving the hard problems [27]. To enrich its performance, a novel self-adaptive modification method is introduced, which makes it possible for dragonflies to select the solution that best matches their structure. This would reduce the computational burden and mitigate their algorithm efforts for finding the real global solution. Considering the high penetration of HEVs in the modern microgrids, a reconfigurable structure is considered through the remotely embedded control switches to change the power flow path in the microgrid and thus avoid feeder congestion and improve the voltage profile and operation costs. The proposed model is constructed as a single-objective optimization problem [28] optimizing the cost of operation over 24 h. Therefore, the main paper contributions can be summarized as below:
- Proposing a novel operation and management framework for the reconfigurable microgrids considering the high penetration of HEVs (with two different charging schemes) and renewable energy sources;
- Developing a novel hybrid prediction model based on SVR and MDA for accurate estimation of the total charging demand of HEVs in the microgrid;
- Proposing a new optimization method based on DA and a three phase modification method to enhance its search ability for the optimization applications.
The performance of the model is assessed on an IEEE microgrids test system [29,30].
The paper structure is organized as follows: Section 2 explains the proposed machine learning based approach on SVR and modified DA (MDA). The HEVs behaviors and charging patterns are described in Section 3. In Section 4, the problem formulation addressing the comprehensive model of the microgrid is explained. The experimental results on the IEEE microgrid are discussed in Section 5. Finally, the main ideas are proposed in Section 6.
2. Machine Learning Based Policy Development and Energy Management Framework
This section is composed of two main parts; (1) a modeling tool based on SVR and (2) an optimization tool based of MDA. Each of these parts is described in the rest of the paper.
2.1. Machine Learning Based on SVR
In order to model the electric vehicles charging demand, this section explains the SVR model. SVR fundamentally is an advanced version of the traditional AI based models, which try to find the unknown relationship between the input and outputs in a system. In contrast to the neural networks (NNs), which focus on optimizing the training error even with sacrificing the generalization ability of the model, the SVR models consider the model complexity besides the training error. This means that SVR assumes a hyper plane over the model to avoid high complexity and tries to minimize the error of training as a balancing solution. To better perceive the concept, let us consider the training samples as . The goal is to find the highest fitting nonlinear (or even linear) function φ (.) on the sample set such that the input and output datasets are functionalized in a higher space of dimension . In such a space, the linear function f exists, which learns the nonlinear relationship of the lower dimension as below [31]:
where α and β are the setting constants of the model. In order to find their exact values, one needs to solve the following Equations [20]:
where is the loss function parameter, which penalizes high training errors. The above constraint problem can be converted into this combinatorial formulation as (4):
where C is the trade-off keeping parameter between the model complexity and the training error. The first term in (4) represents the inner product of the model setting parameters, which somehow shows the model density.
The constraints that are needed to be considered when solving (4) can be named as below:
After solving this problem, the optimal value of α is calculated as below:
The final shape of the SVR model can be shown based on the kernel function as below:
where are the dual parameters and K is the kernel function. The type of the kernel function can affect the prediction accuracy [32]. This paper uses the radial basis function due to its simplicity and high mapping features:
where σ is the standard deviation of the kernel.
Figure 1 shows the SVR model and hyper plane parameters. In this figure, the red and black balls show the two classes of data and the goal is to decide which class a new data point will be in. To this end, SVR will try to separate such a point (classes of data) with a hyperplane. The dotted lines in the figure show the boundaries of the hyperplane, which is determined through the optimization in a higher dimensional space. More information for the interested readers can be found in [20].
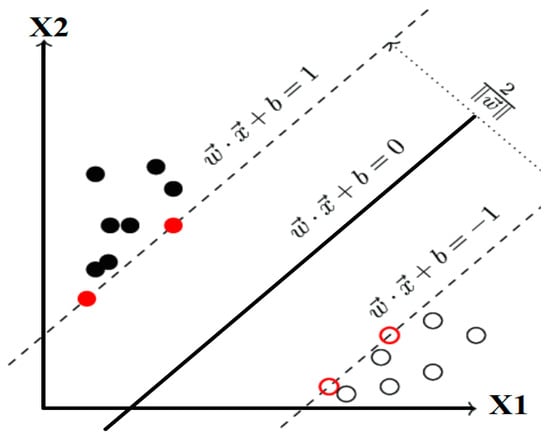
Figure 1.
Position of hyper parameters in support vector regression (SVR) .
2.2. Improved Optimization Based on MDA
In order to make accurate predictions, the SVR setting parameters of C and σ need to get adjusted properly. This paper introduces the MDA, which is inspired by the dragonflies. DA is an evolving algorithm that works based on random flights of some insects when searching for food. This algorithm has special characteristics including the low number of setting parameters, compatible with continuous and discrete optimizations, and access to local and global operators of the search. The movement of each dragonfly is influenced by five factors, which are explained by the following [33,34].
The first one is the “separation” factor, which keeps a logical distance between the different agents as below:
The second motivation is called “alignment”, which measures and adjusts the speed of an agent with others in the surrounding area:
The third motivation is the “cohesion”, which pretends the movement of the individuals to the center of mass population as below:
The next motivation factor is called “attraction”, which describes the way of movement of each solution in the DA toward the food position:
The last motivation factor is called “distraction”, which shows the defense mechanism of dragonflies from their enemies.
The algorithm repeats this process until the food location and solutions’ quality are improved. In each iteration, the best solution position is updated and called Xbest. The enemy situation is also updated in accordance with the worst candidate in the population. All the above motivation factors are then mixed up with different weighting factors to make a united factor as below [27]:
It is proved in [27] that the value of the weighting factor can be adjusted as below:
where ρ is extracted out as follows:
Therefore, each candidate solution is updated as below:
In order to boost the DA performance, the adaptive formulation of modified solutions is presented in this part. At first each modification is explained:
Modification 1: This strategy adds to the diversity of the dragonflies by the use of a crossover-operator. To this end, three dissimilar solutions are taken out such that (θ1 ≠ θ2 ≠ θ3 ≠ θi):
Now, three test individuals are produced as follows:
Modification 2: This strategy will add the population solution types by making some information changing process among the solutions as below:
In order to make it adaptive, every dragonfly in the population should have a weighting factor. Similarly, a success rate (SR) is assigned to each modification, which is 0.5 at the beginning. According to the objective function value, each solution would attain a weighting as below:
Also, an accumulator is defined for each modification such that initially accums = 0 and it is updated as below:
Also, the SR index is then updated according to the accum as below:
It is clear that the SR value needs to get updated per unit as below:
Figure 2 shows the schematic explanation of the proposed adaptive algorithm.
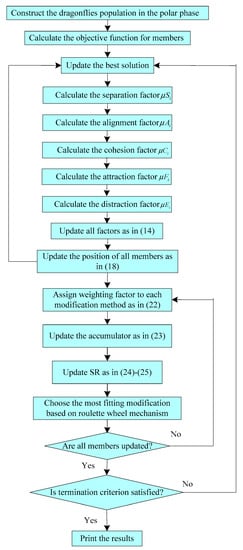
Figure 2.
Flowchart of the proposed modified dragonfly algorithm (MDA).
3. Charging Modeling of HEVs
The charging behavior of HEVs is an element of many factors including the market share, the state of charge (SoC), charging time and length, etc. In order to consider the HEVs’ effects in the system, all these uncertain factors need to be well-defined to inject less randomness to the system. This paper makes use of the SVR method for prediction of the overall charging demands of HEVs. From the technical point of view, HEVs can get energy from either gas or electricity. Figure 3 shows the main components in HEVs [35]. In Figure 3, the cylinder shows the fuel storage since the HEVs work partly based on electricity and partly based on the fossil fuels.
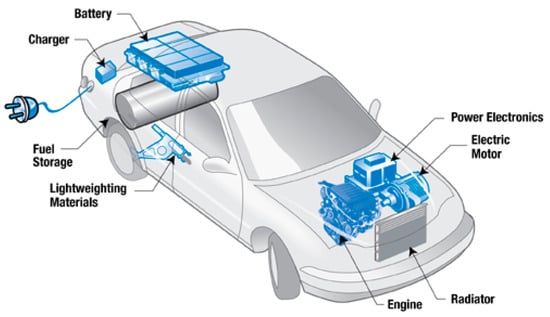
Figure 3.
Main components in a typical hybrid electric vehicle (HEV).
Still, we need to find a way to understand the distribution the charging in these vehicles. To this end, two different strategies are considered. Coordinated charging and intelligent charging.
In the coordinated charging, HEVs are forced (or better to say allowed) to discharge at specific hours. These hours are based on the daily pattern life of the customers. It means that car owners can start charging after work but at off-peak hours, around 6 p.m. to 7 p.m.:
The second pattern, which may be regarded in the charging, is intelligent charging, which will let the vehicles charge according to the electrical load curve of the microgrid and bidding offers by the power companies. This strategy is modeled according to the normal distribution function as below:
After knowing the starting time, the amount of charging demand by HEVs is determined according to their battery SoC. For estimating the SoC, one needs to find the average mileage passed by each vehicle. According to the statistics, the average mileage of each vehicle can be estimated as below:
Having m, the battery SoC is determined through a straightforward equation as below:
where ER is the total electric range, i.e., if mileage is more than this, the vehicle will shut down. Based on the literature, ER can take values of (20,30,49,60) depending on the car type. Having SoC and the battery capacity, the charging length can be well estimated by the following equation:
From Equation (30) it is seen that charging time also depends on the charger type Pc and efficiency ηc.
According to the Society of Automotive Engineers (SAE), all EVs produced by U.S. automakers must follow the SAE Surface Vehicle Recommended Practice J1772 standard. Table 1 and Table 2 provide four charger types for four different classes of HEVs in the U.S. based on the SAE standard. These data will be used further in the simulation results for making a comprehensive analysis.

Table 1.
Charger type in HEVs [36].
Table 2.
HEV classes [36].
The market share of HEVs is randomly determined based on their type/class in Table 2 with a normal distribution function with characteristics of mean and standard deviation as below:
4. Problem Formulations
In the energy management problem, the most important task of the operator is providing a reliable and secure energy to the electrical users but with the least cost [37,38]. Therefore, the objective function is a mix of the cost of operation and technical costs as below [39,40]:
The main operation limits of the problem that should be considered when optimizing the above cost function are as follows. In this formulation, Equations (33)–(38) belong to the DGs, (39)–(45) belong to the energy storages, (46)–(48) belong to the adjustable loads and (49)–(56) belong to the load flow and power balance limits.
- -
- Active and reactive power limit of DGs:
- -
- Ramp up/down limits:
- -
- Minimum up and down time limit:
- -
- Charging/discharging limit of battery storage:
The total energy stored in the battery can be calculated as below:
Moreover, it is sometimes needed to consider a minimum charging and discharging time for the storages as below:
It is clear that the storage unit can be in one of the charging or discharging modes at any time as below:
- -
- Adjustable load demand:
The adjustable loads, either curtailable or shiftable, can help much to mitigate the operation cost and improve the voltage profile and are scheduled as below:
Generation and demand balance:
- -
- Bus voltage limit:
- -
- Main grid power limit:
- -
- Reconfiguration using the remote switches:Optimal switching is a strategic tool for altering the power flow path in the microgrid using the tie (normal open) switches and sectionalizing (normal closed). To this end the binary variable is used, which can get 0 and 1 to show the closed or open status of a line:
The network reconfiguration, which is made by the use of the remotely controlled switches, can be made at any time interval as long as it meets the technical limitations of the switches. In our case study, the system can experience the reconfiguration in every hour, which means the system may get up to 24 different topologies during a day. Considering the very short time needed for a switch operation (less than a minute in the automated type), it is possible to make more reconfigurations in a day according to the automation system.
5. Simulation Results
In order to check the proposed machine learning based model performance, an IEEE microgrid test system was used and is introduced in this section [36]. The diagram of the test system is shown in Figure 4. The complete network data including the bus data and branch data are provided in the Appendix A. As it can be seen in this figure, two wind units, two solar panels and some switches are located in the microgrid. Moreover, HEVs are distributed all around the grid and asking for charging demand according to their probability distributions but equally among all buses. The tie switches are located between the buses 11–66, 15–69, 13–20, 27–54 and 39–58. Therefore, there are total 73 remote switches installed in the grid among which 68 are sectionalizing and are ready for reconfiguration maneuver if needed. The microgrid is providing an appropriate portion of its electrical load demands from the renewable energy sources of wind turbine and solar panel. Figure 5 shows the solar panel and the wind turbine output power pattern per unit. Similar patterns are considered for wind turbines with capacities of 142 and 250 kW. Also, the same power generation patterns are assumed for solar panels with capacities of 200 and 180 kW to avoid unnecessary complexities [41]. Table 3 provides raw data for the total energy charging demand of the HEVs in July 2019 recorded in California (the full dataset is for January–July 2019) [42]. These data help to have a clearer picture of the random and hard-to-predict nature of the charging demand of the HEVs in the system. As it was mentioned in Section 3, it is the role of the proposed model to determine how the total energy charging demand in the target day of operation (which of course is predicted) would be distributed according to the intelligent or coordinated charging pattern. As is shown in Figure 4, a battery storage unit is installed in the microgrid, and its characteristics are shown in Table 4. Moreover, the characteristics of the adjustable loads are shown in Table 5. It is seen that there are four adjustable loads considered in the microgrid, some of which some are shiftable, as shown by S, and some are curtailable and are shown by C. The MDA has an initial population of 40, which is upgraded after a hundred iterations.
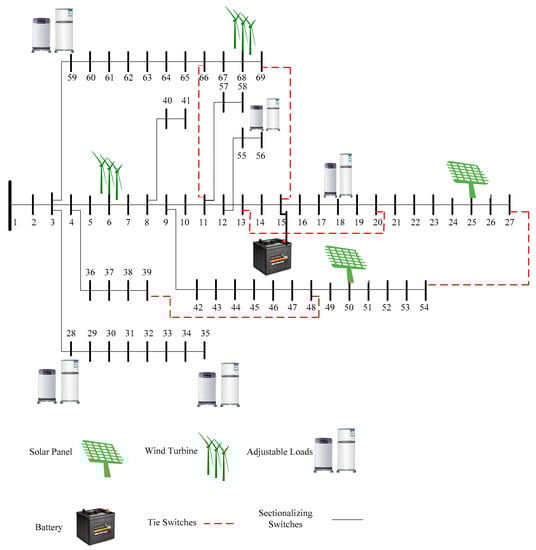
Figure 4.
Picture of the automated grid test system.
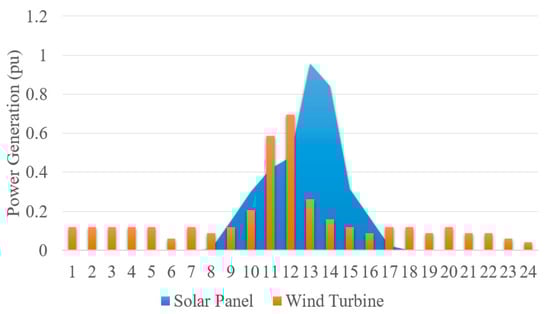
Figure 5.
Wind turbine and solar panel power generation patterns.
Table 3.
Historical raw data of the total energy charging demand of HEVs over a month in the microgrid.
Table 4.
Characteristics of the energy storage.
Table 5.
Characteristics of adjustable loads (s: shiftable, c: curtailable).
The historical data of the total energy charging demand of HEVs for half-a-year in the test system are used to train the SVR model with adjusting parameters fixed by the MDA [43]. Therefore, the total charging demand of the HEVs over 24 h is predicted using the proposed SVR-MDA based model [44]. To have a fair comparison, the prediction is made over 10 days with the use of some of the most well-known methods such as autoregressive–moving-average (ARMA), artificial neural network (ANN), SVR and SVR-DA (without modifications in MDA) [45]. Moreover, the prediction accuracy is calculated using three key criteria of mean absolute percentage error (MAPE), mean absolute relative percentage error (MARPE) and root mean square error (RMSE) as below [46]:
where Nv shows the number of forecast samples and is the forecast/real value of the total charging demand sample of HEV [47]. Table 6 shows the prediction using different methods. According to these results, the proposed hybrid method based on SVR-MDA could provide much higher accuracy in terms of MAPE, MARPE and RMSE concurrently. This shows not only the high accuracy of the proposed prediction model for estimating the total charging demand of the HEVs, but also shows the appropriate search ability of the MDA by effective adjustment of the parameters in SVR. The superiority of the search optimization algorithm of MDA over the original version of DA can be deduced from the low values of MAPE, RMSE and MARPE [48].
Table 6.
Forecasting total charging demand of HEVs using different methods.
In order to compare different charging strategies, the total load demand is distributed in both coordinated and intelligent strategies to assess their effects on the system (coinciding with the peak load hours). Figure 6 shows the HEV charging demand curves, comparatively. In order to have a better perception of the system energy demand without HEVs and DGs, Figure 7 is also shown here. From Figure 6 it is easily deduced that the intelligent charging is shifting the load demand based on the hourly peak load and price. In fact, the intelligent charging pattern considers not only the peak load hours, but also the market price, which will result in a wise and economic distribution of the power demand by these technologies. This is so important that without it, unexpected costs due to the coinciding of the HEV demand with the static load demands of the microgrid may happen. Figure 8 shows the hourly electricity market price over 24 h.
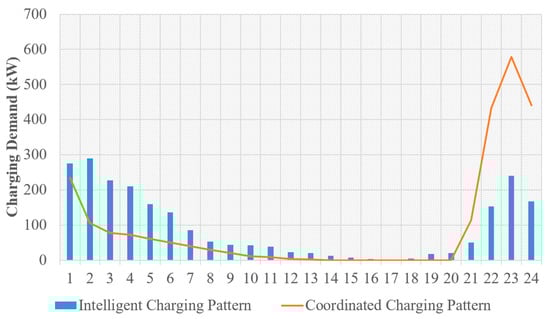
Figure 6.
Comparative curves of coordinated and intelligent charging patterns.
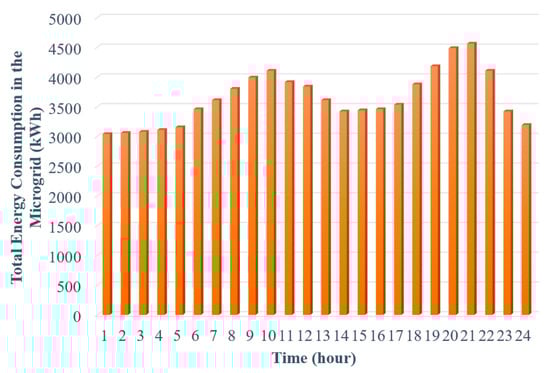
Figure 7.
Total energy consumption value in the microgrid in the base case (ignoring HEVs’ demand and DGs).
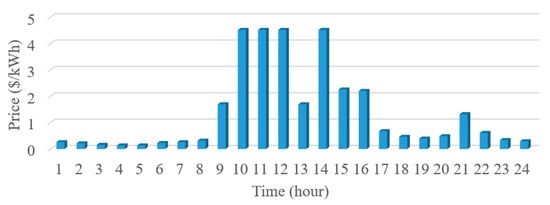
Figure 8.
Hourly market price for the microgrid.
In order to assess the high search features of the proposed MDA, its performance is compared with other algorithms and the cost function results for 24 h of scheduling are given in Table 7. In order to make a fair comparison, algorithms of particle swarm optimization (PSO) [49,50], genetic algorithm (GA) [51,52] and original DA are deployed to solve the optimal energy management problem in the microgrid for 20 trails and the results of the best, worst, standard deviation and average values are provided in the table. According to these results, the proposed MDA shows more qualified results over the GA, PSO and DA in terms of finding the more optimal solution. It is seen that even the worst solution found by the MDA still is better than the best solution found by the GA. The very close value of the average index to the best solution shows the reliable optimization process [53]. The CPU time is also in seconds, which is simulated using a 2.4-GHz personal computer using MATLAB 2016.b. From the computational efforts, it is deduced that the proposed MDA could find the optimal power sharing and unit scheduling in a lower time with fewer efforts. This advocates the high efficiency and appropriate search ability of the MDA. From the standard deviation point of view, the lower value of this index for the proposed method shows the high robustness of the optimization algorithm [54]. In order to make a clear picture of the convergence capability of the different algorithms, Figure 9 is provided here. In this figure, the convergence response of the MDA, DA, PSO and GA are compared over a hundred iterations. According to the curves, the proposed MDA shows a higher performance for finding the optimal solution in the first iterations. Other algorithms have trapped in the local optima. The reliable performance and appropriate search ability can be deduced from these results as well.
Table 7.
Robustness and searching features of different optimization algorithms: minimizing total microgrid cost over 20 trails for 24 h of operation.
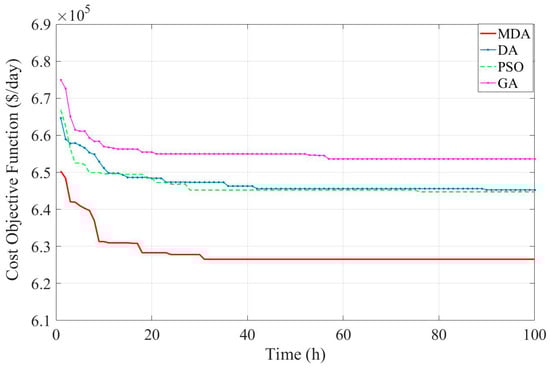
Figure 9.
Comparison of the convergence curves of different optimization methods for optimizing the total cost function value.
Table 8 shows the optimal output power of the solar panel, wind turbine and charging demand of the HEVs over 24 h using the proposed method. According to these results, it is seen that all renewable units are producing as the predicted results. Moreover, the HEVs are charging based on the coordinated and smart charging demands.
Table 8.
Output power of wind units and solar panels along with the charging demands of HEVs.
In order to make a better comparison, the microgrid hourly cost over 24 h before and after switching is provided in Figure 10. According to the results in Figure 10, the use of network reconfiguration could help significantly in reducing the losses and providing better dispatch of units [55,56]. Also, the system is experiencing lower costs in every hour, showing the necessity of switching. These results clearly prove the high quality act of the proposed model for renewable microgrids [57,58].
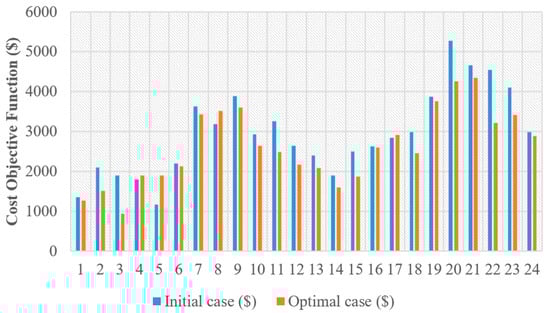
Figure 10.
Hourly cost of the microgrid before and after optimal switching operation.
Table 9 shows the optimal scheduling of the storage unit and the adjustable loads in the microgrid. As it can be seen in this table, the battery is charging at the first hours of the day (negative values) and discharge at later hours (positive values), which would reduce the total microgrid operation cost. The same pattern is repeated in the afternoon, when the battery is charging to be able to discharge at the end of the day. It is also seen that the adjustable loads are scheduled properly according to the time slots that are available for scheduling. Finally, Table 10 shows the optimal topology of the microgrid according to the active operating switches of tie and sectionalizing. As it can be seen from these results, almost half of the switches are engaged in the scheduling problem, which can affect the optimal cost function value effectively.
Table 9.
Optimal status of battery storage and adjustable loads over 24 h of scheduling.
Table 10.
Optimal switching pattern in the microgrid.
In order to better perceive the effect of intelligent charging versus coordinated charging of the HEV power demand, Figure 11 shows the operation cost of the microgrids in the two scenarios. As it can be seen from the figure, the intelligent charging could reduce the total operation cost by shifting the HEV demand to off peak hours [59]. This can not only reduce the total microgrid costs, but can also benefit the microgrid technically by correcting the voltage profile and releasing the possible feeder congestion in the system [60].
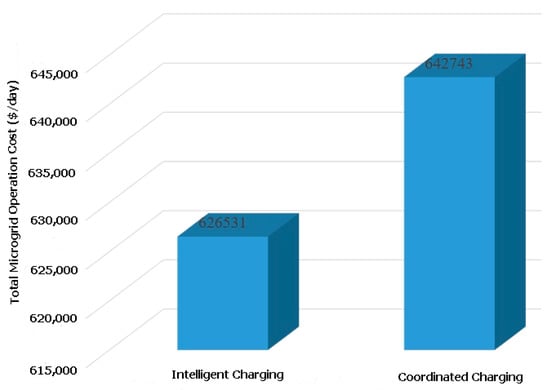
Figure 11.
Comparative operation cost of the microgrid in the coordinated and intelligent charging patterns.
6. Conclusions
This article focused on modeling the renewable microgrids and proposed a machine-learning based structure for optimal operation of the microgrids with a comprehensive model, which consists of the SVR, MDA along with smart charging of HEVs for arranging the switching patterns and managing the power dispatch of units. The simulation results on a test renewable microgrid showed that the proposed method is capable of solving the problem with high accuracy. The prediction model based on SVR-MDA could forecast the total charging demand of HEVs with higher accuracy compared to the ARMA, ANN, original SVR and SVR-DA. To this end, three indices of MAPE, RMSE and MARPE were deployed and compared for all methods. Having a practical estimation of the total charging demand of the HEVs, the proposed coordinated charging scheme can provide a more economic solution for the microgrid by shifting the demand to off peak hours. The proposed MDA could reduce the best optimal solution for the total microgrid operation cost by 4.146%, 2.823% and 2.904% compared to the GA, PSO and original DA. Moreover, it shows the proposed optimization method has a 23.124%, 15.456% and 6.998% reduction in the CPU time compared to the GA, PSO and original DA. It was seen that the wind and solar units play a critical role in mitigating the system costs when it is joint with optimal switching and reconfiguration of the feeders. Moreover, the optimal switching can help not only in reducing the costs but also in diminishing the power losses. This is due to the change of power flow in the feeders after switching, which can transfer the power flow burden from a heavy loaded feeder into another feeder with less power flow. Therefore, the power loss would be reduced in the feeders, effectively. Considering the cost objective function as the main goal to be minimized, reducing the power losses would be an indirect result, which is attained using the proposed problem formulation. Due to the single-agent structure of the proposed problem formulation, it is only suitable for the centralized frameworks and thus it is not possible to use it in a decentralized structure. It is clear that a multi-agent formulation is needed for this task, which will be addressed in future works.
Author Contributions
Conceptualization, T.L., S.T.A., M.R. and M.A.M.; Data curation, M.A.M.; Formal analysis, T.L., S.T.A., M.R., L.A.-G. and M.A.M.; Funding acquisition, T.L. and S.T.A.; Investigation, M.A.M.; Methodology, K.J., L.A.-G. and M.A.M.; Project administration, K.J., S.T.A. and M.A.M.; Resources, K.J. and M.A.M.; Software, M.A.M.; Supervision, M.A.M.; Validation, M.R. and M.A.M.; Visualization, L.A.-G. and M.A.M.; Writing—original draft, M.A.M.; Writing—review & editing, M.A.M. All authors have read and agreed to the published version of the manuscript.
Funding
This research received no external funding.
Institutional Review Board Statement
Not applicable.
Informed Consent Statement
Not applicable.
Data Availability Statement
The data presented in this study are available on request from the corresponding author: dr.mohamed.abdelaziz@mu.edu.eg (M.A.M.).
Acknowledgments
The authors extend their appreciation to the researchers supporting project number (RSP-2020/103), King Saud University, Riyadh, Saudi Arabia.
Conflicts of Interest
The authors declare no conflict of interest.
Nomenclature
| Amount of energy stored in mth storage at time t | |
| Capacity of battery in HEVs | |
| Minimum charging time | |
| Depth of discharge in HEVs | |
| Minimum down time limits for DG | |
| Minimum discharging time for storage | |
| Eloc | The enemy’s scene |
| Total energy required by the adjustable load | |
| ER | Total electric range in HEVs |
| Floc | Location of the nourishment basis |
| Current flow in line between the buses n and m | |
| Iter | Iteration number. |
| m | Distance passed by HEVs |
| Min/max of battery capacity in HEVs | |
| N | Number of population |
| Nv | Number of forecast samples for Charging demand of HEVs |
| Battery charging power rate | |
| Power generation by DG. | |
| Amount of power generated by the main grid | |
| Amount of power charging demand of HEV | |
| and | Amount of active and reactive power generated by mth DG at time t |
| Charging power of storage | |
| Discharging power of the storage | |
| Load demand on but m at time t | |
| Active power flow on line connecting buses l to m | |
| and | Active and reactive load demand on bus m |
| Amount of power generated/consumed by the main grid at time t | |
| s, a, c, f, and e | Weighting factor for the relevant motivation factors |
| r | Random value |
| and | Ramp up and down limits for mth DG |
| Resistance connecting buses m and n | |
| ri | Random number in the range [0,1] |
| s | Indicator of modification |
| Set of modification | |
| SoC | Depth of discharge in HEVs |
| tstart | Starting time for the charging |
| tD | Charging length for HEVs |
| Minimum up time of the load | |
| Minimum up time limits for DG | |
| vj | Speed of the neighbor |
| Voltage value of bus m | |
| Line status, 0 or 1 | |
| ON/OFF status of the DG | |
| Forecast/real value of the total charging demand sample of HEV | |
| Charging status of the battery | |
| Discharging status of the battery | |
| ON/OFF status of the load demand | |
| Fictional current flow of distribution lines | |
| Fictional current flow of utility grid | |
| Fictional current flow demand | |
| Charging efficiency in HEVs | |
| Cost of power purchasing from the DG | |
| Cost of power purchasing from the main grid | |
| Time interval (here 1 h) | |
| ith solution in the DA | |
| / | Mean/standard deviation of battery in HEVs |
| Set of buses with installed DG | |
| Set of operation time horizon (here 24 h) | |
| Set of lines | |
| Charging efficiency | |
| Discharging efficiency |
Appendix A
The complete microgrid data for the IEEE 69-bus test system are provided below:
Table A1.
Branch data.
Table A1.
Branch data.
| Branch No. | From Bus | To Bus | R (ohm) | X (ohm) |
|---|---|---|---|---|
| 1 | 1 | 2 | 0.0005 | 0.0012 |
| 2 | 2 | 3 | 0.0005 | 0.0012 |
| 3 | 3 | 4 | 0.0015 | 0.0036 |
| 4 | 4 | 5 | 0.0251 | 0.0294 |
| 5 | 5 | 6 | 0.366 | 0.1864 |
| 6 | 6 | 7 | 0.3811 | 0.1941 |
| 7 | 7 | 8 | 0.0922 | 0.0470 |
| 8 | 8 | 9 | 0.0493 | 0.0251 |
| 9 | 9 | 10 | 0.8190 | 0.2707 |
| 10 | 10 | 11 | 0.1872 | 0.0691 |
| 11 | 11 | 12 | 0.7114 | 0.2351 |
| 12 | 12 | 13 | 1.0300 | 0.3400 |
| 13 | 13 | 14 | 1.0440 | 0.3450 |
| 14 | 14 | 15 | 1.0580 | 0.3496 |
| 15 | 15 | 16 | 0.1966 | 0.0650 |
| 16 | 16 | 17 | 0.3744 | 0.1238 |
| 17 | 17 | 18 | 0.0047 | 0.0016 |
| 18 | 18 | 19 | 0.3276 | 0.1083 |
| 19 | 19 | 20 | 0.2106 | 0.0696 |
| 20 | 20 | 21 | 0.3416 | 0.1129 |
| 21 | 21 | 22 | 0.0140 | 0.0046 |
| 22 | 22 | 23 | 0.1591 | 0.0526 |
| 23 | 23 | 24 | 0.3463 | 0.1145 |
| 24 | 24 | 25 | 0.7488 | 0.2745 |
| 25 | 25 | 26 | 0.3089 | 0.1021 |
| 26 | 26 | 27 | 0.2732 | 0.0572 |
| 27 | 3 | 28 | 0.0044 | 0.0108 |
| 28 | 28 | 29 | 0.0640 | 0.1565 |
| 29 | 29 | 30 | 0.3978 | 0.1315 |
| 30 | 30 | 31 | 0.0702 | 0.0232 |
| 31 | 31 | 32 | 0.3510 | 0.1160 |
| 32 | 32 | 33 | 0.839 | 0.2816 |
| 33 | 33 | 34 | 1.7080 | 0.5646 |
| 34 | 34 | 35 | 1.474 | 0.4673 |
| 35 | 3 | 36 | 0.0044 | 0.0108 |
| 36 | 36 | 37 | 0.0640 | 0.1565 |
| 37 | 37 | 38 | 0.1053 | 0.1430 |
| 38 | 38 | 39 | 0.0304 | 0.0355 |
| 39 | 39 | 40 | 0.0018 | 0.0021 |
| 40 | 40 | 41 | 0.7283 | 0.8509 |
| 41 | 41 | 42 | 0.310 | 0.3623 |
| 42 | 42 | 43 | 0.0410 | 0.0478 |
| 43 | 43 | 44 | 0.0092 | 0.0116 |
| 44 | 44 | 45 | 0.1089 | 0.1373 |
| 45 | 45 | 46 | 0.0009 | 0.0012 |
| 46 | 4 | 47 | 0.0034 | 0.0084 |
| 47 | 47 | 48 | 0.0851 | 0.2083 |
| 48 | 48 | 49 | 0.2898 | 0.7091 |
| 49 | 49 | 50 | 0.0822 | 0.2011 |
| 50 | 8 | 51 | 0.0928 | 0.0473 |
| 51 | 51 | 52 | 0.3319 | 0.1114 |
| 52 | 9 | 53 | 0.1740 | 0.0886 |
| 53 | 53 | 54 | 0.2030 | 0.1034 |
| 54 | 54 | 55 | 0.2842 | 0.1447 |
| 55 | 55 | 56 | 0.2813 | 0.1433 |
| 56 | 56 | 57 | 1.5900 | 0.5337 |
| 57 | 57 | 58 | 0.7837 | 0.2630 |
| 58 | 58 | 59 | 0.3042 | 0.1006 |
| 59 | 59 | 60 | 0.3861 | 0.1172 |
| 60 | 60 | 61 | 0.5075 | 0.2585 |
| 61 | 61 | 62 | 0.0974 | 0.0496 |
| 62 | 62 | 63 | 0.1450 | 0.0738 |
| 63 | 63 | 64 | 0.7105 | 0.3619 |
| 64 | 64 | 65 | 1.0410 | 0.5302 |
| 65 | 11 | 66 | 0.2012 | 0.0611 |
| 66 | 66 | 67 | 0.0047 | 0.0014 |
| 67 | 12 | 68 | 0.7394 | 0.2444 |
| 68 | 38 | 69 | 0.0047 | 0.0016 |
Table A2.
Bus data
Table A2.
Bus data
| Bus No. | Active Power (kW) | Reactive Power (kVar) |
|---|---|---|
| 1 | 0 | 0 |
| 2 | 0 | 0 |
| 3 | 0 | 0 |
| 4 | 0 | 0 |
| 5 | 0 | 0 |
| 6 | 2.60 | 2.2 |
| 7 | 40.4 | 30 |
| 8 | 75 | 54 |
| 9 | 30 | 22 |
| 10 | 28 | 19 |
| 11 | 145 | 104 |
| 12 | 145 | 104 |
| 13 | 8 | 5.50 |
| 14 | 8 | 5.50 |
| 15 | 0 | 0 |
| 16 | 45.50 | 30 |
| 17 | 60 | 35 |
| 18 | 60 | 35 |
| 19 | 0 | 0 |
| 20 | 1 | 0.60 |
| 21 | 114 | 81 |
| 22 | 5.30 | 3.50 |
| 23 | 0 | 0 |
| 24 | 28 | 20 |
| 25 | 0 | 0 |
| 26 | 14 | 10 |
| 27 | 14 | 10 |
| 28 | 26 | 18.6 |
| 29 | 26 | 18.6 |
| 30 | 0 | 0 |
| 31 | 0 | 0 |
| 32 | 0 | 0 |
| 33 | 14 | 10 |
| 34 | 19.5 | 14 |
| 35 | 6 | 4 |
| 36 | 26 | 18.55 |
| 37 | 26 | 18.55 |
| 38 | 0 | 0 |
| 39 | 24 | 17 |
| 40 | 24 | 17 |
| 41 | 1.2 | 1 |
| 42 | 0 | 0 |
| 43 | 6 | 4.3 |
| 44 | 0 | 0 |
| 45 | 39.22 | 26.3 |
| 46 | 39.22 | 26.3 |
| 47 | 0 | 0 |
| 48 | 79 | 56.4 |
| 49 | 384.7 | 274.5 |
| 50 | 384.7 | 274.5 |
| 51 | 40.5 | 28.3 |
| 52 | 3.6 | 2.7 |
| 53 | 4.35 | 3.5 |
| 54 | 26.4 | 19 |
| 55 | 24 | 17.2 |
| 56 | 0 | 0 |
| 57 | 0 | 0 |
| 58 | 0 | 0 |
| 59 | 100 | 72 |
| 60 | 0 | 0 |
| 61 | 1244 | 888 |
| 62 | 32 | 23 |
| 63 | 0 | 0 |
| 64 | 227 | 162 |
| 65 | 59 | 42 |
| 66 | 18 | 13 |
| 67 | 18 | 13 |
| 68 | 28 | 20 |
| 69 | 28 | 20 |
References
- Shayeghi, H.; Shahryari, E.; Moradzadeh, M.; Siano, P. A survey on microgrid energy management considering flexible energy sources. Energies 2019, 12, 2156. [Google Scholar] [CrossRef]
- Mohamed, M.A.; Abdullah, H.M.; Al-Sumaiti, A.S.; El-Meligy, M.A.; Sharaf, M.; Soliman, A.T. Towards Energy Management Negotiation between Distributed AC/DC Networks. IEEE Access 2020, 8, 215438–215456. [Google Scholar] [CrossRef]
- Gong, X.; Dong, F.; Mohamed, M.A.; Awwad, E.M.; Abdullah, H.M.; Ali, Z.M. Towards distributed based energy transaction in a clean smart island. J. Clean. Prod. 2020, 273, 122768. [Google Scholar] [CrossRef]
- Dhiman, H.S.; Deb, D.; Guerrero, J.M. Hybrid machine intelligent SVR variants for wind forecasting and ramp events. Renew. Sustain. Energy Rev. 2019, 108, 369–379. [Google Scholar] [CrossRef]
- Wang, P.; Wang, D.; Zhu, C.; Yang, Y.; Abdullah, H.M.; Mohamed, M.A. Stochastic management of hybrid AC/DC microgrids considering electric vehicles charging demands. Energy Rep. 2020, 6, 1338–1352. [Google Scholar] [CrossRef]
- Rezaei, M.; Naghdi-Khozani, N.; Jafari, N. Wind energy utilization for hydrogen production in an underdeveloped country: An economic investigation. Renew. Energy 2020, 147, 1044–1057. [Google Scholar] [CrossRef]
- Eltamaly, A.M.; Mohamed, Y.S.; El-Sayed, A.H.M.; Mohamed, M.A.; Elghaffar, A.N.A. Power Quality and Reliability Considerations of Photovoltaic Distributed Generation. Technol. Econ. Smart Grids Sustain. Energy 2020, 5, 1–21. [Google Scholar] [CrossRef]
- Mohamed, M.A.; Jin, T.; Su, W. Multi-agent energy management of smart islands using primal-dual method of multipliers. Energy 2020, 208, 118306. [Google Scholar] [CrossRef]
- Duan, Q.; Quynh, N.V.; Abdullah, H.M.; Almalaq, A.; Duc Do, T.; Abdelkader, S.M.; Mohamed, M.A. Optimal Scheduling and Management of a Smart City Within the Safe Framework. IEEE Access 2020, 8, 161847–161861. [Google Scholar] [CrossRef]
- Wang, R.; Hsu, S.-C.; Zheng, S.; Chen, J.-H.; Li, X.I. Renewable energy microgrids: Economic evaluation and decision making for government policies to contribute to affordable and clean energy. Appl. Energy 2020, 274, 115287. [Google Scholar] [CrossRef]
- Qamar, S.B.; Janajreh, I. Renewable energy sources for isolated self-sufficient microgrids: Comparison of solar and wind energy for UAE. Energy Procedia 2016, 103, 413–418. [Google Scholar] [CrossRef]
- Fioriti, D.; Poli, D. A novel stochastic method to dispatch microgrids using Monte Carlo scenarios. Electr. Power Syst. Res. 2019, 175, 105896. [Google Scholar] [CrossRef]
- Geng, S.; Vrakopoulou, M.; Hiskens, I.A. Chance-constrained optimal capacity design for a renewable-only islanded microgrid. Electr. Power Syst. Res. 2020, 189, 106564. [Google Scholar] [CrossRef]
- Liu, J.; Jia, R.; Li, W.; Ma, F.; Abdullah, H.M.; Ma, H.; Mohamed, M.A. High precision detection algorithm based on improved RetinaNet for defect recognition of transmission lines. Energy Rep. 2020, 6, 2430–2440. [Google Scholar] [CrossRef]
- Kumar, J.; Agarwal, A.; Singh, N. Design, operation and control of a vast DC microgrid for integration of renewable energy sources. Renew. Energy Focus 2020, 34, 17–36. [Google Scholar] [CrossRef]
- Dhiman, H.S.; Deb, D.; Balas, V.E. Supervised Machine Learning in Wind Forecasting and Ramp Event Prediction; Academic Press: New York, NY, USA, 2020. [Google Scholar]
- Dey, B.; Roy, S.K.; Bhattacharyya, B. Solving multi-objective economic emission dispatch of a renewable integrated microgrid using latest bio-inspired algorithms. Eng. Sci. Technol. Int. J. 2019, 22, 55–66. [Google Scholar] [CrossRef]
- Mohamed, M.A.; Jin, T.; Su, W. An effective stochastic framework for smart coordinated operation of wind park and energy storage unit. Appl. Energy 2020, 272, 115228. [Google Scholar] [CrossRef]
- Jiang, X.; Wang, J.; Han, Y.; Zhao, Q. Coordination dispatch of electric vehicles charging/discharging and renewable energy resources power in microgrid. Procedia Comput. Sci. 2017, 107, 157–163. [Google Scholar] [CrossRef]
- Gong, X.; Dong, F.; Mohamed, M.A.; Abdalla, O.M.; Ali, Z.M. A secured energy management architecture for smart hybrid microgrids considering PEM-fuel cell and electric vehicles. IEEE Access 2020, 8, 47807–47823. [Google Scholar] [CrossRef]
- Al-Saud, M.; Eltamaly, A.M.; Mohamed, M.A.; Kavousi-Fard, A. An intelligent data-driven model to secure intravehicle communications based on machine learning. IEEE Trans. Ind. Electron. 2019, 67, 5112–5119. [Google Scholar] [CrossRef]
- Patel, P.; Shandilya, A.; Deb, D. Optimized hybrid wind power generation with forecasting algorithms and battery life considerations. In Proceedings of the 2017 IEEE Power and Energy Conference at Illinois (PECI), Champaign, IL, USA, 23–24 February 2017; pp. 1–6. [Google Scholar]
- Osório, G.J.; Shafie-khah, M.; Coimbra, P.D.L.; Lotfi, M.; Catalão, J.P.S. Distribution system operation with electric vehicle charging schedules and renewable energy resources. Energies 2018, 11, 3117. [Google Scholar] [CrossRef]
- Mortaz, E.; Valenzuela, J. Optimizing the size of a V2G parking deck in a microgrid. Int. J. Electr. Power Energy Syst. 2018, 97, 28–39. [Google Scholar] [CrossRef]
- Mohamed, M.A.; Almalaq, A.; Awwad, E.M.; El-Meligy, M.A.; Sharaf, M.; Ali, Z.M. A modified balancing approach for renewable based microgrids using deep adversarial learning. IEEE Trans. Ind. Appl. 2020. [Google Scholar] [CrossRef]
- Kavousi-Fard, A. Modeling uncertainty in tidal current forecast using prediction interval-based SVR. IEEE Trans. Sustain. Energy 2016, 8, 708–715. [Google Scholar] [CrossRef]
- Li, J.; Lu, J.; Yao, L.; Cheng, L.; Qin, H. Wind-Solar-Hydro power optimal scheduling model based on multi-objective dragonfly algorithm. Energy Procedia 2019, 158, 6217–6224. [Google Scholar] [CrossRef]
- Mohamed, M.A.; Almalaq, A.; Awwad, E.M.; El-Meligy, M.A.; Sharaf, M.; Ali, Z.M. An effective energy management approach within a smart island considering water-energy hub. IEEE Trans. Ind. Appl. 2020. [Google Scholar] [CrossRef]
- Mohamed, M.A.; Chabok, H.; Awwad, E.M.; El-Sherbeeny, A.M.; Elmeligy, M.A.; Ali, Z.M. Stochastic and distributed scheduling of shipboard power systems using MθFOA-ADMM. Energy 2020, 206, 118041. [Google Scholar] [CrossRef]
- Eltamaly, A.M.; Mohamed, M.A. Optimal sizing and designing of hybrid renewable energy systems in smart grid applications. In Advances in Renewable Energies and Power Technologies; Elsevier: Amsterdam, The Netherlands, 2018; pp. 231–313. [Google Scholar]
- Kavousi-Fard, A.; Samet, H.; Marzbani, F. A new hybrid modified firefly algorithm and support vector regression model for accurate short term load forecasting. Expert Syst. Appl. 2014, 41, 6047–6056. [Google Scholar] [CrossRef]
- Jiang, T.; Wang, S.; Wei, R. Support vector machine with composite kernels for time series prediction. In International Symposium on Neural Networks; Springer: Berlin/Heidelberg, Germany, 2007; pp. 350–356. [Google Scholar]
- Acı, Ç.İ.; Gülcan, H. A Modified Dragonfly Optimization Algorithm for Single and Multiobjective Problems Using Brownian Motion. Comput. Intell. Neurosci. 2019, 2019, 6871298. [Google Scholar] [CrossRef]
- Khalil, H.A.; Darwish, S.; Ibrahim, Y.M.; Hassan, O.F. 3D-MRI Brain Tumor Detection Model Using Modified Version of Level Set Segmentation Based on Dragonfly Algorithm. Symmetry 2020, 12, 1256. [Google Scholar] [CrossRef]
- Avatefipour, O.; Al-Sumaiti, A.S.; El-Sherbeeny, A.M.; Awwad, E.M.; Elmeligy, M.A.; Mohamed, M.A.; Malik, H. An intelligent secured framework for cyberattack detection in electric vehicles’ CAN bus using machine learning. IEEE Access 2019, 7, 127580–127592. [Google Scholar] [CrossRef]
- Rostami, M.-A.; Kavousi-Fard, A.; Niknam, T. Expected cost minimization of smart grids with plug-in hybrid electric vehicles using optimal distribution feeder reconfiguration. IEEE Trans. Ind. Inform. 2015, 11, 388–397. [Google Scholar] [CrossRef]
- Mohamed, M.A.; Tajik, E.; Awwad, E.M.; El-Sherbeeny, A.M.; Elmeligy, M.A.; Ali, Z.M. A two-stage stochastic framework for effective management of multiple energy carriers. Energy 2020, 197, 117170. [Google Scholar] [CrossRef]
- Dhiman, H.S.; Deb, D.; Muresan, V.; Balas, V.E. Wake management in wind farms: An adaptive control approach. Energies 2019, 12, 1247. [Google Scholar] [CrossRef]
- Deb, D.; Ambekar, A.K.; Sagi, D.R. Method and System for Hybrid Wind Power Generation. U.S. Patent 10,066,604, 4 September 2018. [Google Scholar]
- Mohamed, M.A.; Al-Sumaiti, A.S.; Krid, M.; Awwad, E.M.; Kavousi-Fard, A. A Reliability-Oriented Fuzzy Stochastic Framework in Automated Distribution Grids to Allocate ηPMUs. IEEE Access 2019, 7, 33393–33404. [Google Scholar] [CrossRef]
- Kavousi-Fard, A.; Khodaei, A. Efficient Integration of Plug-in Electric Vehicles via Reconfigurable Microgrids. Energy 2016, 111, 653–663. [Google Scholar] [CrossRef]
- Energy Information Administration. Electric Power Annual. 2017. Available online: https://www.eia.gov/electricity/annual/ (accessed on 6 December 2019).
- Kavousi-Fard, A.; Niknam, T.; Golmaryami, M. Short term load forecasting of distribution systems by a new hybrid modified FA-backpropagation method. J. Intell. Fuzzy Syst. 2014, 26, 517–522. [Google Scholar] [CrossRef]
- Dhiman, H.S.; Deb, D.; Muresan, V.; Unguresan, M.-L. Multi-criteria decision making approach for hybrid operation of wind farms. Symmetry 2019, 11, 675. [Google Scholar] [CrossRef]
- Eltamaly, A.M.; Mohamed, M.A. A novel software for design and optimization of hybrid power systems. J. Braz. Soc. Mech. Sci. Eng. 2016, 38, 1299–1315. [Google Scholar] [CrossRef]
- Eltamaly, A.M.; Mohamed, M.A.; Alolah, A.I. A novel smart grid theory for optimal sizing of hybrid renewable energy systems. Sol. Energy 2016, 124, 26–38. [Google Scholar] [CrossRef]
- Dhiman, H.S.; Deb, D. Decision and Control in Hybrid Wind Farms; Springer: Singapore, 2020. [Google Scholar]
- Mohamed, M.A.; Eltamaly, A.M.; Farh, H.M.; Alolah, A.I. Energy management and renewable energy integration in smart grid system. In Proceedings of the 2015 IEEE International Conference on Smart Energy Grid Engineering (SEGE), Oshawa, ON, Canada, 17–19 August 2015; pp. 1–6. [Google Scholar]
- Wang, J.; Gao, Y.; Liu, W.; Sangaiah, A.K.; Kim, H.-J. An improved routing schema with special clustering using PSO algorithm for heterogeneous wireless sensor network. Sensors 2019, 19, 671. [Google Scholar] [CrossRef] [PubMed]
- Wang, Q.; Jin, T.; Mohamed, M.A.; Chen, T. A Minimum Hitting Set Algorithm with Pre-Judging Mechanism for Model-Based Fault Diagnosis in Distribution Networks. IEEE Trans. Instrum. Meas. 2020, 69, 4702–4711. [Google Scholar] [CrossRef]
- Gojiya, A.; Deb, D.; Iyer, K.K.R. Feasibility study of power generation from agricultural residue in comparison with soil incorporation of residue. Renew. Energy 2019, 134, 416–425. [Google Scholar] [CrossRef]
- Mohamed, M.A.; Eltamaly, A.M.; Alolah, A.I. Sizing and techno-economic analysis of stand-alone hybrid photovoltaic/wind/diesel/battery power generation systems. J. Renew. Sustain. Energy 2015, 7, 063128. [Google Scholar] [CrossRef]
- Jin, T.; Chen, Y.; Guo, J.; Wang, M.; Mohamed, M.A. An effective compensation control strategy for power quality enhancement of unified power quality conditioner. Energy Rep. 2020, 6, 2167–2179. [Google Scholar] [CrossRef]
- Dhiman, H.S.; Anand, P.; Deb, D. Wavelet transform and variants of svr with application in wind forecasting. In Innovations in Infrastructure; Springer: Singapore, 2019; pp. 501–511. [Google Scholar]
- Rezaei, M.; Khalilpour, K.R.; Jahangiri, M. Multi-criteria location identification for wind/solar based hydrogen generation: The case of capital cities of a developing country. Int. J. Hydrogen Energy 2020, 45, 33151–33168. [Google Scholar] [CrossRef]
- Mostafa, M.; Abdullah, H.M.; Mohamed, M.A. Modeling and Experimental Investigation of Solar Stills for Enhancing Water Desalination Process. IEEE Access 2020, 8, 219457–219472. [Google Scholar] [CrossRef]
- Kapoor, D.; Sodhi, P.; Deb, D. Solar panel simulation using adaptive control. In Proceedings of the 2012 IEEE International Conference on Control Applications, Dubrovnik, Croatia, 3–5 October 2012; pp. 1124–1130. [Google Scholar]
- Eltamaly, A.M.; Mohamed, M.A.; Al-Saud, M.S.; Alolah, A.I. Load management as a smart grid concept for sizing and designing of hybrid renewable energy systems. Eng. Optim. 2017, 49, 1813–1828. [Google Scholar] [CrossRef]
- Dhiman, H.S.; Deb, D. Wake management based life enhancement of battery energy storage system for hybrid wind farms. Renew. Sustain. Energy Rev. 2020, 130, 109912. [Google Scholar] [CrossRef]
- Mohamed, M.A.; Awwad, E.M.; El-Sherbeeny, A.M.; Nasr, E.A.; Ali, Z.M. Optimal scheduling of reconfigurable grids considering dynamic line rating constraint. IET Gener. Transm. Distrib. 2020, 14, 1862–1871. [Google Scholar] [CrossRef]
Publisher’s Note: MDPI stays neutral with regard to jurisdictional claims in published maps and institutional affiliations. |
© 2021 by the authors. Licensee MDPI, Basel, Switzerland. This article is an open access article distributed under the terms and conditions of the Creative Commons Attribution (CC BY) license (http://creativecommons.org/licenses/by/4.0/).