Abstract
Spent mushroom substrate (SMS) is defined as the biomass waste generated during industrial mushroom cultivation. Utilization of SMS has been extensively researched and has immense potential as a sustainable substrate for generating biogas that can offset fossil fuel use. This closed loop energy generation process that can be set up in mushroom plants will reduce the dependence on fossil fuels and has the potential to reduce greenhouse gas emissions, which will benefit the environment. Anaerobic co-digestion of SMS with different agricultural wastes such as livestock manure would result in enhanced biogas production. In this study, the anaerobic co-digestion of SMS was carried out by combing yellow back fungus SMS along with chicken, dairy and pig manure. SMS combined with chicken manure yielded a slightly higher cumulative methane yield when compared with the combination of dairy manure and pig manure. Factors such as the total solids (TS) and the relative ratio of manure to SMS loading had a significant impact on the cumulative methane yield, volatile solids removal, with a particularly prominent synergistic effect. The synergistic effect was also closely related to the C/N ratio, and under experimental conditions (TS = 15%, SMS relative ratio of 50% and C/N ratio = 25.6), the cumulative methane yield of SMS with chicken manure (CM) was increased by 414% compared with that obtained using SMS or CM separately. We carried out a multiple linear regression (MLR) analysis, a statistical technique that uses several explanatory variables to predict the outcome of a response variable. Our analysis concluded that by using operating conditions (TS = 15%, and SMS ratio = 38.9), we were able to achieve the maximum cumulative methane yield (CMY).
1. Introduction
Spent mushroom substrate (SMS) is considered as an industrial waste left over after mushroom harvesting and the majority is discarded in landfills or discarded without proper utilization. About 1 kg of fresh mushrooms that are produced, generate ~5 kg of SMS [1]. In the past ten years, the global edible mushroom industry has developed rapidly, which has resulted in the production of a huge amount of spent mushroom substrate. The management of such an amount of SMS has become a new challenge since random discard or improper disposal would lead to environmental problems such as water pollution and soil contamination. As the world’s largest producer of mushrooms, China annually produces more than 30 million tons of mushrooms [2], which corresponds to 150 million tons of SMS. Thus, effective methods for recovering and utilizing SMS are imperative.
Anaerobic digestion (AD) is a nature derived biological method that can convert organic matter into biogas, producing clean energy and biogas slurry/slag organic fertilizer, while reducing environmental pollution [3,4]. The AD process is far superior in utilizing SMS when compared to aerobic composting [5,6] and other fertilizer production methods [7]. Additionally, producing biogas using SMS in mushroom farms to create a close loop energy generation method is sustainable and can help to offset the energy cost. This will also benefit the environment by reducing greenhouse gas (GHG) emissions, since conventional energy is produced using fossil fuels such as coal and crude oil [8].
SMS is mainly composed of fungal mycelium and disintegrated lignocellulosic biomass. It has been reported that SMS has better a biogas fermentation efficiency [9,10,11] when compared with raw materials such as straw. However, the use of SMS as a substrate for AD still has many challenges. For example, a higher carbon to nitrogen ratio inhibits normal fermentation, and the high digestibility of SMS can also negatively impact the stability of AD [12]. These problems lead to a short gas production cycle, low gas yield, and low economic benefits, and hence become a bottleneck, restricting the development of the economic production of biogas.
Studies have shown that the co-digestion of SMS with dairy manure [13] or wheat, straw [14], etc., can improve the fermentation stability, prolong the fermentation cycle and increase biogas production. It is an effective way to avoid the rapid acidification of fermentation broth and the inhibition of methanogenic flora. During co-digestion, the mixing ratio of the substrate is a crucial factor, which will change the nature of the digestion process and further affect the biogas yield and volumetric biogas yield rate [15]. Luo et al. [16] investigated the co-digestion of SMS and dairy manure (DM) at different mixing ratios, and the result showed that the methane yield from the mixtures was 6–61% higher than the yield from SMS or DM alone. They reported that the SMS of Flammulina velutipes (SFv), when co-digestion at a ratio of 1:1 of DM/SMS, was optimal, but for the SMS of Pleurotus eryngi (SPe), 3:1 was reported to be ideal. The total solids content is also an important factor affecting biogas production. Compared to traditional SMS liquid AD (total solids (TS) ranges from 0.5% to 10%), the high solid content rate has many advantages, including a lower energy input, higher volumetric methane productivity, easier to handle digestant and less water utilization [17]. However, there are still some problems such as a slow start-up speed and unstable fermentation system, so further research is needed.
Though there have been some studies on the co-digestion of SMS with dairy manure, limited information is available in terms of the co-digestion of SMS with different livestock manure; particularly, chicken manure (CM), dairy manure (DM) and pig manure (PM) at low and high solids loading during AD of SMS. The objectives of this study were to: (1) compare the gas production effect of co-digestion of yellow back fungus SMS and different livestock manure (CM, DM, PM), (2) study the influence of the total solids (TS) and relative ratio of manure to SMS loading on the methane productivity, feedstock degradation rate and synergistic effect of the anaerobic co-digestion of SMS and chicken manure, and (3) carry out a multiple linear regression (MLR) analysis—a statistical technique that uses several explanatory variables to predict the outcome of a response variable—to optimize the better process parameters.
2. Materials and Method
2.1. Feedstock and Inoculum
SMS used in this experiment were obtained from the yellow-back fungus planting base, provided by Shifang Haoyang Agriculture Development Limited Company in Sichuan of China. The substrates used for producing the mushrooms were composed of wood chips, corn cobs and other ingredients, such as corn flour and lime. The fresh CM, DM, and PM were collected from farms in the Shuangliu county of Sichuan and were kept in cold storage at −20 °C before use. Moreover, the inoculum was obtained from digested sludge of a straw fermentation reactor in the Biogas Institute of the Ministry of Agriculture and was stored in a hermetic barrel at 4 °C and inoculated after 7 days of acclimation at 35 °C. The detailed characteristics of the collected substrates and inoculums are shown in Table 1.

Table 1.
Characterization of substrates and inoculum.
2.2. Experimental Setup
The experiment equipment used included a classic AD device, which is mainly composed of three bottles, one each for anaerobic digestion, biogas collection, and water collection, respectively. Several tubes and rubber pipelines for transporting gas and water (Figure 1) were used. Specifically, the fermentation bottle had a total volume of 600 mL and an effective volume of 350 mL. It was sealed by a rubber stopper to provide a complete anaerobic environment and was equipped with a tube to transport the generated gas to the biogas collection bottle. Furthermore, the fermentation bottle needed to be placed in an electric thermostatic water bath to maintain a constant temperature (35 °C).
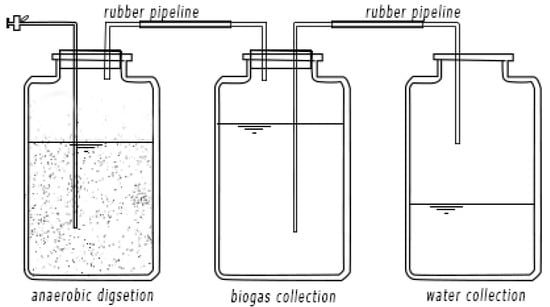
Figure 1.
The batch anaerobic digestion (AD) of experimental set up.
2.3. Design of Experiment
2.3.1. Anaerobic Co-Digestion of SMS and Different Manures
For the study of manure type optimization, batch fermentation was employed for the co-digestion of SMS and the different manures. TS of 10%, an inoculum ratio (Inoculum/Feedstock based on Volatile solids (VS)) of 30% and SMS to manure ratios of 1:1, 1:2, 2:1 were used in the experiment, and the added amounts of different manures were calculated based on this fermentation condition. Then, SMS and different manures were mixed well and added into the fermentation bottle. After adding the inoculum, the working volume was adjusted to 350 mL with water. Each treatment was performed in triplicate, and the SMS group served as a control group, while the inoculum group served as a blank group, the blank group was used to correct other trials of biogas production. The pH value was adjusted to 7.0 with 1M HCl or 1M NaOH. In order to guarantee an anaerobic atmosphere in the fermentation bottles, each bottle was flushed with nitrogen gas for 3 min before adding the stopper. During the digestion process, the fermentation bottle was manually shaken twice a day to mix the substrates. The volume of the produced biogas was measured every day, and the liquid samples were taken every three days to check the pH value, ammonia nitrogen (NH4+) concentration and volatile fatty acid (VFA) concentration. The added amounts of feedstocks and inoculum are shown in Table 2.
Table 2.
Feed number of raw materials and inoculum.
2.3.2. Anaerobic Co-Digestion of SMS and Chicken Manure (CM)
The co-digestion of SMS and CM was carried out based on the previous experiment results, and batch tests were also employed for this study. This experiment adopted a randomized multilevel categorical design (Design Expert Version-12.0.3) with a total of 45 runs to explore the influence of TS and the ratio of SMS in the feedstock on AD, as well as to search for the best combination of SMS and CM. Meanwhile, blank groups (only inoculum added for the fermentation) and control groups (SMS or CM added for the fermentation) were set up. The factors’ level of the Design of Experiments (DOE) design parameters and design matrix a shown in Table 3.
Table 3.
DOE design parameters and design matrix with factors’ level.
2.4. Analytical Methods
The TS and VS of feedstocks and inoculum were measured according to the standard methods (APHA, 1998). The contents of total C and N were determined by an organic element analyzer (EAI CE-440, USA). The cellulose, hemicellulose, and lignin contents of the feedstocks were determined using the National Renewable Energy Laboratory method [18]. The methane content and VFA concentration were analyzed by gas chromatograph, and the details of GC condition were reported by Zhu et al. [19].
2.5. Data Analysis
The removal efficiencies of TS and VS were calculated according to Equation (1).
Weighted methane production (WMP) of co-digestion for evaluating the synergistic effect was calculated by Equation (2) [20]
where, y(SMS) and y(CM) represent the cumulative methane yields of SMS and CM, respectively, and α and β were the feed ratios (based on VS) of SMS and CM in co-digestion.
A modified Gompertz model [21] was used to analyze the data of cumulative biogas yield and to explain the combined effect of the methane production of SMS with CM at different TS and feedstock ratios. The model equation is shown as following:
where, B is the cumulative methane yield at digestion time t days (mL/g VS), B0 is the methane production potential (mL/g VS), μm is the maximum methane production rate (mL/g VS. day), λ is the lag phase period (days), t is the digestion time (days), e = mathematical constant (2.718282).
Statistical analysis was conducted on the Design-Expert software (12.0.3). The differences between treatments were detected by the analysis of variance (ANOVA) t and p-values less than 0.05 were considered significant during the statistical analysis.
3. Results and Discussion
3.1. Methane Production Performance of Co-Digestion of SMS and Different Livestock Manures
Figure 2 shows the variation of cumulative methane production and the maximum methane content during co-digestion of SMS and different livestock manures. As shown in this figure, after the biogas production of each experimental group ended, the cumulative methane production yield was found to be in the following order: B1:2 > C1:2 > C1:1 > B1:1 > A1:2 > B2:1 > C2:1 > A1:1 > A2:1 > SMS. The results show that the methane production of the co-digestion was significantly better than that of single digestion (p < 0.05). Additionally, each group acquired the highest methane production when the SMS/LM ratio was 1:2, and the cumulative methane yields were 120.5 (CM), 109.6 (PM), and 35.1 (DM) mL/g/VS, respectively. The low combined methane yield (CMY) of pure SMS digestion was due to the high lignin content in SMS and the unbalanced C/N. For the co-digestion of SMS and DM, the methane production potential was low. It might be because there was lack of nitrogen source in substrates, which were rich in carbon source. Compared with SMS/PM and SMS/DM groups, the groups of SMS/CM were superior regarding the maximum methane contents (Figure 2b), and this is basically consistent with the cumulative methane gas production value. In addition, the synergistic effects of SMS/CM and SMS/PM were also compared, and it was found that the synergistic methane production rates of SMS/CM were increased by 140–400%, while SMS/PM were only increased by 17–62.2%. Thus, in summary, we concluded that CM is the most suitable manure for mixed fermentation with SMS among different types of manures.
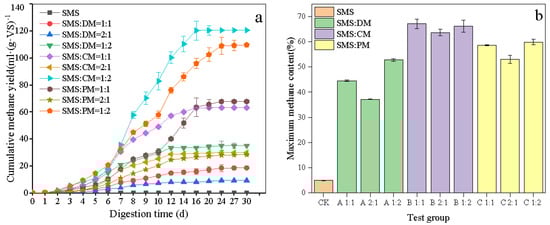
Figure 2.
The cumulative methane production (a) and the maximum methane content (b) of co-digestion of SMS and different livestock manure.
However, the gas production of all the mixed groups in this study was still lower than that reported in the literature for the co-digestion of SMS, PM and DM [12,22]. This may be due to differences in the components of SMS, the types of manure, and the fermentation conditions.
3.2. Gas Production Performance of Anaerobic Co-Digestion of SMS and Chicken Manure
3.2.1. Methane Production at Different Initial TS Content and Feedstock Ratio
Daily biogas production and cumulative methane production can reflect the dynamic change in the process and methane production from feedstock during AD process. Overall, all the test groups could ferment normally and there was no acidification or failure. The biogas productions under different initial TS contents and feed ratios are shown in Figure 3a–f.
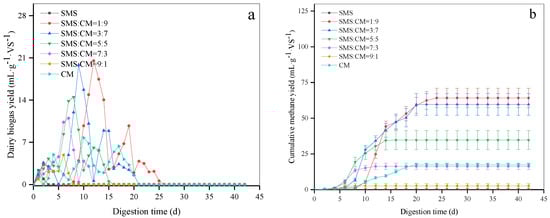
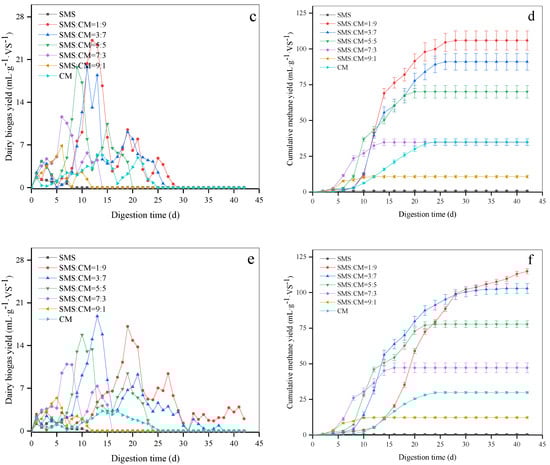
Figure 3.
Variation of the cumulative methane production under different SMS ratios and total solids content (a,c,e) is daily biogas yield(DBY) (TS 5%, 10% and 15%); (b,d,f) is cumulative methane yield (CMY).
Significant differences among the solids content and methane production (p < 0.05) were observed. The average cumulative methane production at concentrations of 5%, 10%, and 15% were 35.5, 62.5, 71.0 mL/g VS, respectively. This discovery suggested that there was no absolute negative correlation [23] between the cumulative methane production and total solids content. We could also see a further increase in CMY as the total solids content increased until a threshold was reached [24]. However, we observed that as the total solids content increases, the time taken to produce biogas would be prolonged, which reduced the overall AD process efficiency.
With the increase in CM, the CMY increased from 12.23 mL/g VS (CM-10%) to 114.9 mL/g VS (CM-90%) gradually (Figure 3f), and the CMY also showed a significant difference with the increase in SMS from 10 to 90% (p < 0.05). We foresee that high SMS ratio will improve the phenomenon of activation inhibition under high concentration, probably due to the appropriate carbon-to-nitrogen ratio. In addition, the feedstock ratio also had an impact on the co-substrate synergistic effect, which will be discussed in Section 3.2.4.
Additionally, the Modified Gompertz model was employed to simulate methane production for different test groups (Table 4). The results indicate that the model fitted the AD systems best with an R2 of 0.985~0.994; therefore, the parameters can primely illustrate the methane production process. From Table 4, we learned that as the TS content increased from 5 to 15%, the maximum methane potential increased from 62.4 to 111.0 (mL/g VS), and the methane production rate reached the highest at TS of 10%. Consequently, the proportion of feedstocks had a positive correlation with these three parameters. As the proportion of CM increased, the methane potential and the maximum methane rate increased. However, the lag period also extended.
Table 4.
Result of the kinetic study.
3.2.2. VFAs Content
Since VFAs are the main metabolic intermediates in AD [25], and the accumulation of VFAs will lead to AD instability or even failure, especially under the condition of high TS content. As shown in Figure 4, the maximum VFA occurred at the initial period (day 4–8) among all the test groups, accordant with the DBY peak. In addition, the TS content and CM ratio had greater impacts on the VFA concentration. For TS contents between 10–15%, the total VFA accumulation would negatively affect methanogens due to the relatively high concentration of acids. Especially, for the SMS/CM of 1:9 and TS of 15%, there was hardly any methane production during this period, which explained why the biogas production would be prolonged (Figure 4).
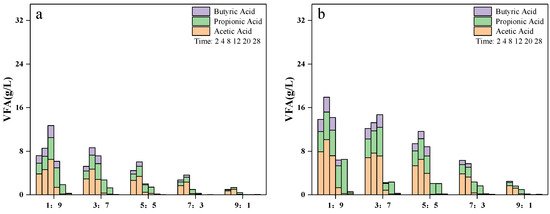
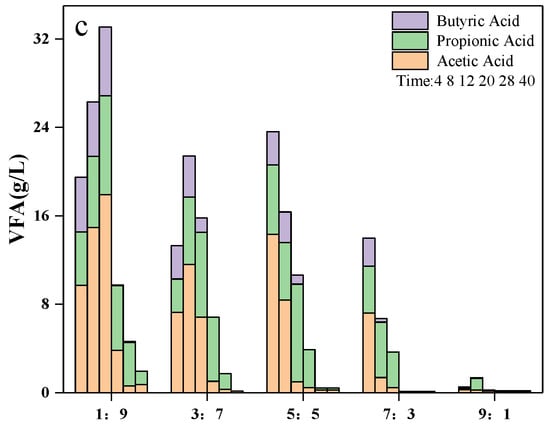
Figure 4.
Change in volatile fatty acids (VFA) during the AD. Here, (a), 5% TS; (b), 10% TS and (c), 15% TS.
Regarding a certain type of VFA, it was found that propionic acid was more difficult to degrade. The propionic acid was gradually accumulated to a high level after the fermentation started, and it was degraded when acetic acid and butyric acid were exhausted. In particular, there was still some propionic acid remaining in the end of AD when the SMS/CM ratio reached 1:9, since the standard free energy change for anaerobic degradation of propionic acid is the highest compared with other VFAs [26,27].
3.2.3. The Removal Efficiency of TS and VS
The removal rate of TS and VS is an important index for evaluating AD performance. The greater the removal rate, the more possible the increase in methane yield. Figure 5 shows that the TS and VS reduction rates were significantly affected (p < 0.05) by the TS content and the SMS ratio: the average VS removal rate for pure SMS and CM fermentation were 11.4 and 27.0%, respectively, while the VS removal rate was about 26.1–53.5% for the co-digestion of SMS and CM, indicating the positive effect of the co-digestion at a suitable SMS ratio. The higher removal rate of TS and VS was obtained at a SMS to CM ratio of 1:9, which was associated with higher methane production. The high removal rate of co-digestion was probably due to the increased ratio of nutrients and better utilization of organic matter, which promote their absorption by anaerobic bacteria and increasing the degree of degradation.
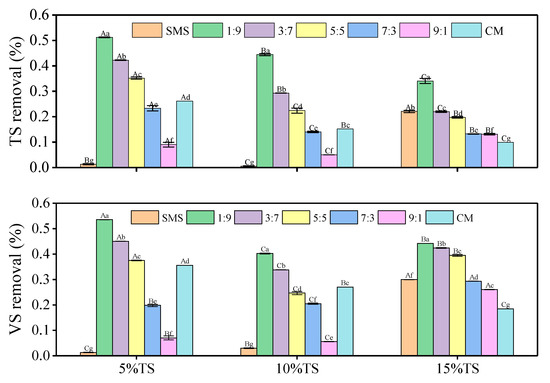
Figure 5.
TS and VS removal efficiencies under different feedstock ratios and solids content. Here, A, B, and C represent the significance between TS content; a, b, c, d, e, and f represent the significance between feedstock ratios.
3.2.4. Synergetic Analysis of Co-Digestion at Different TS and Feedstock Ratios
A synergistic effect could be regarded as the additional methane yield of co-digestion of mixed substrates compared to the single feedstock [28]. The increased methane yield was calculated by Equation (2) and the synergistic analysis of co-digestion for all experimental groups is shown in Table 5. As shown in Table 5, all co-digestion groups had great synergistic effects and there was no obvious correlation between the synergistic effect value and the solid content. However, it can be noticed that the synergistic effect was related to feedstock ratio and there more significant synergistic effects were noted for every solid content when the SMS accounted for 30–70%. Moreover, the group with the best synergetic effect was under the condition of TS of 15% and 50% of SMS, which successfully enhanced the methane production rate by 414% compared to using individual components during the AD process.
Table 5.
Synergetic analysis of methane yield from digestion of CM.
The specific values of synergy can be correlated to material characteristics (e.g., source, mixing ratio, elements and organic composition and particle size) [29,30] and operating conditions (e.g., temperature, feeding mode, hydraulic retention time and inoculum) [31,32,33]. Muhammad Hassan et al. [34] observed a synergistic effect of co-digestion of goose manure with alkali solubilized wheat straw and suggested that the C/N ratio had an important and even decisive influence on the synergistic effects of Anaerobic co-digestion [33]. In this study, the synergistic effect value reached the maximum when the C/N ratio was in the range of 21–30, and this result was consistent with the deduction of other researchers [16,35]. The synergistic effect in this experiment is influenced by the material characteristics and suitable carbon-to-nitrogen ratio to a large extent.
3.2.5. Process Combination Optimization of AD Process
Regression Model
The results derived from the multilevel categorical design were analyzed by Design Expert software (Version12.0.3, Stat-EASE, Inc., Minneapolis, USA). A multiple regression fitting was performed with the experimental data, and a multiple linear regression simulation equation was obtained after analyzing the data between the independent variable (TS, Ratio) and the response (cumulative methane yield, VS removal and synergistic increased methane yield). The equations are shown as below:
where, Y1 represents the cumulative methane yield (mL/g VS), Y2 represents the VS removal rate (%), Y3 represents the synergistic increased methane yield (%), A represents the total solids content (%), and B represents the SMS to feedstock ratio (Table 3).
In order to determine the suitability of the model, we evaluated the model equation through the analysis of variance, as shown in Table 6. Some studies [13] pointed out that the model should be tested with the following parameters: the lack of fit F value > 0.1, model R2 > 0.95, difference between adjusted R² and predicted R² (R2Adj-R2Pre) <0.2; coefficient of variation (C.V.%) <10%, and adequate precision > 4. The good thing is that the test results in Table 4 satisfied all the above indicators. From the table, we can also tell that R2 was greater than 0.95, indicating that the quadratic polynomial model was a good regression model and can account for more than 95% of the change in the response values. More importantly, this model can be used to analyze and predict the cumulative methane production during the anaerobic co-digestion of SMS and CM as well as navigate the design space. Additionally, the adequate precision can help to measure the signal to noise ratio. Our ratio of 41.5 indicated an adequate signal as a ratio greater than four was desirable.
Table 6.
Analysis of variance for the cumulative methane yield, VS removal and increased methane yield.
Graphical Analysis about the Effect of Interaction Factors
For the graphical interpretation of the interactions, the three-dimensional plot of the regression model is of great use [36]. In this study, the optimized response surface and contour plot for the combined effect of factors A-TS and B-Ratio on the cumulative methane yield, VS removal and synergistic increased methane yield are shown in Figure 6. From the perspective of the steepness of the response surface slope, there was a close connection between the solid content and the ratio of two factors, which were more sensitive to the effect of the synergistic methane increase. This finding is in accordance with the previous results of the mean square error analysis.
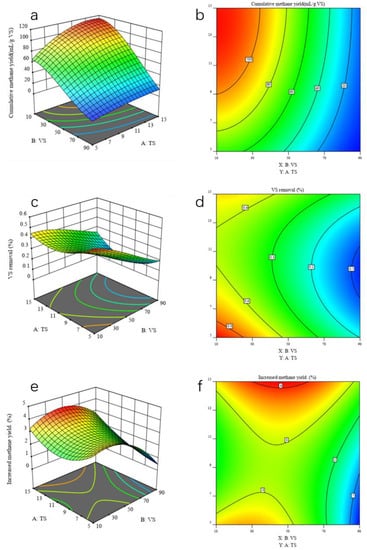
Figure 6.
Response surface plot and contour plot of TS and ratio. (a,b) response surface plot and contour plot for cumulative methane yield; (c,d) for VS removal; (e,f) for increased methane yield.
Furthermore, the maximum response value in the interaction can be found from the contour map in Figure 6b. It is notable that under the condition of high solid content, the proportion of SMS decreased in pace with the increase in biogas production. When the solid content reached the level of 9–15% and the proportion of SMS was in the range of 10–30%, the cumulative methane yield was higher. Similarly, when the solid content reached the level of 5–9% or 14–15% and the proportion of SMS was in the range of 10–30%, a better feedstock removal effect can be obtained. Additionally, when the solid content reached the level of 5–7% or 12–15% and the proportion of SMS was in the range of 30–70%, there was a better synergistic effect.
Optimum Conditions for Anaerobic Co-Digestion of SMS and CM
In order to obtain the best working condition, it is essential to optimize the parameters of every factor. Therefore, establishing mathematical functions is a good way to gain the desired parameters by Design-Expert software (12.0.3, Stat-EASE, Inc., Minneapolis, USA) [37]. According to results of the study, the optimized constraints and variable ranges are as follows: 5 ≤ A ≤ 15, 30 ≤ B ≤ 70, Y1 = maxY1(A, B), Y2 = maxY2(A, B), Y3 = maxY3(A, B).
Finally, the desired parameters were obtained. Under the condition of TS of 15% and SMS ratio of 38.87%, we can gain the best results with a cumulative yield of 94.2 (mL/g VS), VS removal of 40.90% and synergy increased methane yield of 414%.
4. Conclusions
This study evaluated the effects of different livestock manures, total solids content and feedstock ratio on the anaerobic co-digestion of SMS using a series of experimental conditions. We obtained the desired parameters by mathematical methods and attained significant biogas productivity. We draw three major conclusions from this study. (i) We observed a positive synergistic effect of co-digestion of SMS with livestock manures, and the methane production of co-digestion of SMS with CM is slightly better than that of PM or DM. (ii) The TS content and feedstock ratio have a great influence on anaerobic co-digestion, and the feedstock ratio has a more significant contribution on the AD process. (iii) The synergistic effect was closely related to the C/N ratio, and under the experimental conditions (TS = 15%, SMS relative ratio of 50% and C/N ratio = 25.6), the cumulative methane yield of SMS with chicken manure was increased by 414% compared with that of using SMS or CM separately. These research findings will help to sustainably produce biogas in the mushroom farm using SMS and animal manure produced nearby that will offset the use of fossil fuel and benefit the environment by reducing GHG emissions.
Author Contributions
Conceptualization, X.G. and X.T.; formal analysis, X.G.; investigation, X.G.; resources, K.Z. and Q.Z.; data curation, X.G.and X.T.; writing—original draft preparation, X.G.; writing—review and editing, X.G., X.T. and V.B.; supervision, X.T. and V.B.; funding acquisition, X.T. and V.B. All authors have read and agreed to the published version of the manuscript.
Funding
This work was funded by the Sichuan Science and Technology Program (2019YFH0036) and the National Science Foundation of China (31600013).
Informed Consent Statement
Not applicable.
Data Availability Statement
The data presented in this study are available on request from the corresponding author.
Acknowledgments
The authors are grateful for the constructive comments by anonymous reviewers, which improved the presentation of this paper. The authors would also like to thank Shifang Haoyang Agriculture Development Limited Company for material support. Balan thank the University of Houston and state of Texas for providing startup funds.
Conflicts of Interest
The authors declare no conflict of interest. The funders had no role in the design of the study; in the collection, analyses, or interpretation of data; in the writing of the manuscript, or in the decision to publish the results.
Abbreviations
| AD | Anaerobic Digestion |
| CG | Control Group |
| CM | Chicken Manure |
| CMY | Cumulative methane yield |
| DBY | Daily biogas yield |
| DM | Dairy Manure |
| GHG | Greenhouse Gas |
| HCL | Chloridric acid |
| LM | Livestock Manure |
| NaOH | Sodium Hydroxide |
| NH4+-N | Ammonia Nitrogen |
| PH | Potential Hydrogen |
| PM | Pig Manure |
| SMS | Spent Mushroom Substrate |
| SIMY | Synergistic increased methane yield |
| TS | Total Solids |
| VFA | Volatile Fatty Acid |
| VS | Volatile solids |
| WMP | Weighted methane production |
References
- Williams, B.; McMullan, J.; McCahey, S. An initial assessment of spent mushroom compost as a potential energy feedstock. Bioresour. Technol. 2001, 79, 227–230. [Google Scholar] [CrossRef]
- Zhu, J.; Han, M.; Zhang, G.; Yang, L. Co-digestion of spent mushroom substrate and corn stover for methane production via solid-state anaerobic digestion. J. Renew. Sustain. Energy 2015, 7, 023135. [Google Scholar] [CrossRef]
- Li, G.; Lu, Z.; Zhang, J.; Li, H.; Zhou, Y.; Zayan, A.M.I.; Huang, Z. Life cycle assessment of biofuel production from microalgae cultivated in anaerobic digested wastewater. Int. J. Agric. Biol. Eng. 2020, 13, 241–246. [Google Scholar] [CrossRef]
- Li, G.; Bai, X.; Li, H.; Lu, Z.; Zhou, Y.; Wang, Y.; Cao, J.; Huang, Z. Nutrients removal and biomass production from anaerobic digested effluent by microalgae: A review. Int. J. Agric. Biol. Eng. 2019, 12, 8–13. [Google Scholar] [CrossRef]
- Coles, P.S.; Nogin, G.; Fidanza, M.A.; Roth, G. Evaluation of Fresh Mushroom Compost in a Field Corn Production System. Compos. Sci. Util. 2020, 28, 76–86. [Google Scholar] [CrossRef]
- Meng, L.; Li, W.; Zhang, S.; Wu, C.; Lv, L. Feasibility of co-composting of sewage sludge, spent mushroom substrate and wheat straw. Bioresour. Technol. 2017, 226, 39–45. [Google Scholar] [CrossRef] [PubMed]
- Zhang, R.-H.; Duan, Z.; Li, Z.-G. Use of Spent Mushroom Substrate as Growing Media for Tomato and Cucumber Seedlings. Pedosphere 2012, 22, 333–342. [Google Scholar] [CrossRef]
- Yadav, M.; Singh, A.; Balan, V.; Pareek, N.; Vivekanand, V. Biological treatment of lignocellulosic biomass by Chaetomium globosporum: Process derivation and improved biogas production. Int. J. Biol. Macromol. 2019, 128, 176–183. [Google Scholar] [CrossRef]
- Bisaria, R.; Madan, M.; Mukhopadhyay, S.N. Production of biogas from residues from mushroom cultivation. Biotechnol. Lett. 1983, 5, 811–812. [Google Scholar] [CrossRef]
- Bisaria, R.; Vasudevan, P.; Bisaria, V. Utilization of spent agro-residues from mushroom cultivation for biogas production. Appl. Microbiol. Biotechnol. 1990, 33, 607–609. [Google Scholar] [CrossRef]
- Xiao, Z.; Lin, M.; Fan, J.; Chen, Y.; Zhao, C.; Liu, B. Anaerobic digestion of spent mushroom substrate under thermophilic conditions: Performance and microbial community analysis. Appl. Microbiol. Biotechnol. 2018, 102, 499–507. [Google Scholar] [CrossRef] [PubMed]
- YuanFang, D.; Ling, Q.; QuanPing, S.; LiangXiao, J.; Am, H.A. Influence of anaerobic co-digestion of mushroom cultivation wastes and pig manure on the biogas production and its quality. J. Agro-Environ. Sci. 2012, 31, 613–619. [Google Scholar]
- Shi, X.-S.; Yuan, X.-Z.; Wang, Y.-P.; Zeng, S.-J.; Qiu, Y.-L.; Guo, R.-B.; Wang, L.-S. Modeling of the methane production and pH value during the anaerobic co-digestion of dairy manure and spent mushroom substrate. Chem. Eng. J. 2014, 244, 258–263. [Google Scholar] [CrossRef]
- Lin, Y.; Ge, X.; Li, Y. Solid-state anaerobic co-digestion of spent mushroom substrate with yard trimmings and wheat straw for biogas production. Bioresour. Technol. 2014, 169, 468–474. [Google Scholar] [CrossRef] [PubMed]
- Li, Y.; Li, Y.; Zhang, D.; Li, G.; Lu, J.; Li, S. Solid state anaerobic co-digestion of tomato residues with dairy manure and corn stover for biogas production. Bioresour. Technol. 2016, 217, 50–55. [Google Scholar] [CrossRef] [PubMed]
- Luo, X.; Yuan, X.; Wang, S.; Sun, F.; Hou, Z.; Hu, Q.; Zhai, L.; Cui, Z.; Zou, Y. Methane production and characteristics of the microbial community in the co-digestion of spent mushroom substrate with dairy manure. Bioresour. Technol. 2018, 250, 611–620. [Google Scholar] [CrossRef]
- Yang, L.; Xu, F.; Ge, X.; Li, Y. Challenges and strategies for solid-state anaerobic digestion of lignocellulosic biomass. Renew. Sustain. Energy Rev. 2015, 44, 824–834. [Google Scholar] [CrossRef]
- Ballesteros, M. Enzymatic hydrolysis of lignocellulosic biomass. Bioalcohol Prod. 2010, 159–177. [Google Scholar] [CrossRef]
- Zhu, Q.; Dai, L.; Wang, Y.; Tan, F.; Chen, C.; He, M.; Maeda, T. Enrichment of waste sewage sludge for enhancing methane production from cellulose. Bioresour. Technol. 2021, 321, 124497. [Google Scholar] [CrossRef]
- Zheng, Z.; Liu, J.; Yuan, X.; Wang, X.; Zhu, W.; Yang, F.; Cui, Z. Effect of dairy manure to switchgrass co-digestion ratio on methane production and the bacterial community in batch anaerobic digestion. Appl. Energy 2015, 151, 249–257. [Google Scholar] [CrossRef]
- Shen, J.; Yan, H.; Zhang, R.; Liu, G.; Chen, C. Characterization and methane production of different nut residue wastes in anaerobic digestion. Renew. Energy 2018, 116, 835–841. [Google Scholar] [CrossRef]
- Ma, X.; Jiang, T.; Chang, J.; Tang, Q.; Luo, T.; Cui, Z. Effect of Substrate to Inoculum Ratio on Biogas Production and Microbial Community During Hemi-Solid-State Batch Anaerobic Co-digestion of Rape Straw and Dairy Manure. Appl. Biochem. Biotechnol. 2019, 189, 884–902. [Google Scholar] [CrossRef] [PubMed]
- Li, K.; Liu, R.; Sun, C. Comparison of anaerobic digestion characteristics and kinetics of four livestock manures with different substrate concentrations. Bioresour. Technol. 2015, 198, 133–140. [Google Scholar] [CrossRef] [PubMed]
- Xu, F.; Wang, Z.-W.; Tang, L.; Li, Y. A mass diffusion-based interpretation of the effect of total solids content on solid-state anaerobic digestion of cellulosic biomass. Bioresour. Technol. 2014, 167, 178–185. [Google Scholar] [CrossRef] [PubMed]
- Riggio, S.; Torrijos, M.; Debord, R.; Esposito, G.; Van Hullebusch, E.D.; Steyer, J.-P.; Escudié, R. Mesophilic anaerobic digestion of several types of spent livestock bedding in a batch leach-bed reactor: Substrate characterization and process performance. Waste Manag. 2017, 59, 129–139. [Google Scholar] [CrossRef]
- Aymerich, E.; Esteban-Gutiérrez, M.; Sancho, L. Analysis of the stability of high-solids anaerobic digestion of agro-industrial waste and sewage sludge. Bioresour. Technol. 2013, 144, 107–114. [Google Scholar] [CrossRef] [PubMed]
- Wang, Z.; Jiang, Y.; Wang, S.; Zhang, Y.; Hu, Y.; Hu, Z.; Wu, G.; Zhan, X. Impact of total solids content on anaerobic co-digestion of pig manure and food waste: Insights into shifting of the methanogenic pathway. Waste Manag. 2020, 114, 96–106. [Google Scholar] [CrossRef]
- Li, Y.; Zhang, R.; Chen, C.; Liu, G.; He, Y.; Liu, X. Biogas production from co-digestion of corn stover and chicken manure under anaerobic wet, hemi-solid, and solid state conditions. Bioresour. Technol. 2013, 149, 406–412. [Google Scholar] [CrossRef]
- You, Z.; Zhang, S.; Kim, H.; Chiang, P.-C.; Sun, Y.; Guo, Z.; Xu, H. Effects of Corn Stover Pretreated with NaOH and CaO on Anaerobic Co-Digestion of Swine Manure and Corn Stover. Appl. Sci. 2018, 9, 123. [Google Scholar] [CrossRef]
- Shen, F.; Li, H.; Wu, X.; Wang, Y.; Zhang, Q. Effect of organic loading rate on anaerobic co-digestion of rice straw and pig manure with or without biological pretreatment. Bioresour. Technol. 2018, 250, 155–162. [Google Scholar] [CrossRef]
- Alkaya, E.; Erguder, T.H.; Demirer, G.N. Effect of operational parameters on anaerobic co-digestion of dairy cattle manure and agricultural residues: A case study for the Kahramanmaraş region in Turkey. Eng. Life Sci. 2010, 10, 552–559. [Google Scholar] [CrossRef]
- Al Mamun, M.R.; Torii, S. Comparison effect of feedstock to inoculum ratios on biogas yields of cafeteria, vegetable, fruit wastes with cattle manure using co-digestion process. Int. J. Green Energy 2017, 14, 665–673. [Google Scholar] [CrossRef]
- Zhou, J.; Zhang, Y.; Khoshnevisan, B.; Duan, N. Meta-analysis of anaerobic co-digestion of livestock manure in last decade: Identification of synergistic effect and optimization synergy range. Appl. Energy 2021, 282, 116128. [Google Scholar] [CrossRef]
- Hassan, M.; Ding, W.; Umar, M.; Rasool, G. Batch and semi-continuous anaerobic co-digestion of goose manure with alkali solubilized wheat straw: A case of carbon to nitrogen ratio and organic loading rate regression optimization. Bioresour. Technol. 2017, 230, 24–32. [Google Scholar] [CrossRef] [PubMed]
- Andriamanohiarisoamanana, F.J.; Saikawa, A.; Tarukawa, K.; Qi, G.; Pan, Z.; Yamashiro, T.; Iwasaki, M.; Ihara, I.; Nishida, T.; Umetsu, K. Anaerobic co-digestion of dairy manure, meat and bone meal, and crude glycerol under mesophilic conditions: Synergistic effect and kinetic studies. Energy Sustain. Dev. 2017, 40, 11–18. [Google Scholar] [CrossRef]
- Abdulsalam, M.; Man, H.C.; Abidin, Z.Z.; Yunos, K.F.; Idris, A.I. Decolorization of Palm Oil Mill Effluent by Klebsiella Pneumonia ABZ11: Remediation Efficacy and Statistical Optimization of Treatment Conditions. Front. Microbiol. 2020, 11, 675. [Google Scholar] [CrossRef] [PubMed]
- Gao, W.; Song, W.; Ding, T.; Wang, J. Design of Bacteria Bottle Clamping Elements Based on Regression Models. J. Math. 2020, 2020, 1–12. [Google Scholar] [CrossRef]


Publisher’s Note: MDPI stays neutral with regard to jurisdictional claims in published maps and institutional affiliations. |
© 2021 by the authors. Licensee MDPI, Basel, Switzerland. This article is an open access article distributed under the terms and conditions of the Creative Commons Attribution (CC BY) license (http://creativecommons.org/licenses/by/4.0/).