1. Introduction
Since the late 1960s, polymer transmission class insulators have been replacing ceramic and glass insulators on HVAC lines in coastal and industrial pollution areas [
1]. In the late 1970s, following an increase of in-service HVDC transmission lines, polymer insulators were adopted for some DC lines [
1]. DC insulators attract more airborne pollution due to electrostatic attraction. In high pollution environments, leakage current (LC) and dry band arcing (DBA) activity may develop on contaminated surfaces of polymer insulators. DBA makes the insulator housing prone to tracking and erosion degradation, which in turn reduces reliability of the insulator. Service experience with HVDC polymer insulators installed in high or very high pollution environments remains limited. However, field and laboratory tests comparing AC and DC performance of silicone rubber (SR) housing material show that the eroded mass of specimens energized with DC is greater than that of those energized with equivalent AC voltage [
2,
3,
4]. These findings are concerning for the long term reliability of HVDC insulators in service.
Design of insulation materials that possess acceptable erosion resistant performance under DC became an important task. The standard inclined plane test (IPT) method has been used in the industry as a rapid and reliable test for the evaluation of the tracking and erosion resistance of solid insulation materials during their design stages [
5,
6]. The test is designed to reproduce service conditions in which DBA forms on the surface of insulating material [
7]. Voltage is applied to a small sample of material at a prescribed test level while a controlled stream of liquid contaminant flows on the surface of the sample. The standard test procedure, described in ASTM D2303 [
6] and IEC 60587 [
5] standards, applies to evaluation under AC stress only. In recent years, the IPT method has been adapted for testing materials with DC stress [
8,
9,
10,
11,
12]. The DC IPT has been found to produce repeatable results in terms of material erosion severity [
13,
14]. However, when the test is performed with the same test parameters, that is, test voltage and contaminant flow rate as recommended in IEC 60587 for the AC test, the materials that pass the AC test, fail under the DC stress [
15,
16]. Moreover, high temperature vulcanized (HTV) SR materials are most severely eroded by surface discharges under a positive DC voltage as compared to the equivalent tests under negative DC voltage [
9,
14,
15].
Further rigorous investigations of the mechanisms that cause reproducible deep erosion under a DC voltage relative to the AC voltage are ongoing. Numerous analytical techniques, including statistical analysis of the leakage current, frequency analysis of dry band arcing energy, thermal imaging and arc mobility studies, have been employed to determine possible erosion indicators [
17,
18,
19,
20,
21]. Results of these studies suggest that there are many different variables which contribute to the overall material degradation [
14]. However, thus far no particular erosion indicators have been proposed which will always be indicative of the level of damage caused.
The study presented in this paper investigates the presence of erosion indicators in the characteristics of surface discharges during various degradation stages of SR material subjected to IPT under AC and DC stress. The authors employ partial discharge (PD) measurement instruments to collect and analyze discharge data. The results of this study advance the understanding of the AC and DC erosion mechanisms. This in turn contributes to the development of a standardized DC test procedure and the design of materials that withstand erosion under DC stress.
2. Study Methodology
The main objectives of this research are to identify characteristics of discharges that lead to deep erosion of silicone rubber, and to determine the differences and similarities between the eroding discharges produced by AC stress versus DC stress. The IPT setup is useful for generating surface partial discharges initiated from surface pollution that lead to the degradation of materials by surface erosion. A review of publications pertaining to partial discharge (PD) measurement on polymer insulators showed that the research has mainly focused on the detection of surface pollution severity and dry band arcing under the AC stress [
22,
23,
24,
25]. In a recent publication, the authors presented the results of a partial discharge evaluation of discharges that lead to the degradation of silicone rubber under AC stress [
26].
This research extends partial discharge measurement to the evaluation of surface erosion discharge characteristics under DC stress. The three-part study methodology employed in this work builds on the measurement and analysis methods employed for AC studies. First, silicone rubber samples are subjected to IPT tracking and erosion tests under DC stress. Second, while the material is undergoing degradation, the PD data are acquired, and discharge characteristics are identified. Third, to investigate the differences between AC and DC erosion mechanisms, the properties of discharges that cause erosion are determined and compared for the AC test versus the DC test.
The study of discharges in this paper will utilize the classification of visible discharge activity by types suggested by Rowland et al.: mobile discharge, localized arcing, and high temperature arcing [
21]. The three types of discharge were identified based on their physical appearance and the severity of material degradation that each type causes [
21]:
Mobile discharge does not get rooted to any point on the surface and causes least severe damage;
Localized arcing becomes rooted at a certain location on the sample and leads to moderate surface erosion;
High temperature arcing is observed as a bright hot spot, and leads to most severe, deep erosion damage.
3. Experimental Apparatus and Procedure
3.1. Apparatus
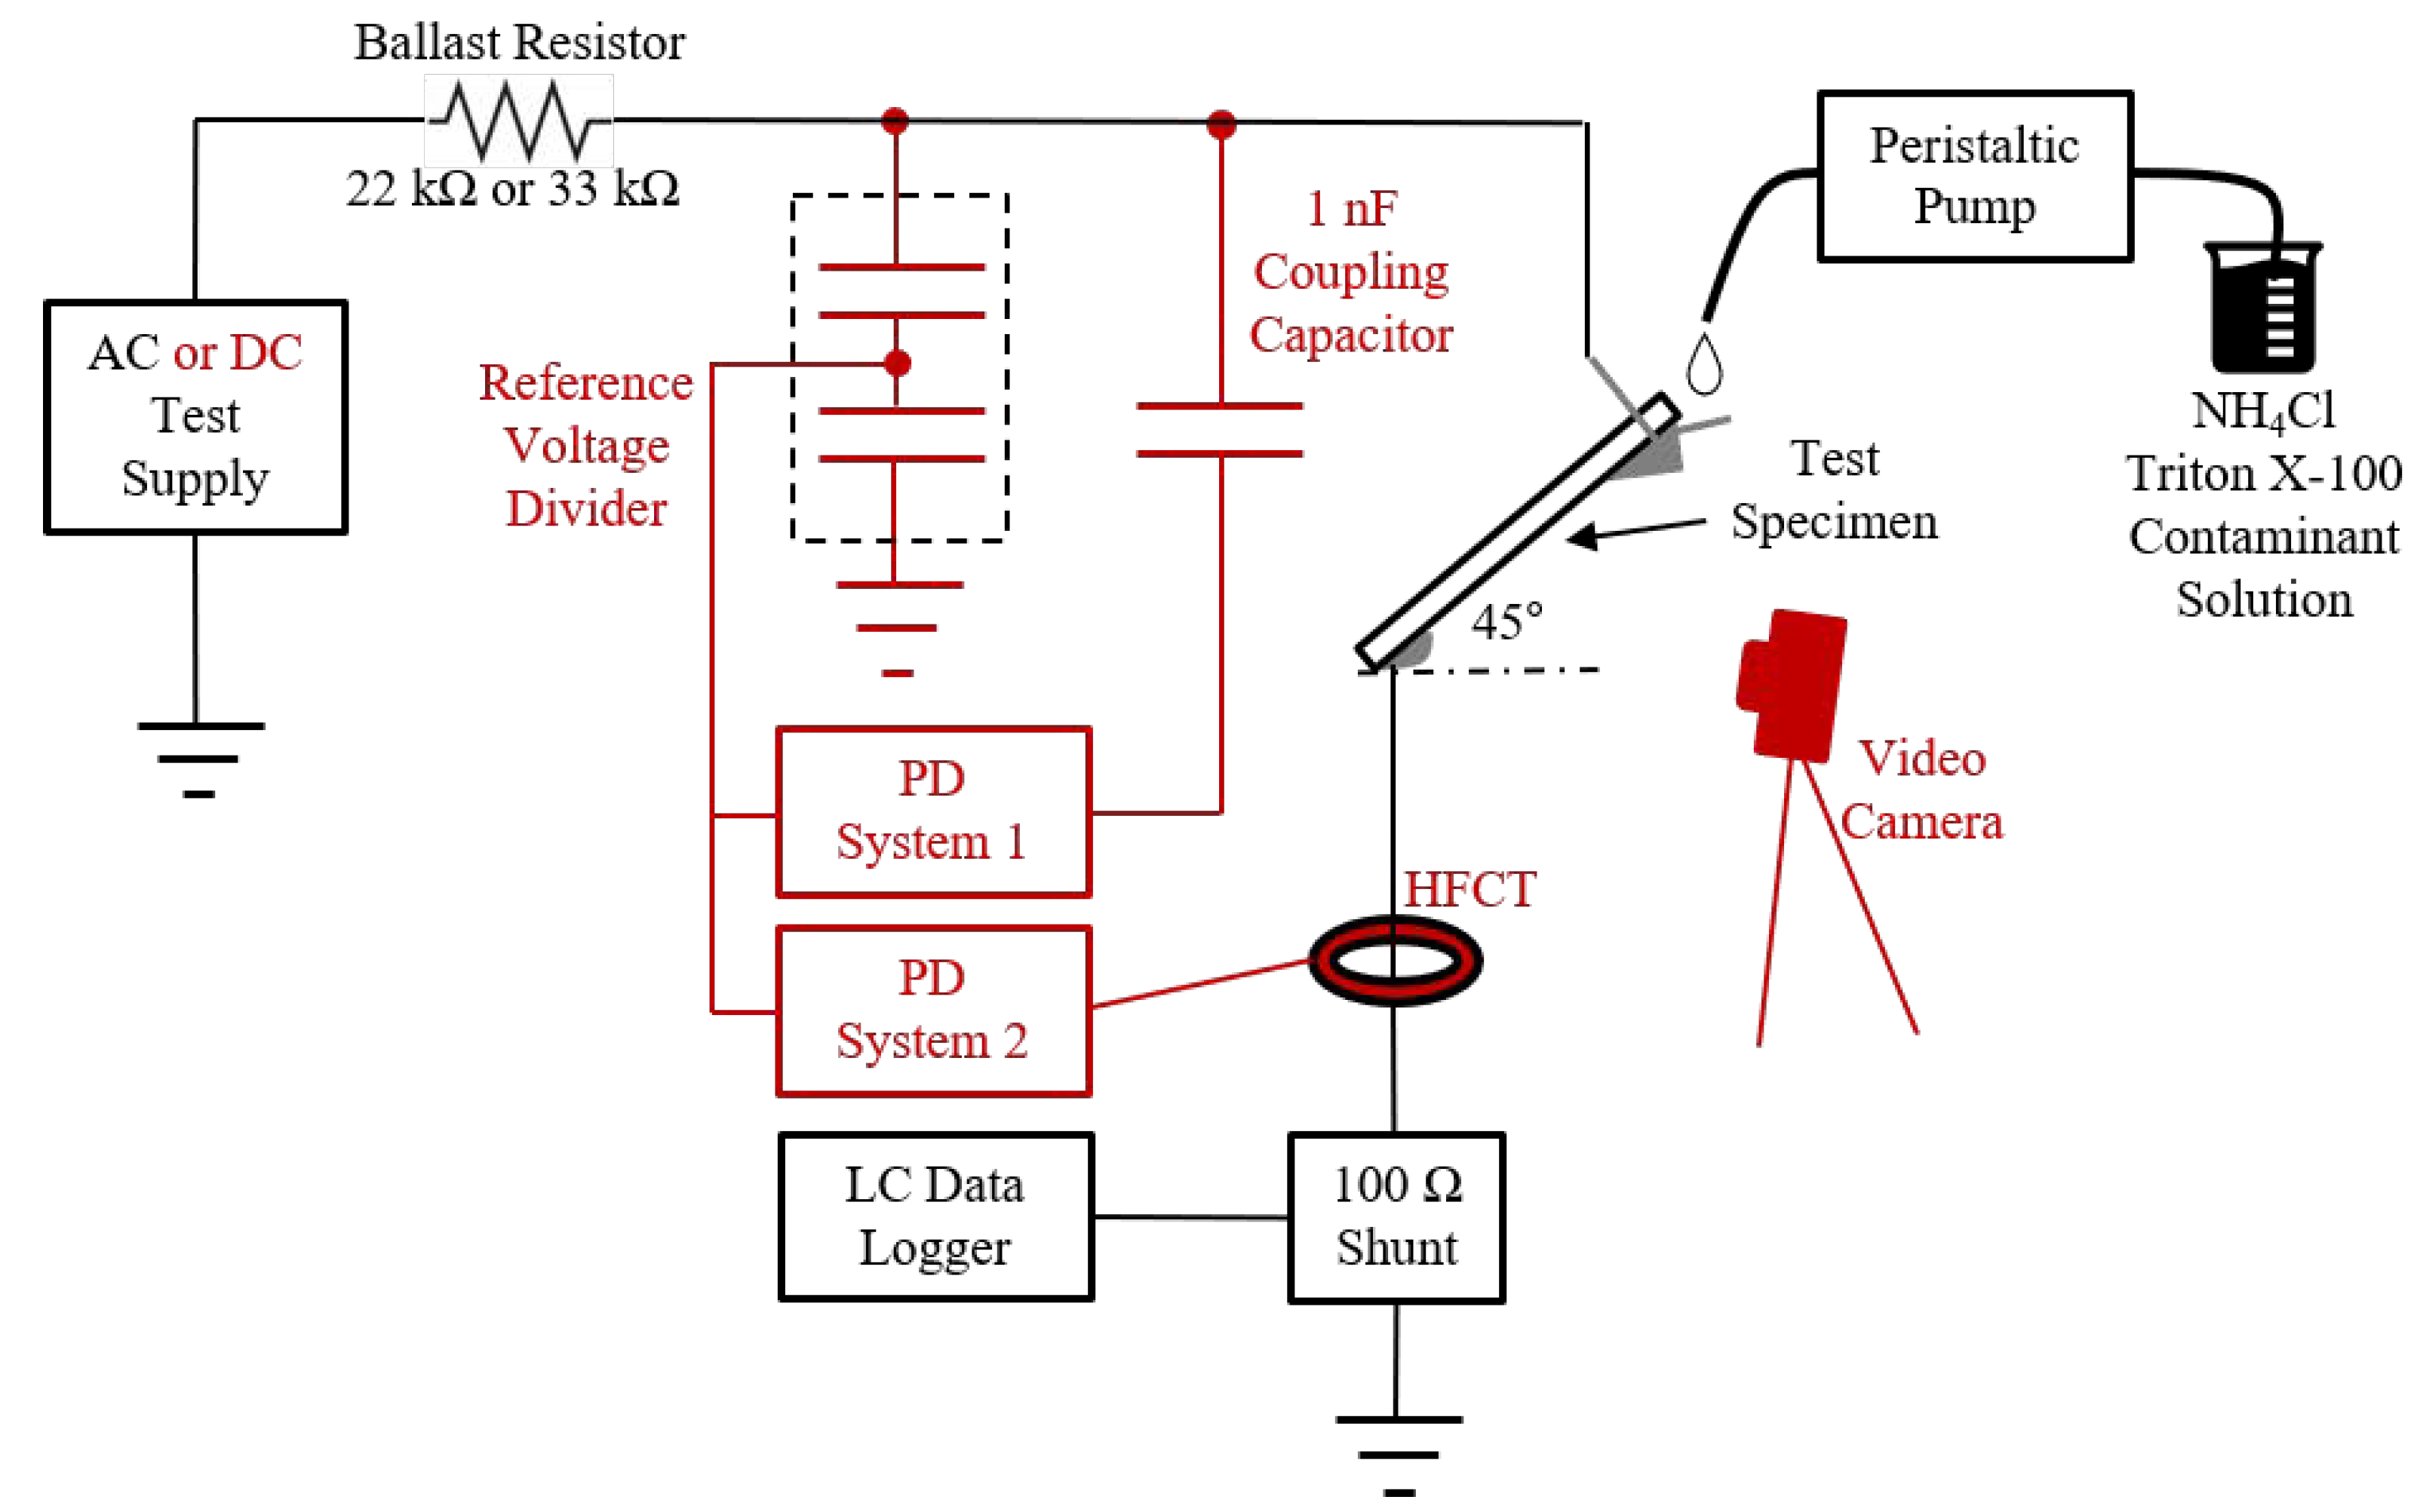
The inclined plane test apparatus, shown in black outline in
Figure 1, conforms to IEC 60587 specifications. The test samples were prepared from 6 mm thick sheets of commercially available HTV silicone rubber. Each sample was placed on a Teflon backing and positioned at
from the horizontal (see
Figure 1). Although the standard permits simultaneous testing of several samples, only one sample was tested at a time for this study to minimize interference. A new set of stainless steel electrodes was used for each new sample. A peristaltic pump (Ismatec REGLO Digital ISM834) was used to supply a controlled stream of liquid contaminant. For both the AC and DC tests, the contaminant was prepared by dissolving ammonium chloride in deionized water until a conductivity of
mS/cm of the solution was reached. A nonionic wetting agent was added to the solution at
wt% to combat hydrophobic properties of the silicone rubber material.
To achieve research objectives, several additions and modifications were introduced to the standard IPT arrangement, as shown in the red outline in
Figure 1. For the AC test, the voltage was supplied by a 30 kVA, 600/25,000 V dry type transformer. To investigate erosion mechanisms under DC stress, the AC supply was replaced by a polarity-reversible 15 kV, 5 kW DC source (Glassman LH15R330) that has an output ripple less than
% RMS of the rated voltage at full load. The contaminant flow rate and the ballast resistor value were adjusted in accordance with the test parameters prescribed in
Table 1 of IEC 60587 [
5]. The bottom electrode on the sample was grounded through a 60 mA time delay fuse. Supplementary leakage current data was acquired across a
-Ω shunt resistor. A video camera, positioned about 20 cm away from the specimen, captured color video of the arcing activity during test.
Partial discharge measurements were acquired during testing using two commercially available PD systems concurrently. Both systems are shown to be connected to the test specimen in
Figure 1. PD System 1 was used in conjunction with a
coupling capacitor. It was used to acquire the phase resolved partial discharge (PRPD) plots during the AC tests, and the diagrams of charge versus time during the DC tests. The background noise and the PD generated by the experimental setup with a dry specimen were measured with both AC and DC test supplies and found to be below 80 pC at
kV
rms, and 130 pC at
kV DC.
PD System 2 was used in conjunction with a high frequency current transformer (HFCT), placed on the ground lead of the test specimen. This system quantifies PD in mV and captures individual pulse waveshapes. Processing software for System 2 utilizes a signal processing technique called time-frequency (TF) mapping [
27].
3.2. Test Procedure
There are two recommended IEC 60587 test methods, constant voltage or step-wise increasing voltage. Experiments were conducted using a combination of the two methods. This allowed us to find the critical test voltage and flow rate necessary for the formation of stable rooted discharges on the surface of the material [
28]. The IPT was first performed on eleven SR specimens subjected to AC stress. The AC experiments were conducted at voltages between
and
kV
rms in
steps. The test voltage was varied between the four levels in order to find conditions that produce effective scintillations and initiate the most damaging eroding discharges. An AC test voltage level of
kV
rms and
mL/min contaminant flow rate were found to produce the most stable discharges that lead to formation of high temperature arcing.
Once the critical AC test level was determined, the equivalent DC test levels were selected to be 85% and 68% of the critical AC test level for negative and positive polarity tests, respectively. These percentages were set within the suggested voltage ranges for equivalent IPT methods under DC stress [
16,
29,
30]. A total of ten samples were subjected to negative DC tests. In addition to the critical test level of
kV (85% of AC), some samples were tested at
and
for the purpose of investigation of most damaging test conditions. Positive polarity DC tests were performed on eight samples. In addition to the critical test level of
kV (68% of AC), some samples were tested at
and
to investigate favourable conditions for formation of high temperature arcing. The flow rate of the contaminant however is not defined for the equivalent DC tests, because IEC 60587 test parameters only apply for the AC stress. In the negative DC test, the flow rate was set at
. In the positive DC test, flow rates of
and
were investigated.
The duration of test for each silicone rubber specimen was based on end-point criteria from IEC 60587 [
5]. This was determined by the length of tracking and erosion damage path, and the leakage current magnitude. If the damage path reached half way between the electrodes or if the specimen showed a hole due to erosion or intense arcing caused ignition of the polymer material, the test was terminated. If the leakage current exceeded
for over 2 s, the fuse would open the circuit and stop the test. Otherwise, the maximum test time was limited to 6 h. At the end of all tests, the depth of erosion and vertical length of erosion and tracking were measured for all the specimens.
The video footage recorded by the camera was used to identify the types of surface discharges (i.e., mobile, localized, or high temperature) based on their physical properties, such as intensity, stability, location on the sample, and the corresponding severity of material damage. The video recordings and PD acquisitions were synchronized and acquired at various times during the test. The leakage current data were used in conjunction with visual observations of arcing activity to determine arcing intermittency/stability and intensity.
3.3. Data Analysis
The analysis of AC PD data, described in [
26], consisted of the evaluation of the PRPD patterns obtained with System 1 and TF map clusters obtained using System 2. In the DC tests, diagrams of charge magnitude versus time and the corresponding synchronized videos of discharge activity were reviewed simultaneously. Magnitude windows as well as intermittency of mobile, localized, and high temperature discharges were determined from these diagrams. The TF maps were obtained and analyzed in the same way as in the AC test. The TF map clusters of pulses were characterized by the range of equivalent time-length and bandwidth (
and
) describing a rectangle encompassing each individual cluster.
The processing software for PD System 2 captures individual PD pulse waveshapes obtained in both the AC and the DC tests. The software also performs Fast Fourier Transform (FFT) and provides information about frequency spectrum of the pulse. Waveshapes and frequency spectra were compared for pulses from separate TF map clusters and for pulses from AC tests relative to pulses from DC tests of both polarities. Pulse characteristics such as amplitude, energy, pulse width, and FFT, were evaluated and compared for the eroding discharge pulses at the three types of voltage.
4. Results and Discussion
In the negative DC tests, the most stable discharges were observed at the equivalent test voltage of
kV and contaminant flow rate of
mL/min. The severity of SR erosion was similar to that of the AC test at
kV
rms. In the positive DC tests, stable discharges were easily initiated and developed into high temperature arcing. At the equivalent test voltage of
kV and
mL/min contaminant rate, the severity of SR erosion in terms of depth and length was greater than that of the AC test and the negative DC test. It was found that the positive DC test causes the most severe erosion of SR material despite applying an equivalent test voltage of
of the AC test level, as discussed in
Section 3.2. Based on the depth of sample erosion and relatively shorter times to failure, it is concluded that the DC test at
is more severe than AC test at
kV
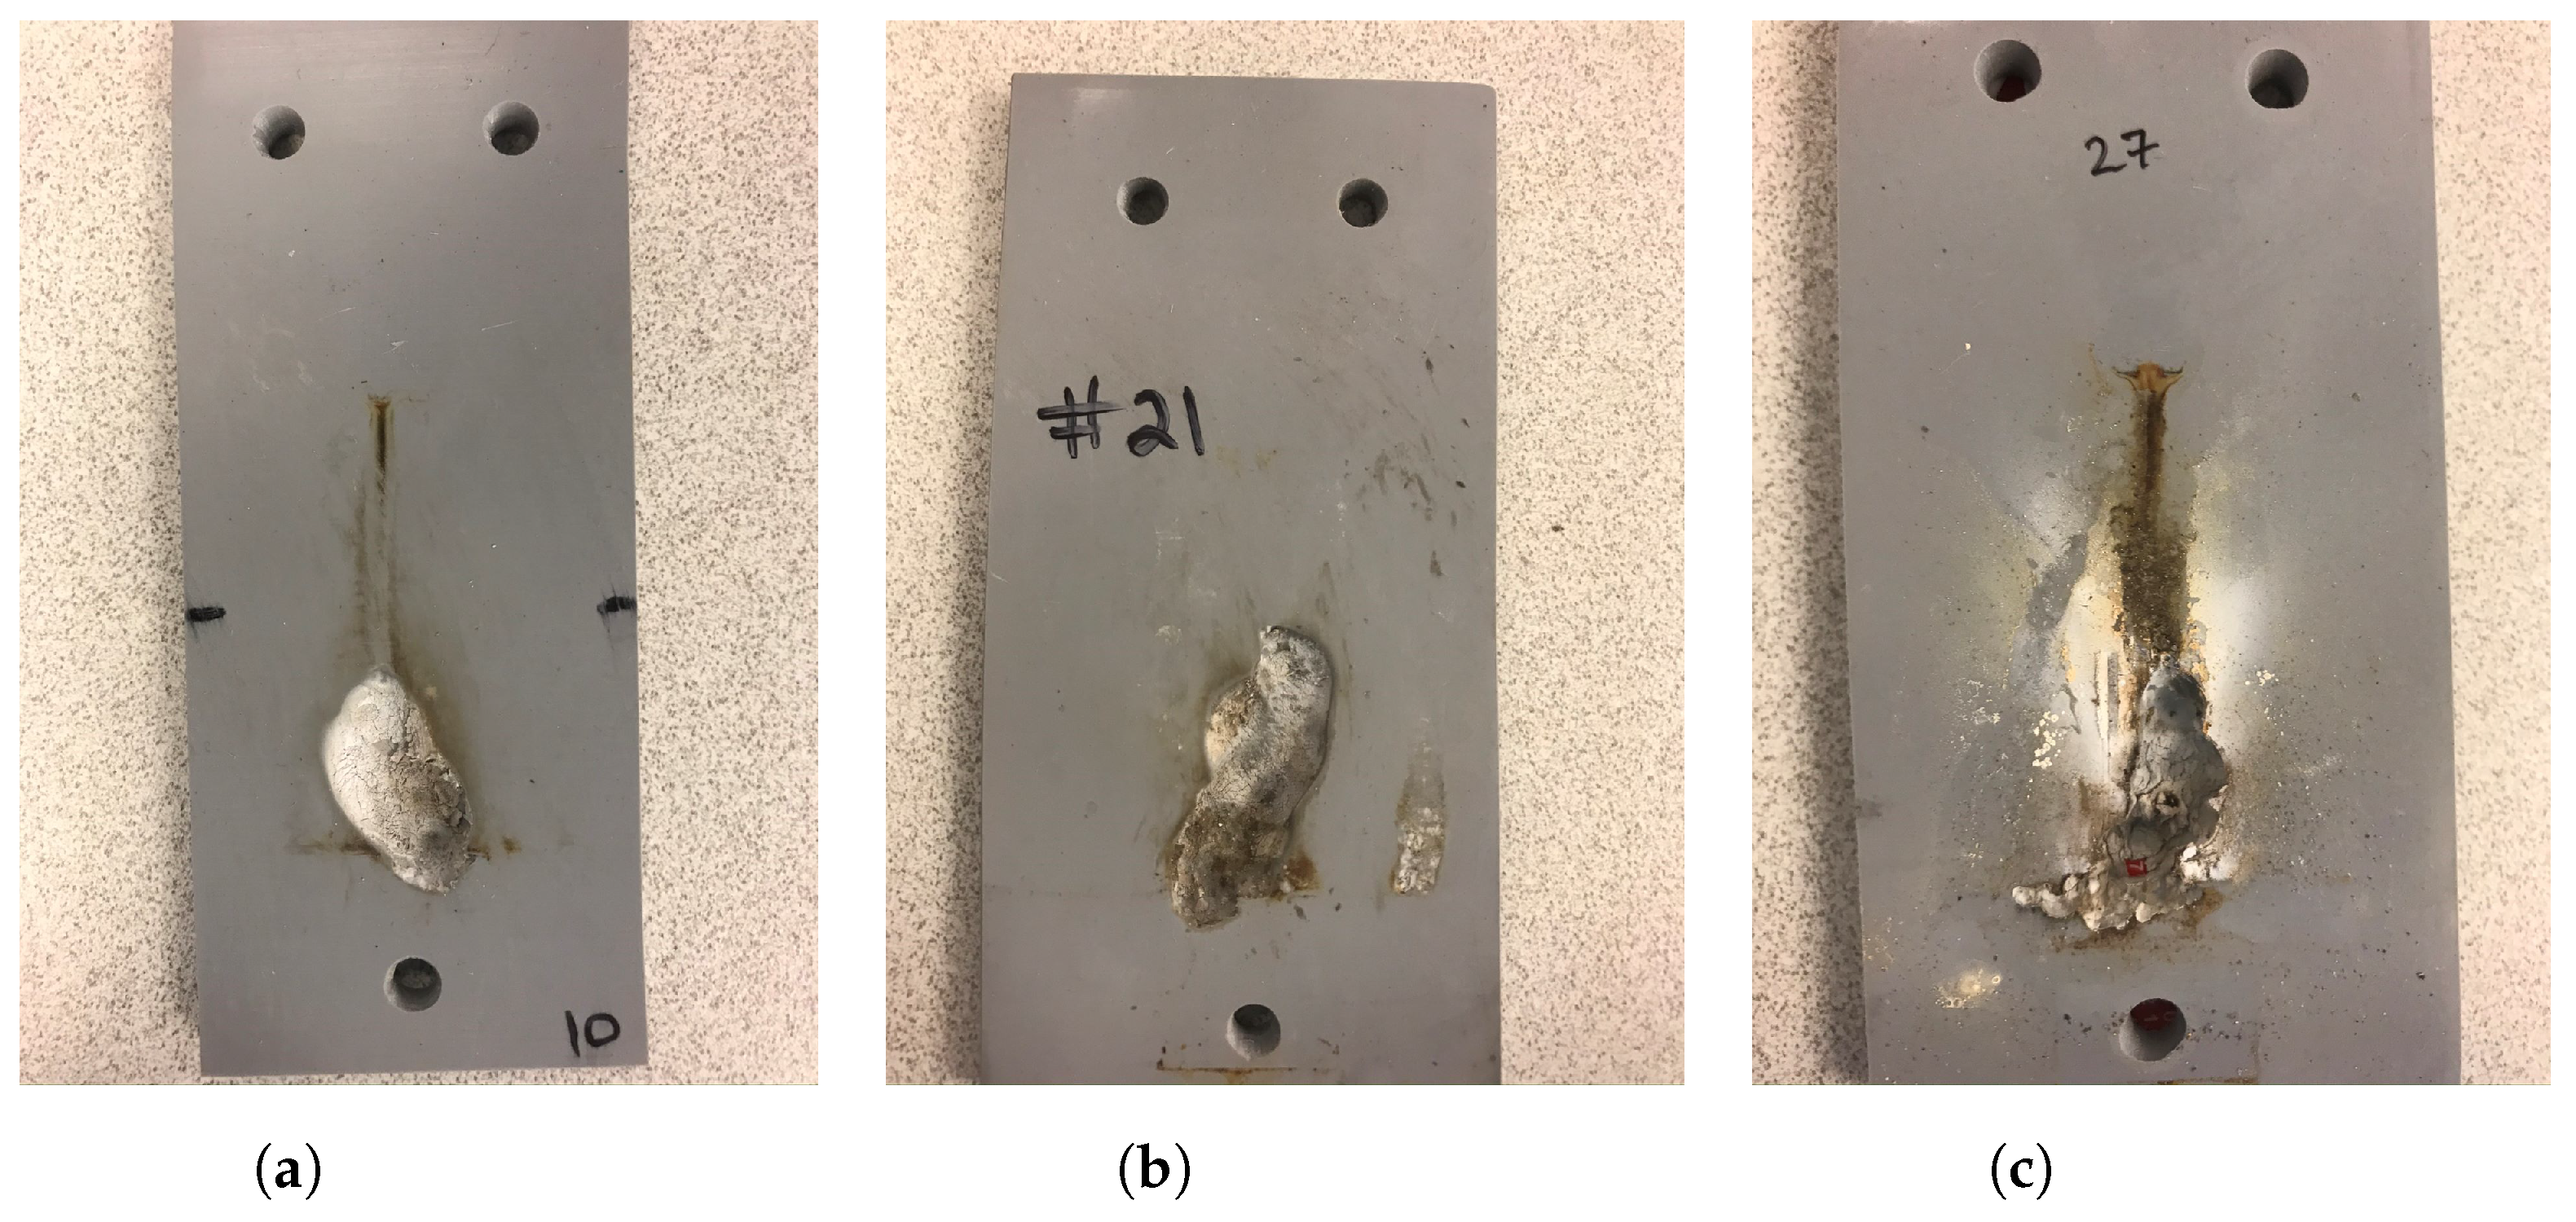
rms. Examples of material degradation on samples tested with AC or DC voltage are shown in
Figure 2. Additional photographs of samples at the end of the tests are provided in
Appendix A.
The LC failure criterion of 60 mA for 2 s was not reached for any of the test samples. No classical tracking failure was reached by any of the specimens tested under the critical AC or DC voltages. Similar results were reported by Koné et al. for SR filled with natural silica [
28]. The AC and DC test parameters and results of evaluation of damage on each sample are summarized in
Table A1 of the
Appendix A.
The properties of mobile, localized, and high temperature types of surface discharges were identified from visual observations and video recordings. The physical characteristics of these three types of discharges were discussed in [
26]. The appearance of these discharges as well as the severity of material damage that each type causes is similar at the AC, −DC and +DC test voltages. In this paper, high temperature arcing discharges are also referred to as eroding discharges. These discharges produce the most severe (deep erosion) damage compared to the other two types of discharges.
In the AC IPT, it was found that each type of discharge produces a distinct PRPD plot and forms a separable cluster on the TF map. The results of the PRPD pattern identification and TF map cluster separation for mobile, localized, and high temperature discharges were presented in [
26]. The evaluation of PD characteristics obtained in negative and positive DC IPT are presented in this paper.
4.1. Negative DC Discharge Characteristics
The results of charge magnitude window evaluation and TF map cluster separation for mobile, localized, and high temperature discharges observed in negative DC IPT are summarized in
Table 1.
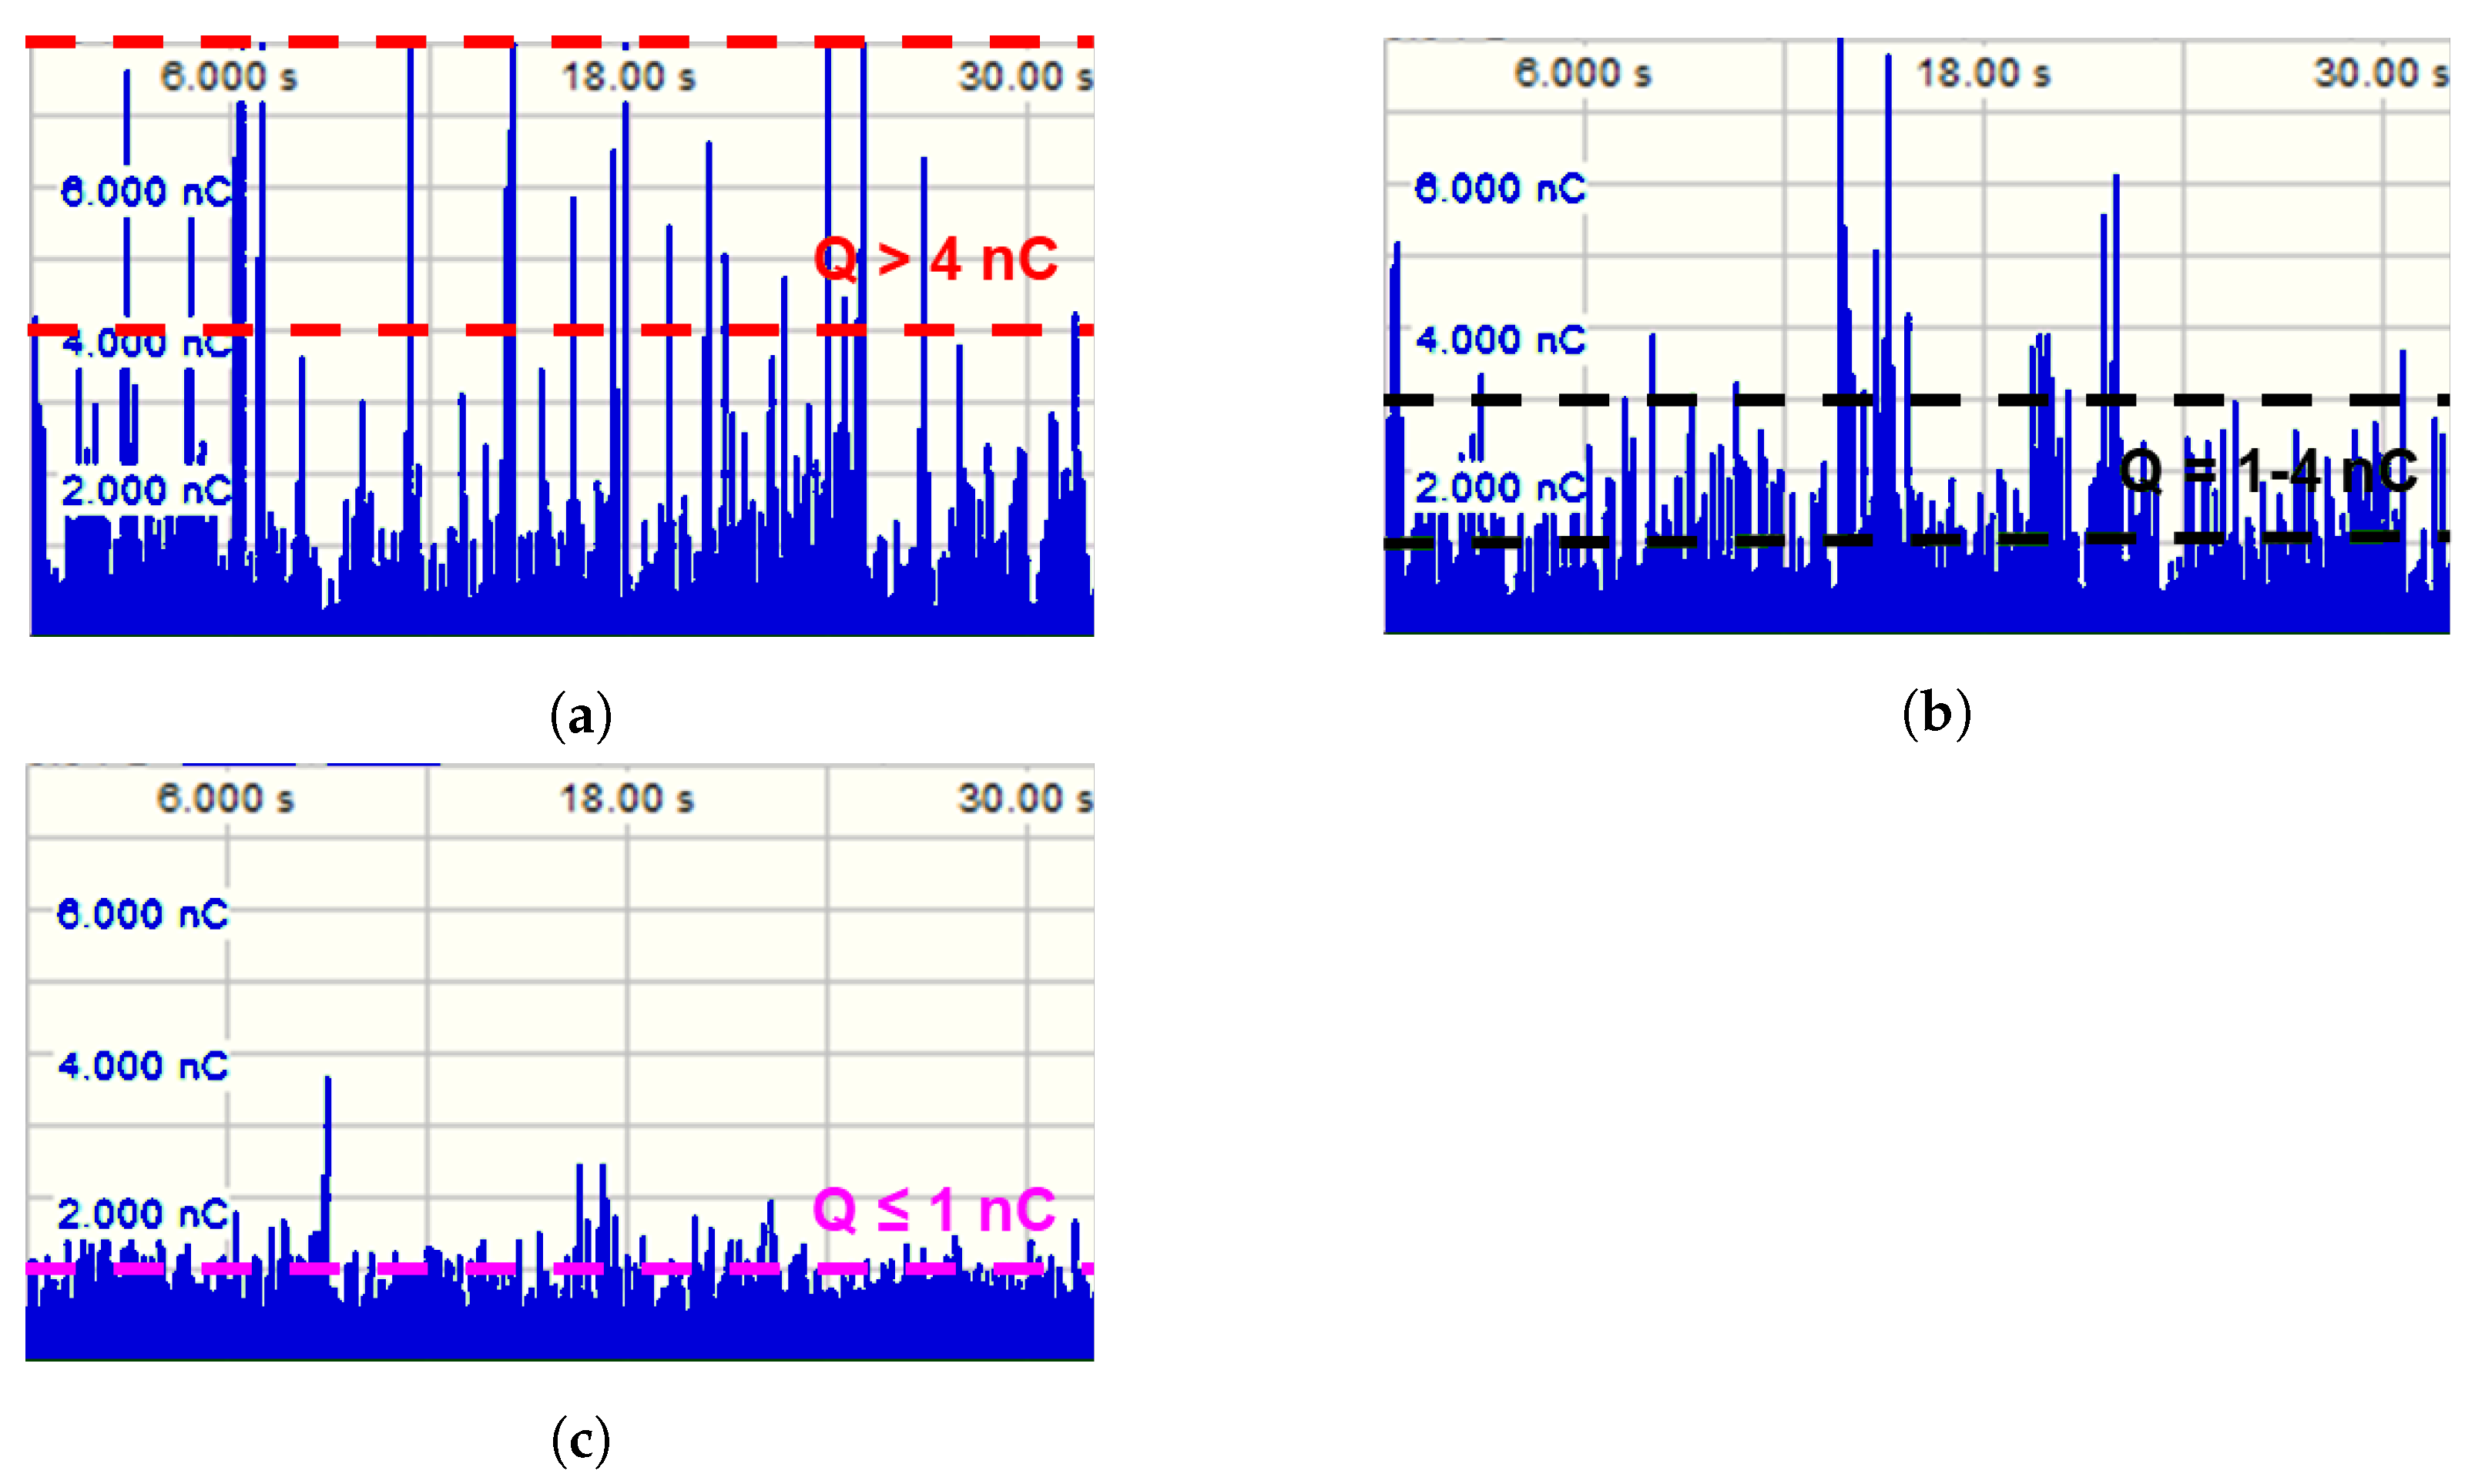
It was found that each type of discharge produces a distinct magnitude window on the charge vs. time diagrams, as shown in
Figure 3. Mobile discharges appear as the highest magnitude discharges, localized discharges fall in the 1 to
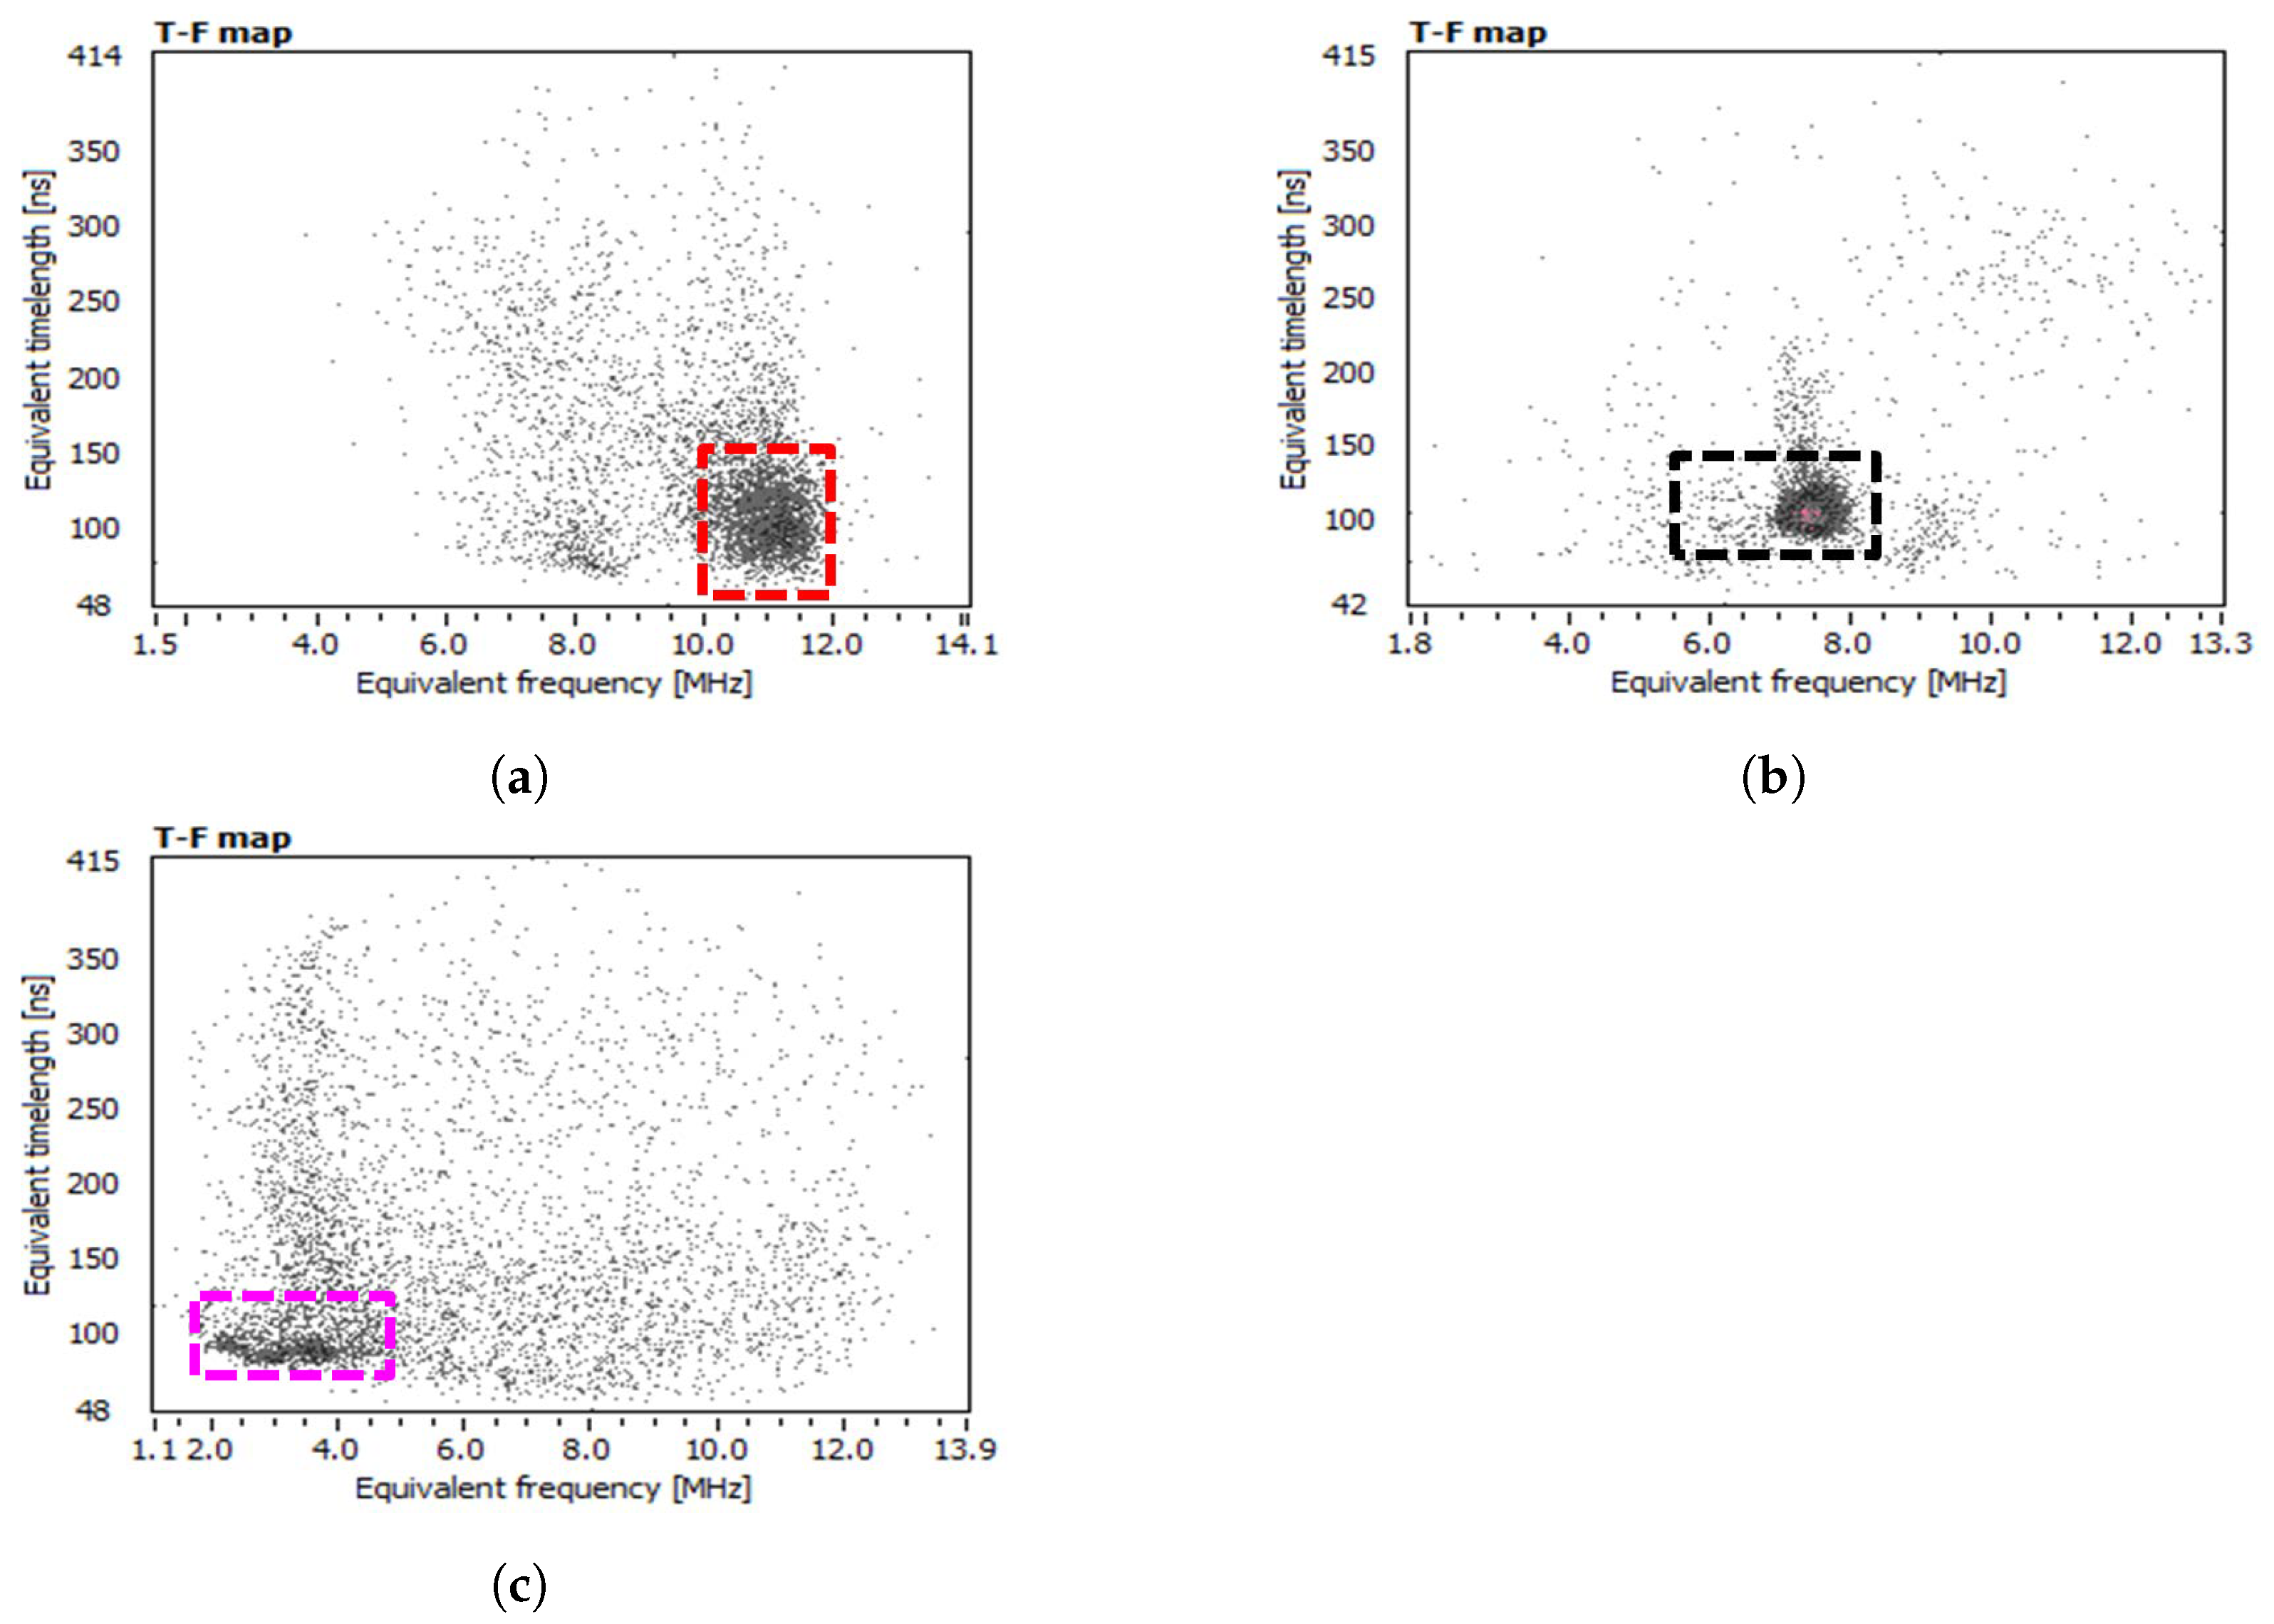
range, and high temperature discharges have the lowest magnitude. Each discharge type also forms a separable cluster on the TF maps, as shown in
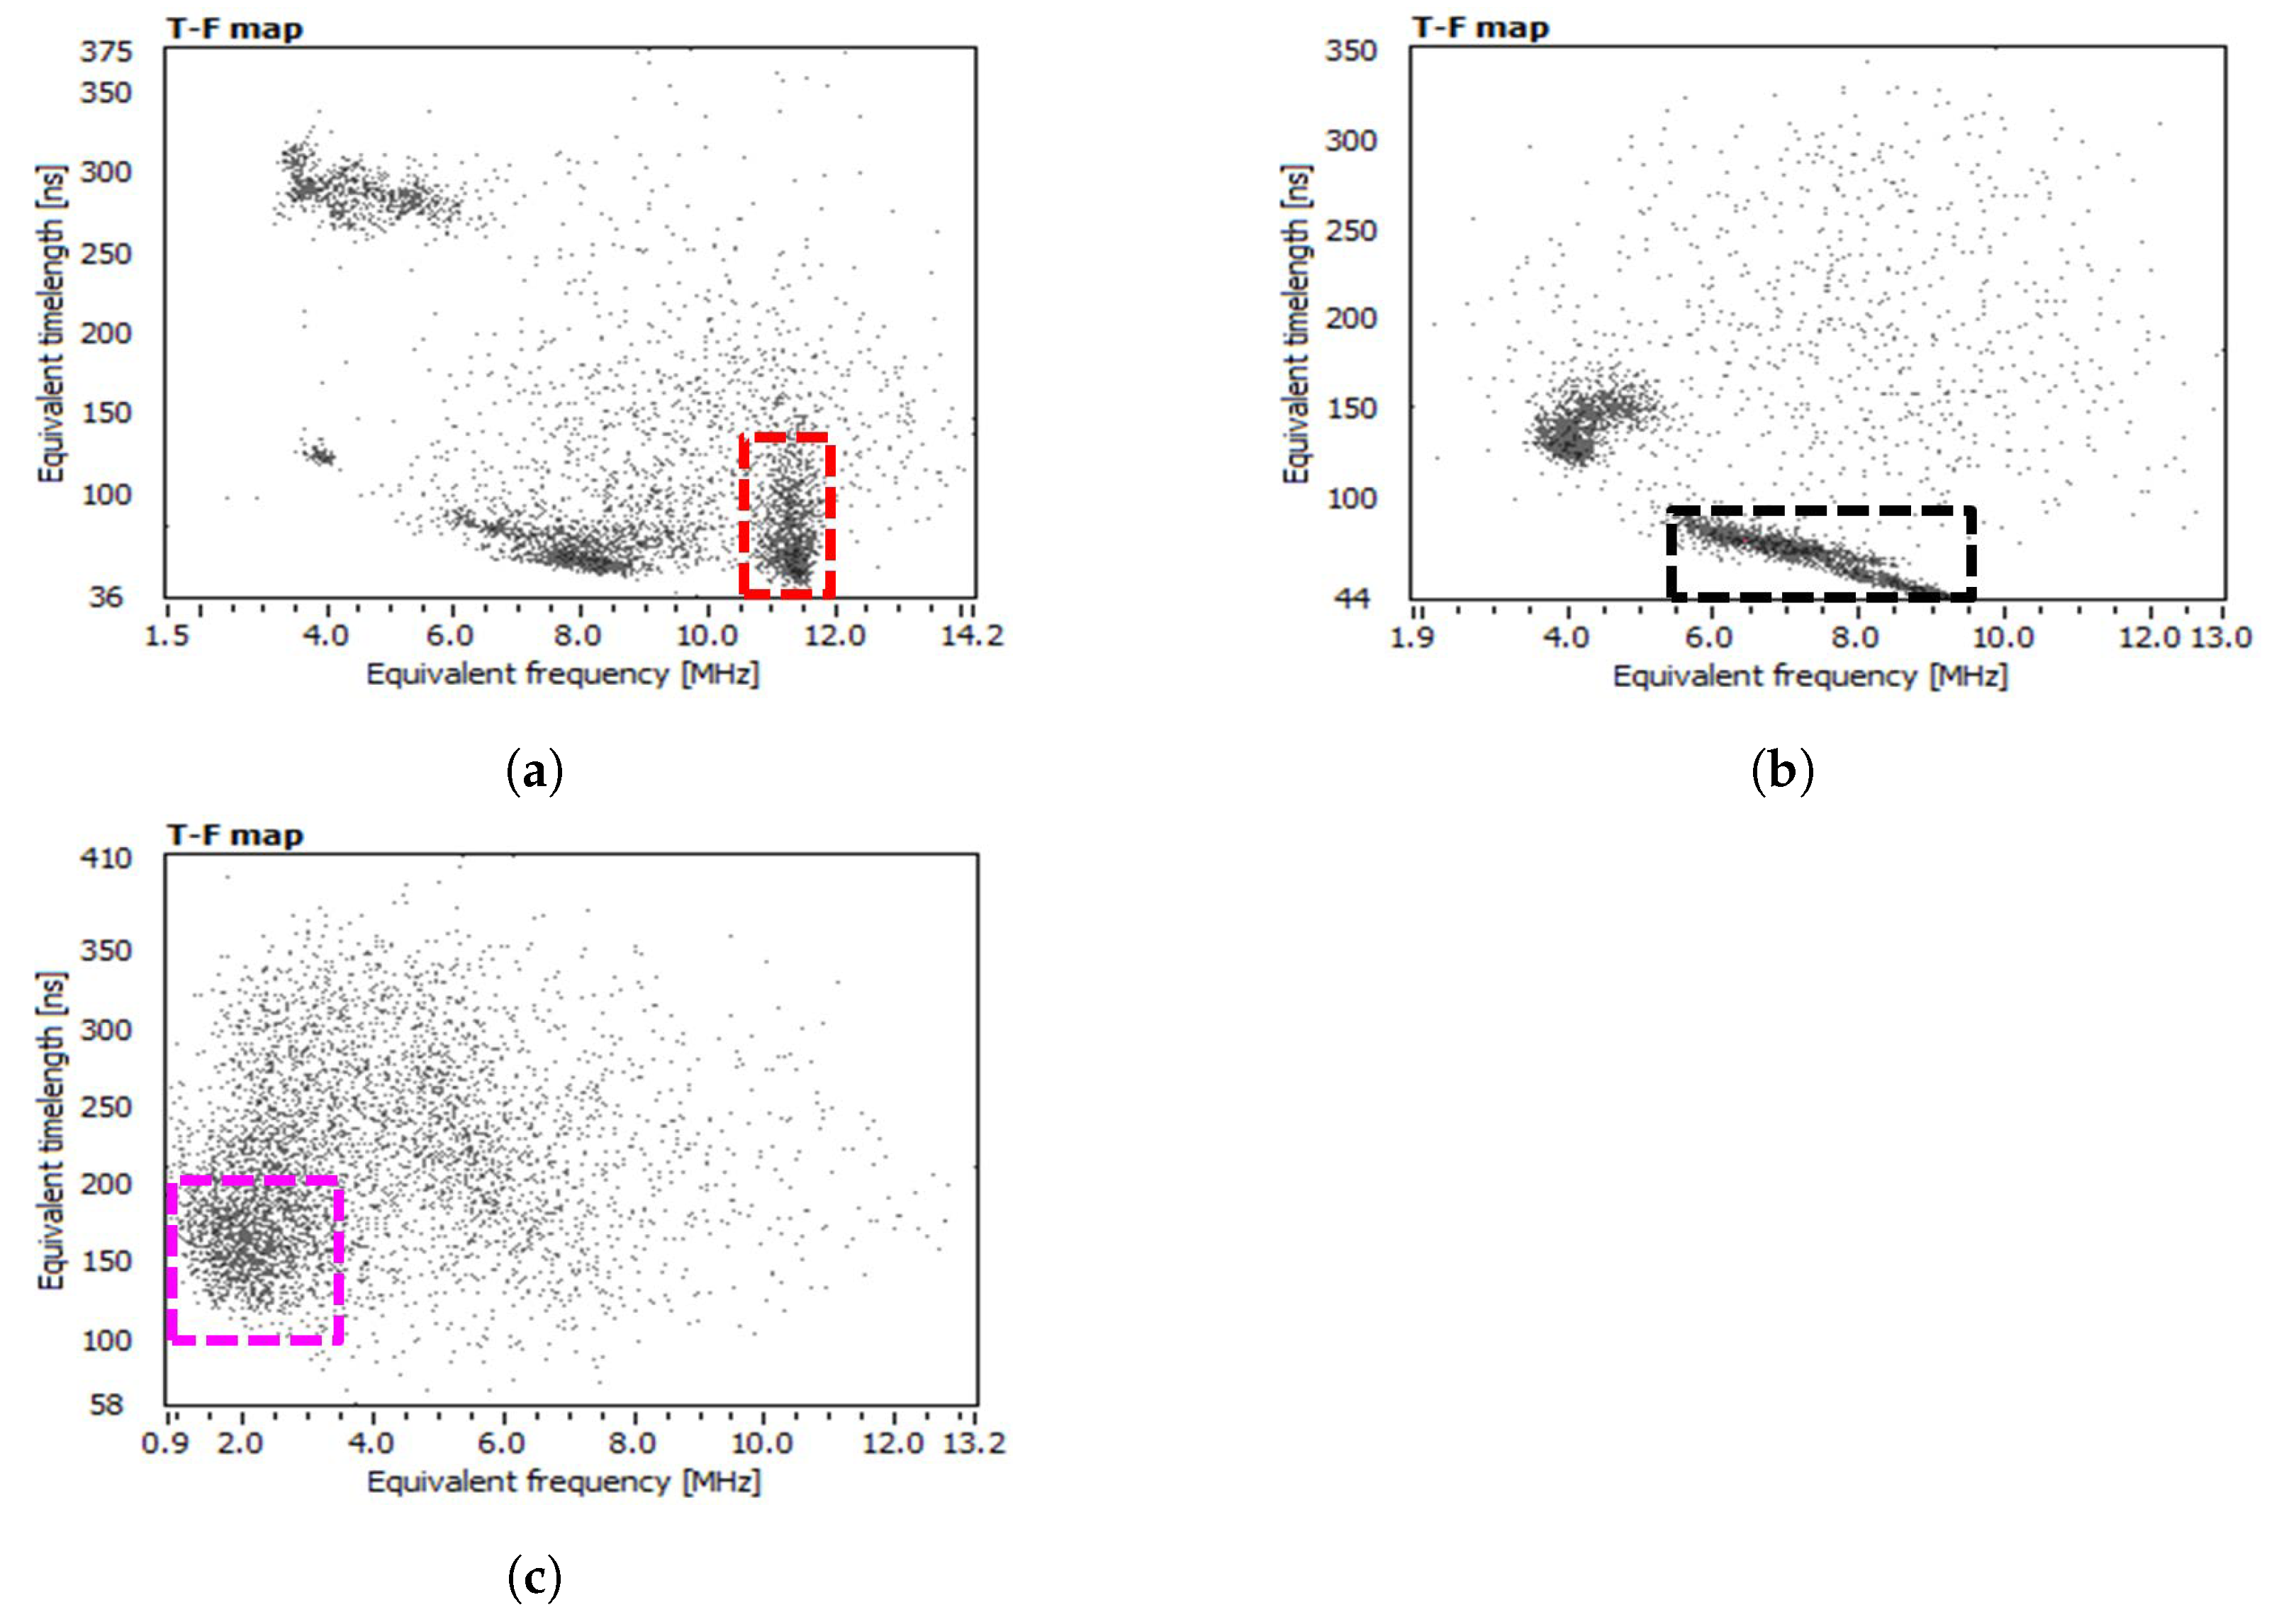
Figure 4. Similar to discharges in the AC tests, negative DC pulse clusters shift towards the lower equivalent bandwidth range as the material degradation becomes more severe.
4.2. Positive DC Discharge Characteristics
The results of magnitude window evaluation and TF map cluster separation for discharges observed in positive DC IPT are summarized in
Table 2. Similar to discharges in the negative polarity tests, each type produces a distinct magnitude window, as shown in
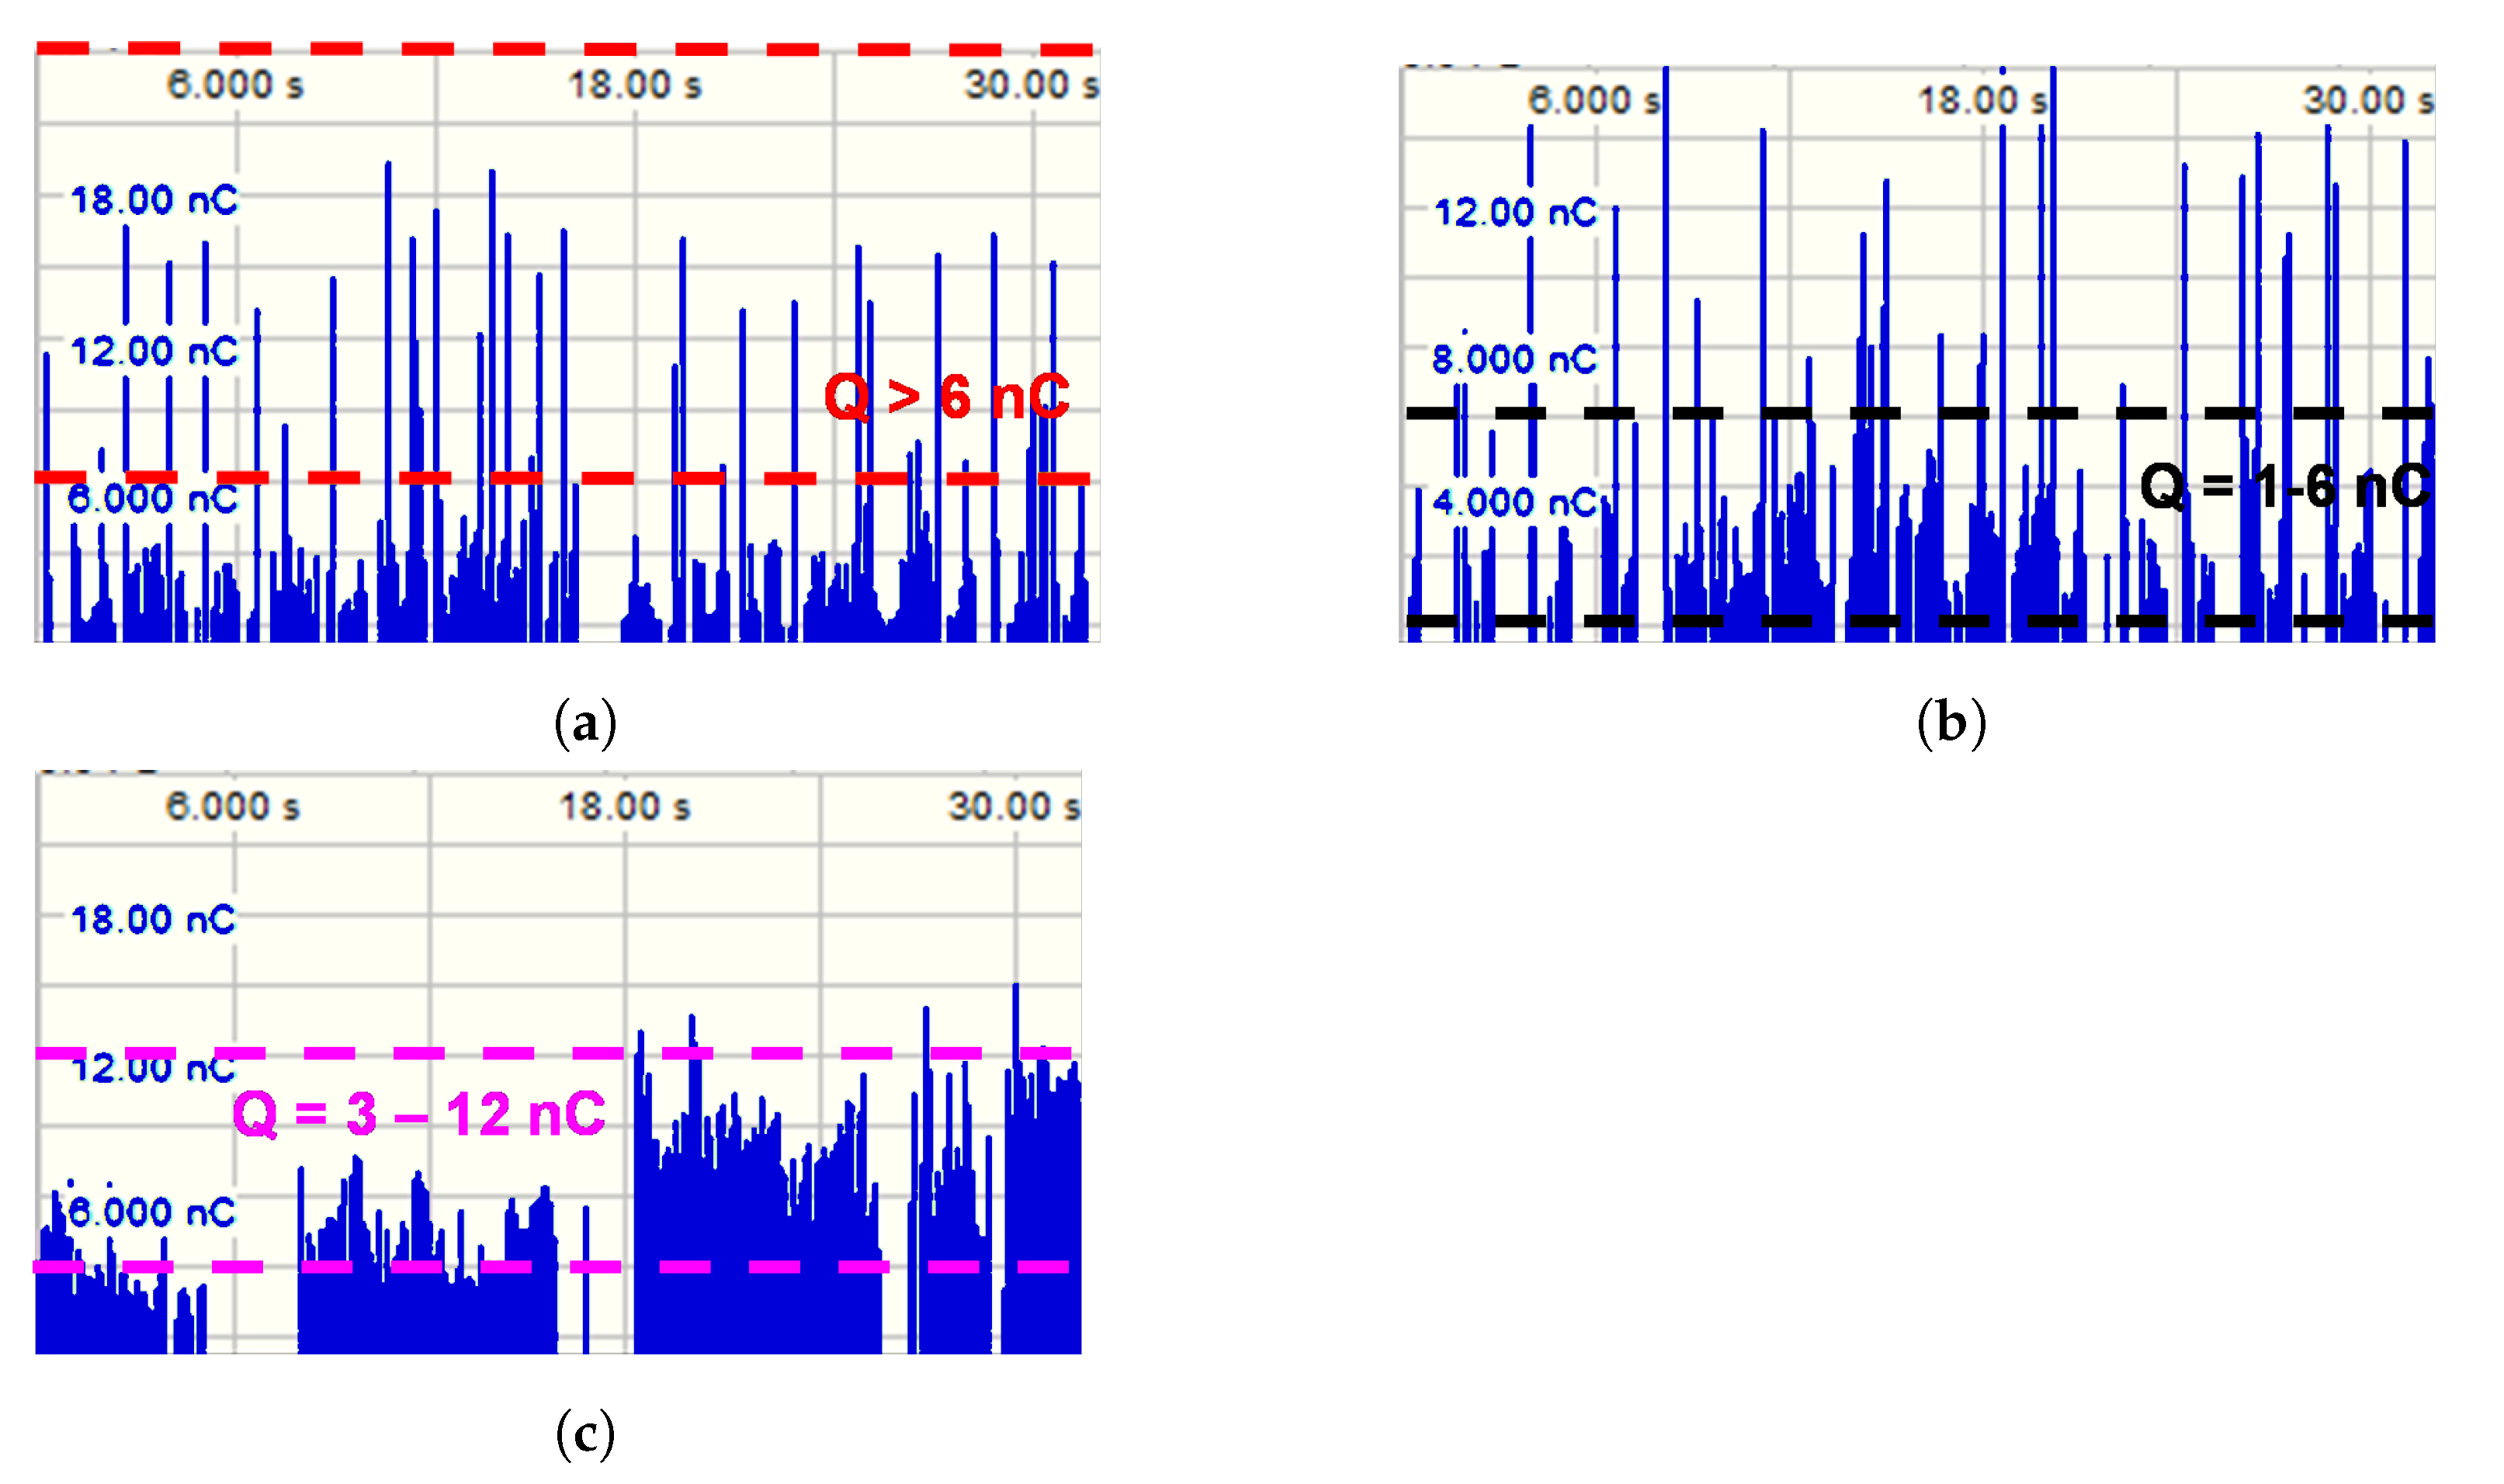
Figure 5. Mobile discharges appear as highest magnitude discharges. Localized discharges fall in the 1 to 6 nC range. However, there is an overlap in magnitudes between the localized and high temperature discharges, which makes it challenging to distinguish between the two types. The high temperature discharges tend to appear in longer intervals of discharge activity on the diagrams than the localized discharges. Each discharge type also forms a separable cluster on the TF maps, as shown in
Figure 6. Similar to AC and negative DC tests, positive DC pulse clusters shift towards the lower equivalent bandwidth range as severity of material damage increases. In positive DC tests, it was observed that the apparent charge magnitude varies with the applied test voltage level. Therefore, although ranges of magnitudes were established for the three types of discharges, these ranges apply at specific test voltages. However, the ratios of magnitudes between mobile, localized, and high temperature discharges remain the same. Pulse clustering on the TF maps was not affected by the test voltage level. Therefore, cluster separation is more useful for determining discharge characteristics in DC tests than charge magnitude windows.
4.3. PD Pulse Waveshapes
4.3.1. Mobile Discharge
The TF map analysis showed that the common characteristics of mobile discharge pulses at the three voltage types are high equivalent bandwidth
, and low equivalent timelength
, relative to localized and high temperature pulses. A comparison of the TF-map coordinates of mobile discharge pulses of the three voltage types is shown in
Table 3.
While the −DC and +DC mobile pulses have an overlap in both
and
coordinates, the AC mobile pulses have greater
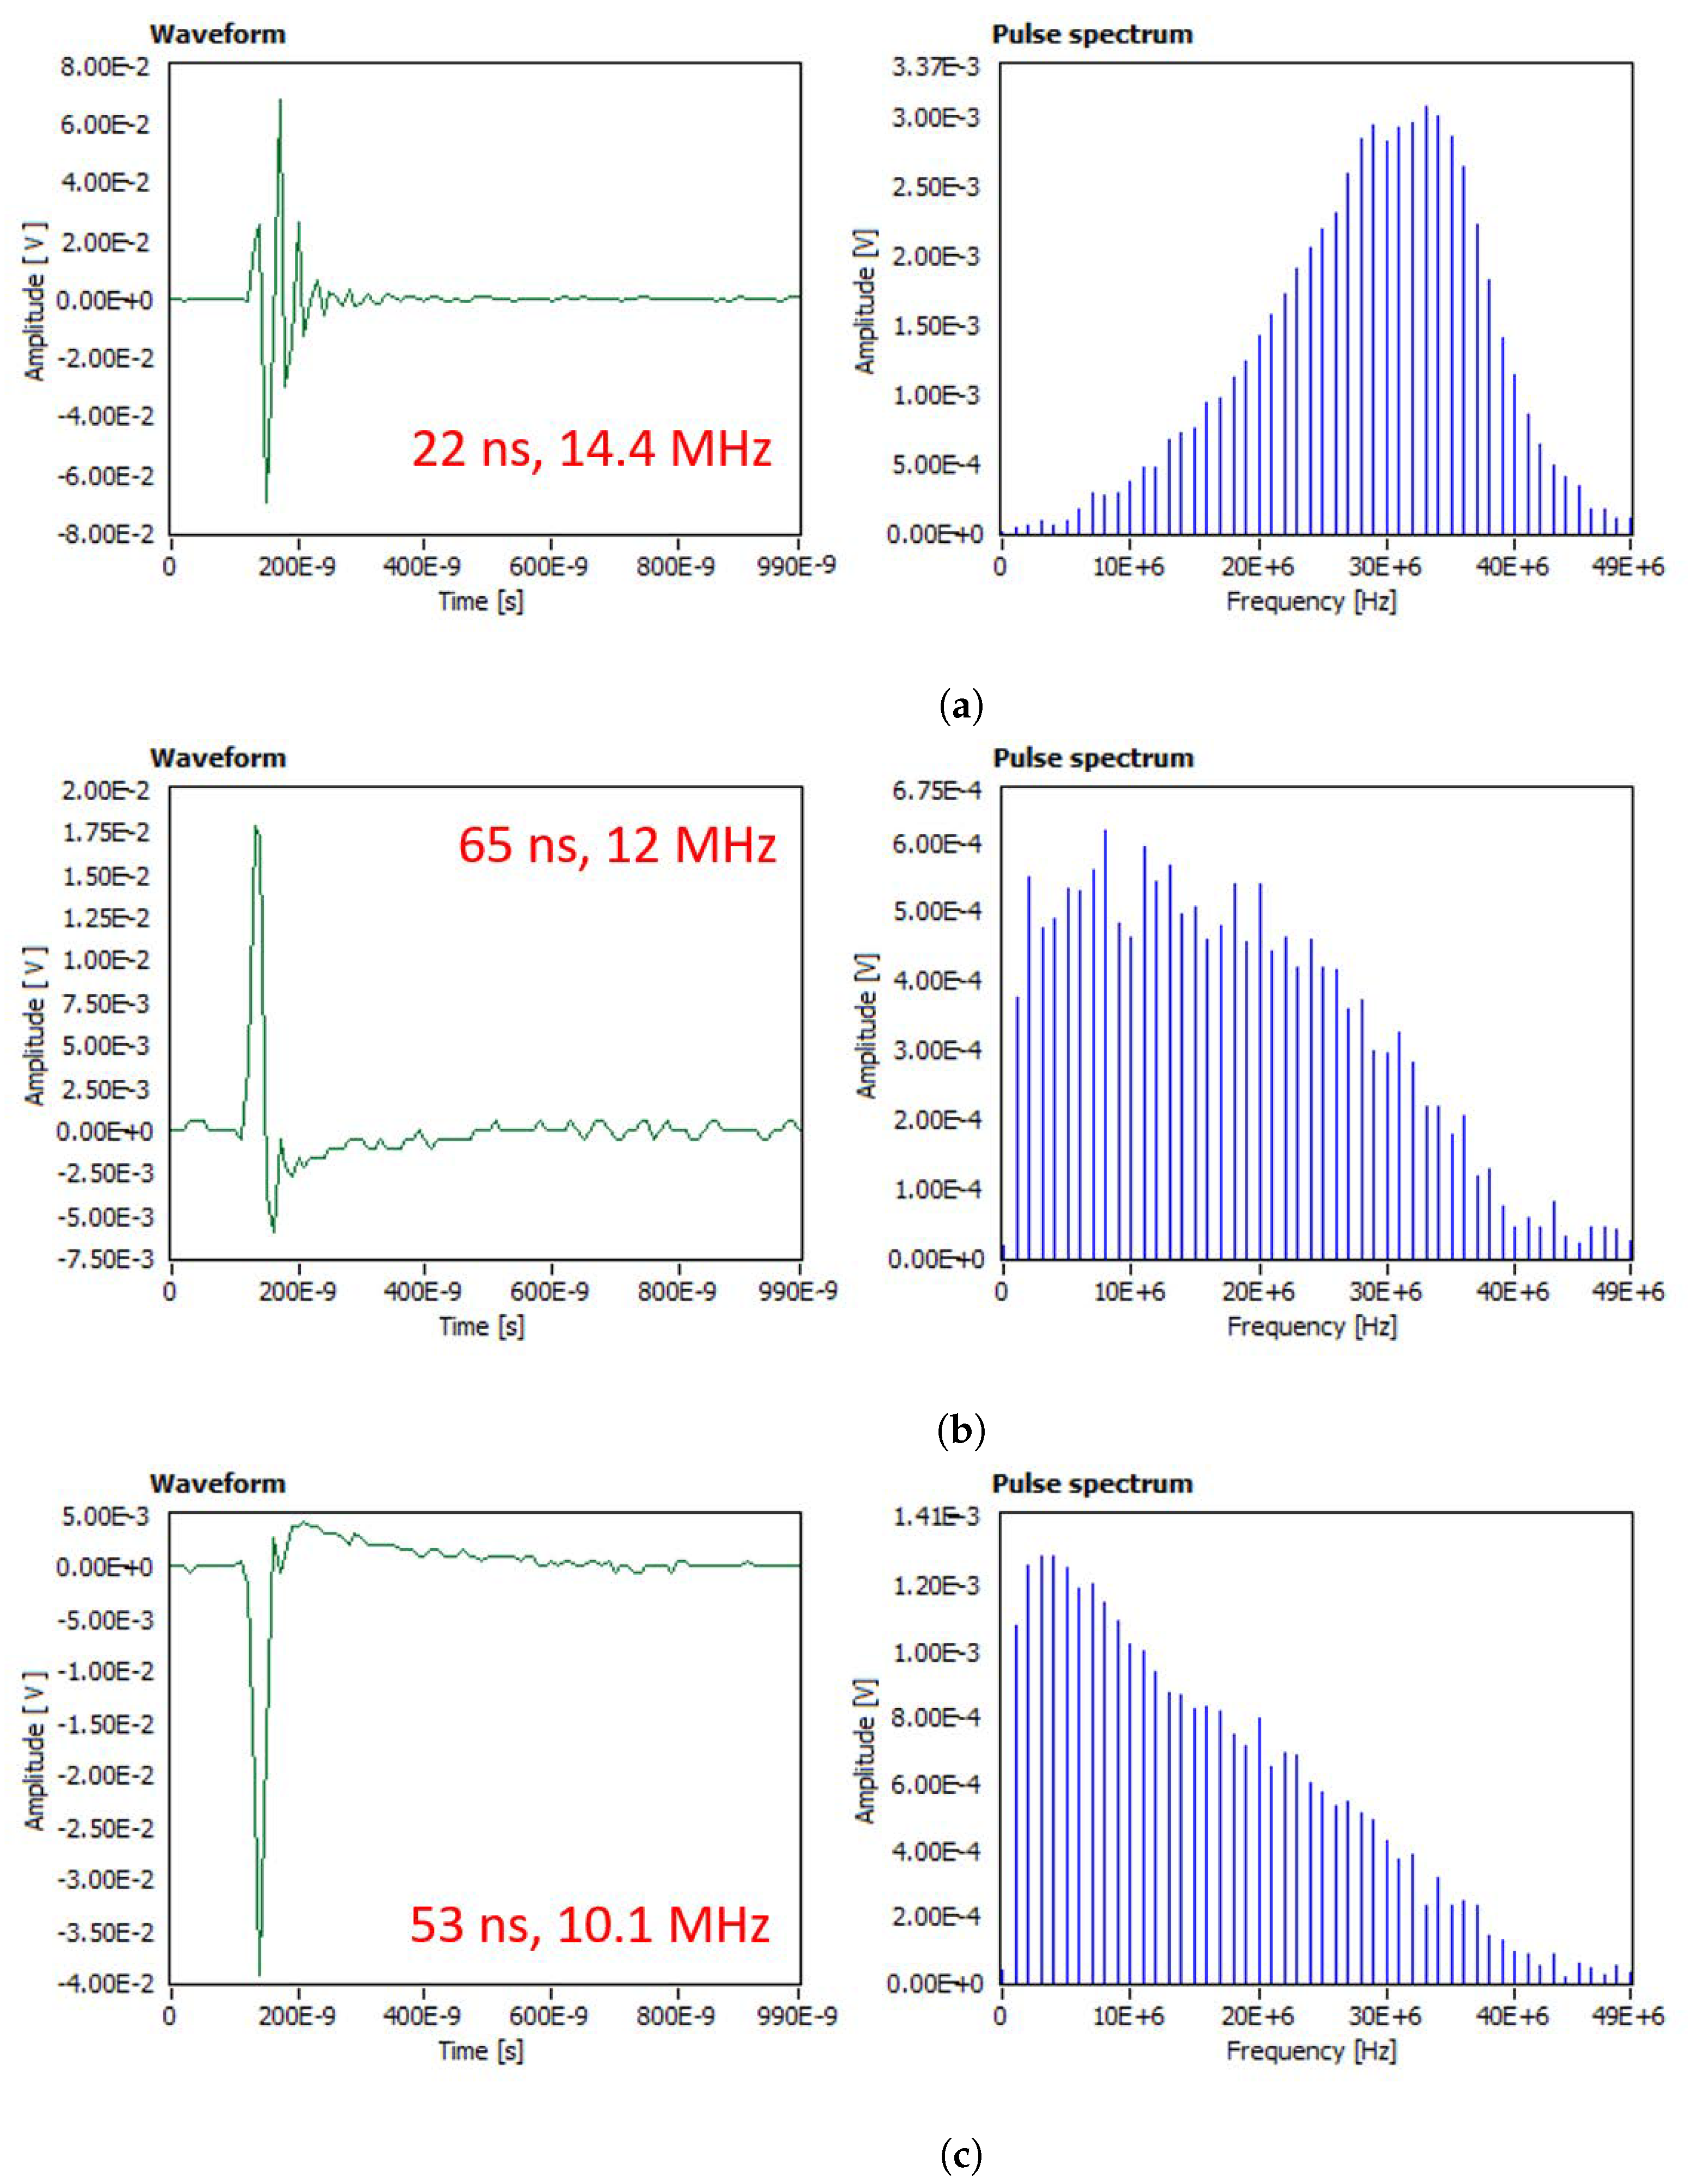
coordinates. The AC mobile pulses appear oscillatory, which results in an increased higher frequency content of the FFT. The oscillations may be caused by the AC experimental setup rather than being a characteristic of the pulse itself. Examples of mobile discharge pulses in the time and the frequency domains are shown in
Figure 7. Predominance of the higher frequency components (>25 MHz) in the AC mobile pulse spectrum can be observed compared to the DC mobile pulse spectra.
4.3.2. Localized Discharge
A comparison of the TF-map coordinates of localized discharge pulses at the three types of voltage stress is shown in
Table 4.
Localized discharge pulses are plotted in the mid-range of equivalent bandwidth, relative to
coordinates of mobile and high temperature discharges. The
coordinates of localized pulses at AC, negative and positive DC overlap between 6.5–9 MHz range. Examples of localized discharge pulses in the time and the frequency domains are shown in
Figure 8. In comparison to the frequency spectra of the mobile pulses, the localized discharge pulses show predominance of the lower frequency components, while components greater than 10 MHz gradually drop in magnitude. The localized pulses appear to be similar in waveshape and spectra at the three voltage types.
4.3.3. High Temperature Discharge
The high temperature discharge pulses at the three voltage types have low equivalent bandwidth coordinates, relative to the localized and the mobile discharges. A comparison of the TF-map coordinates at the three voltage types is shown in
Table 5.
The
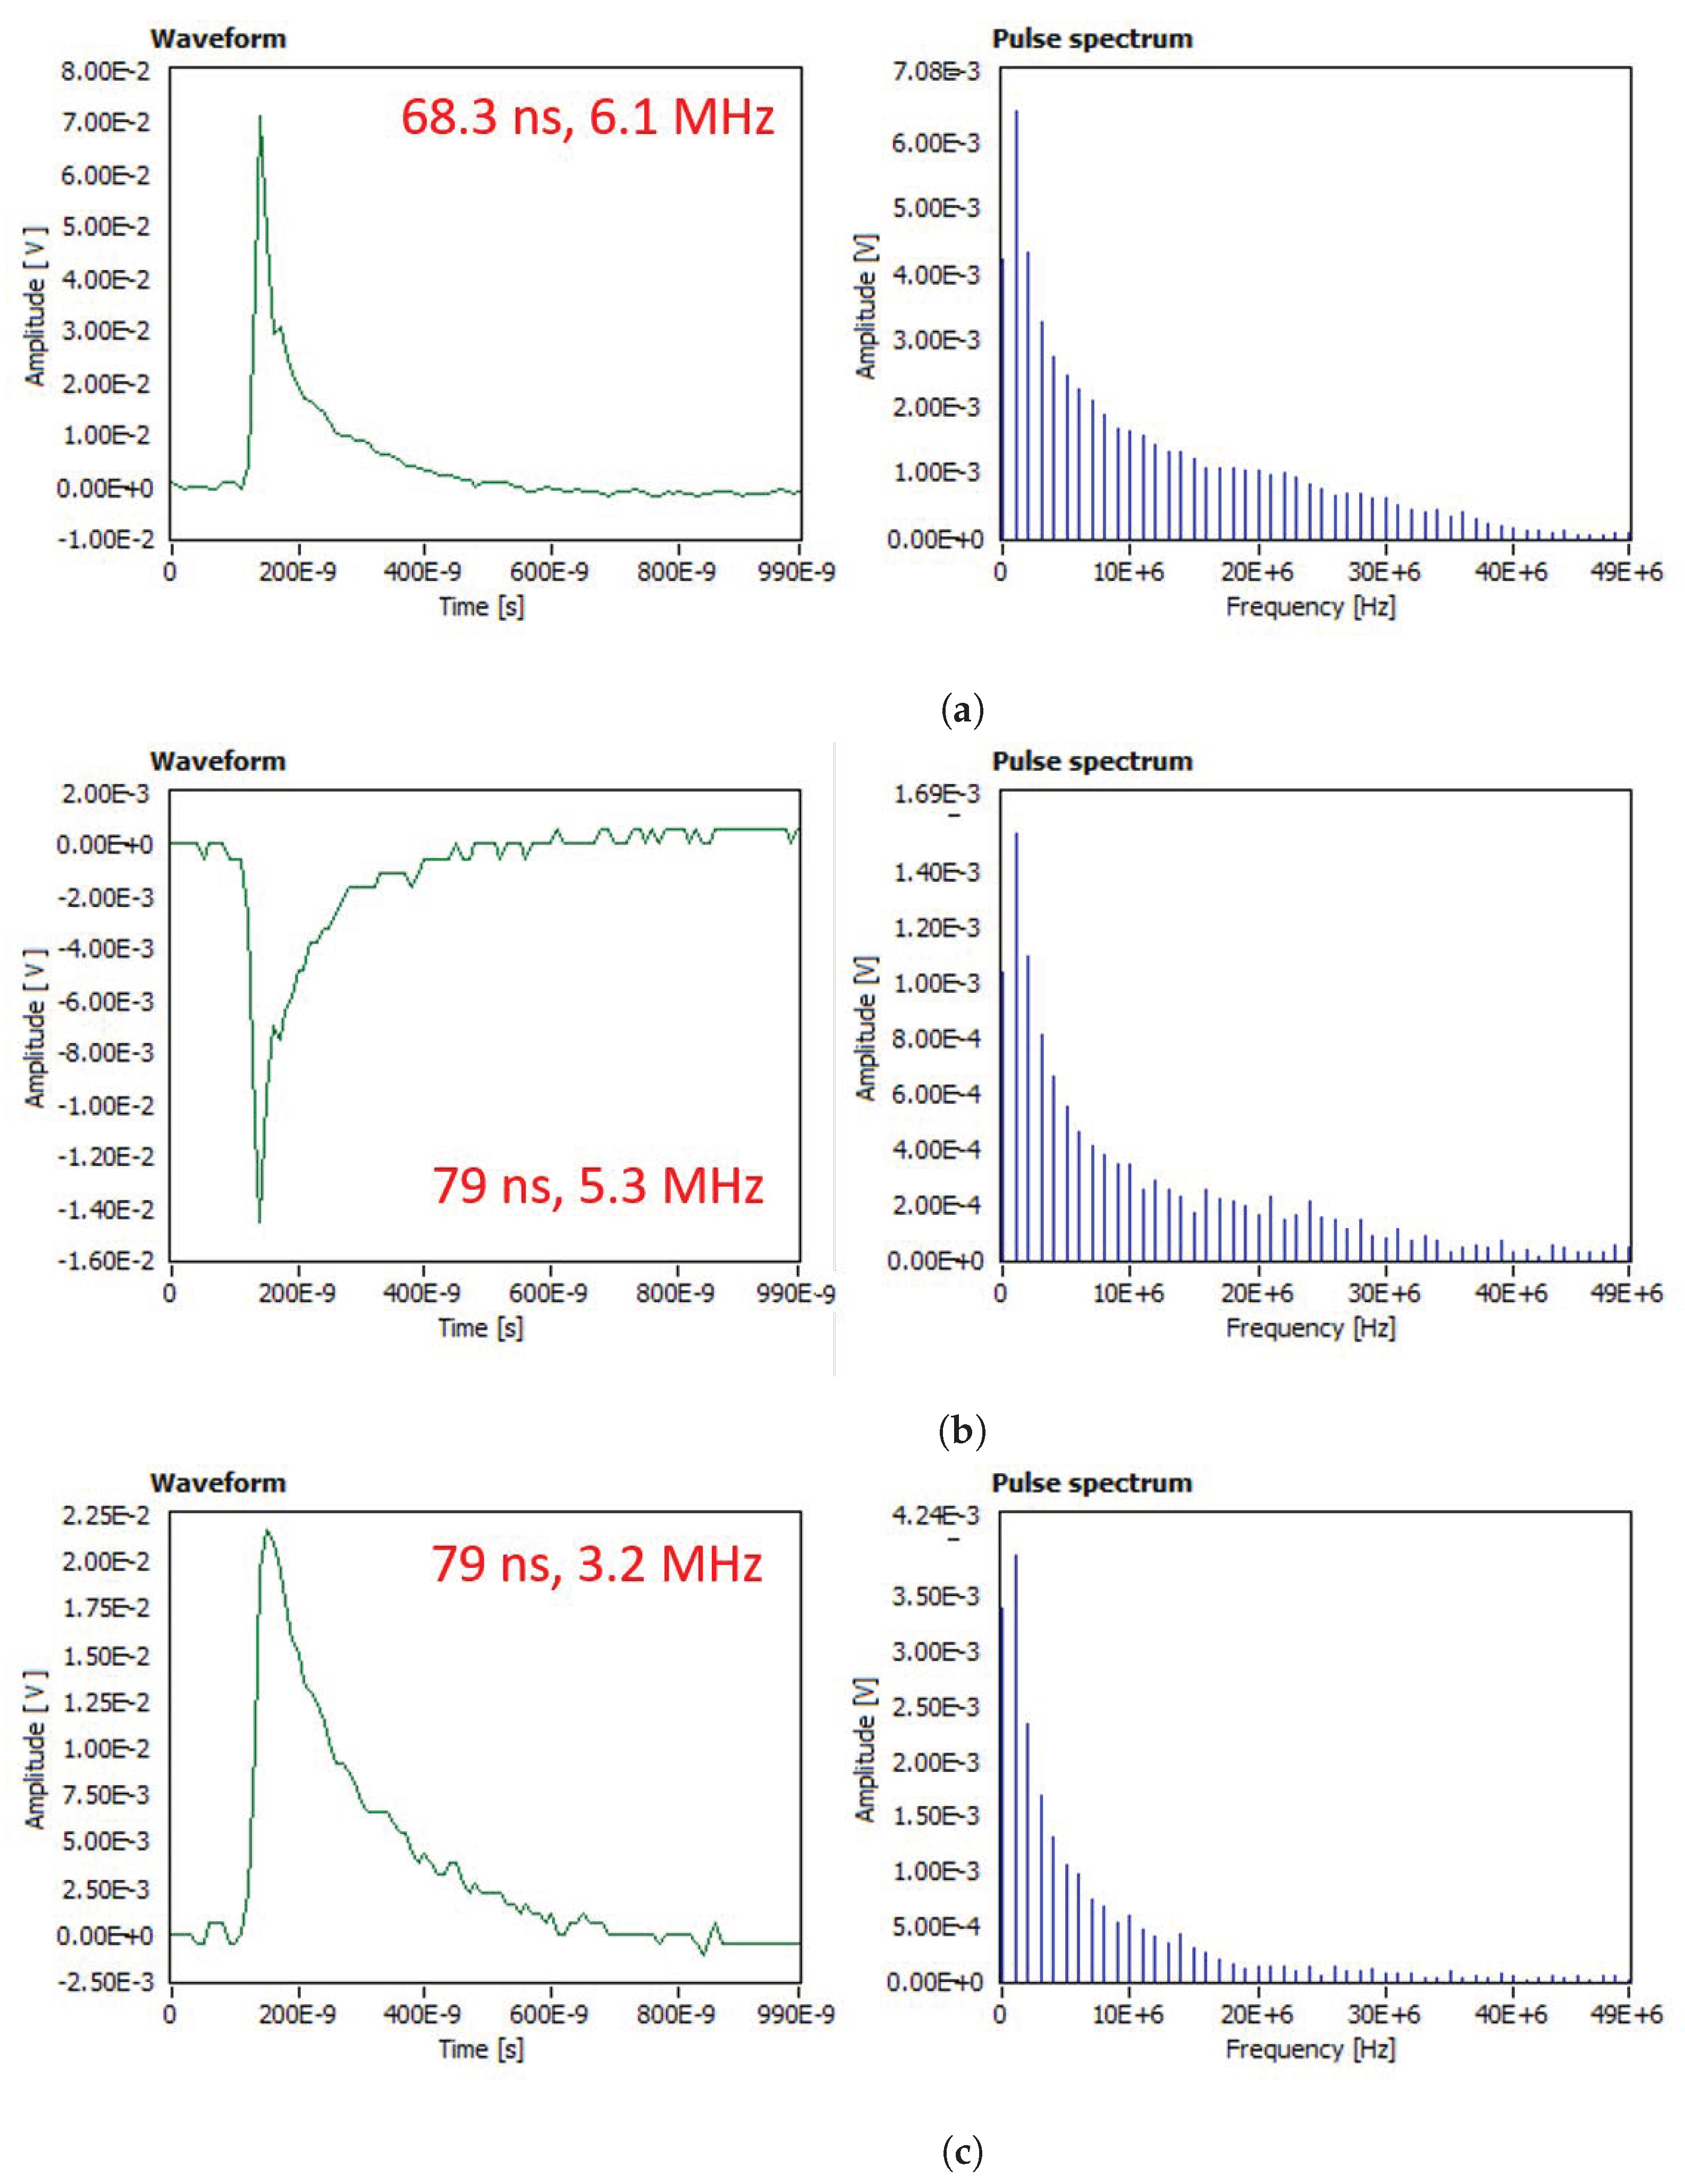
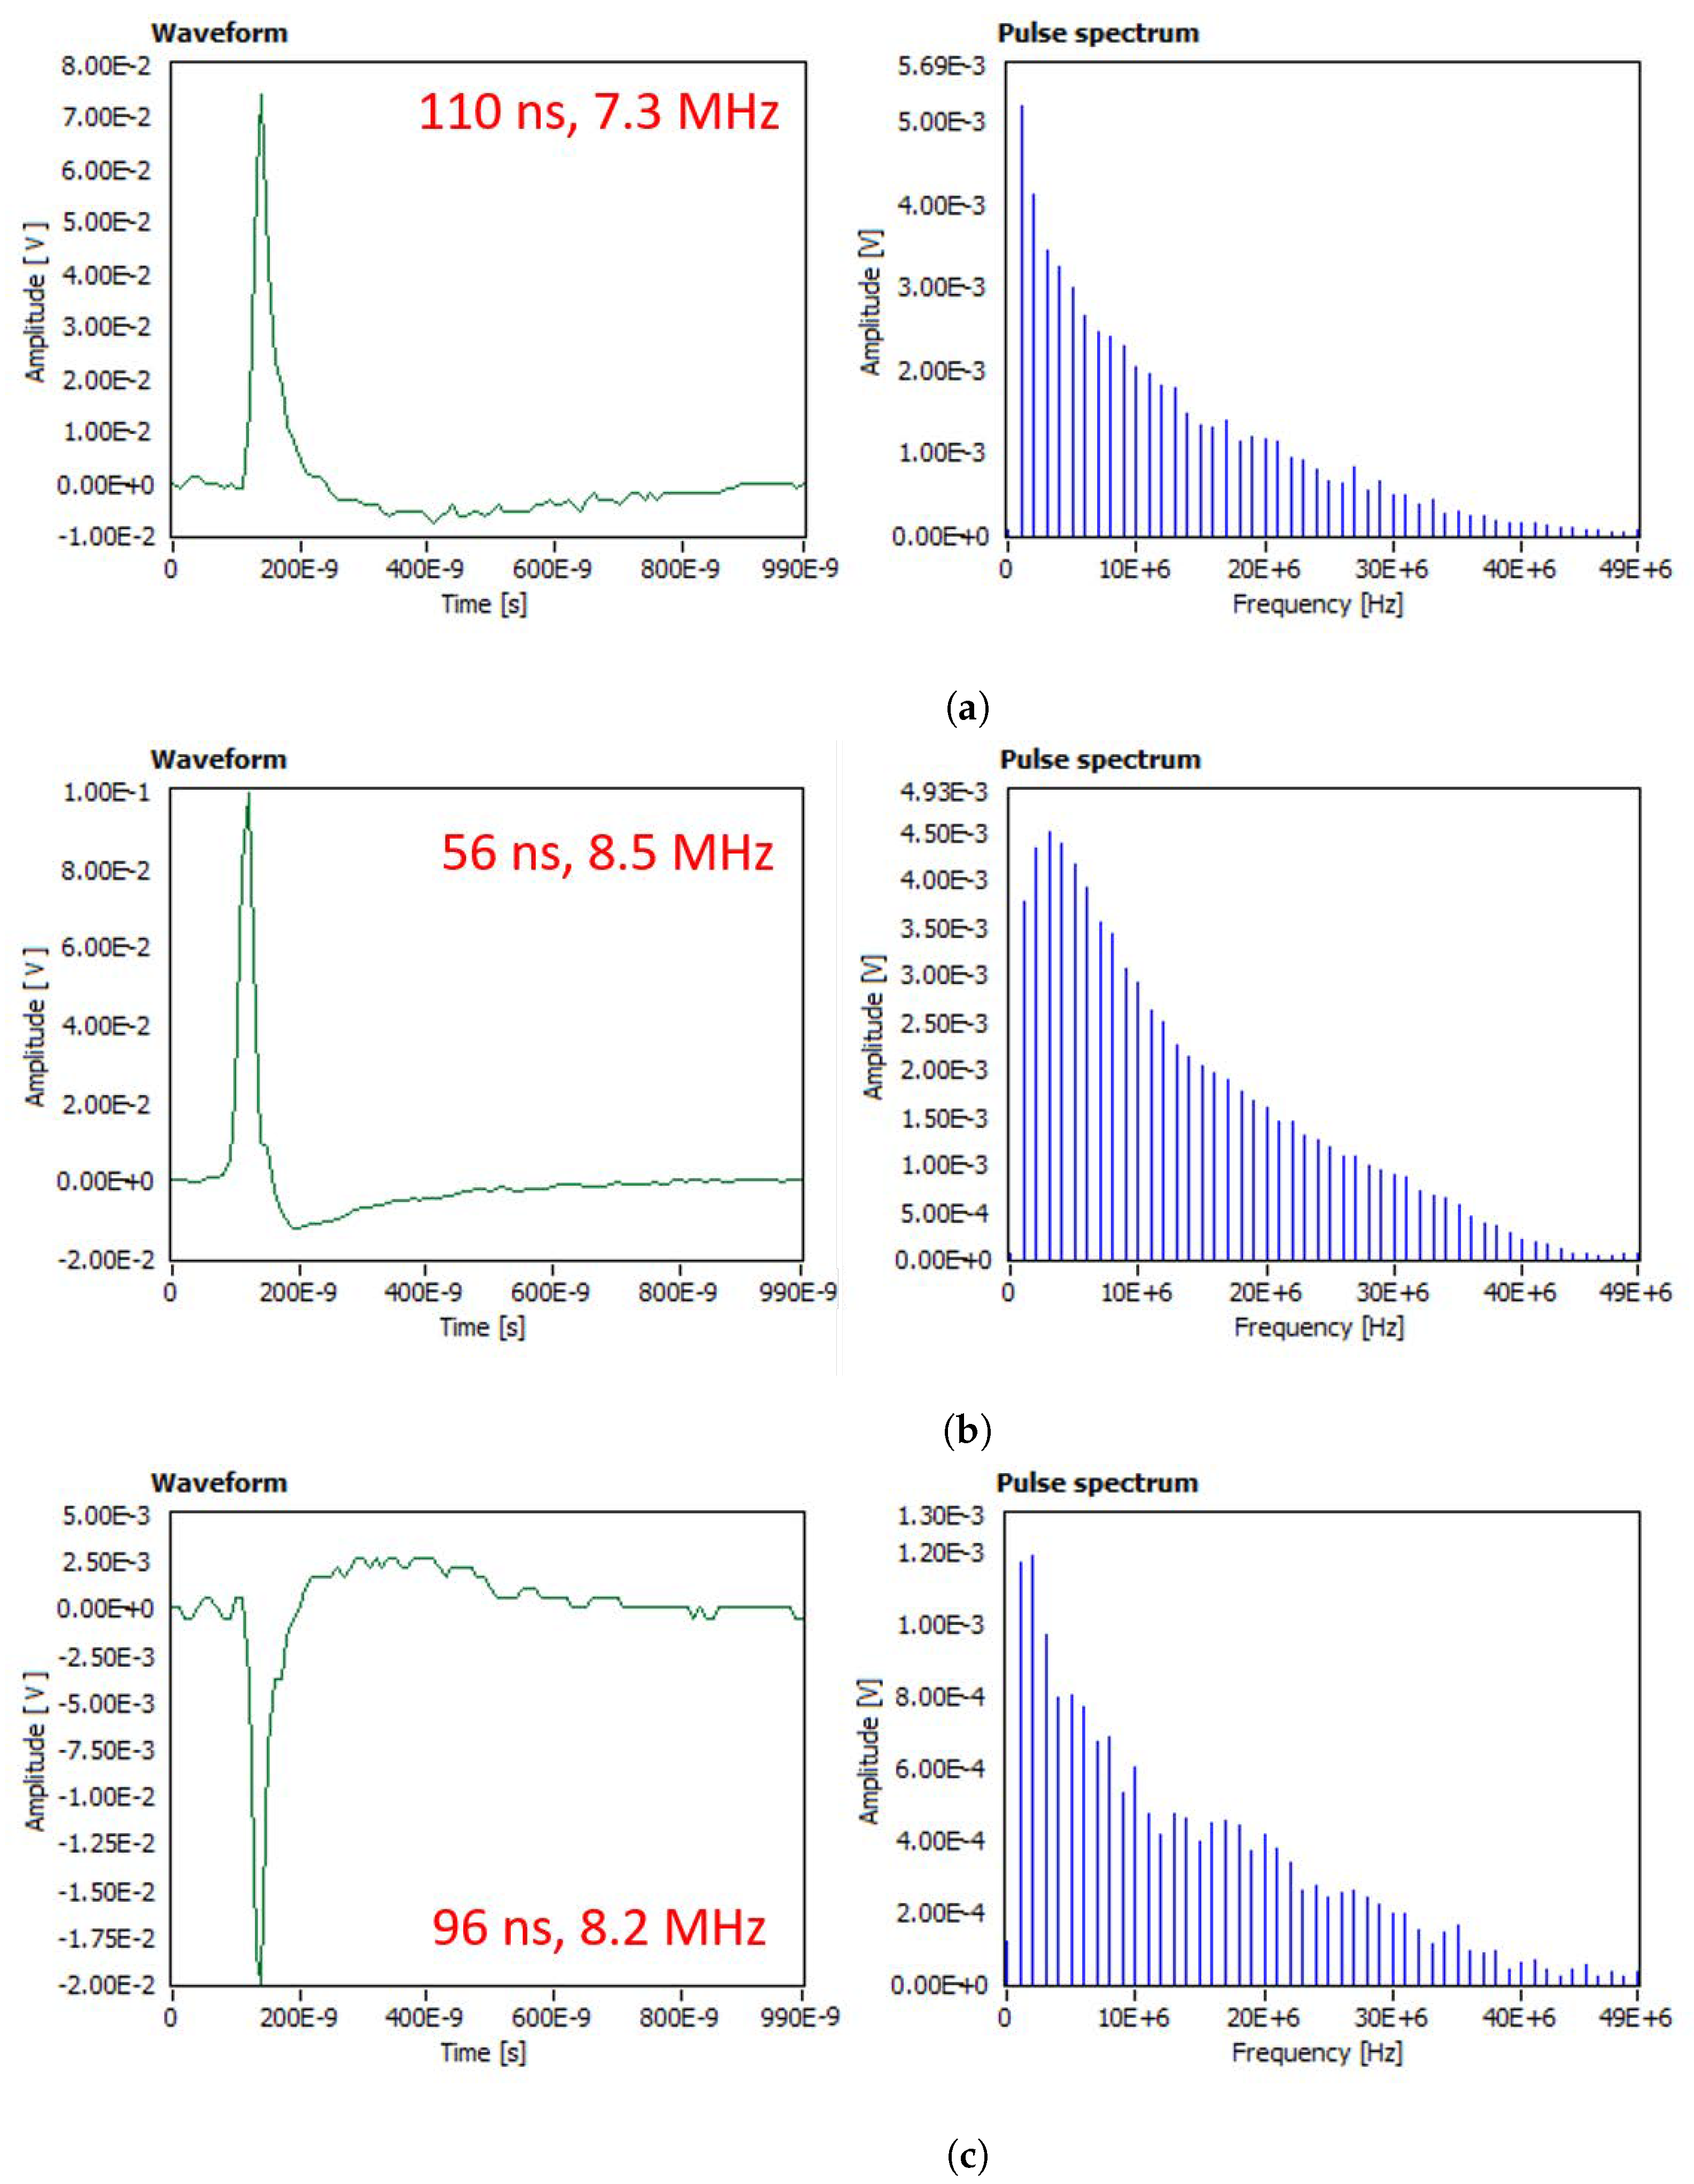
coordinates of the pulses obtained in DC tests extend higher than those in the AC tests. Examples of the high temperature discharge pulses in the time and the frequency domains are shown in
Figure 9. It was observed that the high temperature discharge pulses that are present at later stages of material erosion have a wider waveshape (higher
) than the pulses that are present at the onset of the erosion. The pulse spectra show a predominance of the low frequency components (DC to 2 MHz) characteristic of the high temperature pulses. The deep eroding discharges exhibit a dominant DC component (at 0 Hz), even in the AC tests.
4.4. Evaluation of Eroding Discharge Pulse Characteristics
The high temperature discharge pulses signal the onset of SR erosion in the IPT. The experimental results show that the positive DC test causes the most severe erosion of material. To investigate the differences between AC and DC erosion mechanisms, properties of eroding discharge pulses have been determined and compared for AC vs. DC voltage. Four pulse characteristics were selected for the evaluation:
Pulse amplitude in Volts;
Approximate pulse energy, calculated using the equation for energy of a discrete-time signal given by
where
and
are the start and end of the signal acquisition, and
consists of the data points from the sampled PD signal in Volts;
Width of the pulse in nanoseconds, calculated by subtracting the time of the first of the peak crossing on the rise from the time of the last of the peak crossing on the fall of the pulse waveform;
The fourth property is determined from the frequency spectrum of the pulse, defined as the ratio of DC to 1 MHz frequency components in the spectrum.
The mean pulse amplitude, mean energy, maximum pulse width, and maximum DC/1MHz component ratio were calculated from a set of high temperature pulses from AC, negative DC, and positive DC tests, representative of the entire range of equivalent bandwidths and timelengths (shown in
Table 5). Results of evaluation of eroding discharge pulse characteristics at the three types of voltage stress are summarized in
Table 6.
Although the mean amplitude and energy of the AC eroding discharges are greater than the DC discharges, less erosion severity was observed in the AC tests. Greatest pulse widths and predominance of the DC frequency component were identified for the DC eroding discharge pulses at both polarities. Based on the comparison of the sets of four evaluated pulse parameters, it can be concluded that a greater pulse width and the presence of more dominant DC component in the spectrum are attributable to PDs that cause a greater severity of silicone rubber erosion.
5. Conclusions
The research presented in this paper evaluated partial discharge characteristics of discharges in the IPT that lead to the erosion of silicone rubber under AC and DC stress. In the first part of the study, critical AC and DC test voltages and flow rates were determined. Specimens subjected to these critical test parameters failed due to erosion degradation or ignition. No classical tracking failures or leakage current exceeding 60 mA were reported for any of the specimens tested under the critical AC or DC voltages. In the positive DC experiments, at the equivalent test voltage level of and contaminant flow rate, the depth and length of SR erosion was greater than that of the AC test at kVrms and the negative DC test at . It is concluded that the positive DC test causes the most severe erosion of SR material.
This study showed that the stages of material degradation during the IPT are related to variations in the apparent charge magnitude and the location of pulse clusters on the TF maps. In both of the AC and DC tests, mobile discharges (least severe) appear as having highest apparent charge magnitudes. On the TF maps, the mobile discharge pulses at the three voltage types are characterized by high equivalent bandwidth and low equivalent timelength, relative to TF map coordinates of the localized and high temperature pulses. The frequency spectrum of the mobile discharges obtained in the AC tests exhibits predominance of the higher frequency components, over , compared to the DC mobile pulse spectra.
The localized discharges produce damage of moderate severity. In the DC tests, their apparent charge magnitude falls in the 1 to range in the negative polarity tests, and 1 to range in the positive tests. On the TF maps, the localized discharge pulses are in the mid-range of equivalent bandwidth, relative to coordinates of the mobile and high temperature discharges. The frequency spectrum of localized pulses shows predominance of the lower frequency components, while components greater than gradually drop in magnitude. The localized pulses appear similar in waveshape and spectrum at the three voltage types.
The high temperature arcing discharges produce the most severe damage, in the form of deep erosion, compared to the other two types of discharges. Apparent charge magnitudes in +DC tests were found to be 3 to 12 times greater than in −DC tests, despite the lower positive test voltage level. On TF maps, high temperature discharge pulses are characterized by lowest equivalent bandwidth coordinates. Pulses that are present at later stages of material erosion have a wider waveshape (higher ) than pulses that at the onset of erosion. Pulse spectra of the eroding discharges show a characteristic predominance of the low frequency components, 0–2 MHz.
The amplitude, energy, maximum pulse width, and frequency spectrum were evaluated and compared for the eroding discharge pulses at the three voltage types. The highest mean amplitude and energy were calculated for the AC eroding discharge pulses. However, the greatest pulse widths and predominance of the DC frequency component were identified for the DC eroding discharge pulses. It is concluded that the greater pulse width and the presence of dominant DC component in the pulse frequency spectrum are attributable to PDs that cause greater severity of SR erosion.
Partial discharge measurement during the IPT shows promising results for quantitative evaluation of severity of SR degradation. However, further investigations are needed. Additional processing of PD charge versus time data is suggested to establish statistical behavior of PD pulses with time. Calculation of cumulative pulse energy produced by the eroding discharges is also suggested to produce quantitative evaluation of material degradation. Experiments using other contaminant solutions and other polymer materials should be performed to study their effects on the PD characteristics.
Author Contributions
Conceptualization, V.P., N.D.J. and B.K.; methodology, V.P., N.D.J. and B.K.; software, V.P.; formal analysis, V.P., N.D.J. and B.K.; investigation, V.P., N.D.J. and B.K.; resources, V.P., N.D.J. and B.K.; data curation, V.P. and N.D.J.; writing—original draft preparation, V.P.; writing—review and editing, V.P., N.D.J. and B.K.; visualization, V.P.; supervision, N.D.J. and B.K.; project administration, N.D.J. and B.K.; funding acquisition, V.P., N.D.J. and B.K. All authors have read and agreed to the published version of the manuscript.
Funding
The authors would like to thank Manitoba Hydro for providing the facilities and instruments. Financial support from Natural Sciences and Engineering Research Council of Canada (NSERC) is acknowledged.
Institutional Review Board Statement
Not applicable.
Informed Consent Statement
Not applicable.
Data Availability Statement
Data available on request.
Conflicts of Interest
The authors declare no conflict of interest.
Appendix A
The test parameters and the results of evaluation of material damage are summarized in
Table A1.
Table A1.
Results of evaluation of test parameters and comparison of material damage at AC, −DC, and +DC voltages; green cells lie within the lower range of erosion damage, white cells are within the middle range, and red cells are within the higher range.
Table A1.
Results of evaluation of test parameters and comparison of material damage at AC, −DC, and +DC voltages; green cells lie within the lower range of erosion damage, white cells are within the middle range, and red cells are within the higher range.
| Sample # | Test Voltage (kV) | Flow Rate (mL/min) | Time on Test | Erosion Depth (mm) | Erosion Length (cm) | Track Length (cm) | Comment |
|---|
| AC 1 | 3.5 | 0.3 | 5 h | 0.43 | 0 | 1.9 | Trial sample |
| AC 2 | 3.5 | 0.3 | 3.5 h | 3.95 | 2.4 | 0.3 | Old contaminant was used |
| AC 3 | 3.5 | 0.3 | 6 h | 0.5 | 0 | 2.2 | - |
| AC 4 | 3.5 | 0.3 | 6 h | 0.3 | 0 | 2.4 | - |
| AC 5 | 3.5 | 0.3 | 6 h | 0.4 | 0 | 2.5 | - |
| AC 6 | 4.5 | 0.6 | 6 h | 0.32 | 0 | 2.0 | - |
| AC 7 | 4.5 | 0.6 | 6 h | 0.32 | 0 | 0.8 | - |
| AC 8 | 4.0–4.75 | 0.6 | 3.5 h | 3.82 | 2.8 | 0 | Voltage varied for first 12 min then proceeded at 4.0 kV |
| AC 9 | 4.0 | 0.6 | 2.5 h | 3.98 | 2.7 | 0 | - |
| AC 10 | 3.0, 4.0 | 0.3, 0.6 | 2 h, 3 h | 4.68 | 2.5 | 0 | Arcing energy too low at 3.0 kV |
| AC 11 | 4.5, 4.0 | 0.6 | 20 min, 2.5 h | 0.65 | 0.9 | 1.1 | Test stopped prematurely |
| −DC 12 | −3.0 | 0.6 | 1 h 40 min | 5.57 | 3.8 | 0 | - |
| −DC 13 | −3.0 | 0.6 | 1 h 39 min | 3.91 | 3.5 | 0 | - |
| −DC 14 | −3.4 | 0.3 | 6 h | 0.88 | 0 | 3.2 | - |
| −DC 15 | −3.4 | 0.6 | 1 h 3 min | 4.09 | 2.4 | 0 | ignition/intense arc |
| −DC 16 | −3.4 | 0.6 | 1 h 40 min | 3.95 | 2.1 | 0 | ignition/intense arc |
| −DC 17 | −3.4 | 0.6 | 3 h 23 min | 3.35 | 2.0 | 1.6 | - |
| −DC 18 | −3.4, −3.2 | 0.6 | 2 h 44 min | 3.26 | 2.3 | 0.3 | - |
| −DC 19 | −3.2 | 0.6 | 2 h 20 min | 4.5 | 3.1 | 0 | - |
| −DC 20 | −3.0, −3.2 | 0.6 | 2 h 50 min | 4.34 | 3.2 | 0 | - |
| −DC 21 | −3.4 | 0.6 | 2 h 5 min | 5.38 | 3.5 | 0 | - |
| +DC 22 | 2.7, 2.9 | 0.6 | 2 h 50 min | 2.5 | 1.4 | 0 | Test stopped prematurely |
| +DC 23 | 2.9 | 0.6 | 3 h 43 min | 5.18 | 2.0 | 0 | ignition/intense arc |
| +DC 24 | 4.0 | 0.6 | 2 h 42 min | 4.81 | 3.5 | 0 | - |
| +DC 25 | 4.0 | 0.6 | 2 h | 4.93 | 2.5 | 0 | - |
| +DC 26 | 2.7 | 0.3 | 2 h 50 min | 4.68 | 3.0 | 0 | - |
| +DC 27 | 2.7 | 0.3 | 1 h 39 min | 6 | 2.6 | 0 | - |
| +DC 28 | 2.7 | 0.3 | 1 h 40 min | 5.66 | 4.0 | 0 | - |
| +DC 29 | 2.7 | 0.3 | 1 h 40 min | 5.11 | 2.9 | 0 | - |
The color scales in columns 5 and 6 facilitate visual comparison between values. The green cells lie on the lower end of the range, the white cells are in the middle range and the red cells are at the high end. The erosion depth for the samples tested at an AC voltage of kVrms, and kVrms and is least severe. For the samples that were subjected to an AC voltage of kVrms and , the erosion depth was of moderate severity.
The erosion depth for negative DC samples is in the moderate to high severity range, with the exception of sample #14 for which the contaminant rate was too low to initiate stable discharges. The erosion severity for samples tested at and and was greater in terms of depth and length combined, than for samples tested at and . The erosion patterns at more closely resemble erosion patterns at kVrms.
The erosion depth for positive DC samples is the most severe. On sample #27, the erosion progressed through the entire thickness of material in just 1 h and 39 min on test. The positive DC stress produced the most severe test conditions as can be seen from red and white cells in
Table A1.
To minimize damage to the camera, the test was stopped on samples #15, #16, and #23 when the arc appeared too intense causing momentarily ignitions of the sample. Out of the 11 samples tested with AC voltage, samples #1, #2 and #11 were excluded from the assessment of test severity, and from the 8 samples tested with positive DC, sample #22 was excluded, because the test was interrupted before reaching the failure criteria.
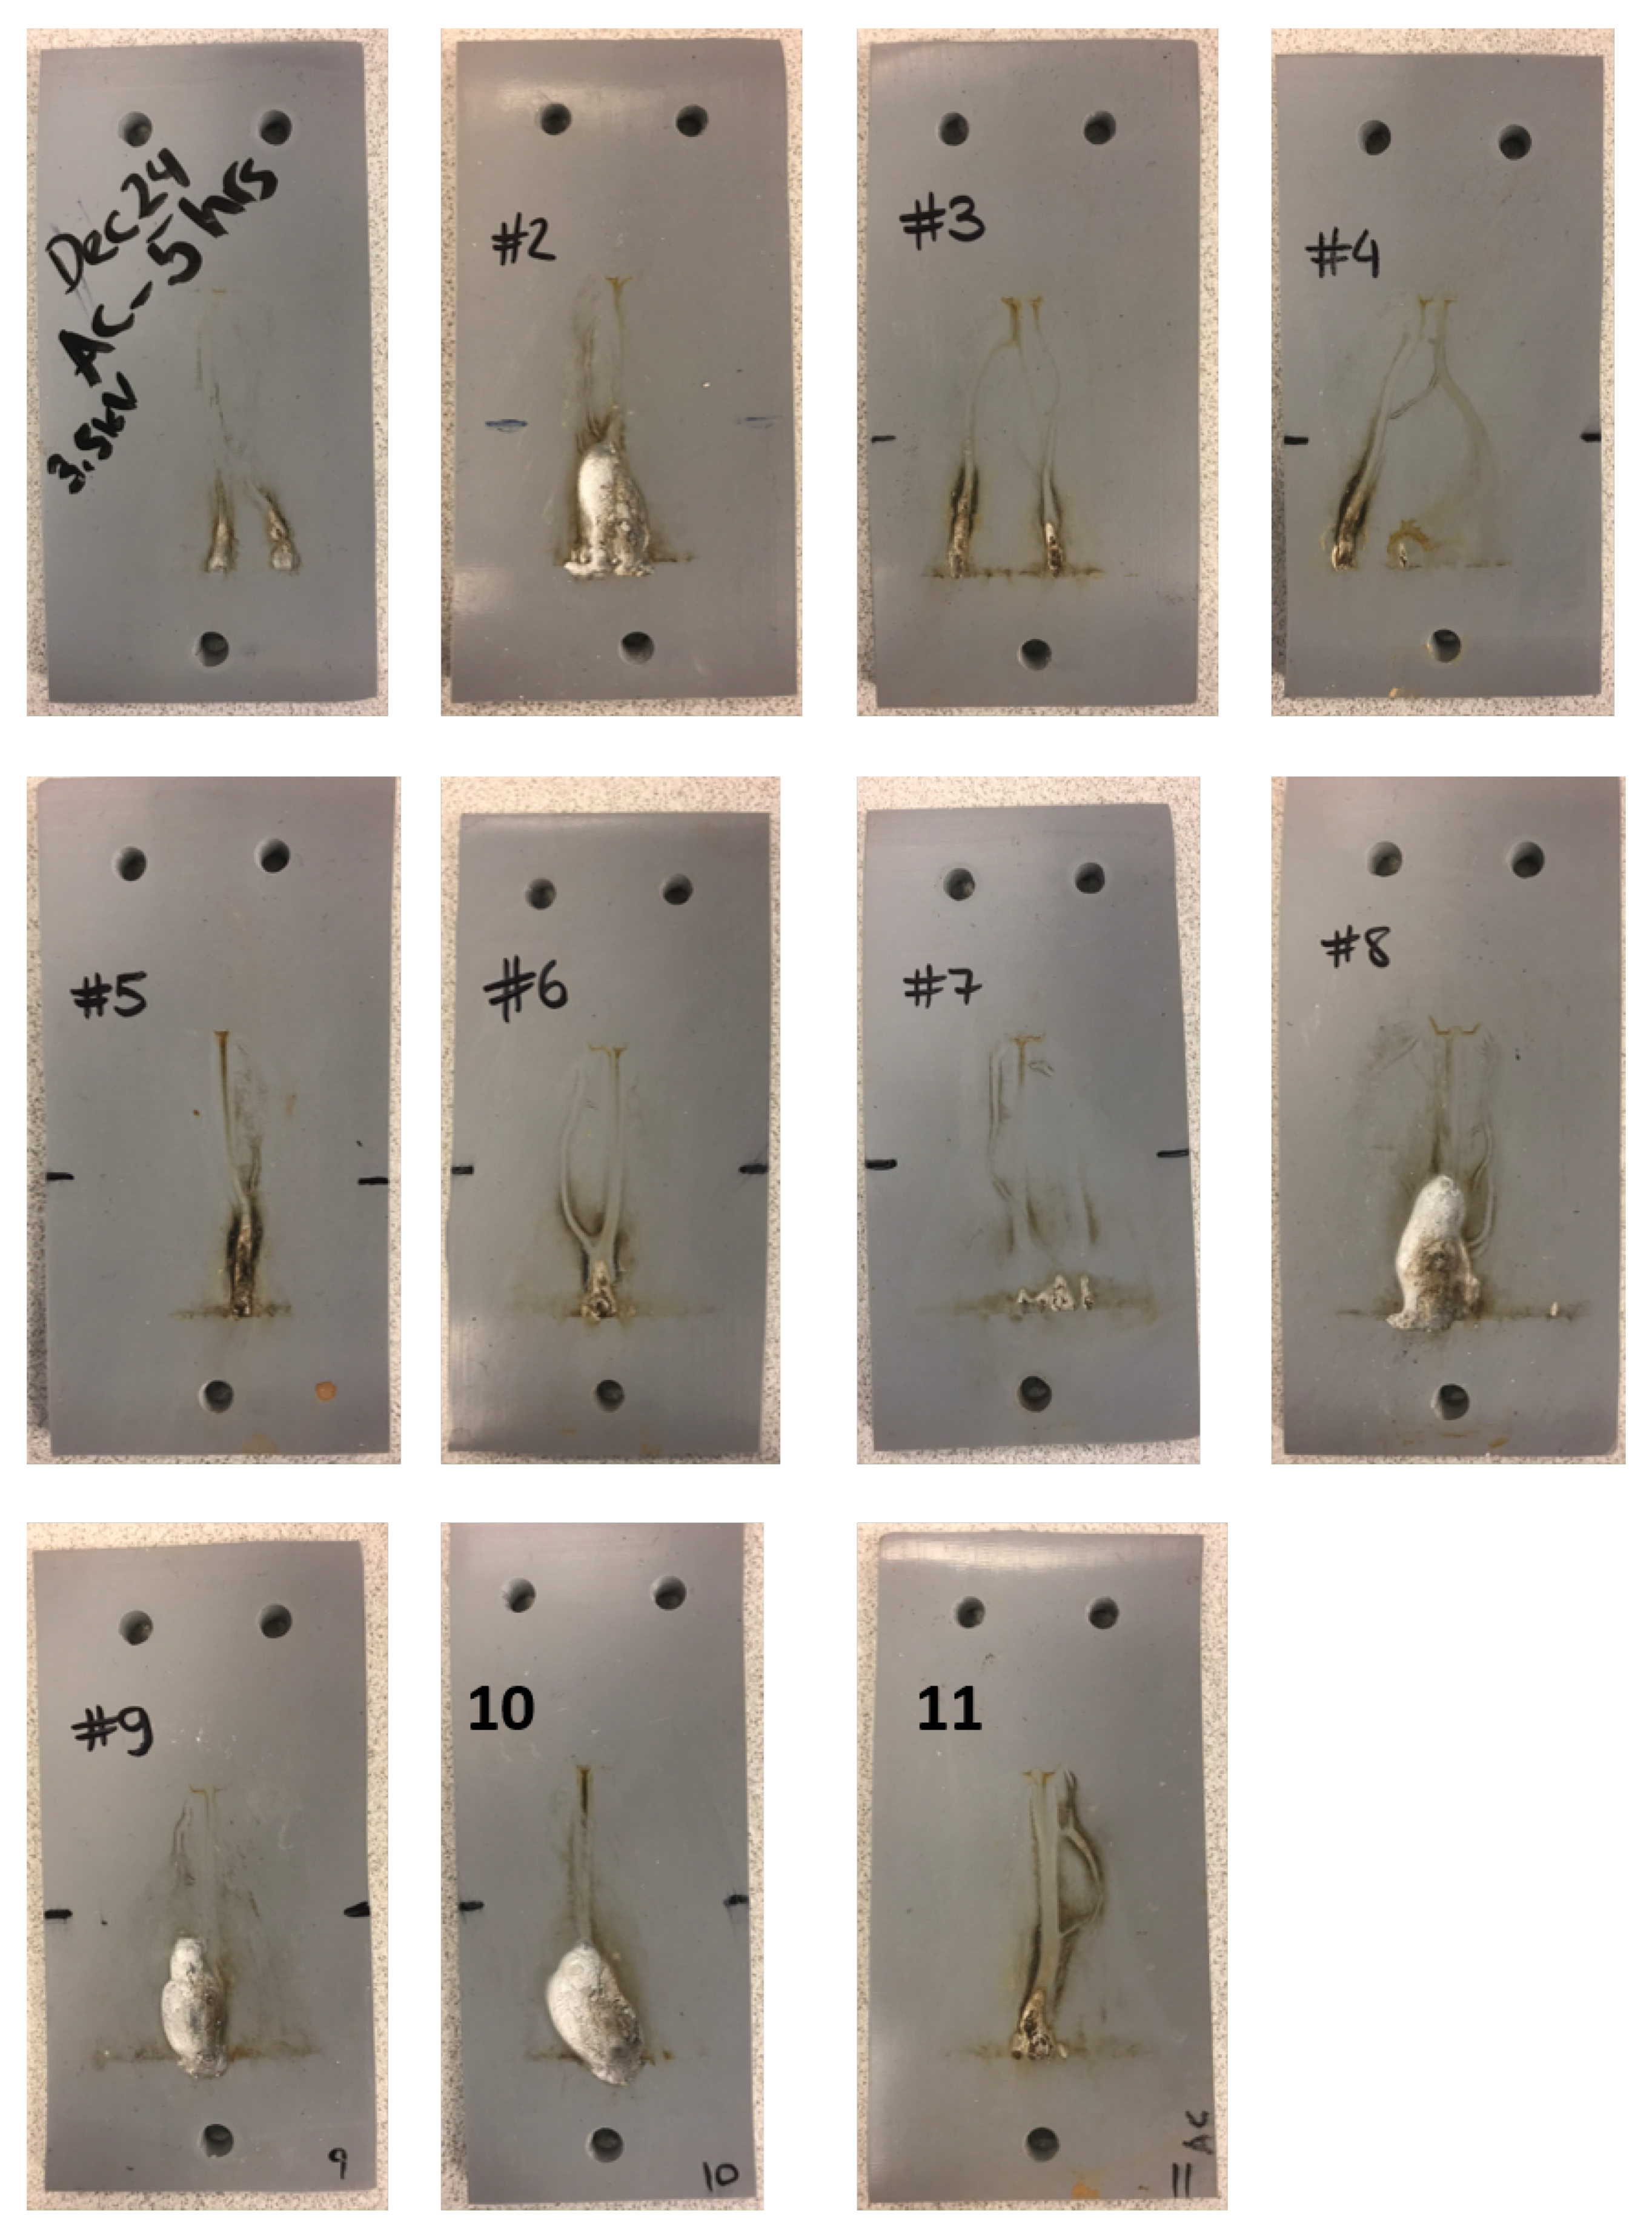
Figure A1.
Photographs of test specimens #1–#11 at the end of AC IPT.
Figure A1.
Photographs of test specimens #1–#11 at the end of AC IPT.
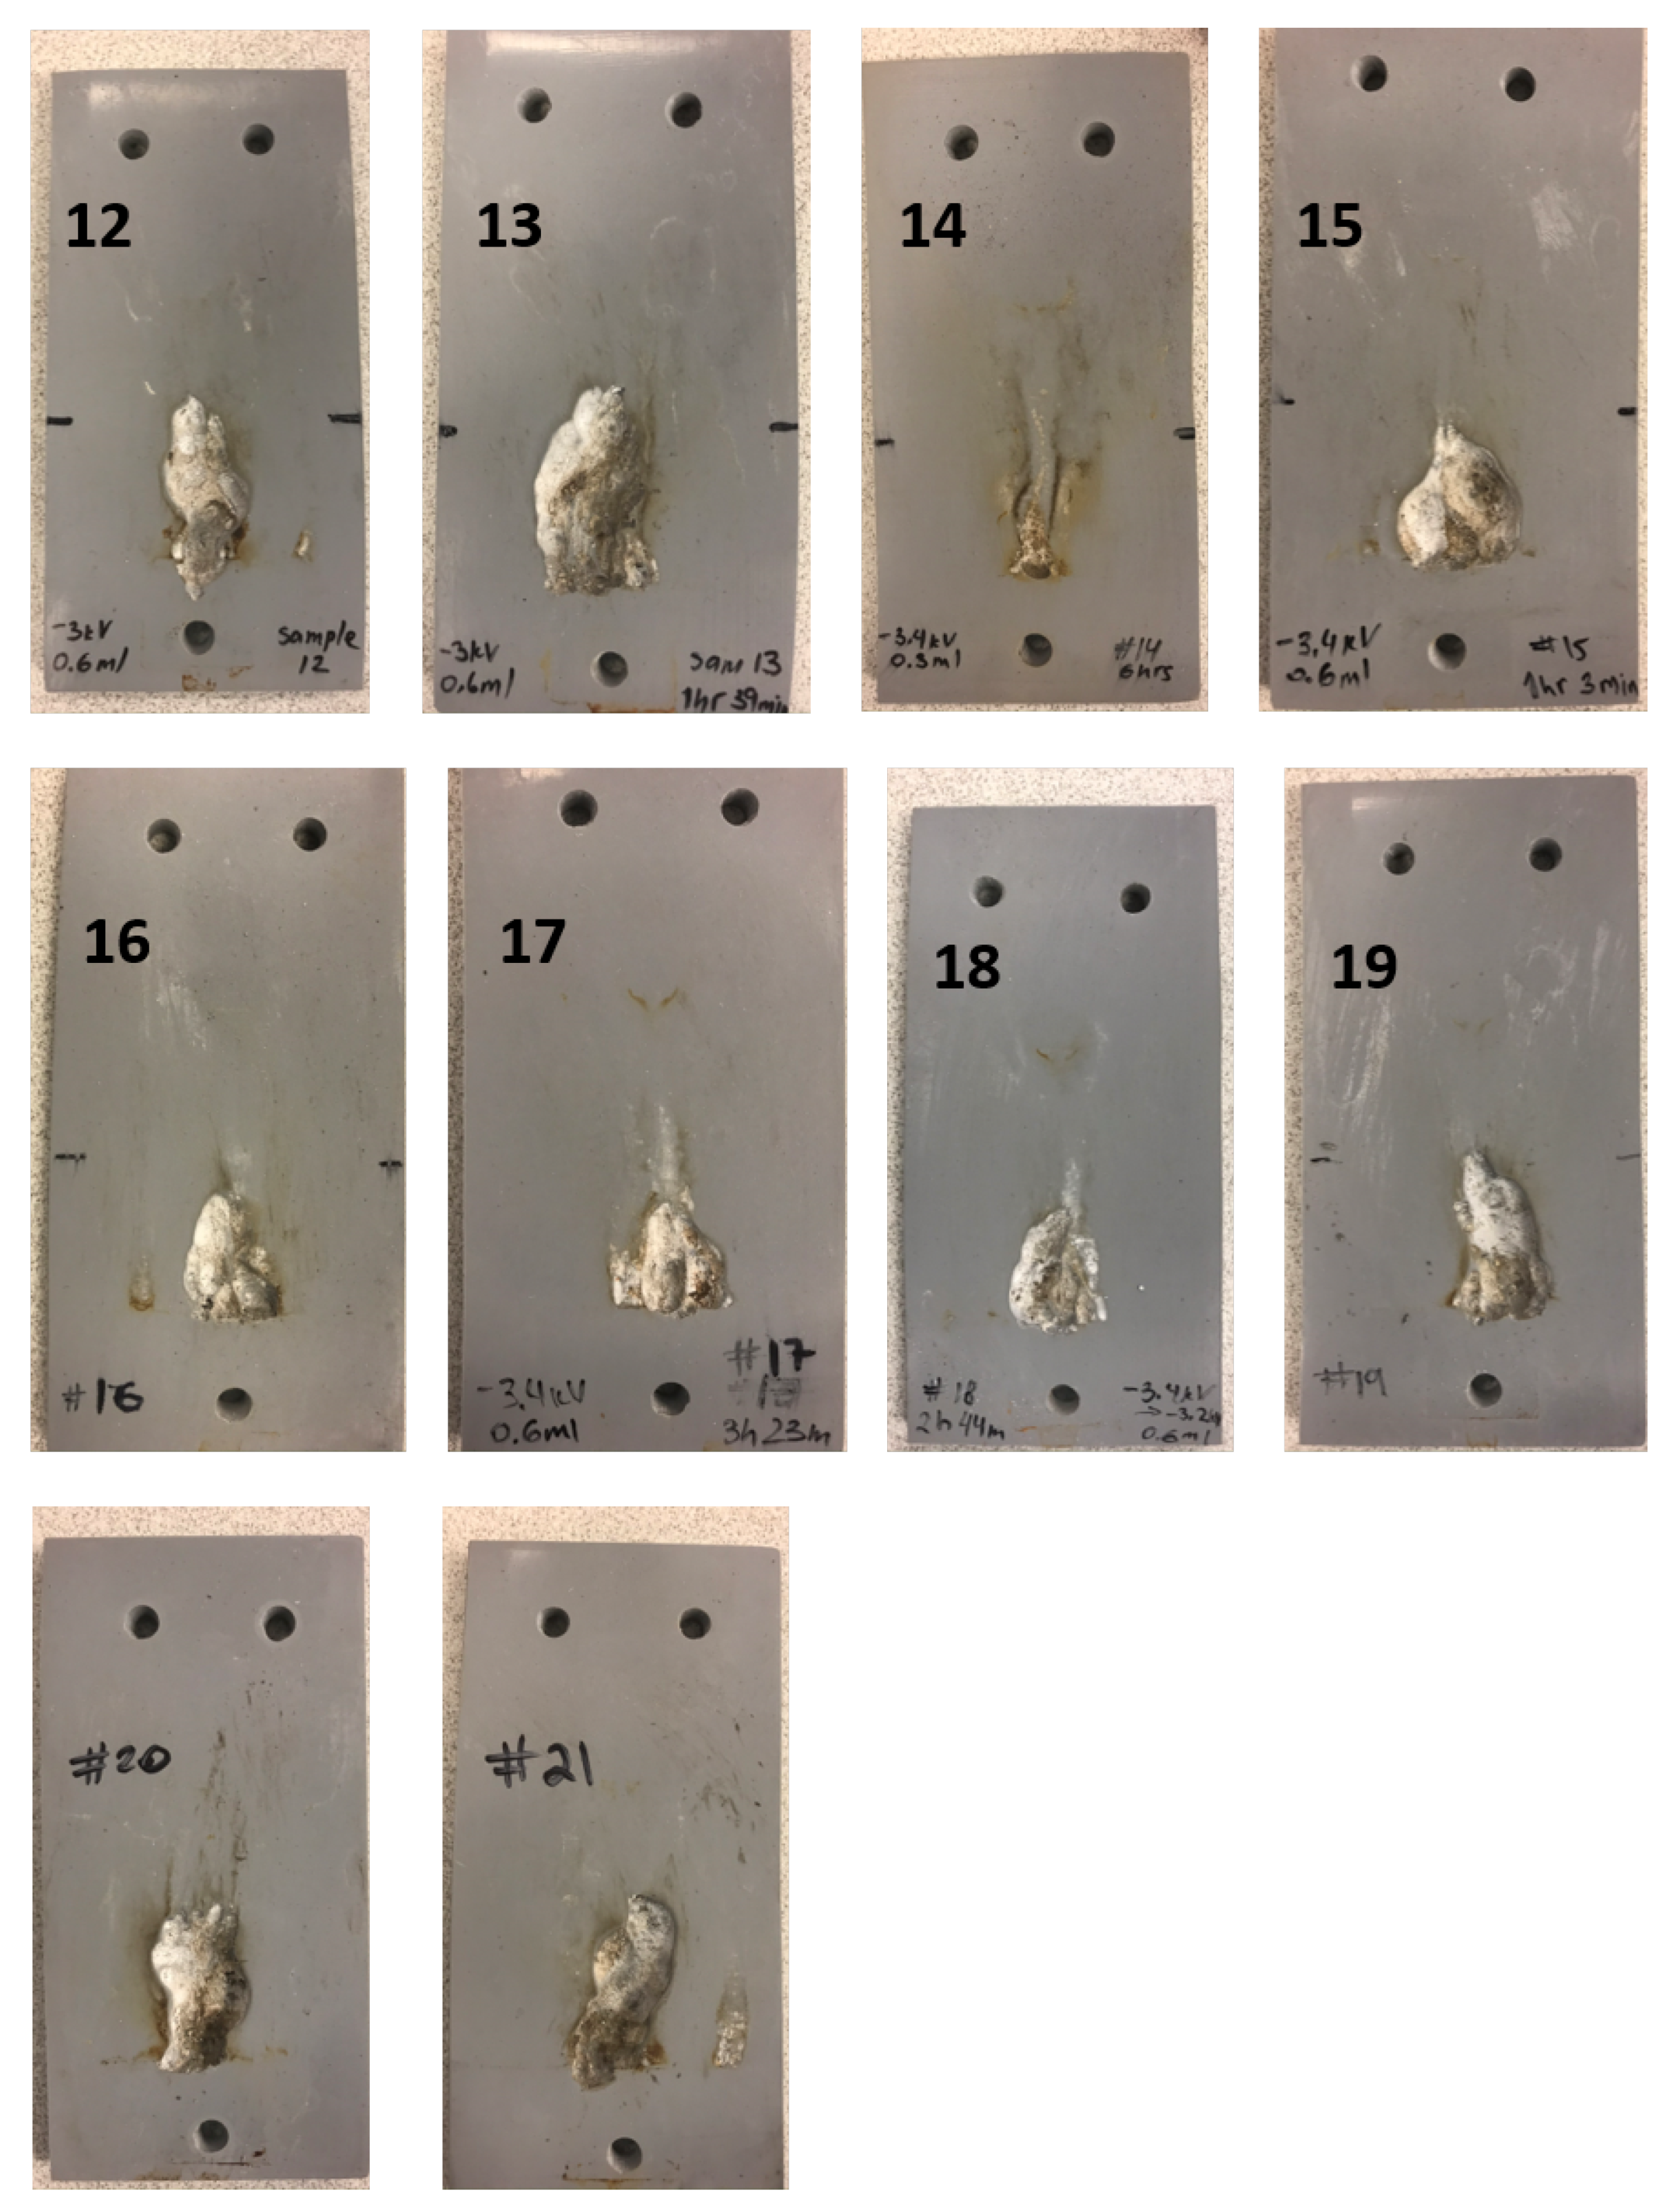
Figure A2.
Photographs of test specimens #12–#21 at the end of −DC IPT.
Figure A2.
Photographs of test specimens #12–#21 at the end of −DC IPT.
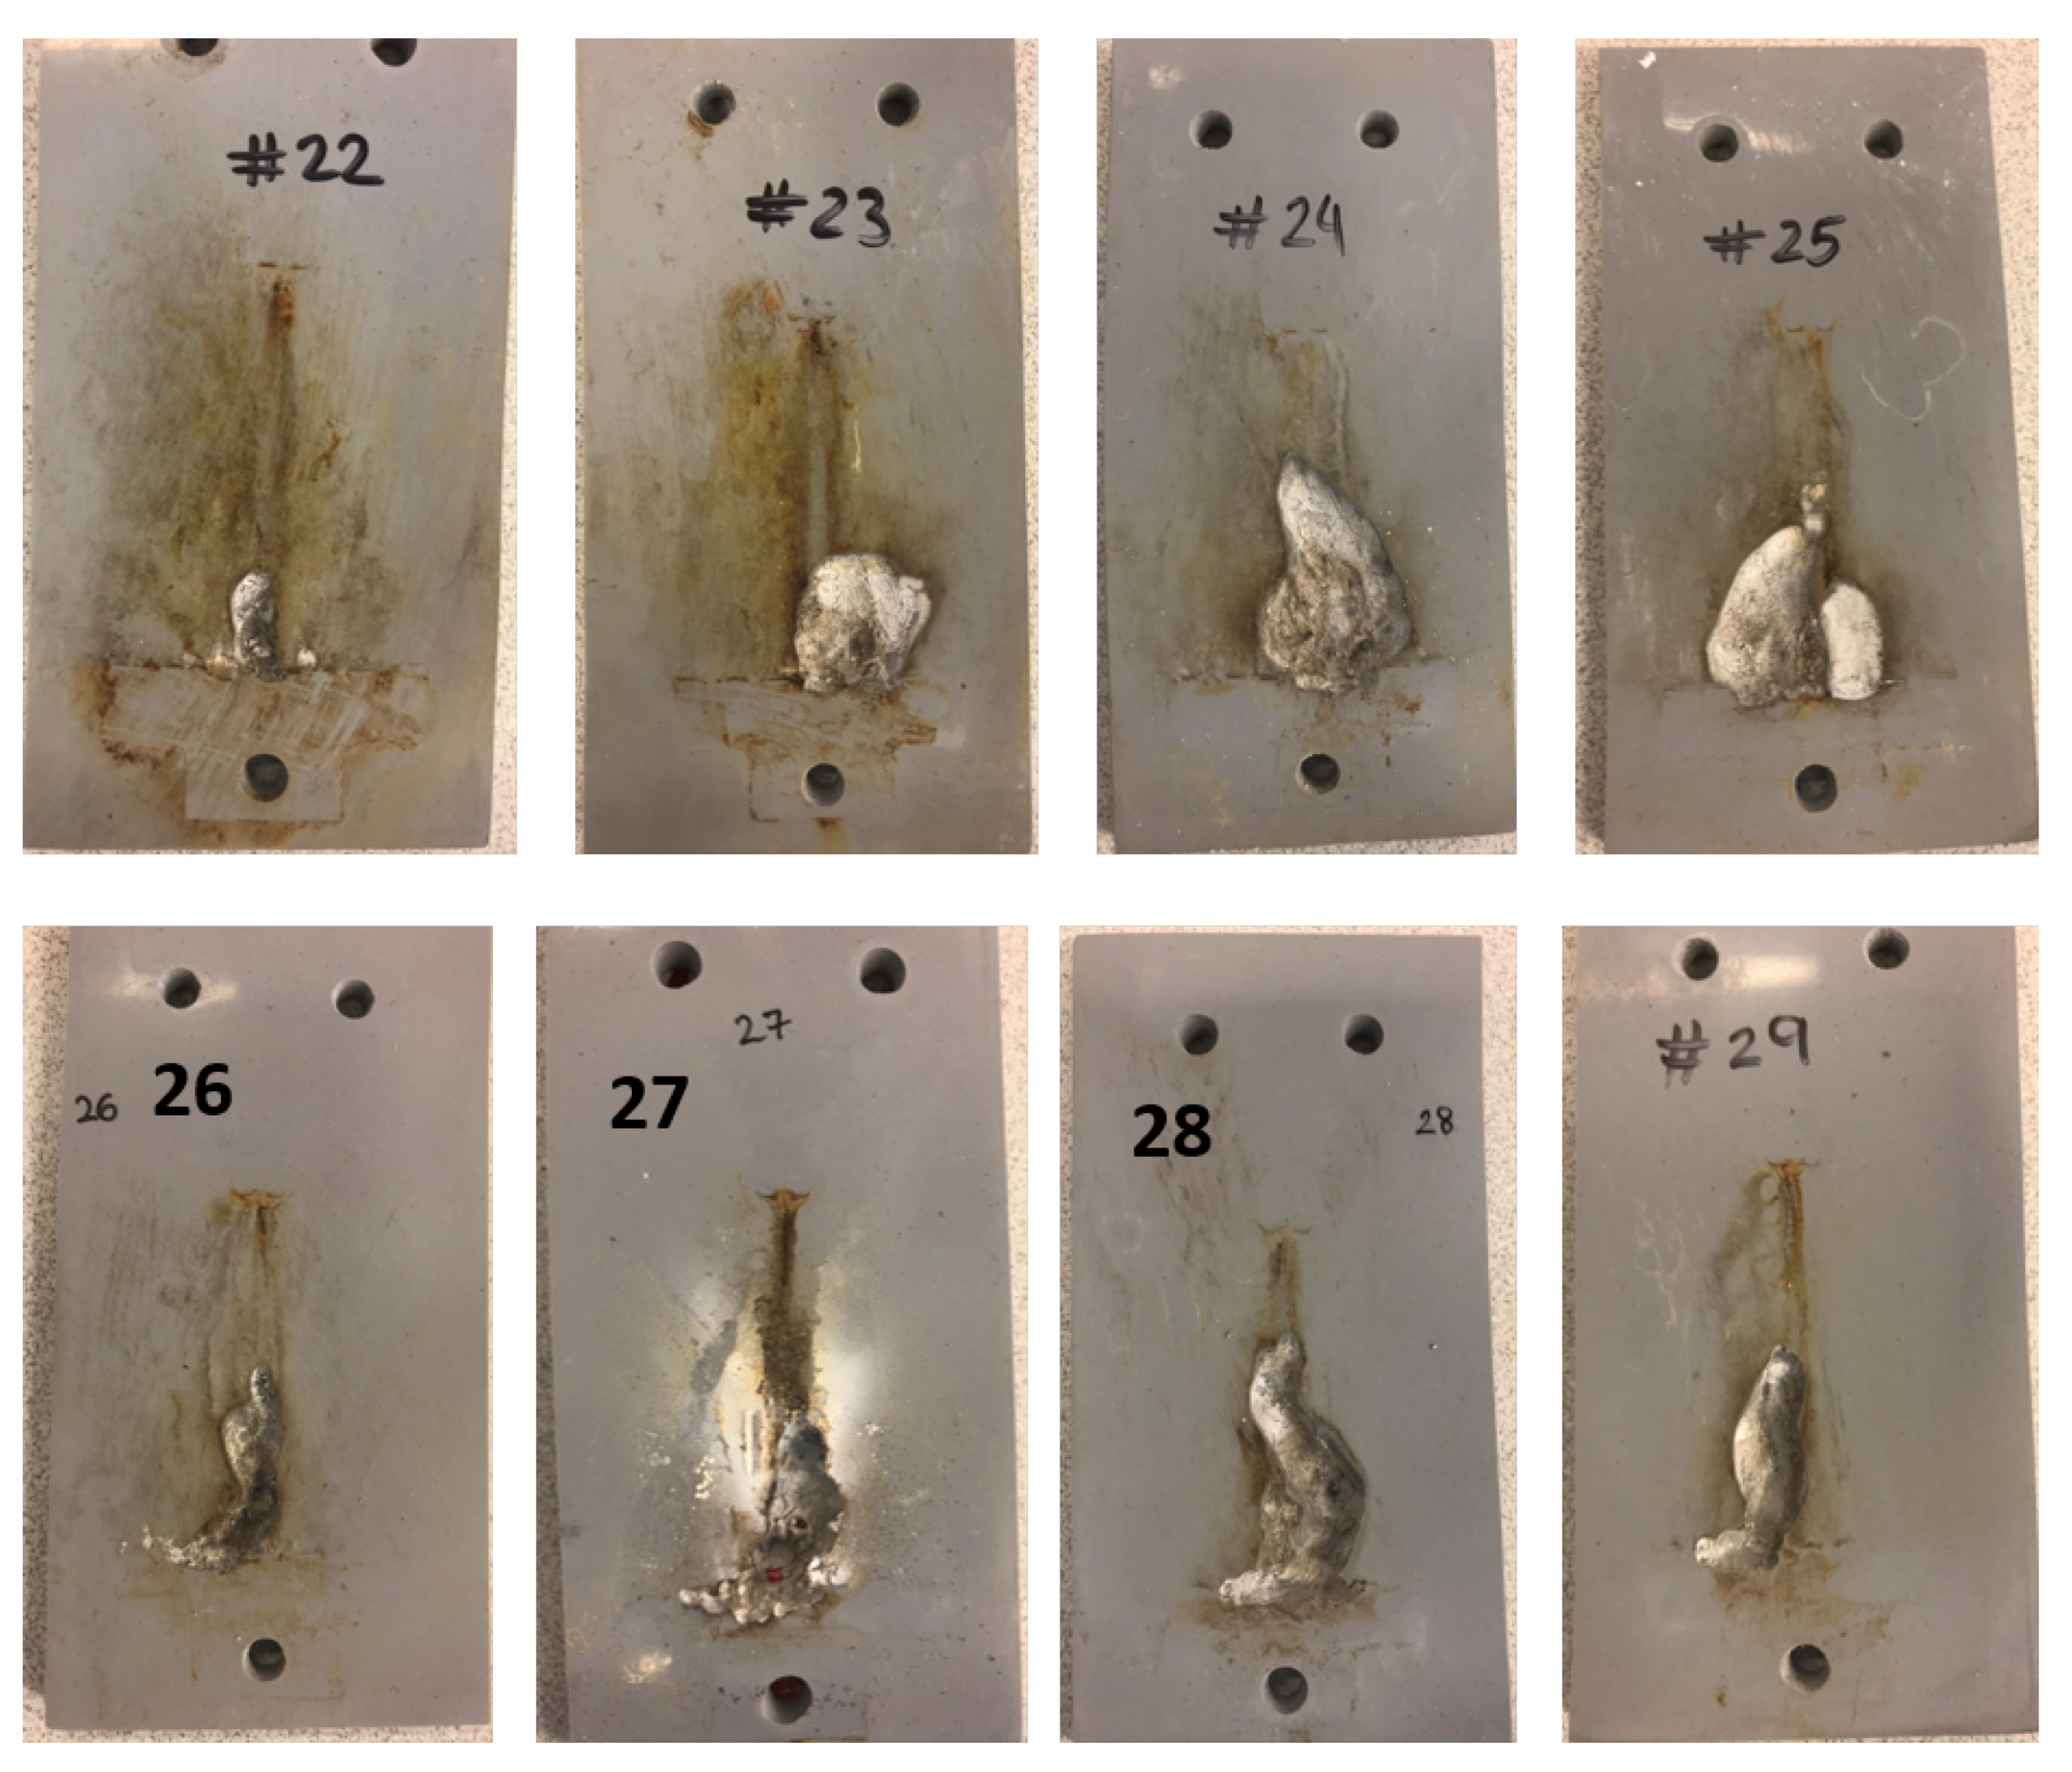
Figure A3.
Photographs of test specimens #22–#29 at the end of +DC IPT.
Figure A3.
Photographs of test specimens #22–#29 at the end of +DC IPT.
References
- Gutman, I.; Halsan, K.; Seifert, J.; Vosloo, W. Pollution and Ageing performance of DC line composite insulators: Service experience vs. laboratory experience. In Proceedings of the World Conference and Exhibition (INMR World Congress) on Insulators, Arresters, Bushings and Cable Accessories, Seoul, Korea, 17–20 April 2011; pp. 1–11. [Google Scholar]
- Gustavsson, T.G.; Gubanski, S.M.; Hillborg, H.; Karlsson, S.; Gedde, U.W. Aging of silicone rubber under AC or DC voltages in a coastal environment. IEEE Trans. Dielectr. Electr. Insul. 2001, 8, 1029–1039. [Google Scholar] [CrossRef]
- Elombo, A.I.; Holtzhausen, J.P.; Vermeulen, H.J.; Pieterse, P.J.; Vosloo, W. Comparative evaluation of the leakage current and aging performance of HTV SR insulators of different creepage lengths when energized by AC, +DC or −DC in a severe marine environment. IEEE Trans. Dielectr. Electr. Insul. 2013, 20, 421–428. [Google Scholar] [CrossRef]
- Mailfert, R.; Pargamin, L.; Riviere, D. Electrical Reliability of DC Line Insulators. IEEE Trans. Electr. Insul. 1981, EI-16, 267–276. [Google Scholar] [CrossRef]
- Electrical Insulating Materials Used under Severe Ambient Conditions—Test Methods for Evaluating Resistance to Tracking and Erosion; IEC Std. 60587. 2007. Available online: https://webstore.iec.ch/publication/2526 (accessed on 1 September 2021).
- Standard Test Method for Liquid-Contaminant, Inclined-Plane Tracking and Erosion of Insulating Materials; ASTM-D2303. 2013. Available online: https://www.astm.org/Standards/D2303.htm (accessed on 1 September 2021).
- Mathes, K.N.; Mcgowan, E.J. Surface electrical failure in the presence of contaminants: The inclined-plane liquid-contaminant test. Trans. Am. Inst. Electr. Eng. Part I Commun. Electron. 2013, 80, 281–289. [Google Scholar] [CrossRef]
- Moreno, V.M.; Gorur, R.S. AC and DC performance of polymeric housing materials for HV outdoor insulators. IEEE Trans. Dielectr. Electr. Insul. 1999, 6, 342–350. [Google Scholar] [CrossRef]
- Heger, G.; Vermeulen, H.J.; Holtzhausen, J.P.; Vosloo, W.L. A comparative study of insulator materials exposed to high voltage AC and DC surface discharges. IEEE Trans. Dielectr. Electr. Insul. 2010, 17, 513–520. [Google Scholar] [CrossRef] [Green Version]
- Ghunem, R.A.; Jayaram, S.H.; Cherney, E.A. Erosion of ATH and silica filled silicone rubber in the DC inclined plane test. In Proceedings of the 2012 IEEE 10th International Conference on the Properties and Applications of Dielectric Materials, Bangalore, India, 24–28 July 2012; pp. 1–4. [Google Scholar]
- Vas, J.V.; Venkatesulu, B.; Thomas, M.J. Tracking and erosion of silicone rubber nanocomposites under DC voltages of both polarities. IEEE Trans. Dielectr. Electr. Insul. 2012, 19, 91–98. [Google Scholar] [CrossRef]
- Ghunem, R.A.; Jayaram, S.H.; Cherney, E.A. Comparative inclined plane tests on silicone and EPDM elastomers under DC. In Proceedings of the 2013 IEEE Electrical Insulation Conference, EIC 2013, Ottawa, ON, Canada, 2–5 June 2013; pp. 356–359. [Google Scholar]
- Bruce, G.P.; Rowland, S.M.; Krivda, A. DC inclined-plane testing of silicone rubber formulations. In Proceedings of the Annual Report—Conference on Electrical Insulation and Dielectric Phenomena, CEIDP, Quebec, QC, Canada, 26–29 October 2008. [Google Scholar]
- Bruce, G.P.; Rowland, S.M.; Krivda, A. Performance of silicone rubber in DC inclined plane tracking tests. IEEE Trans. Dielectr. Electr. Insul. 2010, 17, 521–532. [Google Scholar] [CrossRef]
- Cigré Technical Brochure TB 611—Feasibility Study for a DC Tracking and Erosion Test. 2015. Available online: https://e-cigre.org/publication/611-feasibility-study-for-a-dc-tracking–erosion-test (accessed on 1 September 2021).
- Ghunem, R.A.; Jayaram, S.H.; Cherney, E.A. Erosion of silicone rubber composites in the AC and DC inclined plane tests. IEEE Trans. Dielectr. Electr. Insul. 2013, 20, 229–236. [Google Scholar] [CrossRef]
- Ghunem, R.A.; Jayaram, S.H.; Cherney, E.A. Statistical indicators of silicone rubber erosion in the DC inclined plane test. In Proceedings of the Annual Report—Conference on Electrical Insulation and Dielectric Phenomena, CEIDP, Montreal, QC, Canada, 14–17 October 2012; pp. 737–740. [Google Scholar]
- Meyer, L.H.; Jayaram, S.H.; Cherney, E.A. Correlation of damage, dry band arcing energy, and temperature in inclined plane testing of silicone rubber for outdoor insulation. IEEE Trans. Dielectr. Electr. Insul. 2004, 11, 424–432. [Google Scholar] [CrossRef]
- Ghunem, R.A.; Jayaram, S.H.; Cherney, E.A. Investigation into the eroding dry-band arcing of filled silicone rubber under DC using wavelet-based multiresolution analysis. IEEE Trans. Dielectr. Electr. Insul. 2014, 21, 713–720. [Google Scholar] [CrossRef]
- Kühnel, S.; Kornhuber, S.; Bärsch, R.; Lambrecht, J. On the arc-resistance when tested with DC- and AC-stress by the example of silicone elastomers. In Proceedings of the Annual Report—Conference on Electrical Insulation and Dielectric Phenomena, CEIDP, Toronto, ON, Canada, 16–19 October 2016; pp. 501–505. [Google Scholar]
- Rowland, S.M.; Bruce, G.P.; Liu, Y.; Krivda, A.; Schmidt, L.E. Use of image analysis in DC inclined plane tracking tests of nano and micro composites. IEEE Trans. Dielectr. Electr. Insul. 2011, 18, 365–374. [Google Scholar] [CrossRef]
- Polisetty, S.; El-Hag, A.; Jayram, S. Classification of common discharges in outdoor insulation using acoustic signals and artificial neural network. IET High Volt. 2019, 4, 333–338. [Google Scholar] [CrossRef]
- Shurrab, I.Y.; El-Hag, A.H.; Assaleh, K.; Ghunem, R.A.; Jayaram, S. RF-based monitoring and classification of partial discharge on wet silicone rubber surface. IEEE Trans. Dielectr. Electr. Insul. 2013, 20, 2188–2194. [Google Scholar] [CrossRef]
- Chandrasekar, S.; Kalaivanan, C.; Montanari, G.C.; Cavallini, A. Partial discharge detection as a tool to infer pollution severity of polymeric insulators. IEEE Trans. Dielectr. Electr. Insul. 2010, 17, 181–188. [Google Scholar] [CrossRef]
- Mekala, K.; Chandrasekar, S.; Ravindra, R.S. Investigations of accelerated aged polymeric insulators using partial discharge signal measurement and analysis. J. Electr. Eng. Technol. 2015, 10, 299–307. [Google Scholar] [CrossRef] [Green Version]
- Pevtsov, V.; Jacob, N.; Kordi, B. Evaluation of Partial Discharge Characteristics in Inclined Plane Tracking and Erosion Tests on Silicone Rubber under AC Voltage. In Proceedings of the 2020 IEEE Electrical Insulation Conference (EIC), Knoxville, TN, USA, (Virtual), 22 June–3 July 2020; pp. 175–178. [Google Scholar]
- Contin, A.; Cavallini, A.; Montanari, G.C.; Pasini, G.; Puletti, F. Digital detection and fuzzy classification of partial discharge signals. IEEE Trans. Dielectr. Electr. Insul. 2002, 9, 335–348. [Google Scholar] [CrossRef]
- Koné, D.; Ghunem, R.A.; Cissé, L.; Hadjadj, Y.; El-Hag, A.H. Effect of residue formed during the AC and DC dry-band arcing on silicone rubber filled with natural silica. IEEE Trans. Dielectr. Electr. Insul. 2019, 26, 1620–1626. [Google Scholar] [CrossRef]
- Ghunem, R.A.; Jayaram, S.H.; Cherney, E.A. Inclined plane initial tracking voltage for AC, +DC and -DC. In Proceedings of the Conference Record of IEEE International Symposium on Electrical Insulation, San Juan, PR, USA, 10–13 June 2012; pp. 459–463. [Google Scholar]
- Cherney, E.A.; Gorur, R.S.; Krivda, A.; Jayaram, S.H.; Rowland, S.M.; Li, S.; Marzinotto, M.; Ghunem, R.A.; Ramirez, I. DC inclined-plane tracking and erosion test of insulating materials. IEEE Trans. Dielectr. Electr. Insul. 2015, 22, 211–217. [Google Scholar] [CrossRef]
Figure 1.
AC and DC inclined plane test (IPT) experimental setup. The test setup as prescribed by IEC 60587 is in black and the additional equipment employed in this study is in red.
Figure 1.
AC and DC inclined plane test (IPT) experimental setup. The test setup as prescribed by IEC 60587 is in black and the additional equipment employed in this study is in red.
Figure 2.
Examples of erosion damage on high temperature vulcanized (HTV) silicone rubber (SR) samples following IPT: (a) Sample #10 after the AC test with an erosion depth of 4.7 mm. (b) Sample #21 after −DC test with an erosion depth of 5.4 mm. (c) Sample #27 after +DC test with an erosion depth of 6.0 mm.
Figure 3.
Diagrams of apparent charge magnitude vs. time acquired during negative DC IPT at −3.4 kV. (a) Mobile discharges producing magnitudes greater than 4 nC. (b) Localized discharges producing magnitudes between 1 nC and 4 nC. (c) High temperature discharges having peak charge magnitude of 1 nC.
Figure 4.
TF map clusters obtained during negative DC IPT. (a) Mobile discharge pulses form cluster having greatest W2 coordinates. (b) Localized discharge pulses form cluster with mid-range W2 coordinates. (c) High temperature discharge pulses form a cluster with lowest W2 coordinates.
Figure 4.
TF map clusters obtained during negative DC IPT. (a) Mobile discharge pulses form cluster having greatest W2 coordinates. (b) Localized discharge pulses form cluster with mid-range W2 coordinates. (c) High temperature discharge pulses form a cluster with lowest W2 coordinates.
Figure 5.
Diagrams of apparent charge magnitude vs time acquired during positive DC IPT at 2.7 kV. (a) Mobile discharges producing magnitudes greater than 6 nC. (b) Localized discharges producing magnitudes between 1 nC and 6 nC. (c) High temperature discharges having a magnitude window between 3–12 nC.
Figure 6.
TF map clusters obtained during positive DC IPT. (a) Mobile discharge pulses form cluster having greatest W2 coordinates. (b) Localized discharge pulses form cluster with mid-range W2 coordinates. (c) High temperature discharge pulses form a cluster with lowest W2 coordinates.
Figure 6.
TF map clusters obtained during positive DC IPT. (a) Mobile discharge pulses form cluster having greatest W2 coordinates. (b) Localized discharge pulses form cluster with mid-range W2 coordinates. (c) High temperature discharge pulses form a cluster with lowest W2 coordinates.
Figure 7.
Mobile discharge pulse waveforms and corresponding frequency spectra. T2, W2 coordinates of each pulse are shown on the time domain graphs. (a) AC pulse appears oscillatory. (b) Negative DC pulse. (c) Positive DC pulse.
Figure 7.
Mobile discharge pulse waveforms and corresponding frequency spectra. T2, W2 coordinates of each pulse are shown on the time domain graphs. (a) AC pulse appears oscillatory. (b) Negative DC pulse. (c) Positive DC pulse.
Figure 8.
Localized discharge pulse waveforms and corresponding frequency spectra. T2, W2 coordinates of each pulse are shown on the time domain graphs. (a) AC pulse. (b) Negative DC pulse. (c) Positive DC pulse.
Figure 8.
Localized discharge pulse waveforms and corresponding frequency spectra. T2, W2 coordinates of each pulse are shown on the time domain graphs. (a) AC pulse. (b) Negative DC pulse. (c) Positive DC pulse.
Figure 9.
High temperature discharge pulse waveforms and corresponding frequency spectra. T2, W2 coordinates of each pulse are shown on the time domain graphs. (a) AC pulse. (b) Negative DC pulse. (c) Positive DC pulse.
Figure 9.
High temperature discharge pulse waveforms and corresponding frequency spectra. T2, W2 coordinates of each pulse are shown on the time domain graphs. (a) AC pulse. (b) Negative DC pulse. (c) Positive DC pulse.
Table 1.
Negative DC partial discharge characteristics.
Table 1.
Negative DC partial discharge characteristics.
| PD Characteristics | Mobile | Discharge Type Localized | High Temperature |
|---|
| Apparent charge magnitude [nC] | >4 | 1–4 | ≤1 |
| [ns] | 35–150 | 42–120 | 35–200 |
| [MHz] | 10.5–12.6 | 5.5–9.5 | 1.0–5.5 |
Table 2.
Positive DC partial discharge characteristics.
Table 2.
Positive DC partial discharge characteristics.
| PD Characteristics | Mobile | Discharge Type Localized | High Temperature |
|---|
| Apparent charge magnitude [nC] | >6 | 1–6 | 3–12 |
| [ns] | 50–150 | 52–128 | 70–200 |
| [MHz] | 9.5–12.0 | 5.5–9.0 | 1.7–5.0 |
Table 3.
Comparison of mobile pulse characteristics at the three types of voltage stress.
Table 3.
Comparison of mobile pulse characteristics at the three types of voltage stress.
| Test Supply | AC | −DC | +DC |
|---|
| [ns] | 20–175 | 35–150 | 50–150 |
| [MHz] | 13.5–15.0 | 10.5–12.6 | 9.5–12.0 |
Table 4.
Comparison of localized pulse characteristics at the three types of voltage stress.
Table 4.
Comparison of localized pulse characteristics at the three types of voltage stress.
| Test Supply | AC | −DC | +DC |
|---|
| [ns] | 70–170 | 42–120 | 52–128 |
| [MHz] | 6.5–11.5 | 5.5–9.5 | 5.5–9.0 |
Table 5.
Comparison of high temperature pulse characteristics at the three types of voltage stress.
Table 5.
Comparison of high temperature pulse characteristics at the three types of voltage stress.
| Test Supply | AC | −DC | +DC |
|---|
| [ns] | 65–160 | 35–200 | 70–200 |
| [MHz] | 1.5–6.5 | 1.0–5.5 | 1.7–5.0 |
Table 6.
Summary of eroding discharge pulse characteristics obtained in AC, negative and positive DC tests. Red, orange and yellow cells indicate the relative order of values in each row from high to low, respectively.
Table 6.
Summary of eroding discharge pulse characteristics obtained in AC, negative and positive DC tests. Red, orange and yellow cells indicate the relative order of values in each row from high to low, respectively.
| Eroding Pulse Characteristic | +DC | −DC | AC |
|---|
| Degree of erosion | Most severe | Moderate | Least severe |
| Mean amplitude [mV] | | | |
| Mean energy [mV2] | 852 | 431 | 5549 |
| Maximum pulse width [ns] | 540 | 530 | 330 |
| Maximum DC/1MHz component ratio | | | |
| Publisher’s Note: MDPI stays neutral with regard to jurisdictional claims in published maps and institutional affiliations. |
© 2021 by the authors. Licensee MDPI, Basel, Switzerland. This article is an open access article distributed under the terms and conditions of the Creative Commons Attribution (CC BY) license (https://creativecommons.org/licenses/by/4.0/).


