
Study on Evaluation Method of Impulse Dispersion Performance of Grounding Device Using X-ray Imagining System †

Abstract
: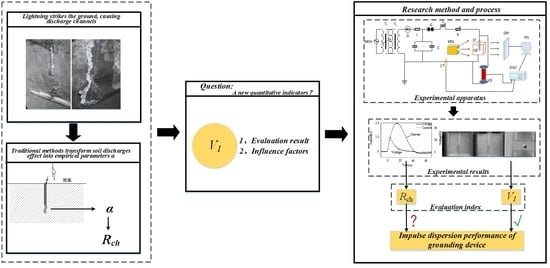
1. Introduction
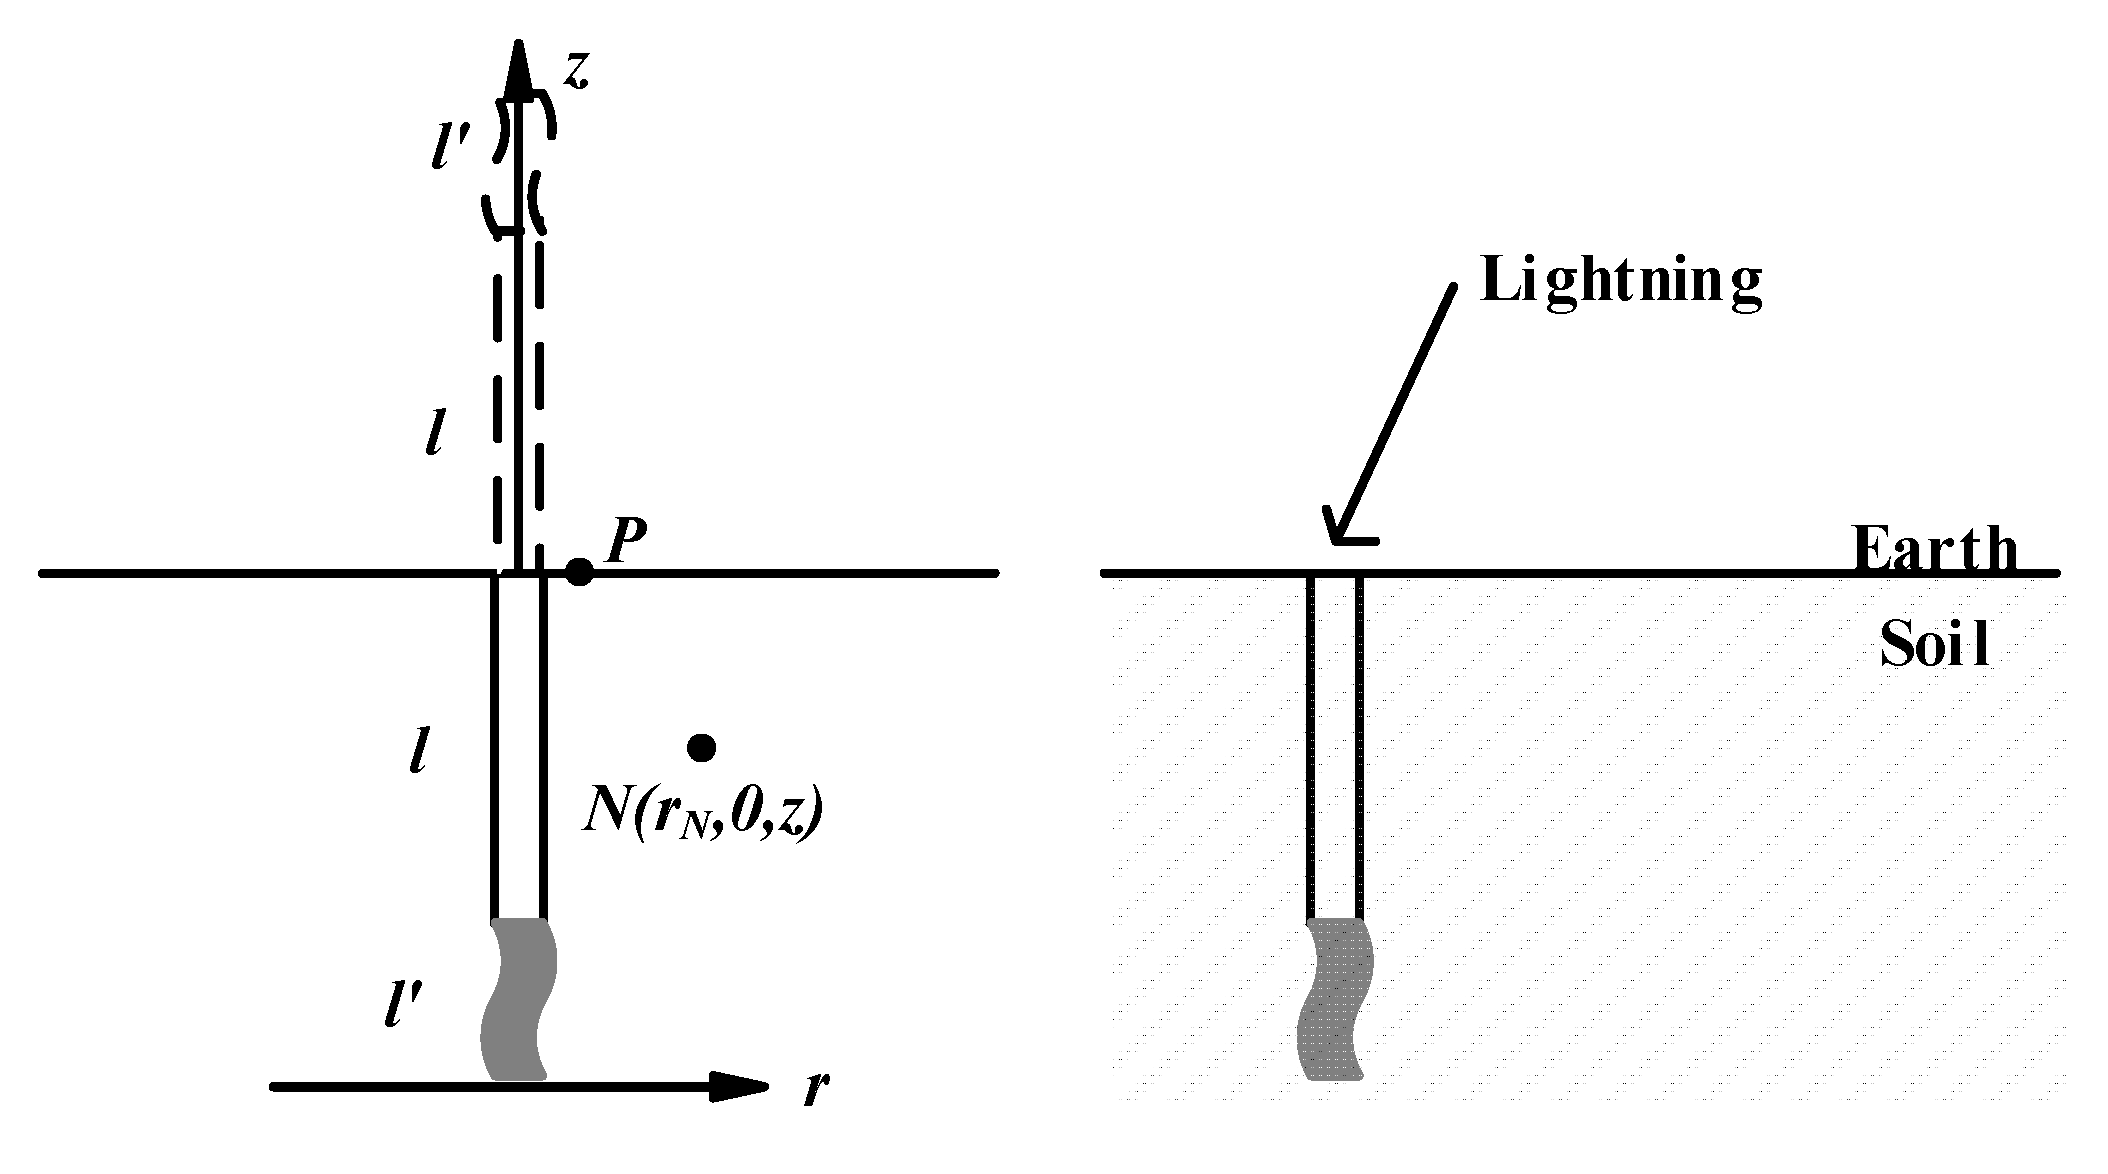
2. Theoretical Derivation of Characteristic Quantity of Soil Impulse Dispersion Performance
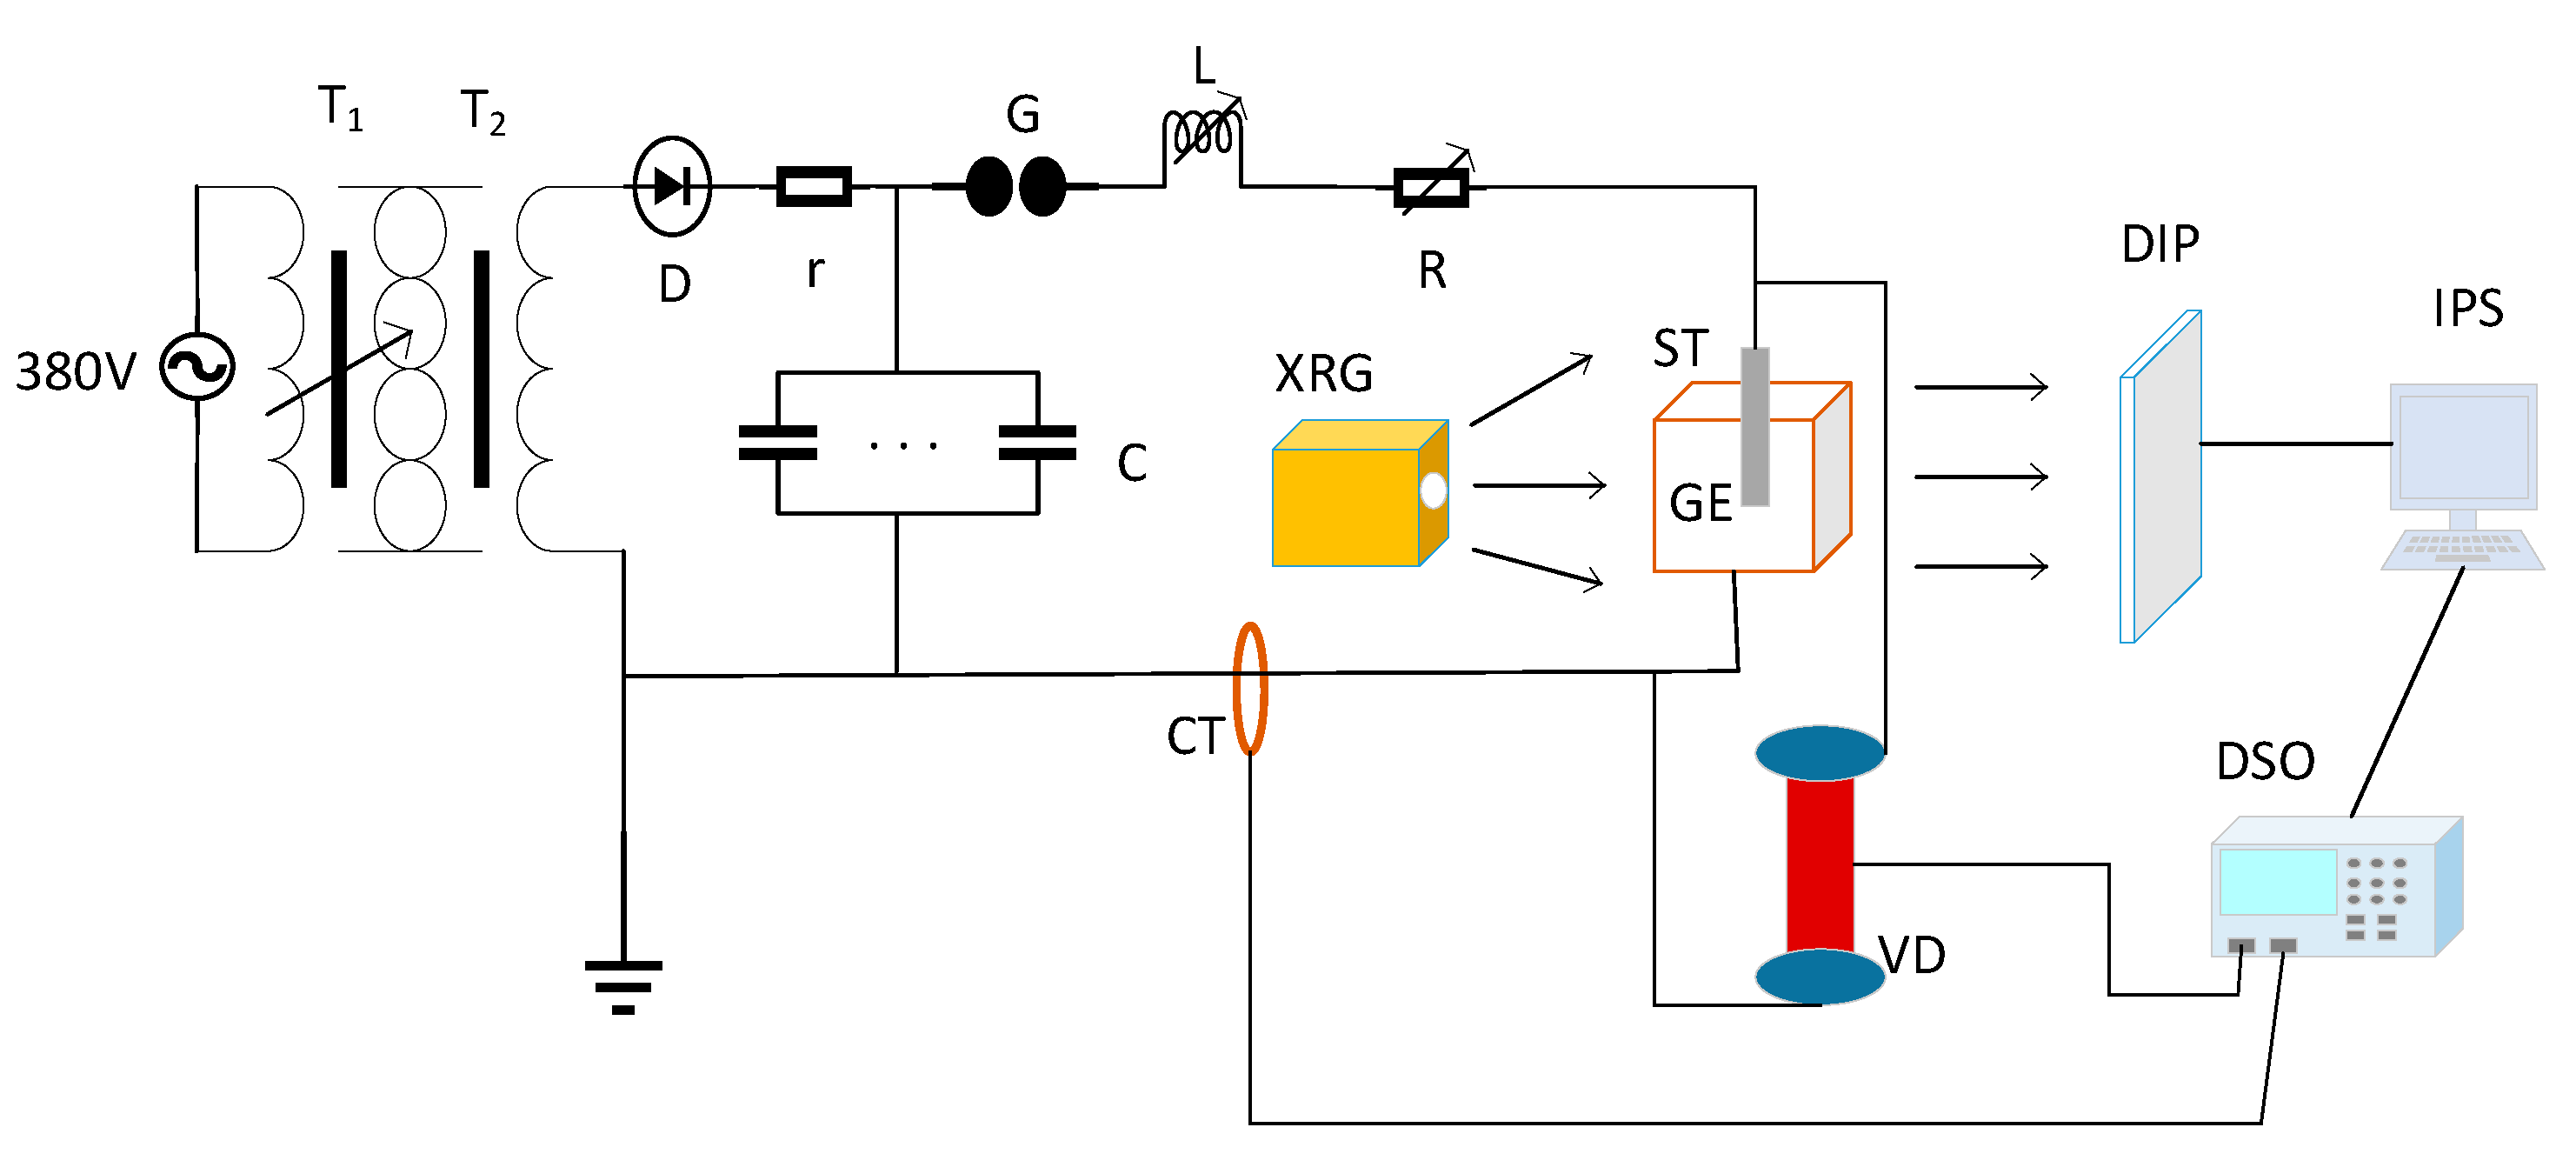
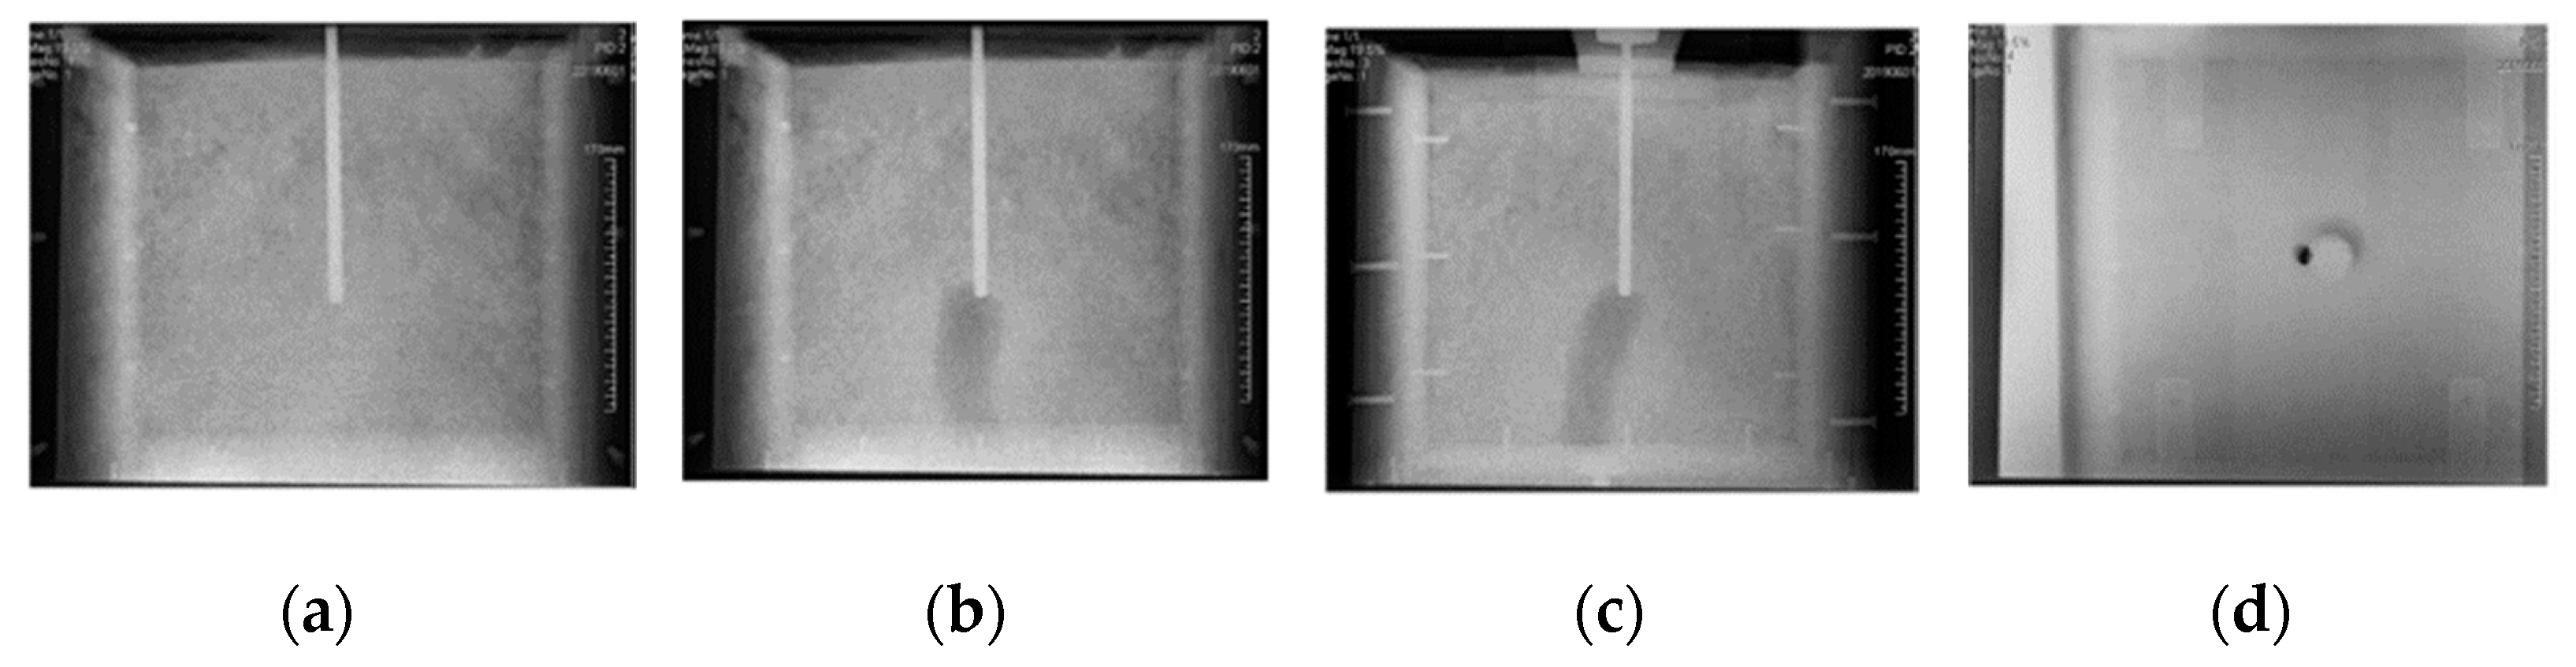
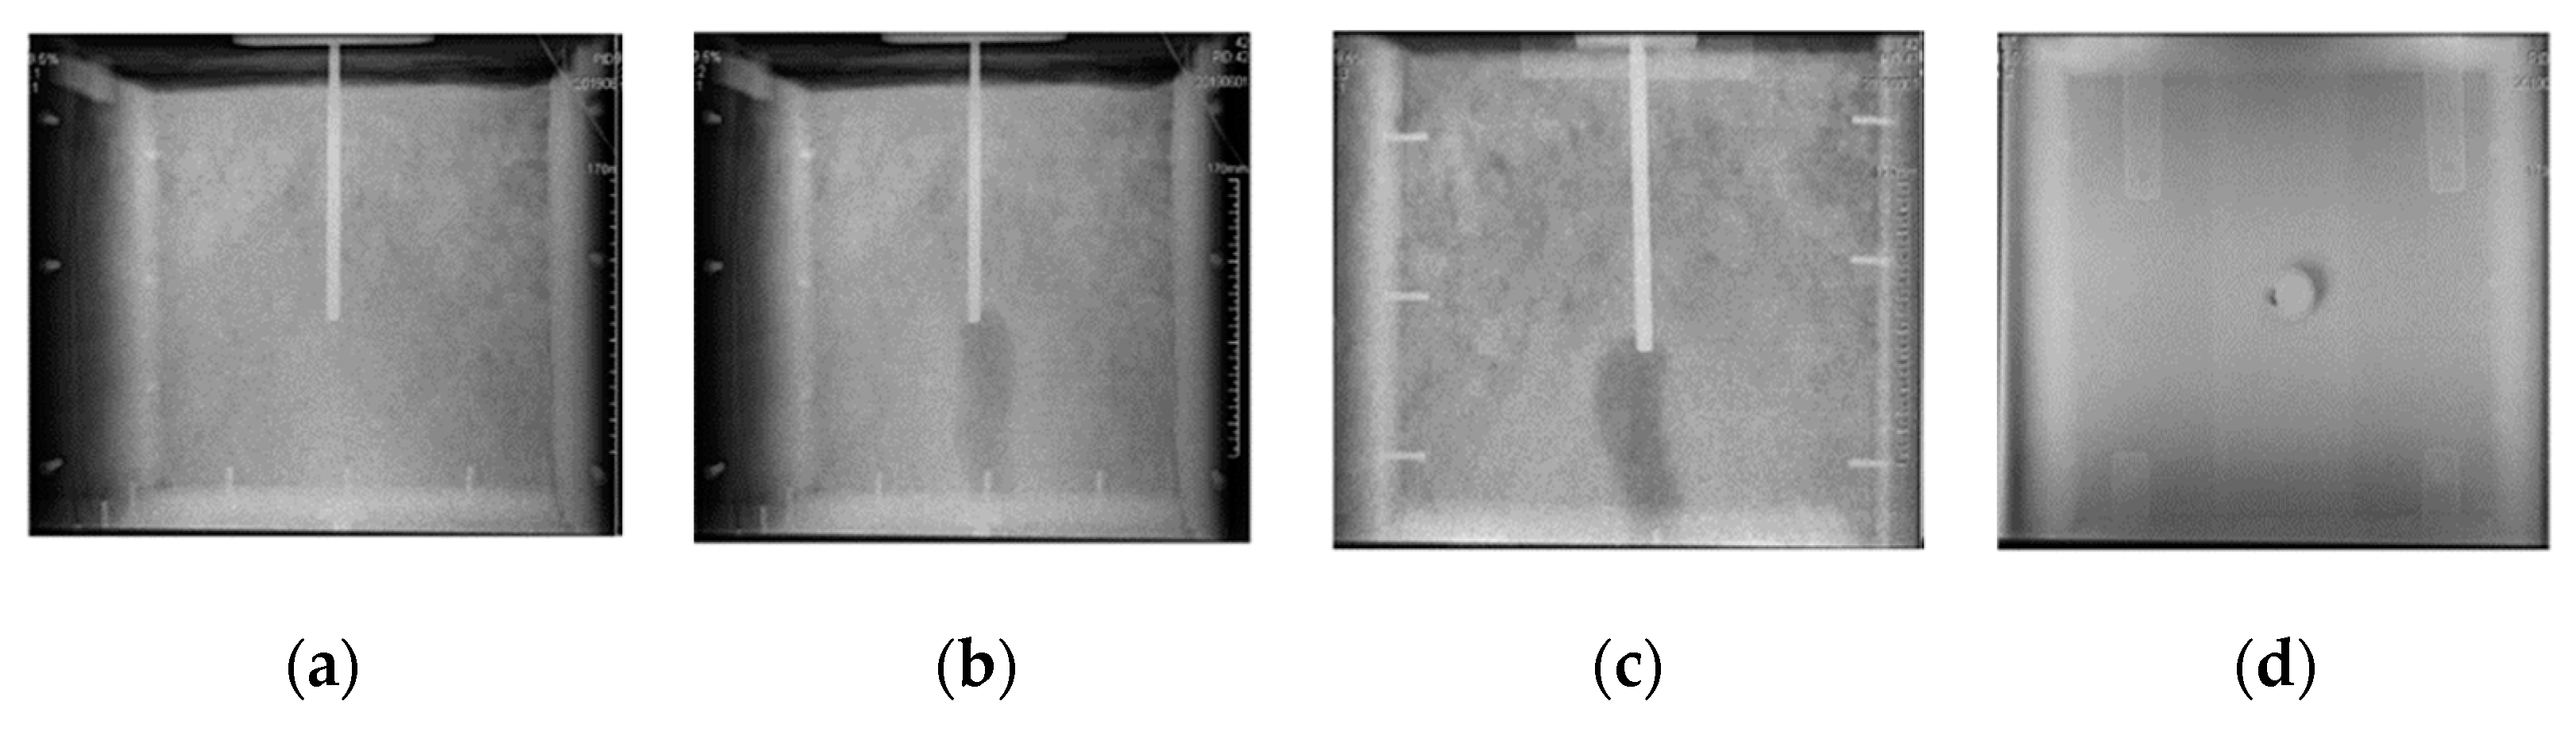
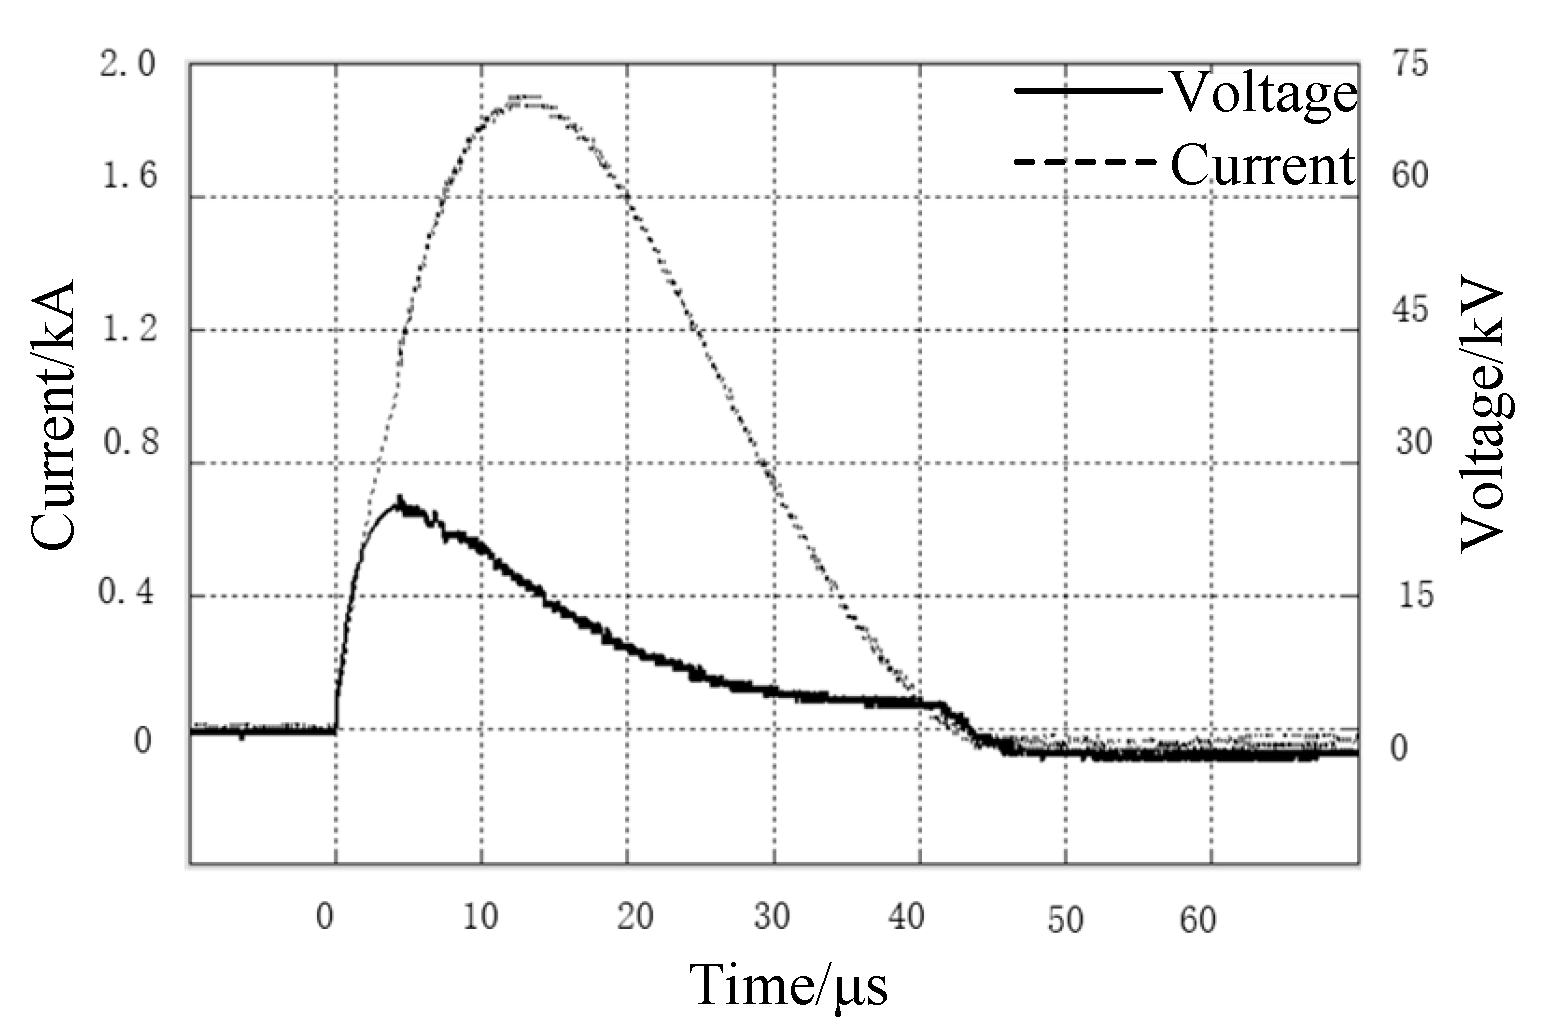
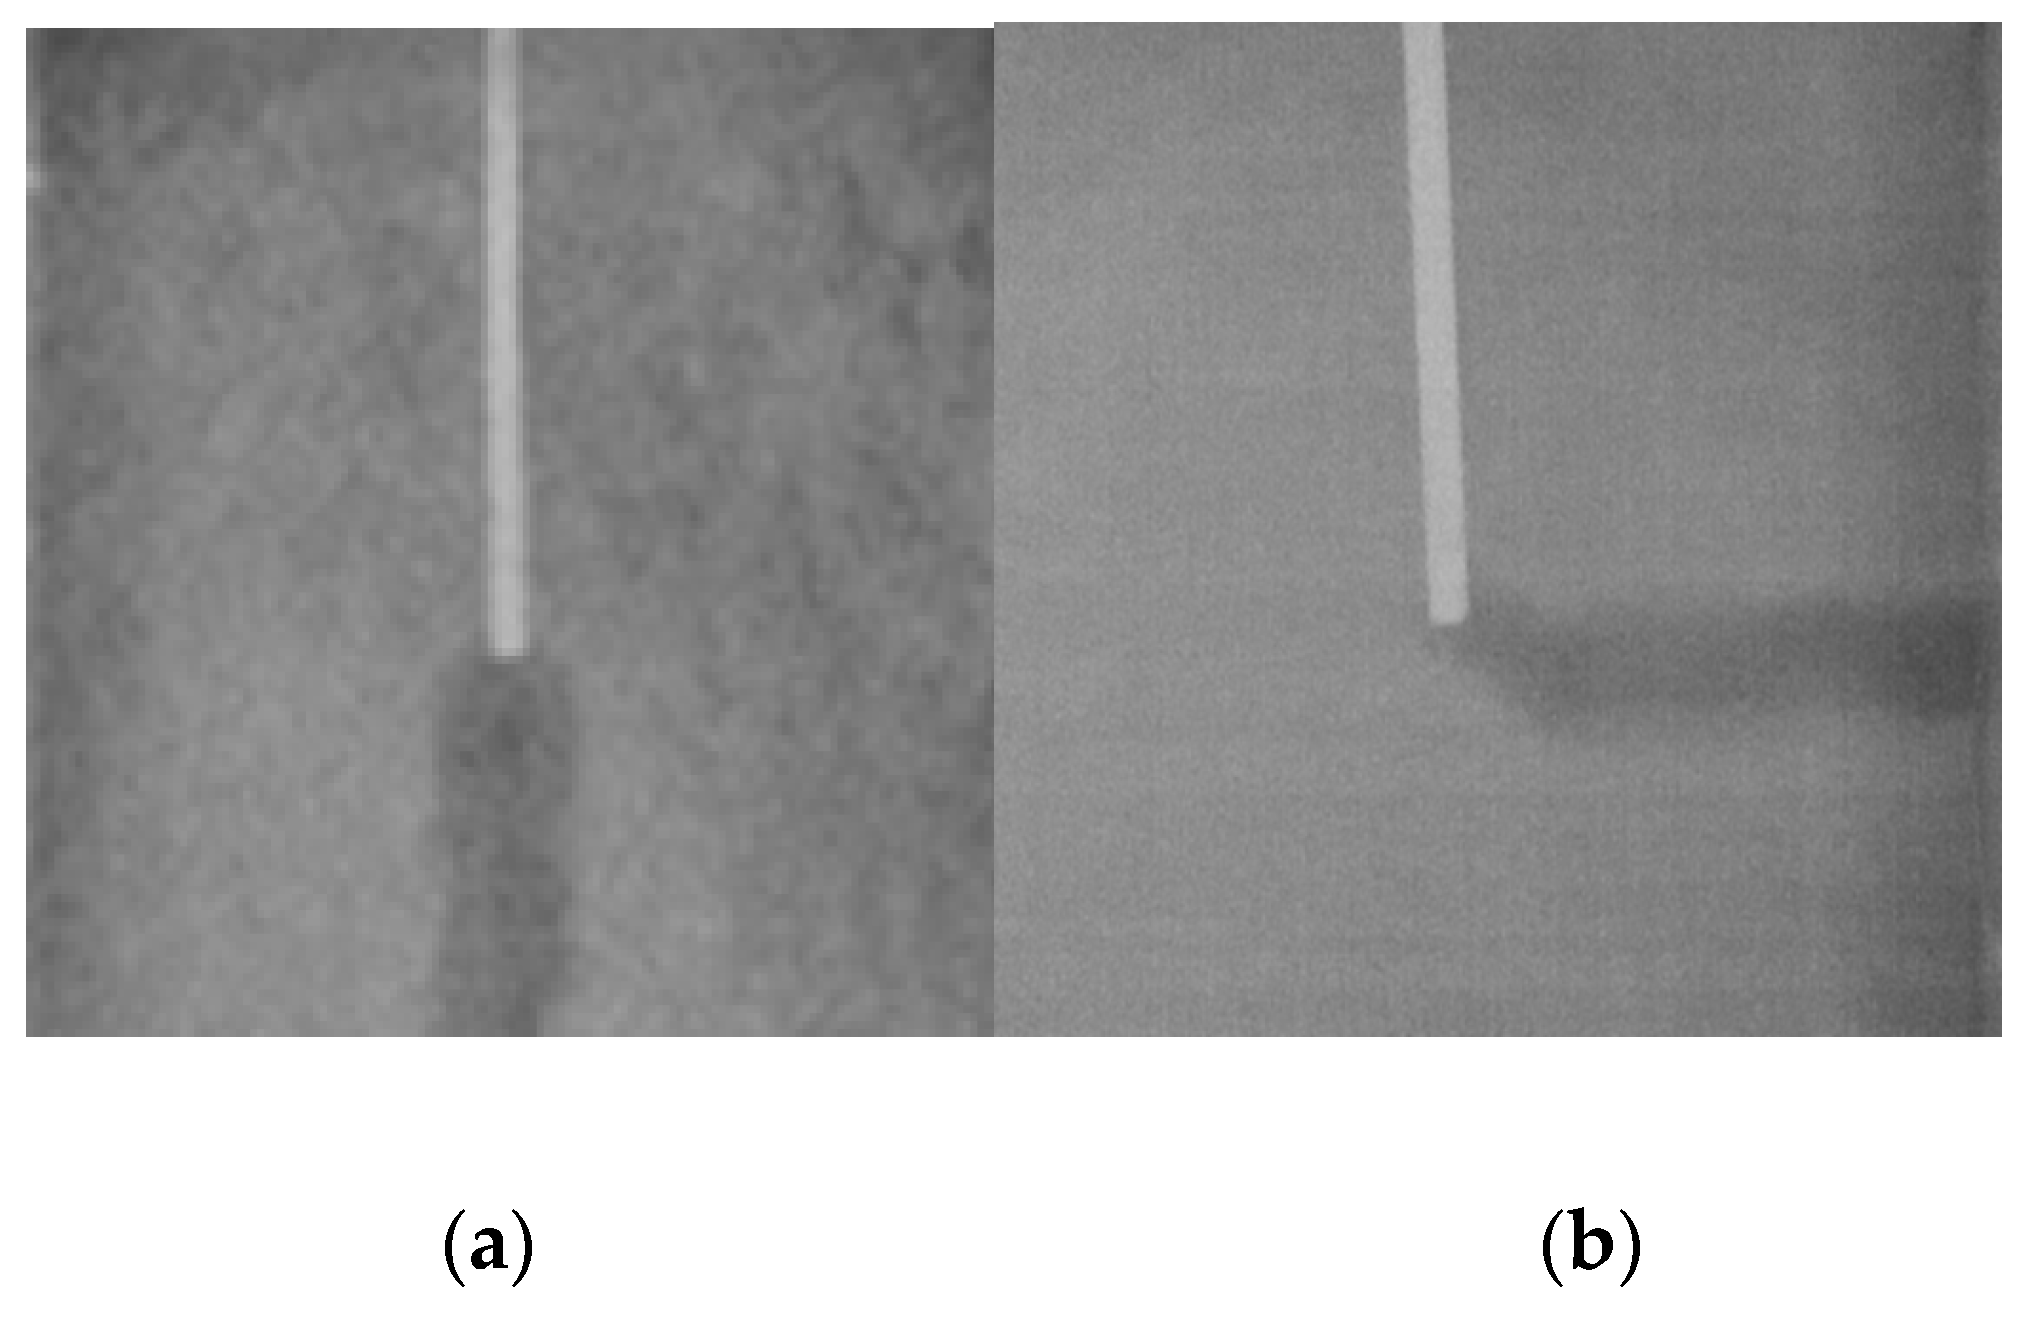
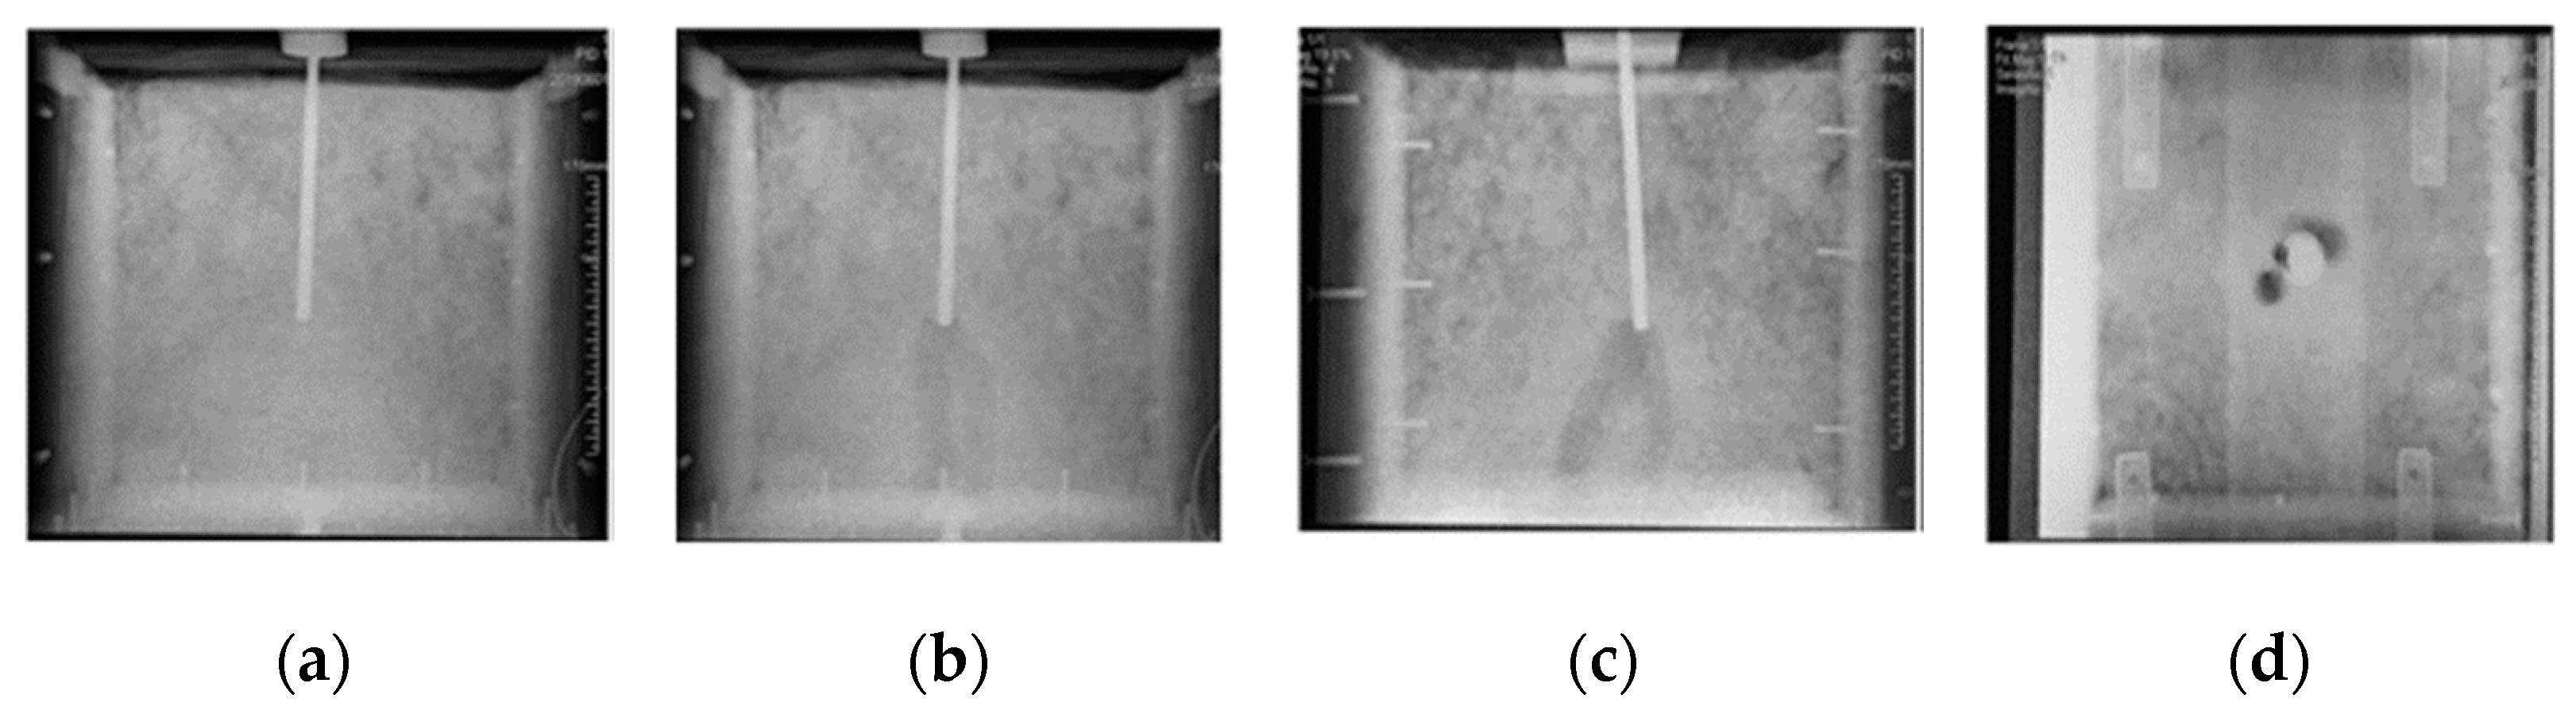
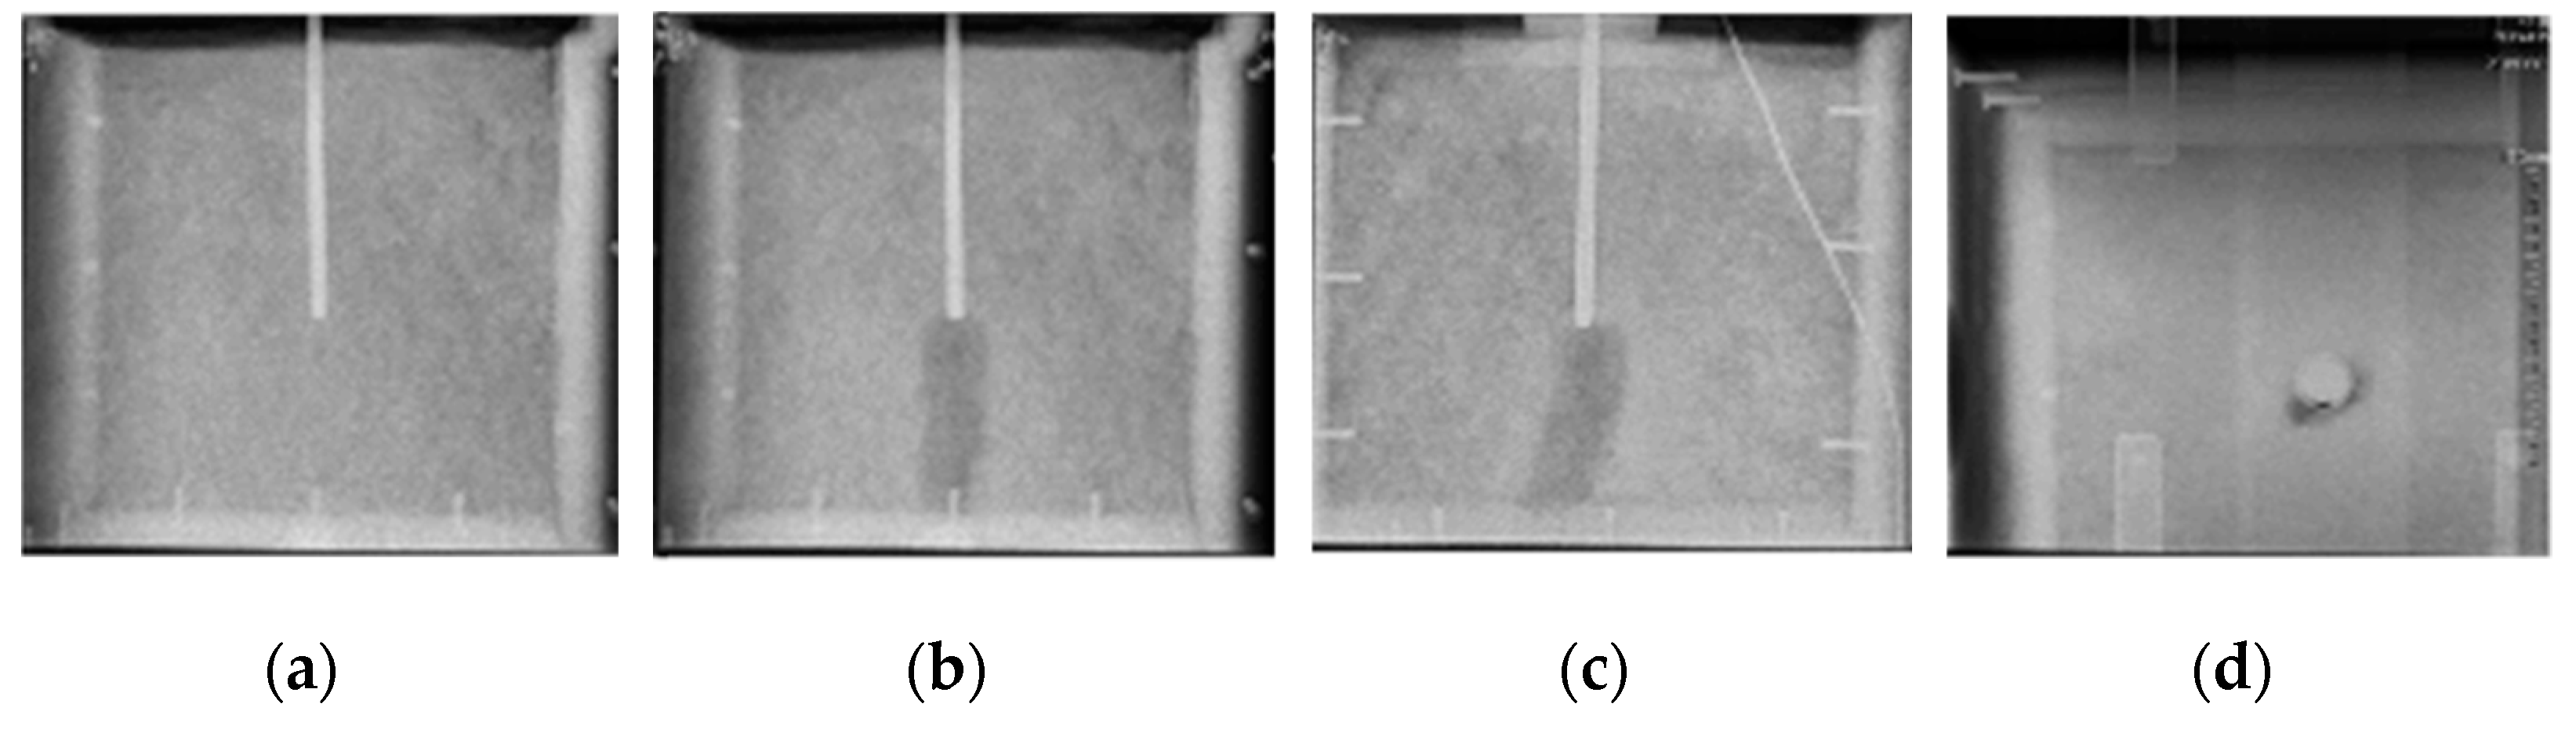
3. Test Method of Soil Impulse Dispersion near the Area of Ground Electrode
4. Study on the Validity of the Paper’s Method and the Main Influence Factors
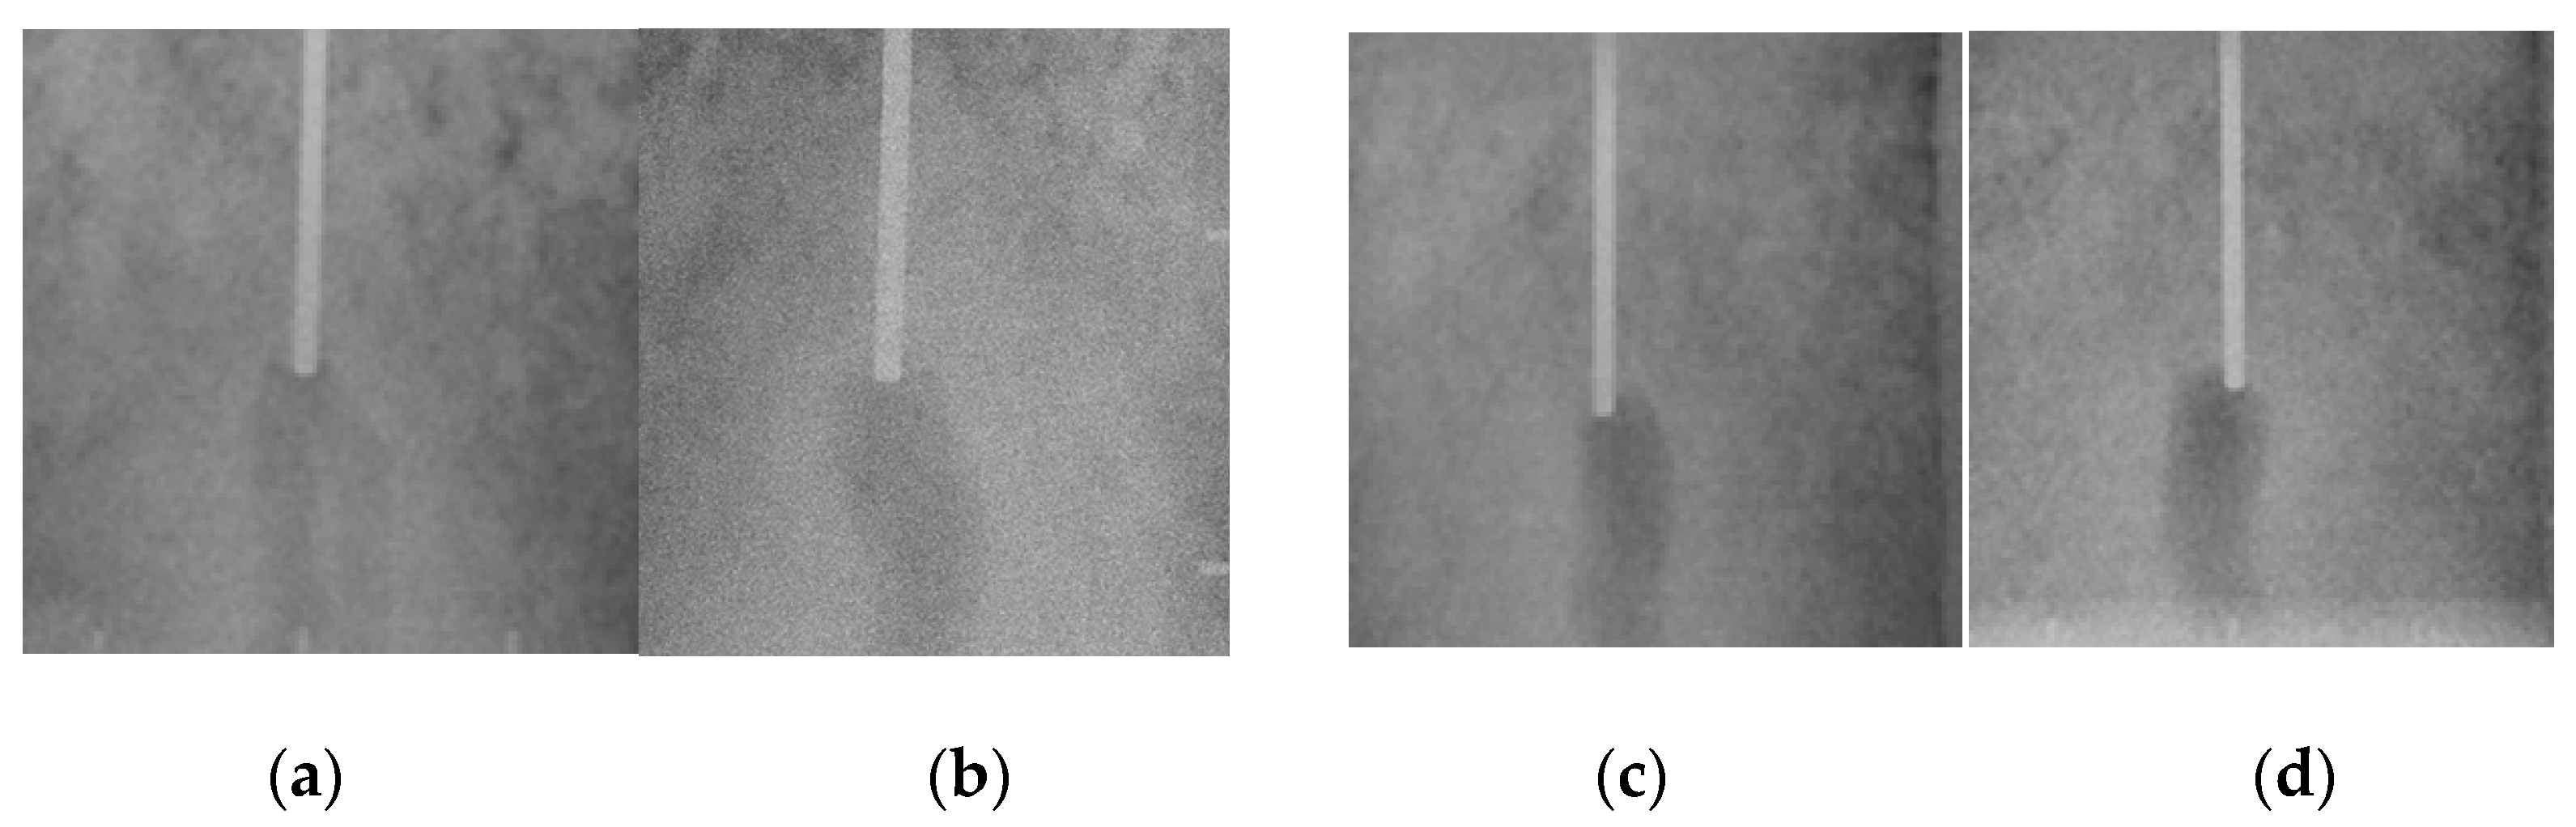
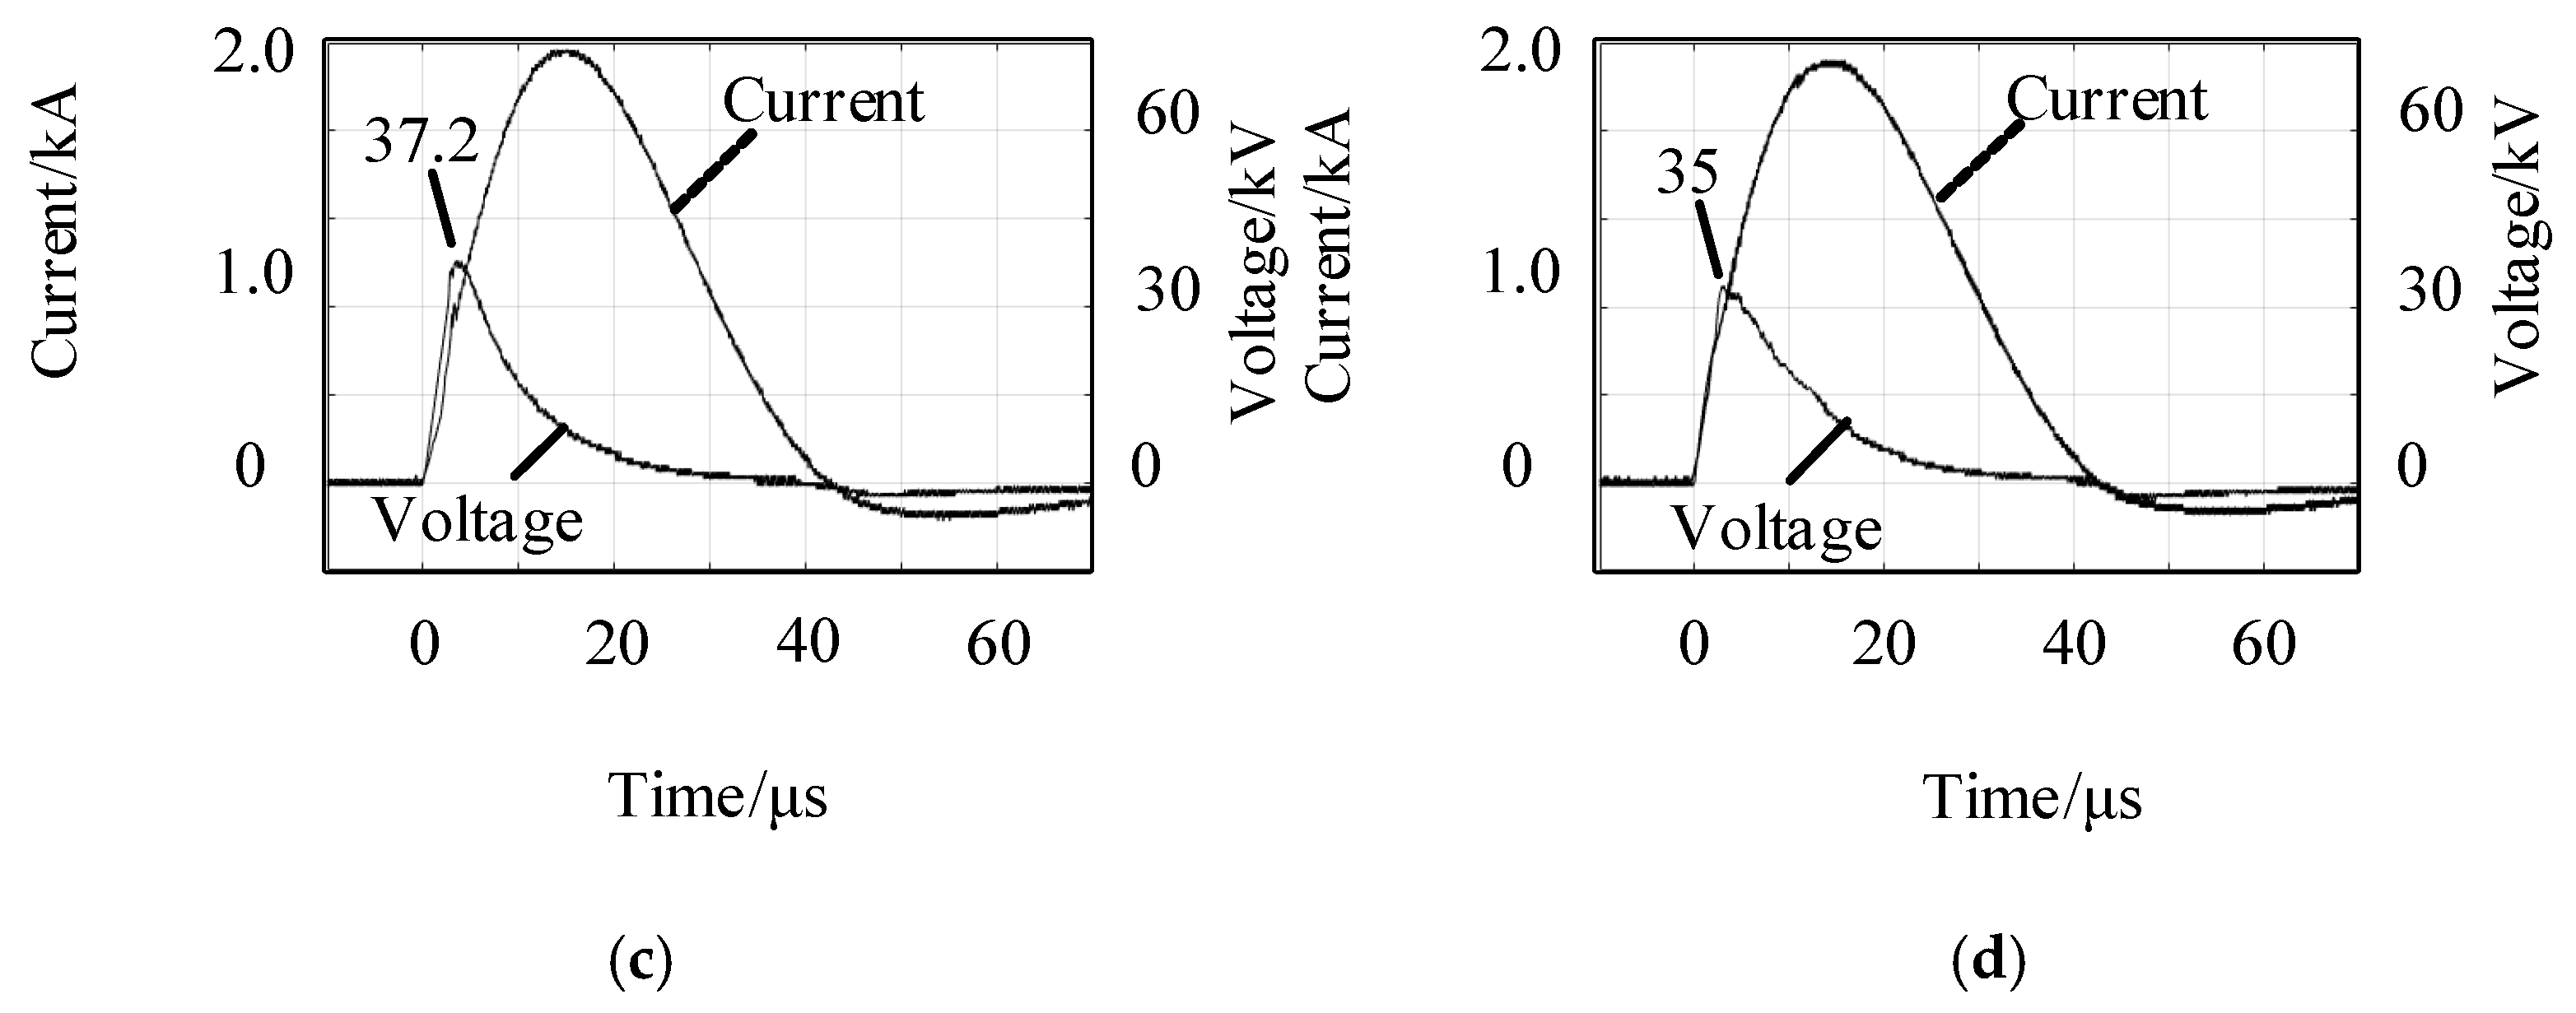
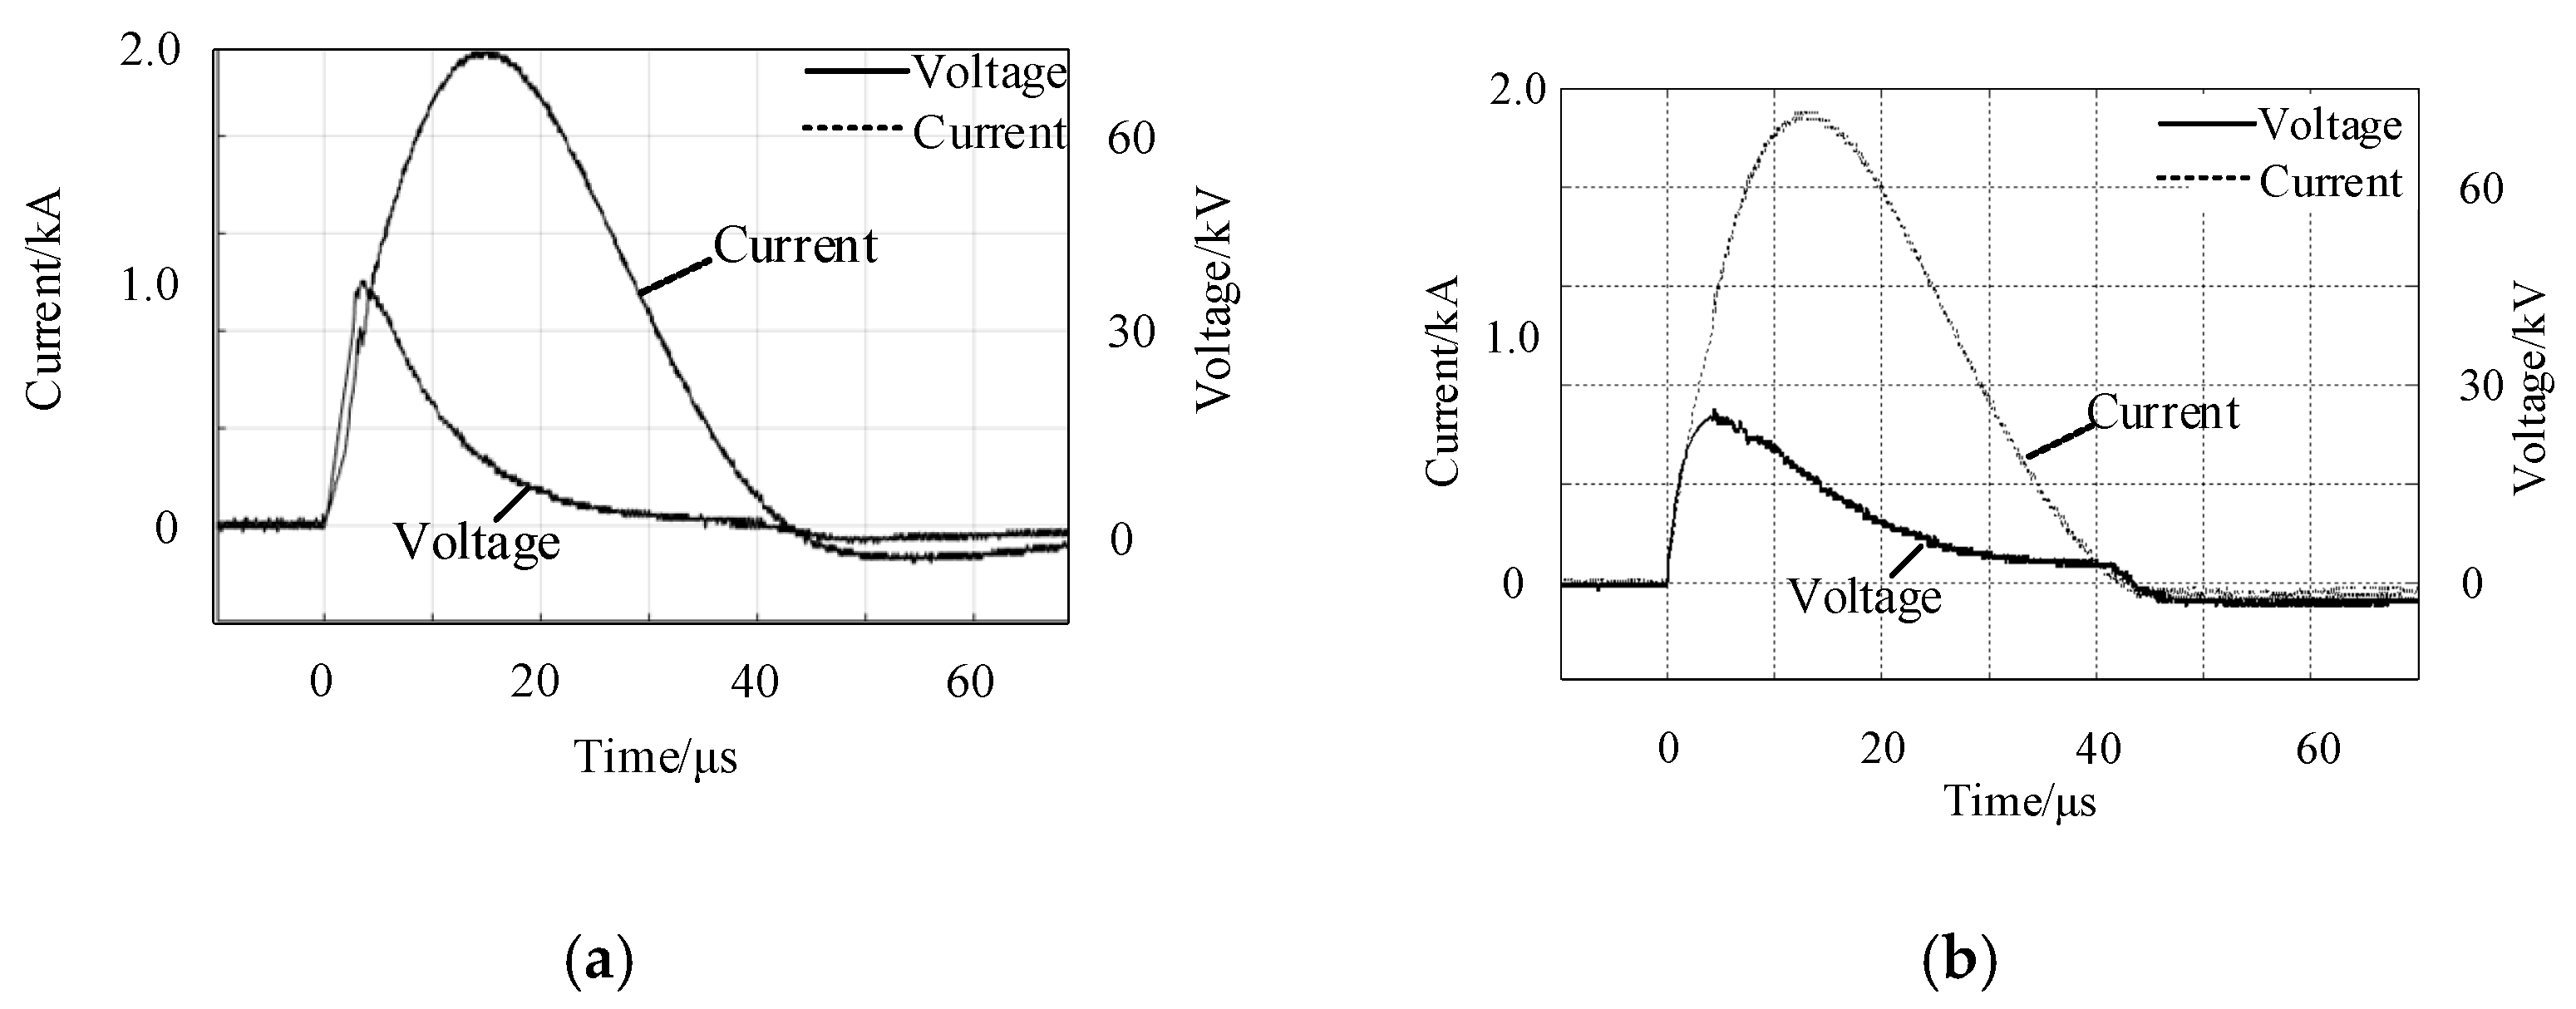
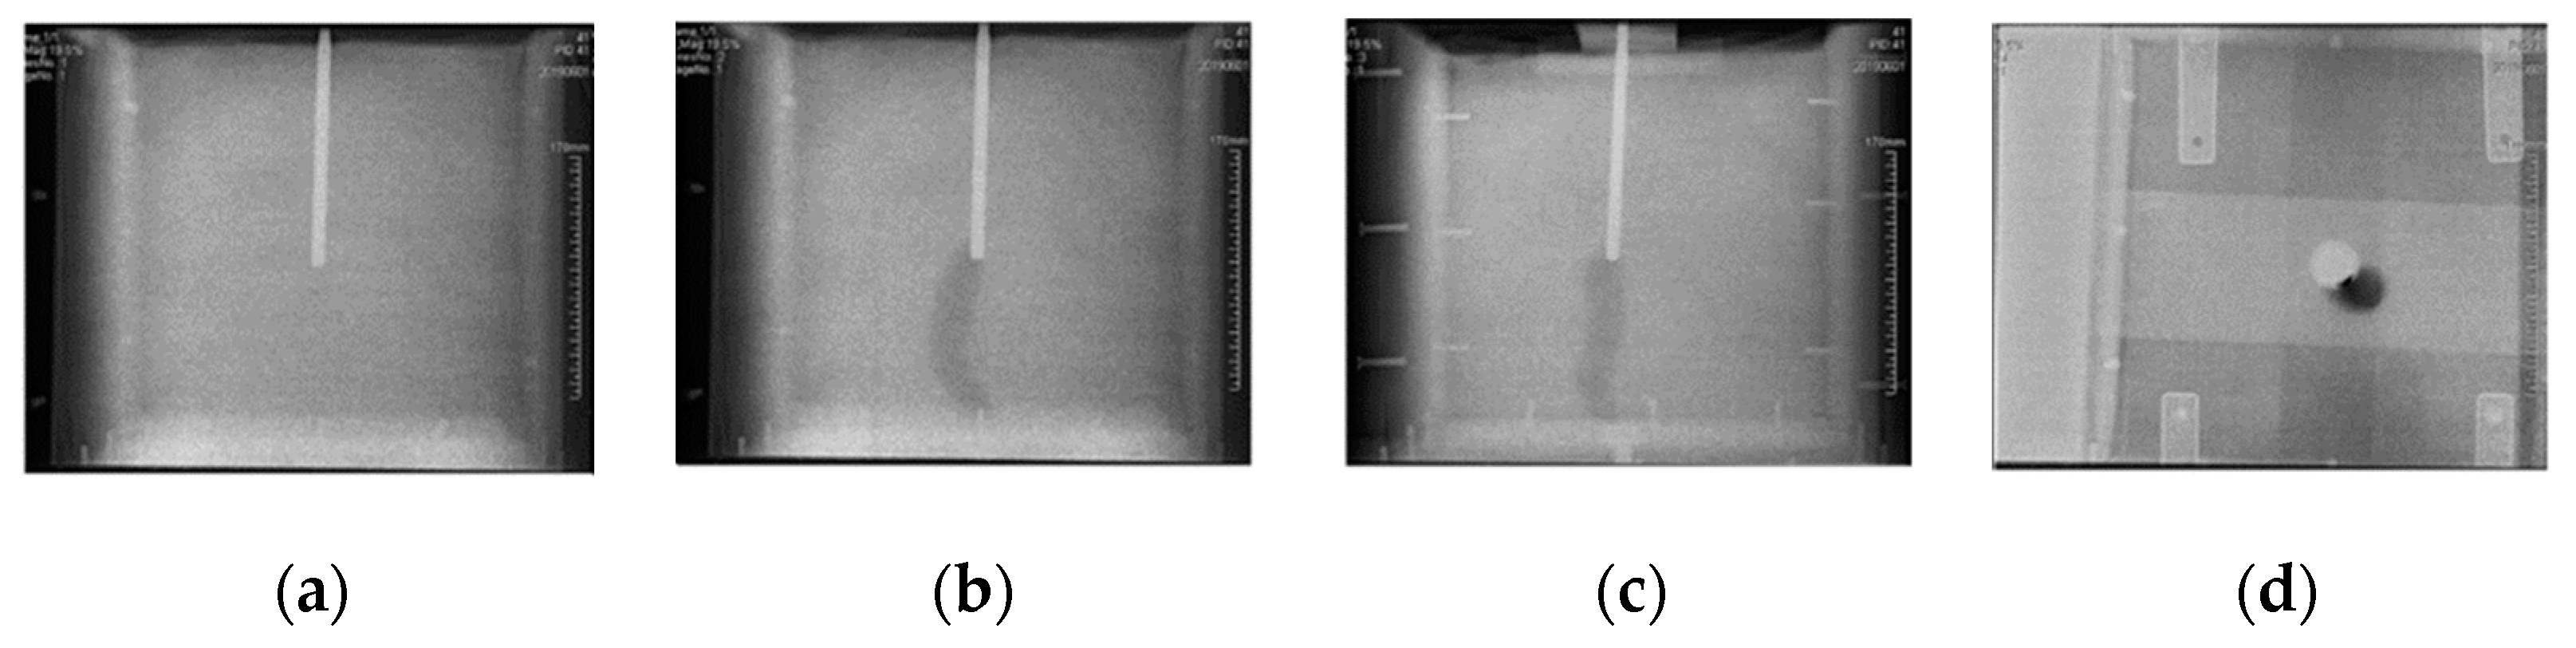
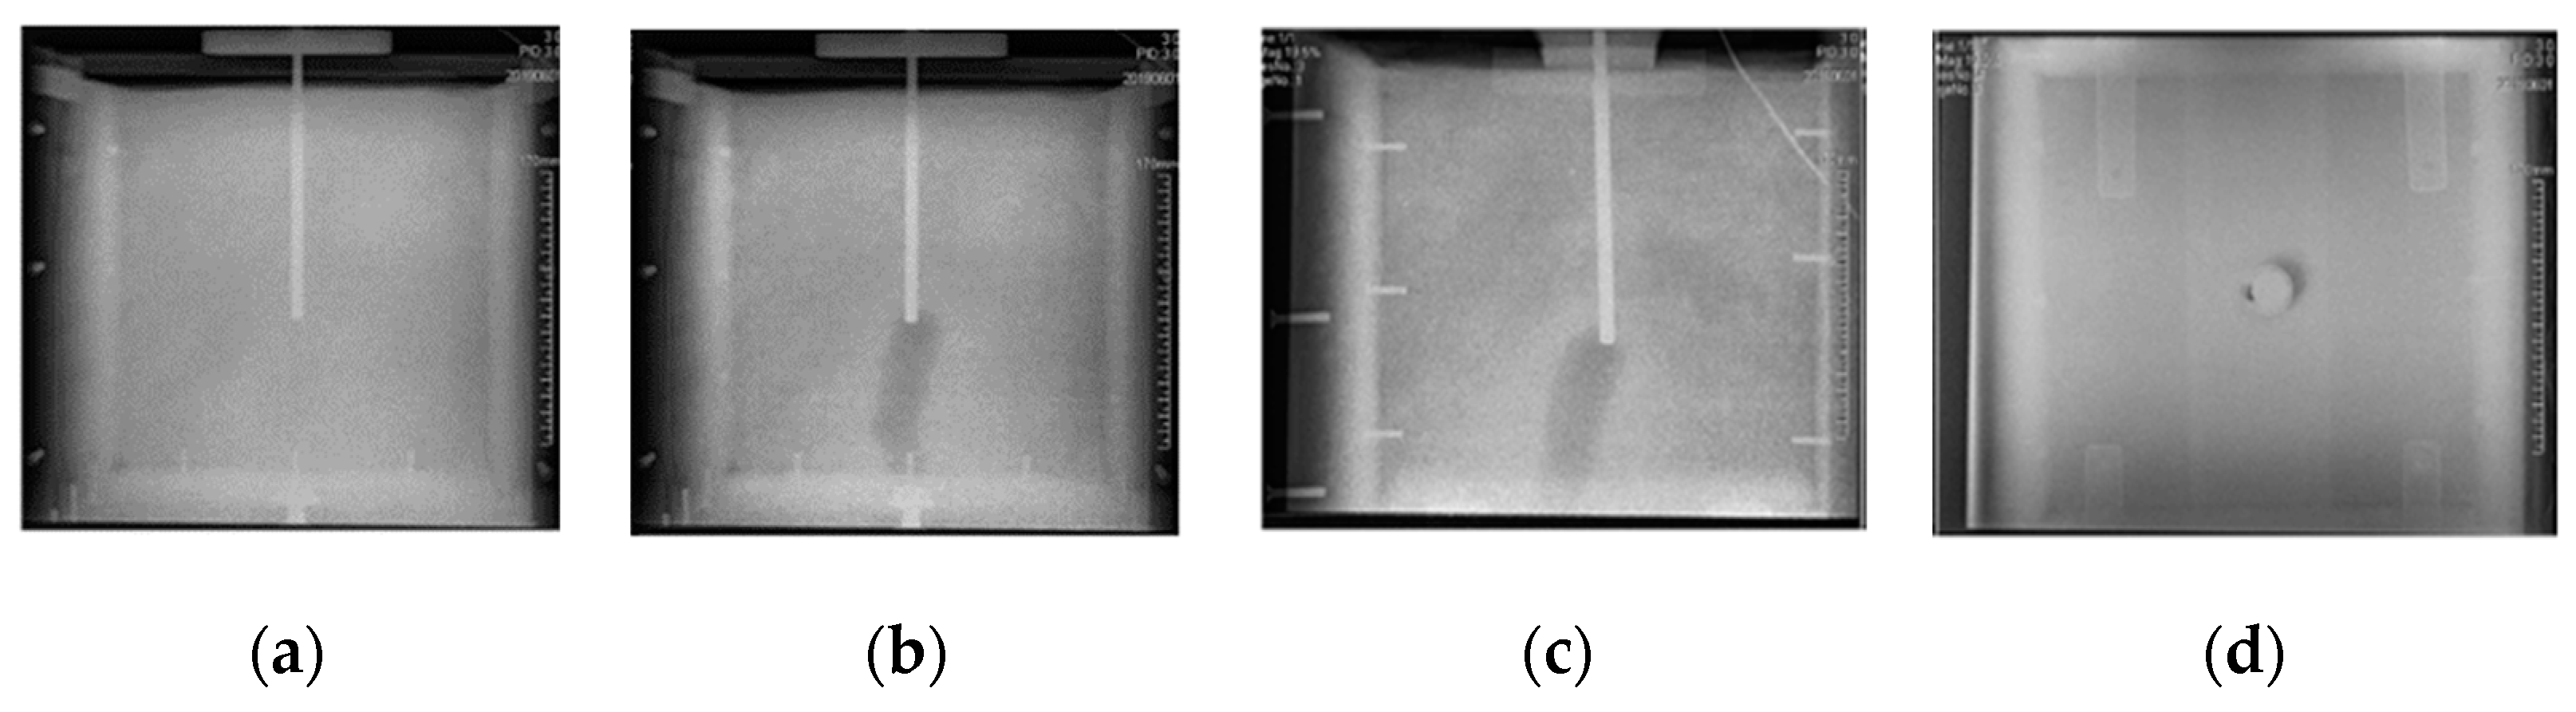
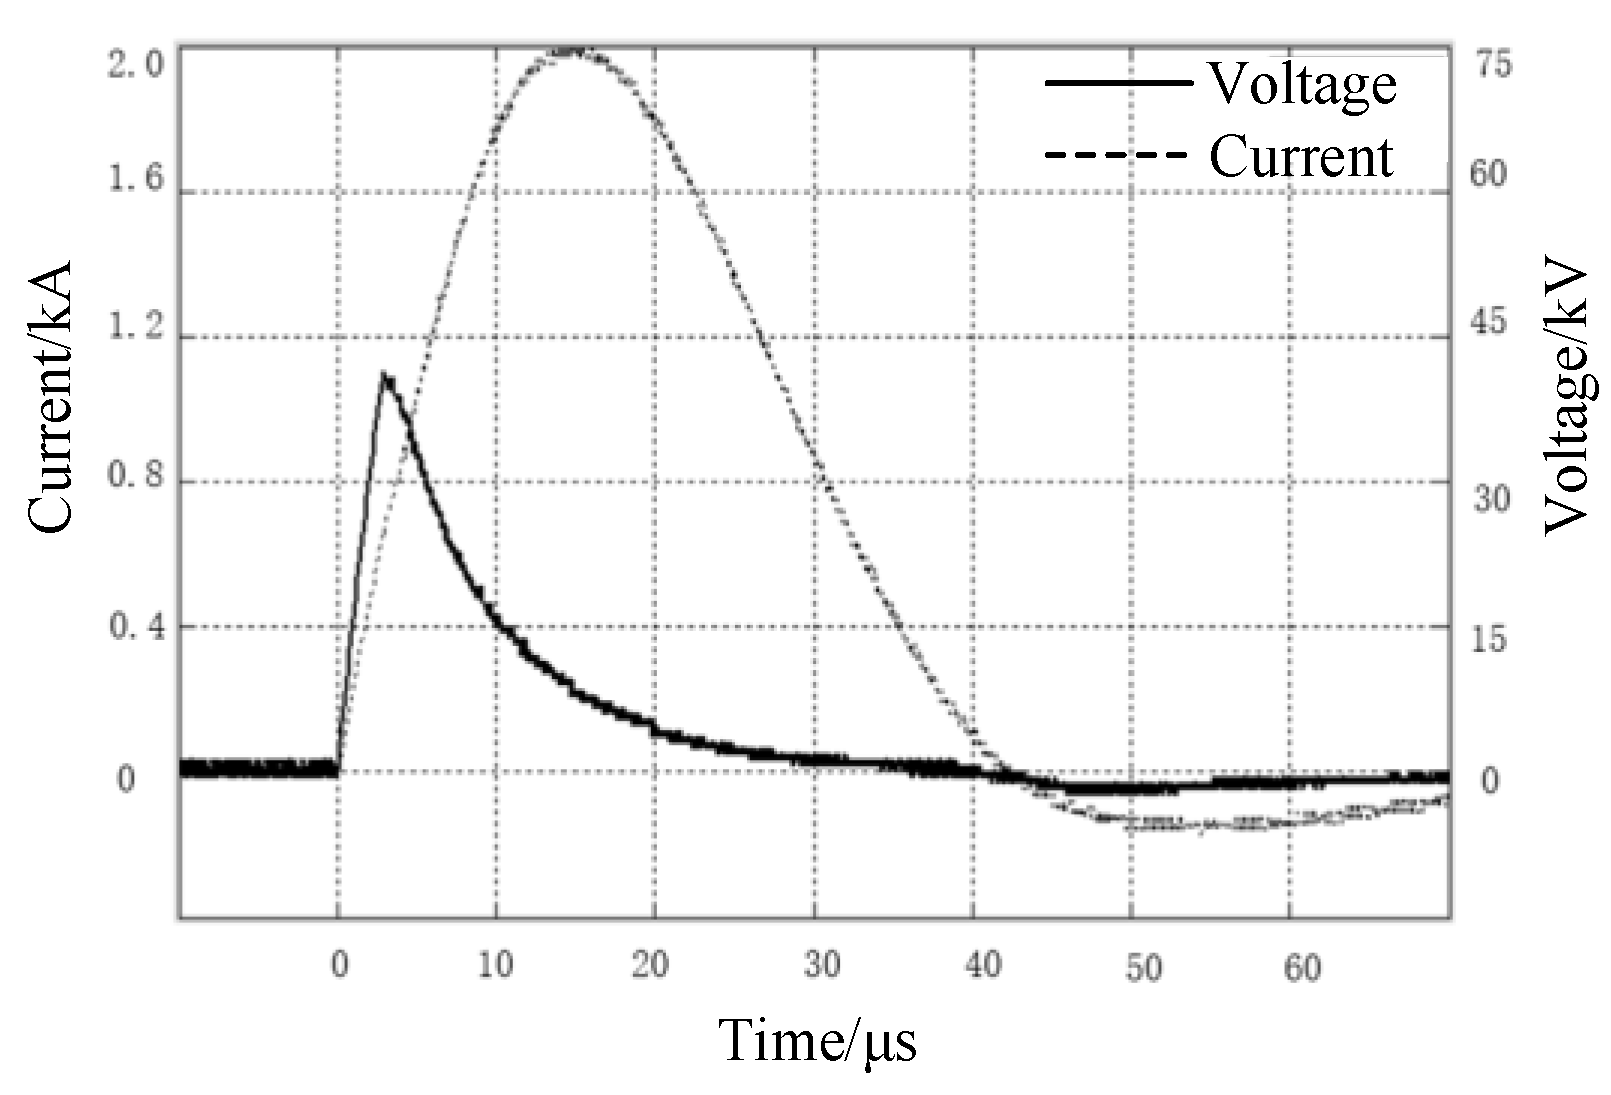
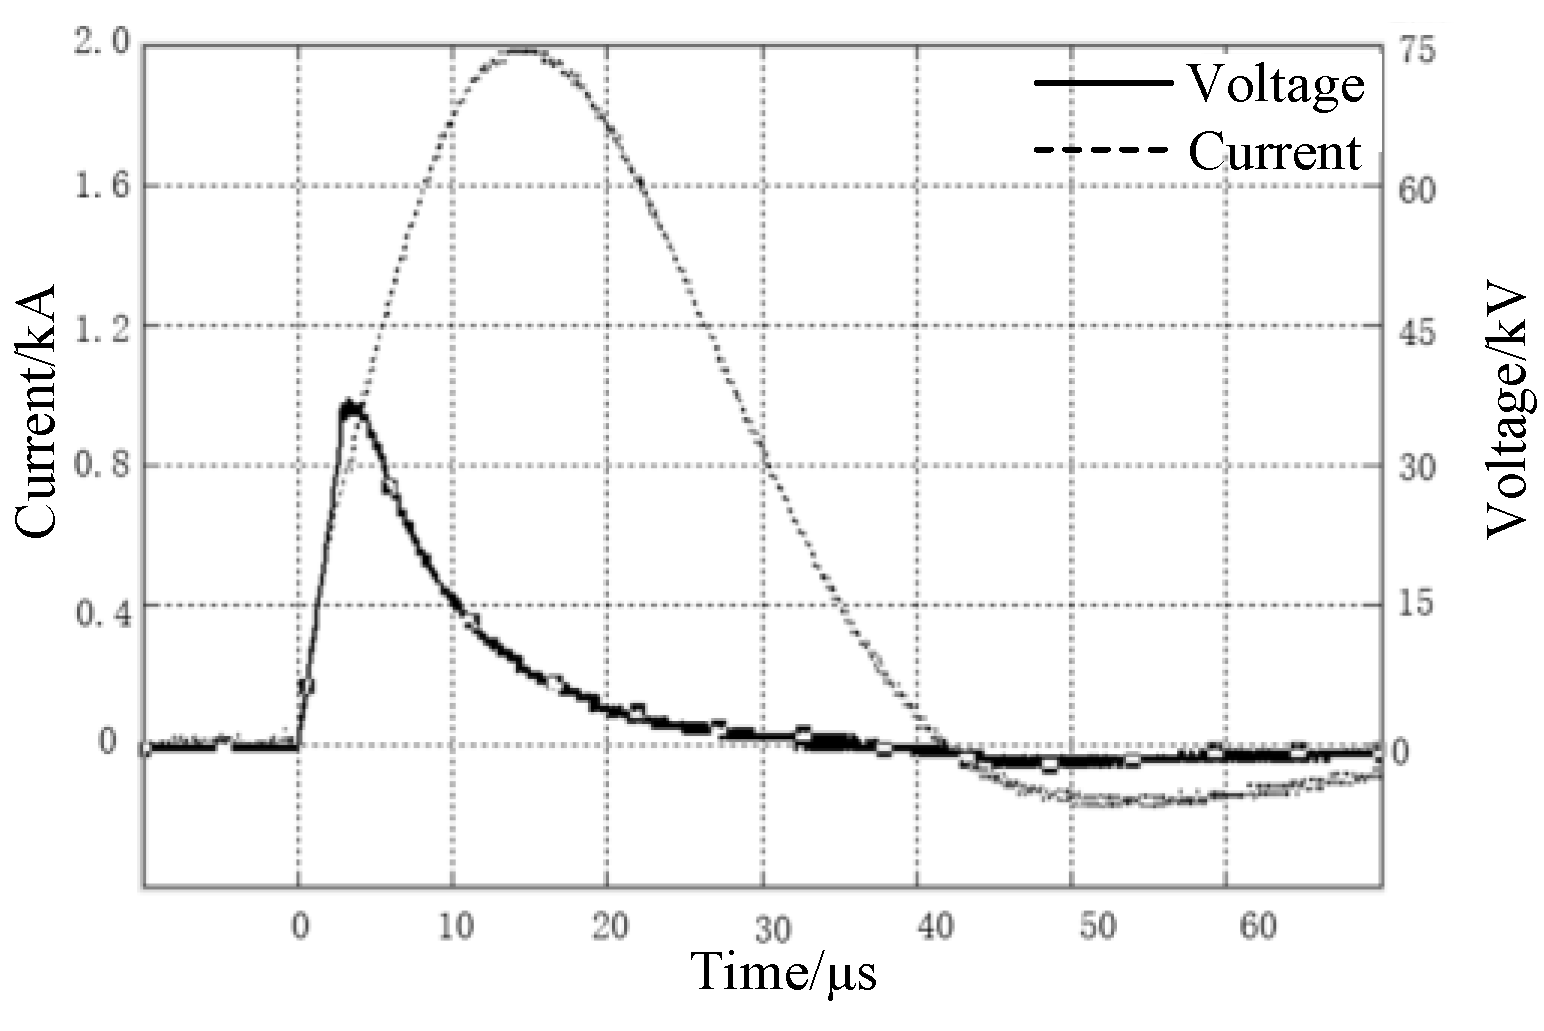
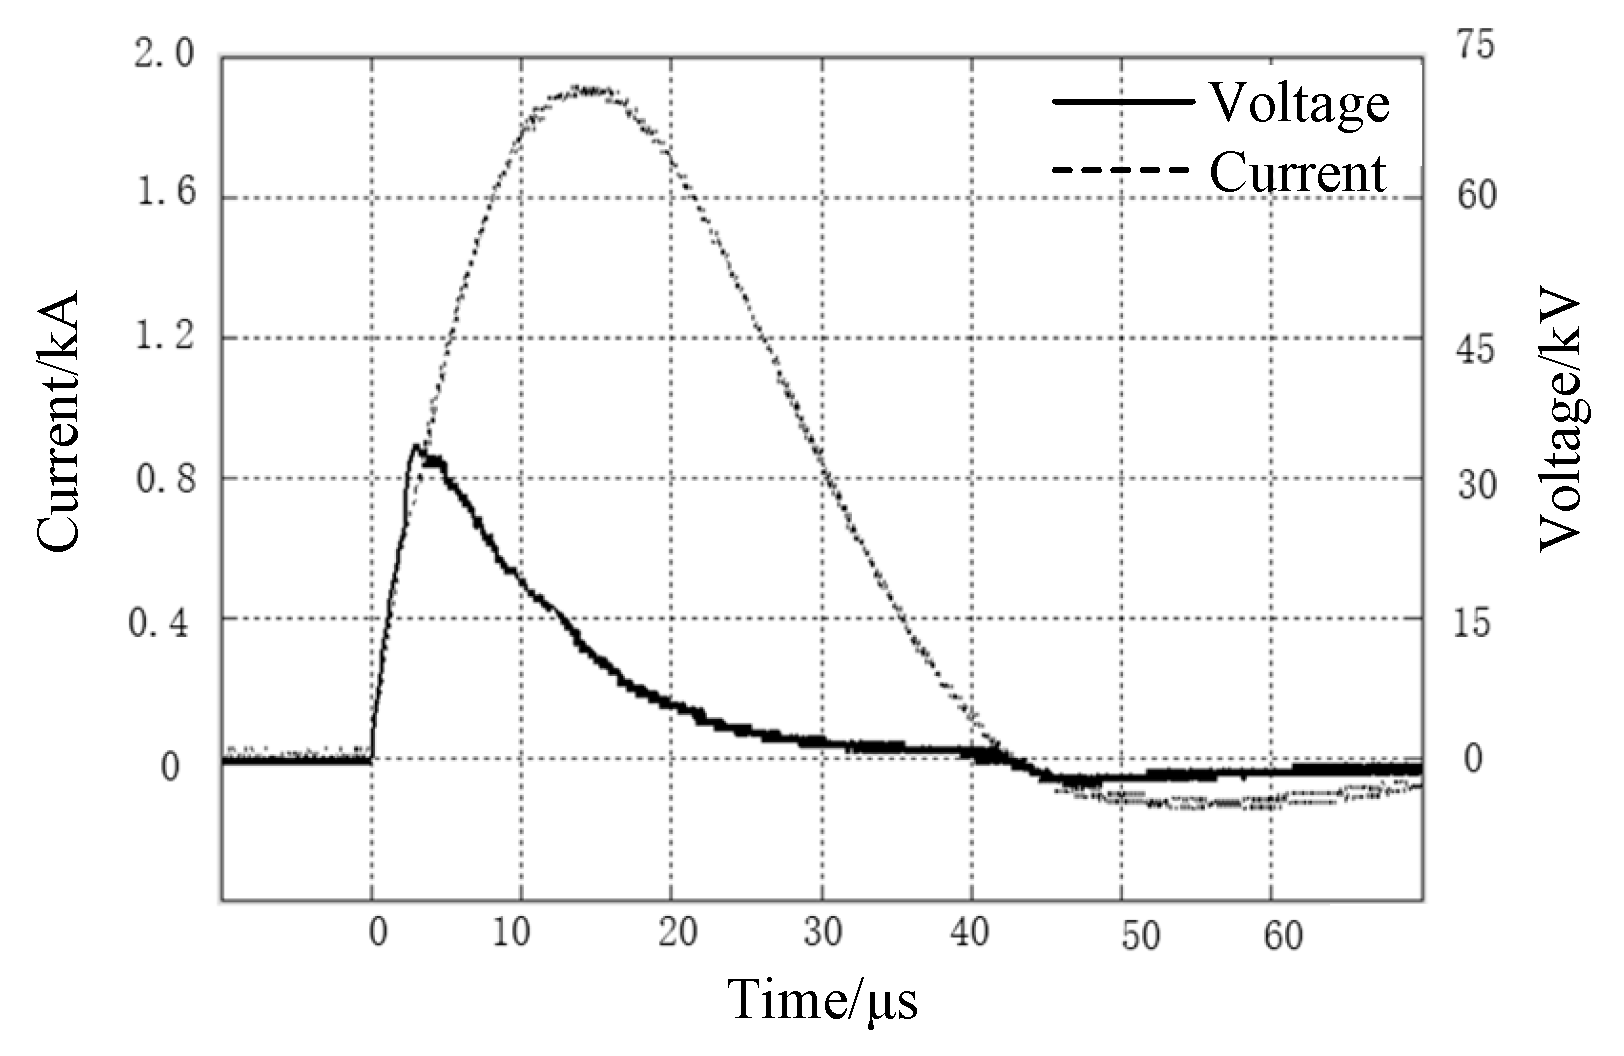
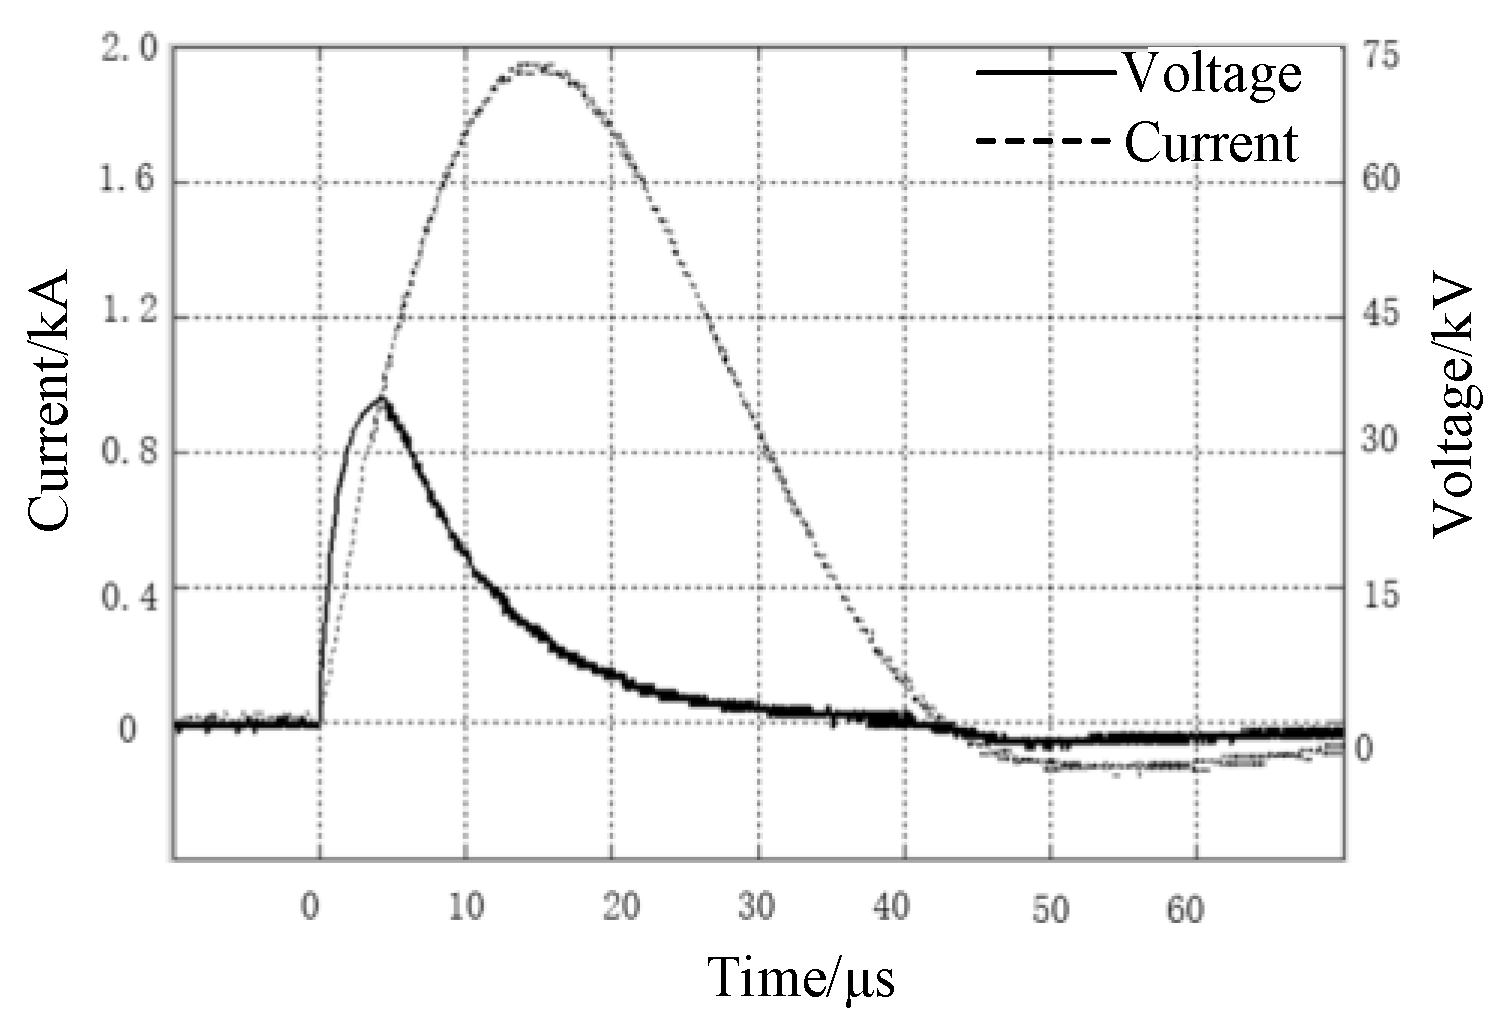
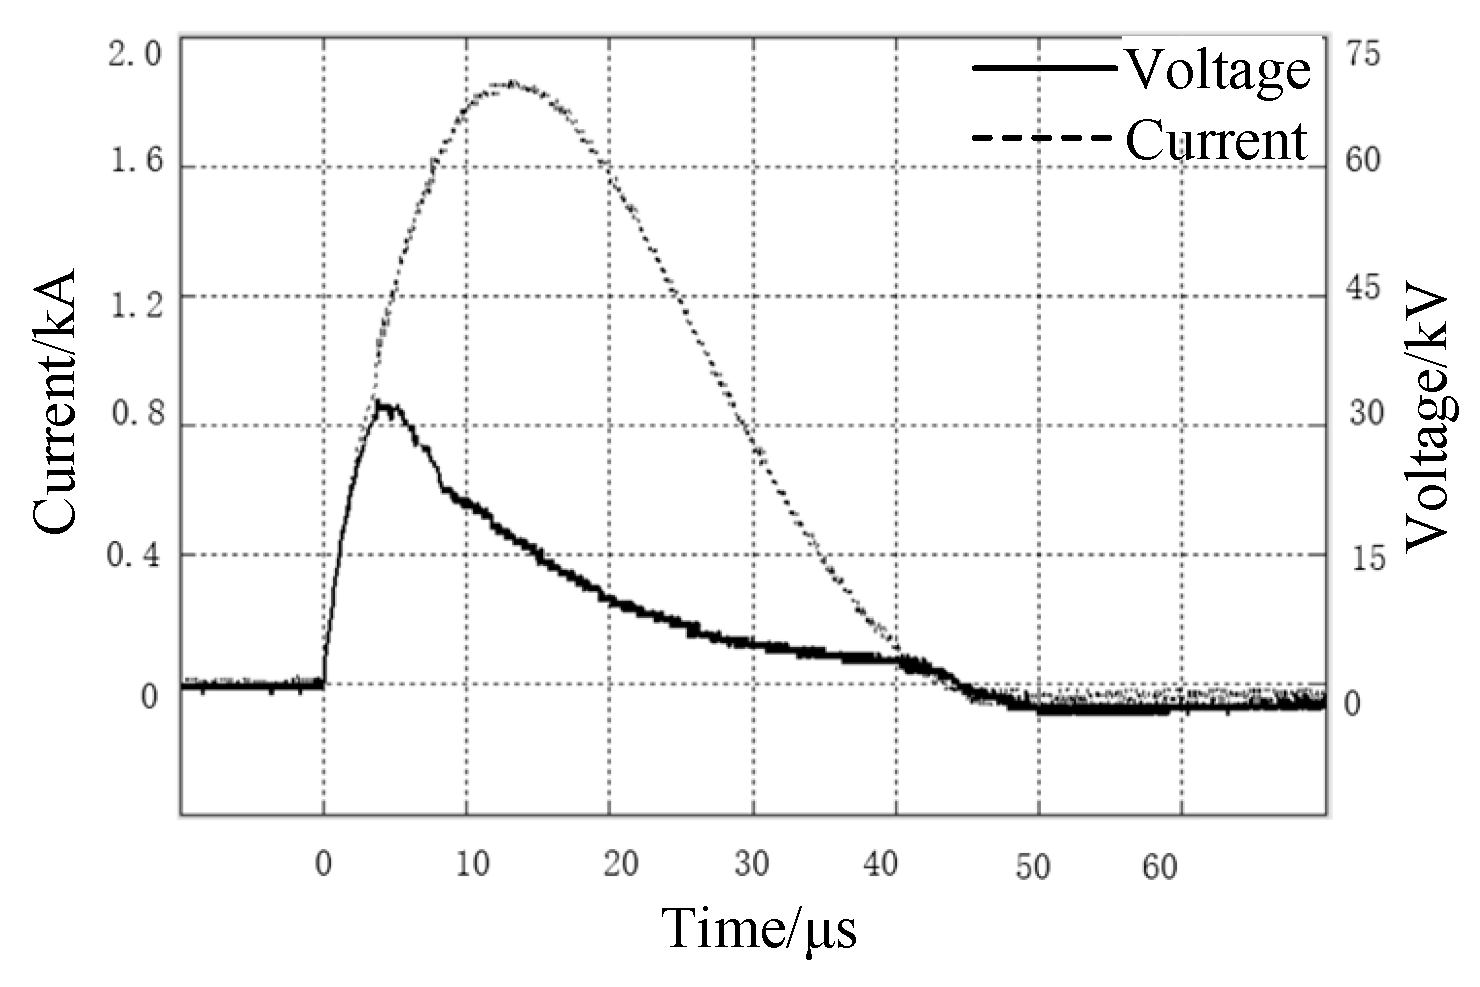
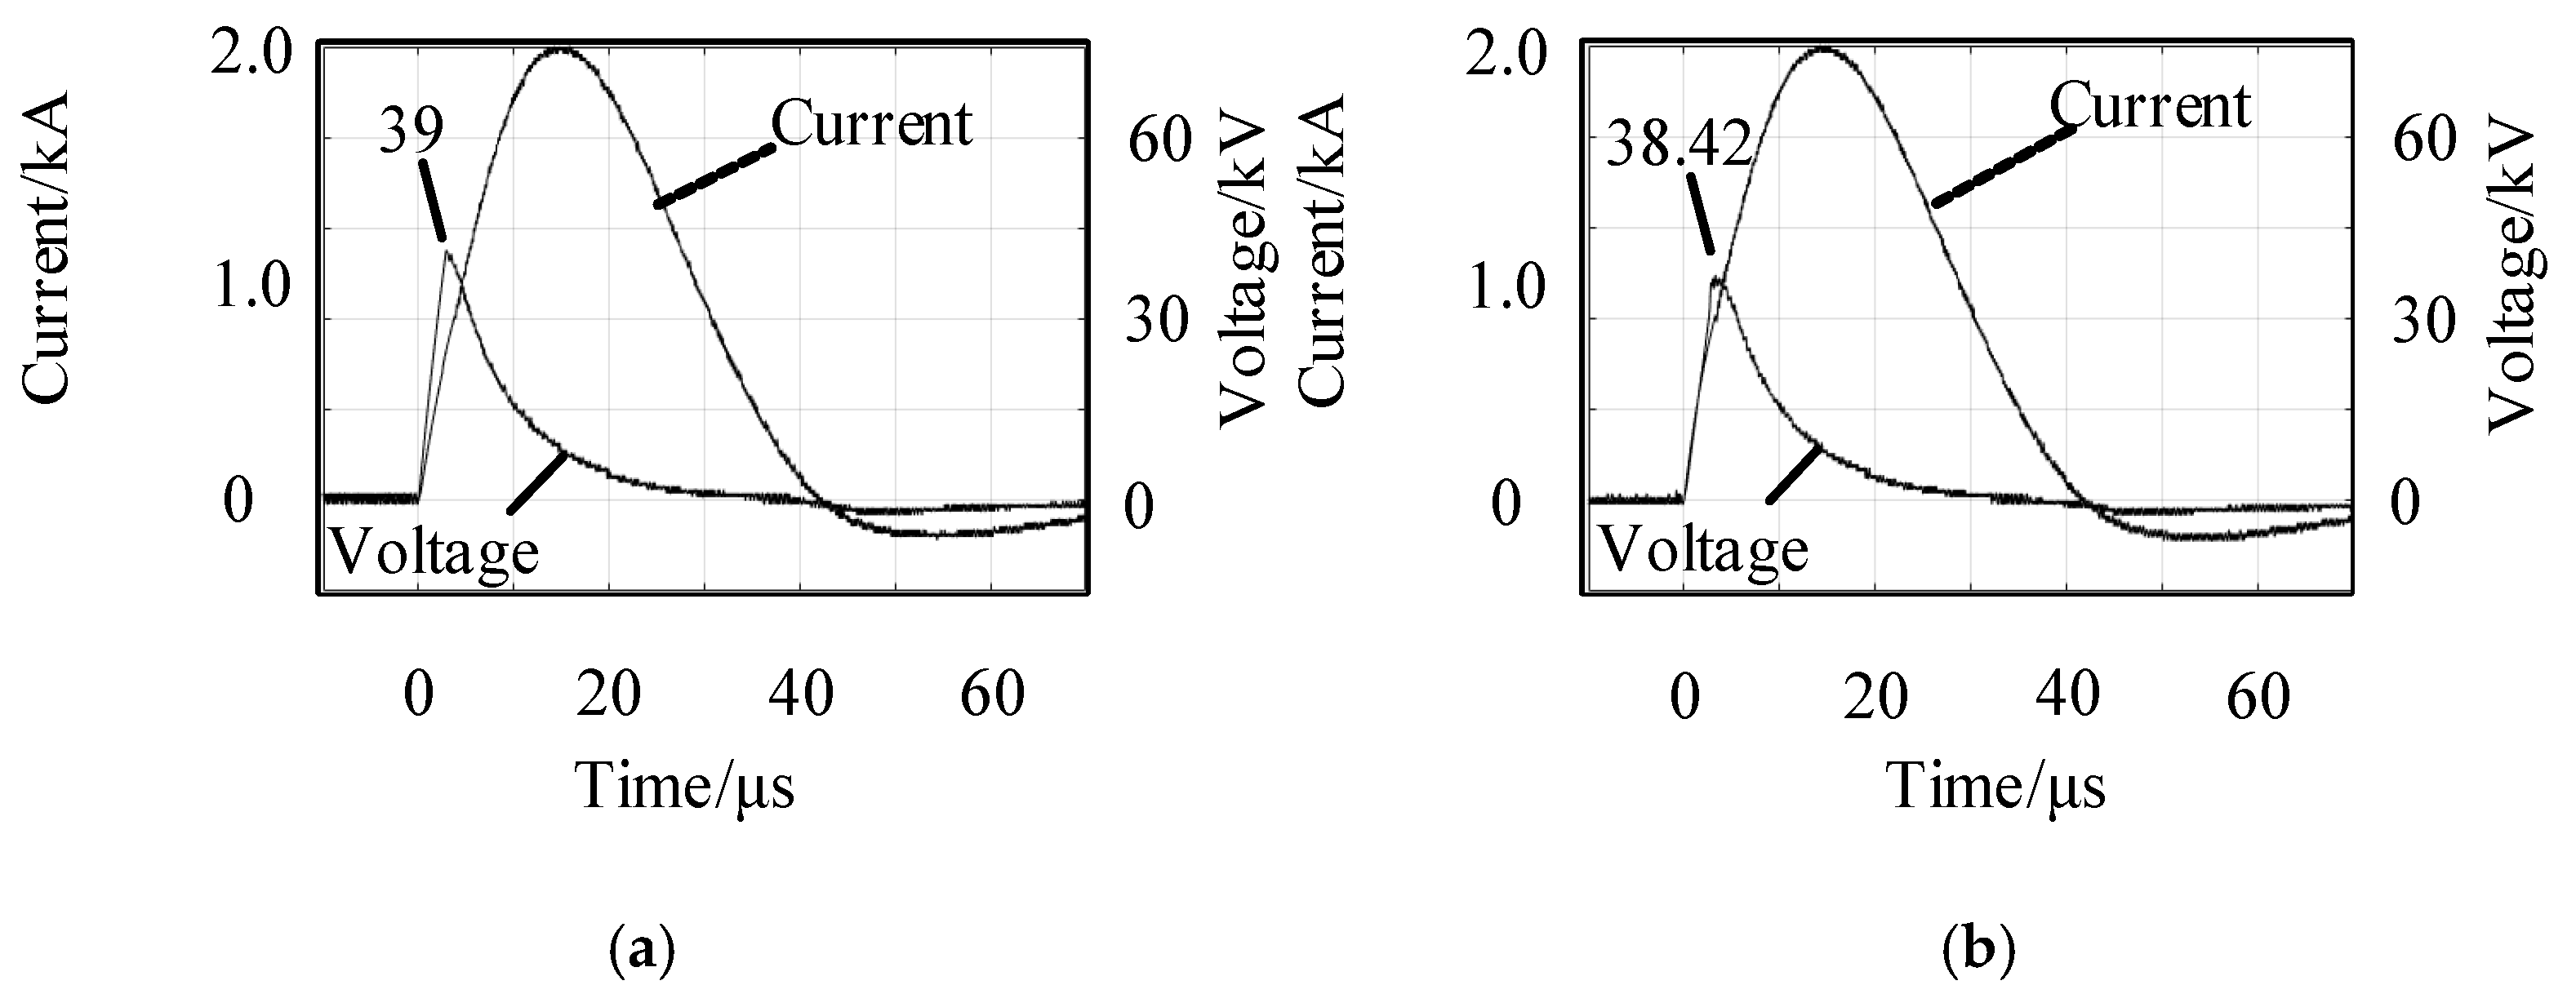
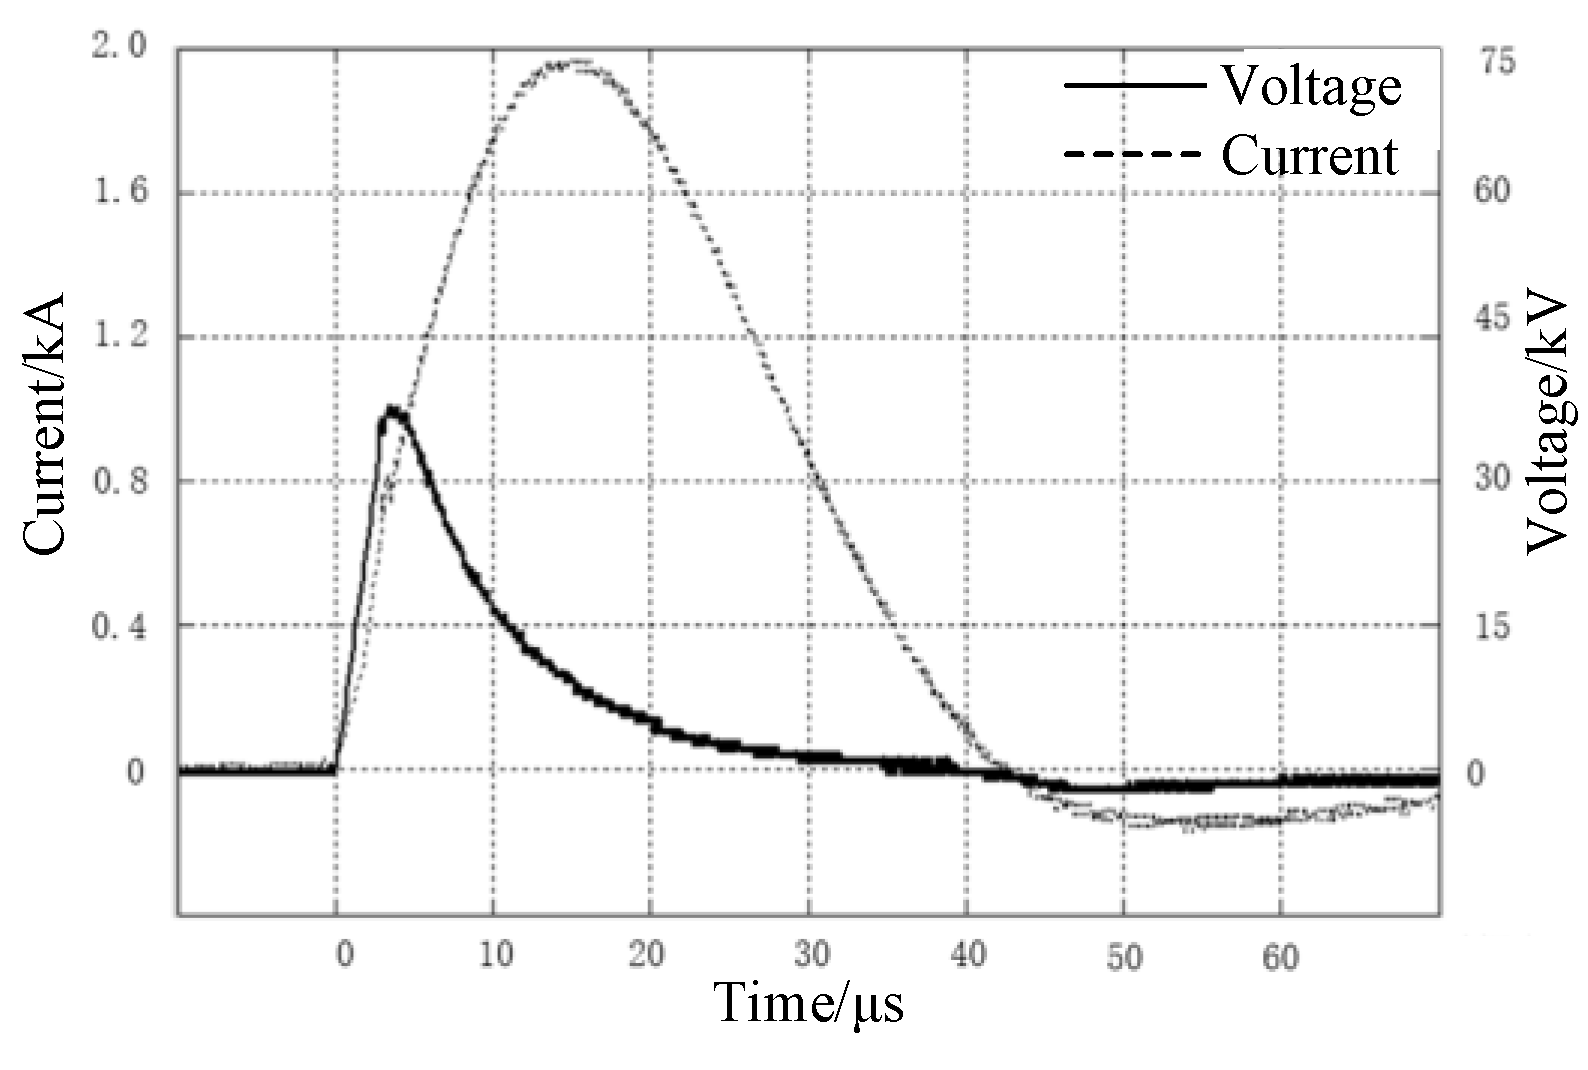
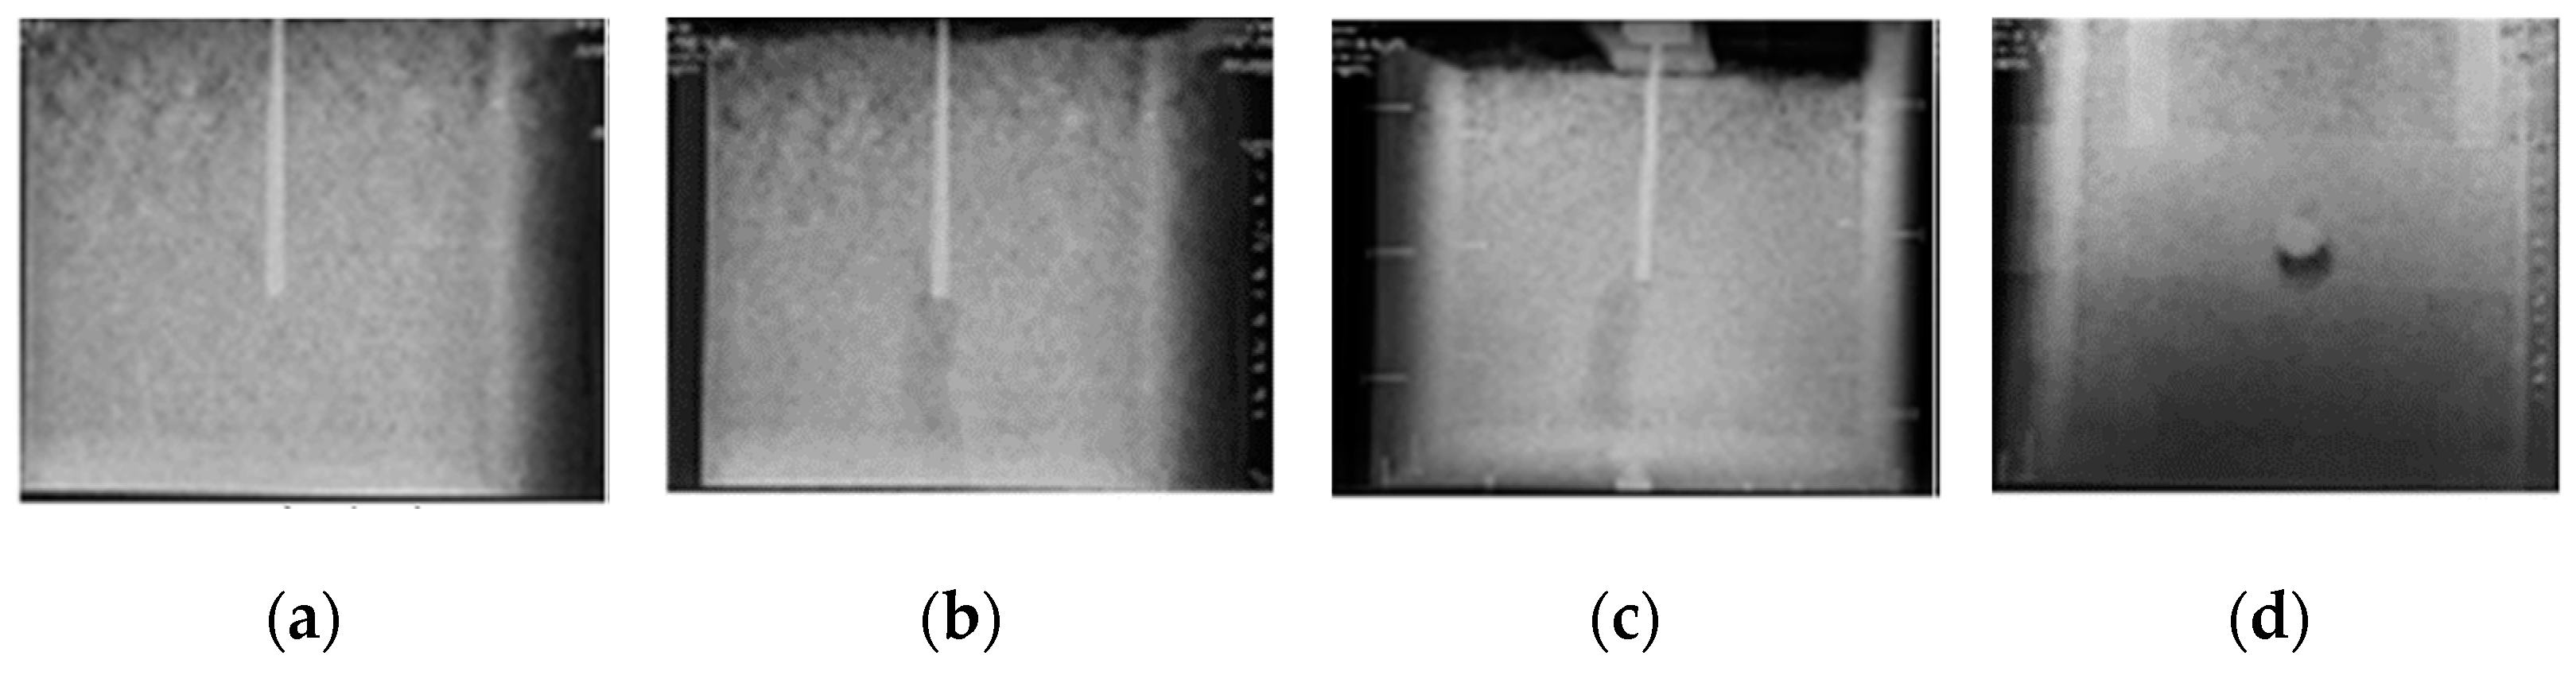
4.1. The Validity Analysis of the Method for Evaluating the Near-Area Soil Impulse Dispersion Capacity
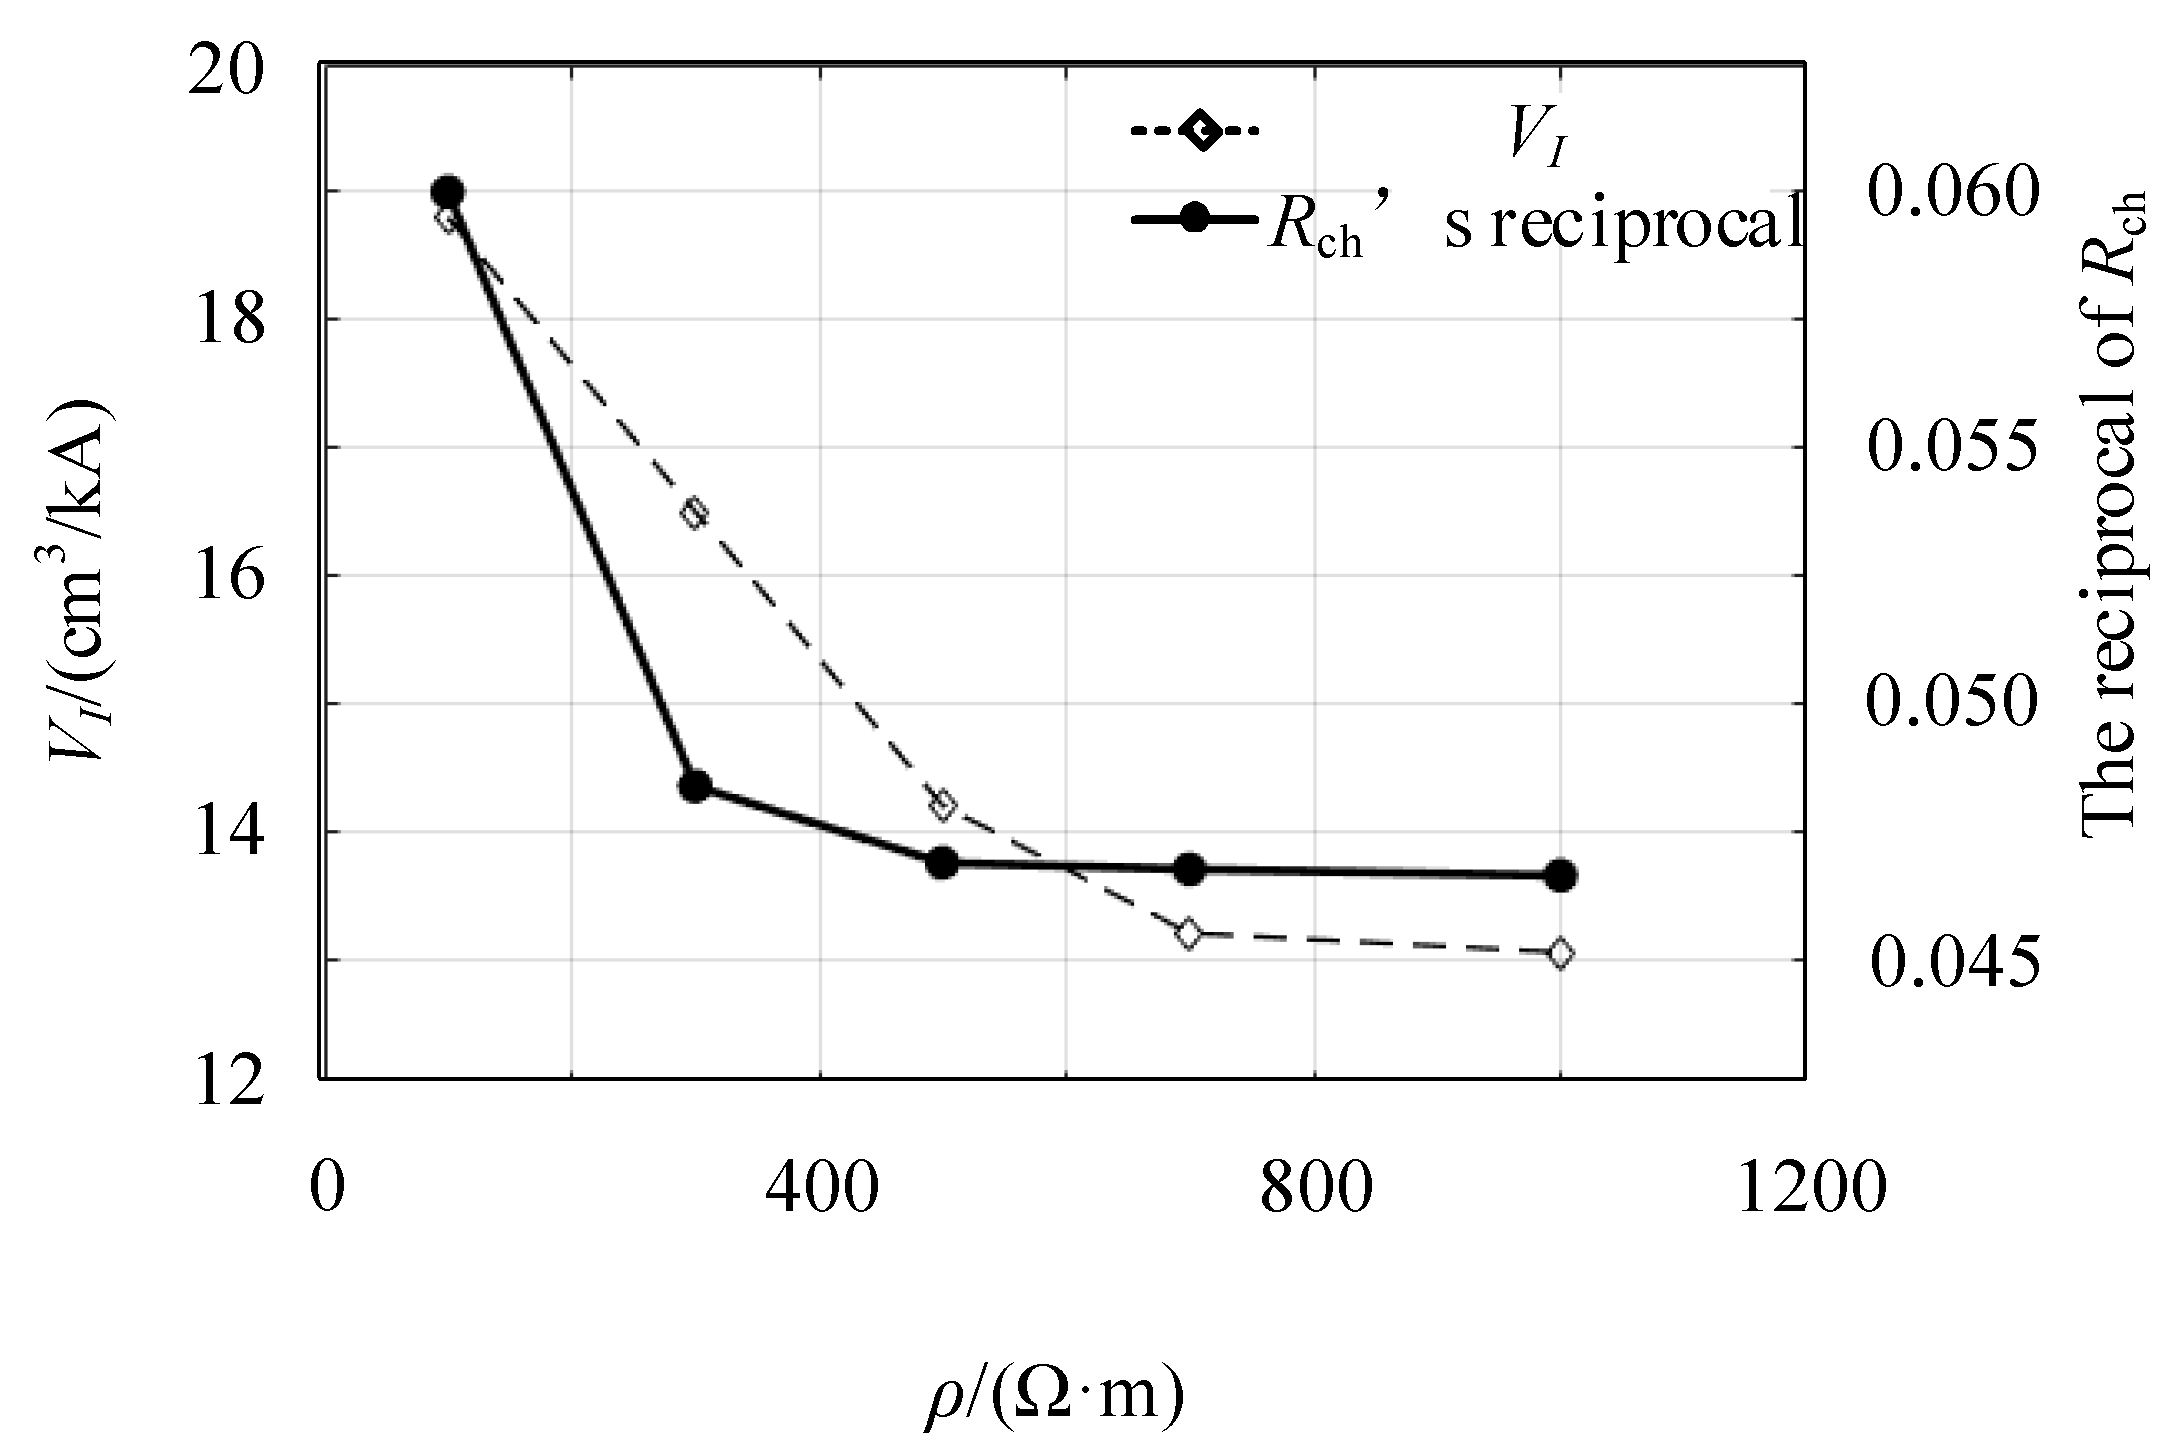
4.2. Correlation Analysis between VI and Rch
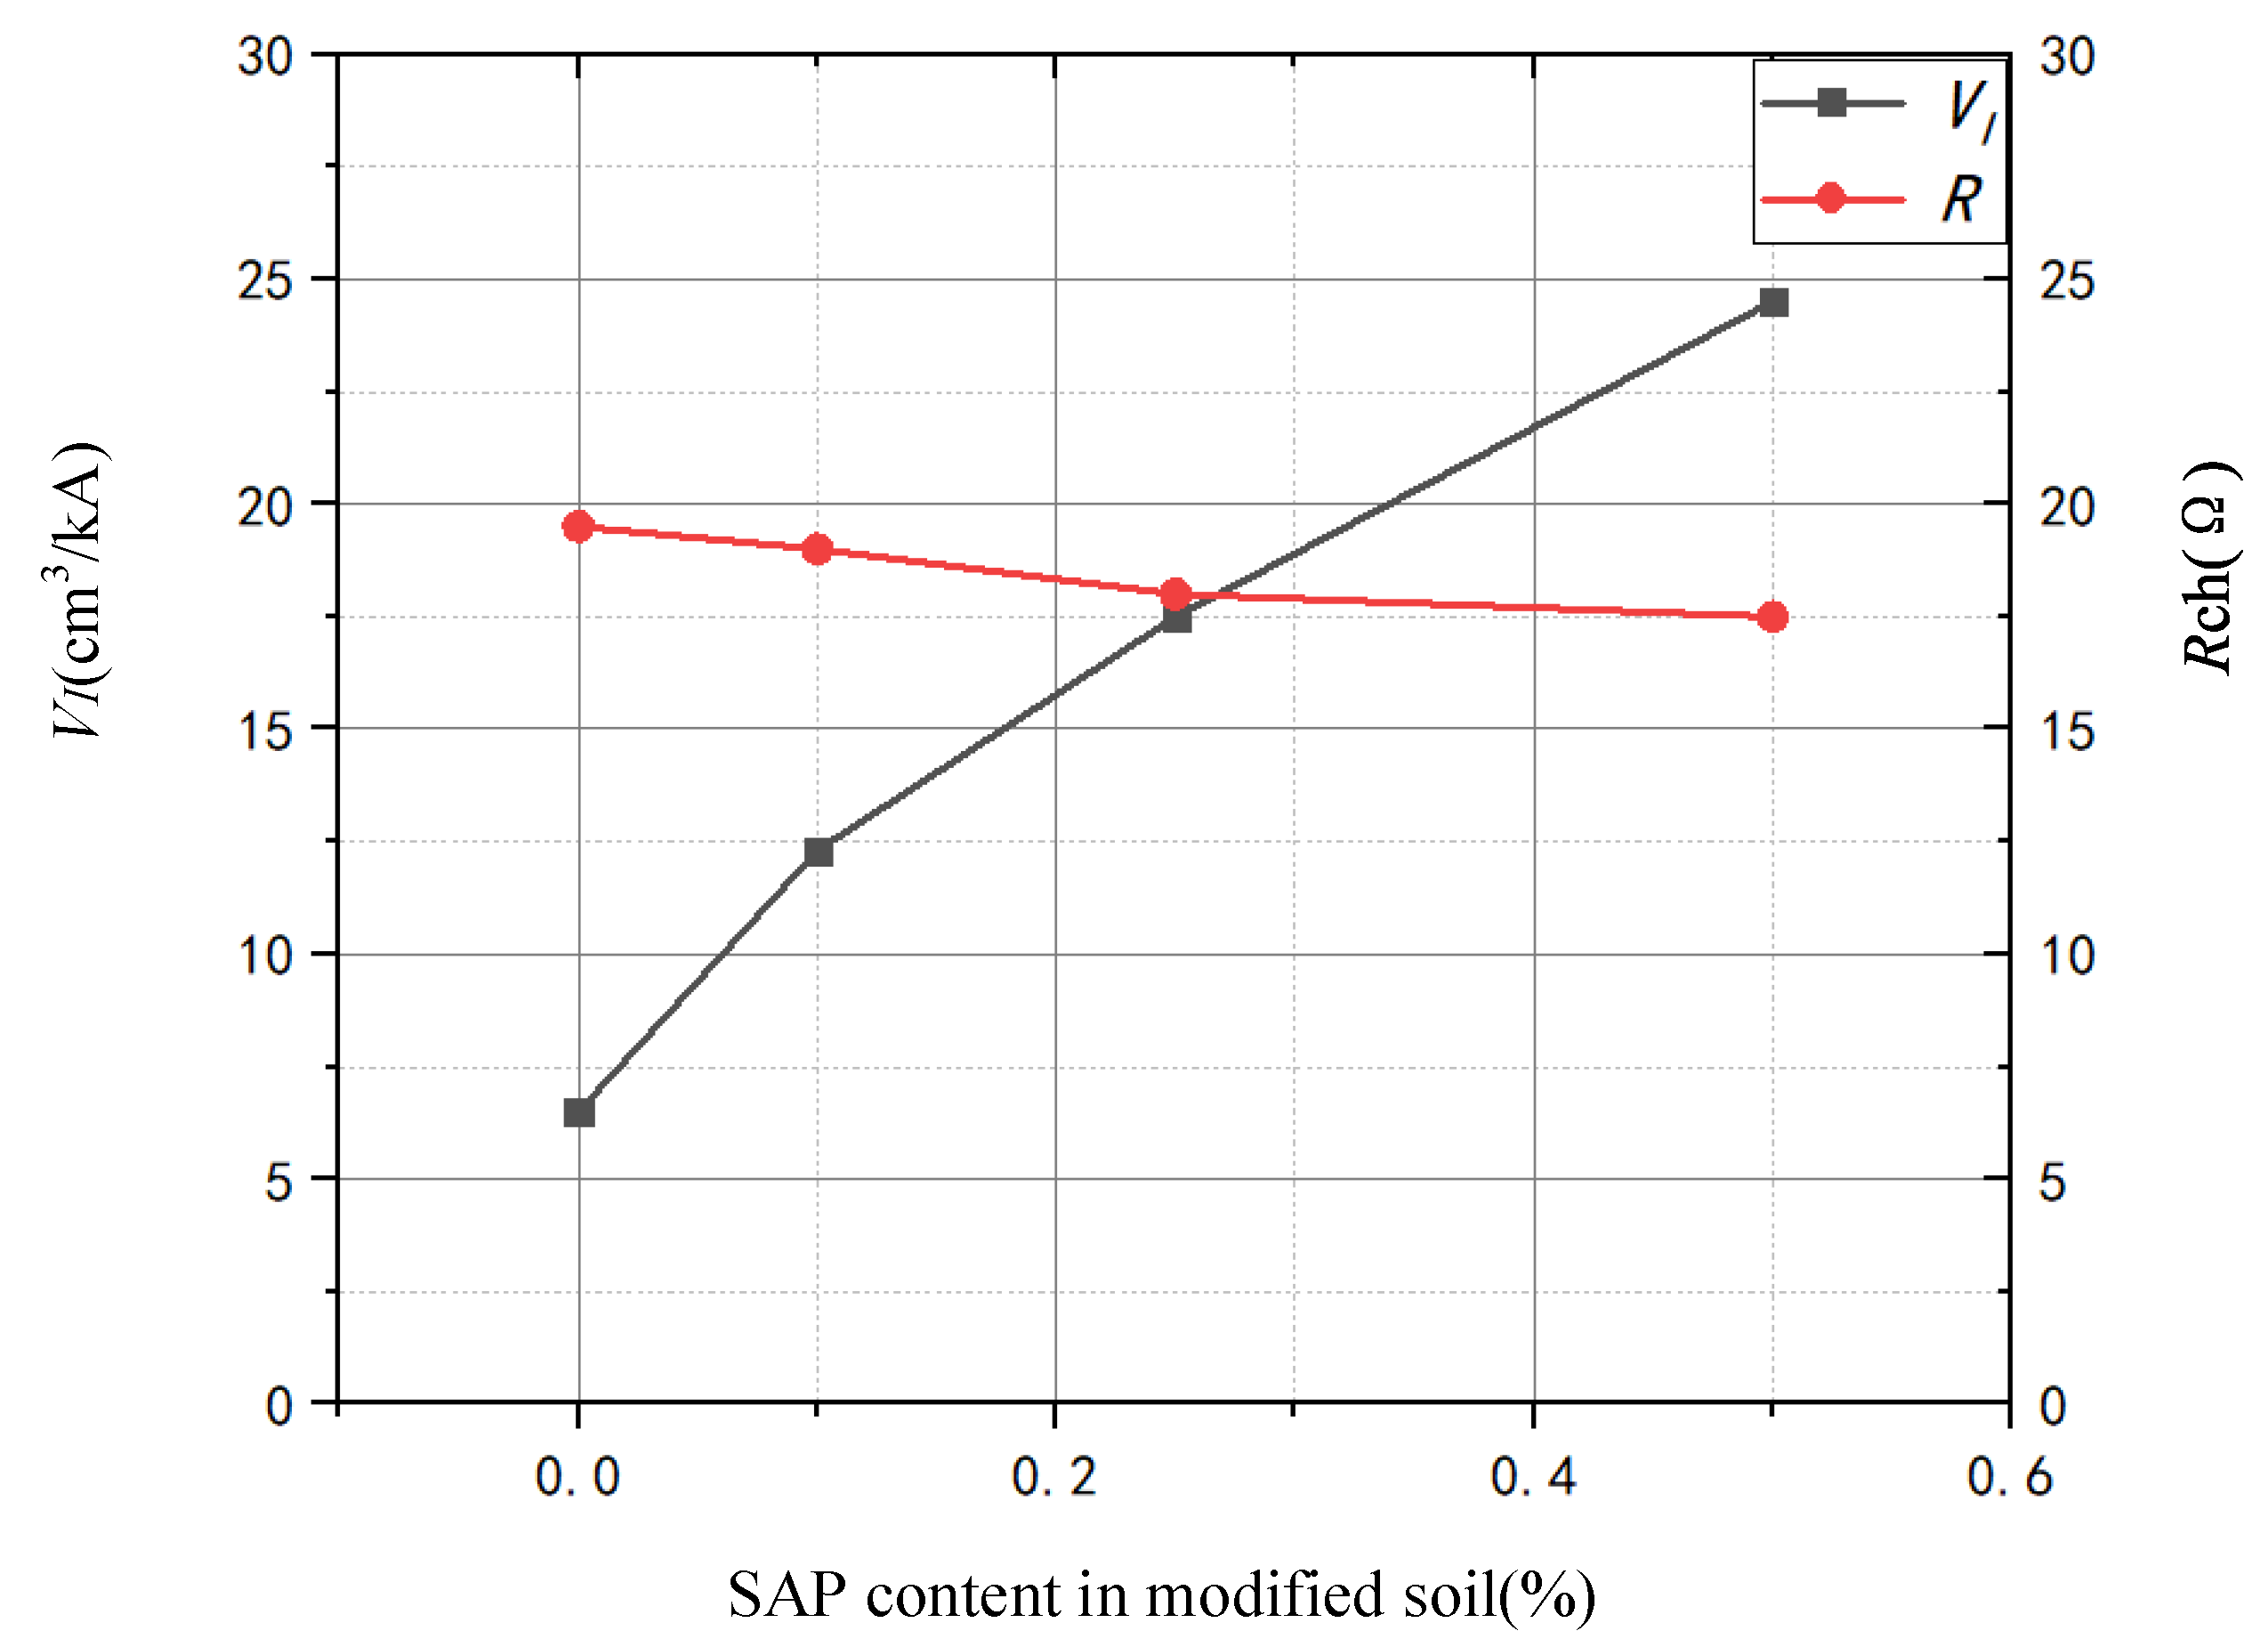
4.3. Variation of VI with the Content of SAP
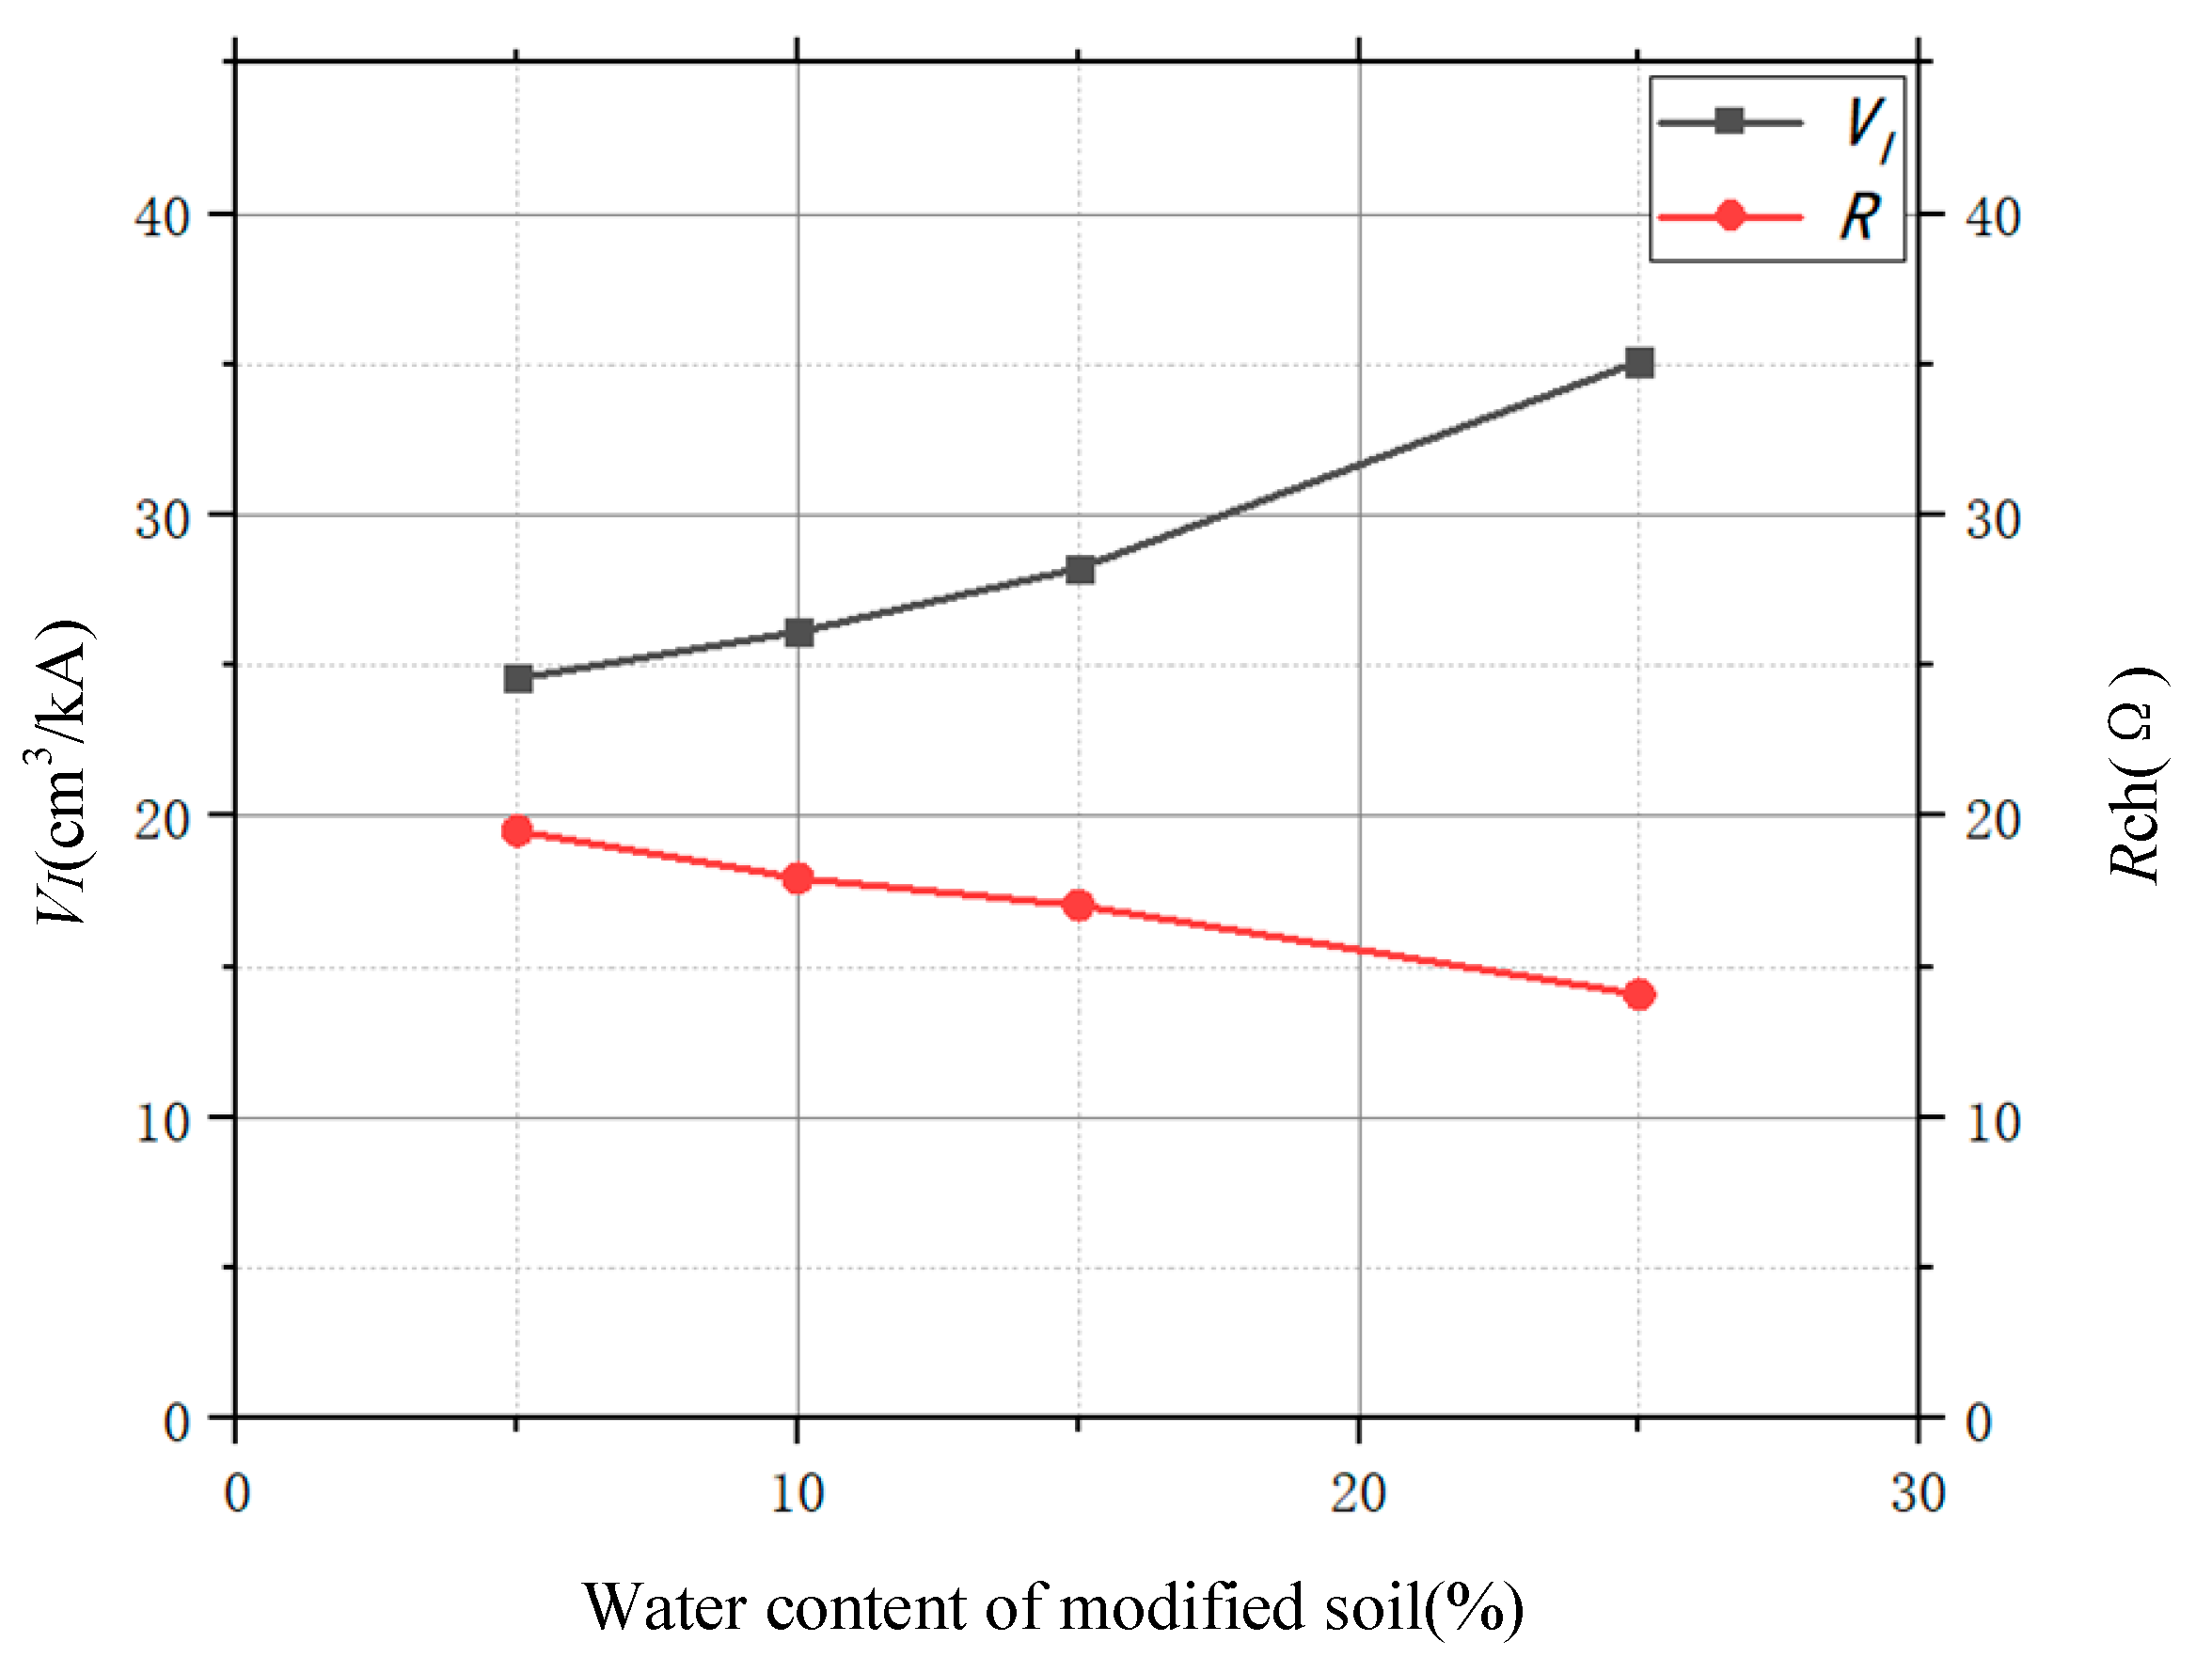
4.4. Variation of VI with Water Content of Modified Soil
5. Conclusions
- The proposed equivalent value of soil discharge volume per unit electric current, combined with the image characteristics of soil impulse discharge, can directly reflect the dispersion of the impulse current in the soil, and the results of the evaluation can reflect the change law more significantly than the results calculated by an empirical formula and measurement waveform. However, the limitation is that other types of soil and soil heterogeneity are not considered.
- The experimental results show that when the samples’ soil resistivity is the same and the soil moisture content is different, the VI of the soil medium is different, and increases with the increase of the moisture content, but the value of the empirical formula recommended by the regulations remains unchanged.
- In the area of high soil resistivity, when the VI ’s value is small, it indicates that there is space to further improve the impulse dispersion performance of the grounding electrode by modifying the soil.
- With the increase in the content of SAP, the VI of the discharge zone of the soil increased gradually. When the content of the modified material was 0.5%, the VI’s value of the dispersion zone of the soil modified by SAP was 24.59 cm3/kA. Compared with the modified soil without SAP, the impulse grounding resistance decreased by 10.26%, and the value of VI increased by 3.54 times.
- With the increase in moisture content of the soil modified by SAP, the discharge process of soil becomes more intense, and the impulse dispersion performance is better. In the soil modified by SAP, VI is 20.10 cm3/kA when the water content is 25%. Compared with the modified soil with 5% water content, VI increases by about 55.47%.
Author Contributions
Funding
Institutional Review Board Statement
Informed Consent Statement
Data Availability Statement
Acknowledgments
Conflicts of Interest
References
- He, J.L.; Zeng, R. Power System Grounding Technology; Science Press: Beijing, China, 2007; pp. 130–137. [Google Scholar]
- Yuan, T.; Li, T.X.; Sima, W.X.; Liu, S.W.; Luo, D.H.; Li, X.C. Analysis of soil discharge image characteristics under impulse currents. Proc. CSEE 2018, 38, 5266–5274. [Google Scholar]
- Chen, M.M.; Cao, X.B.; Yang, L.; Wu, H.; Zhang, M.; Wu, G.N. Experimental study on soil impulse characteristics surrounding Coaxial cylindrical electrode. Power Syst. Technol. 2013, 37, 2291–2296. [Google Scholar]
- Yuan, T.; Ban, G.G.; Luo, D.H.; Li, J.L.; Zhang, X.; Zuo, S.J. Evaluation Method of Impulse Discharge Performance of Ground Electrode Based on Soil discharge Image. In Proceedings of the 2020 IEEE International Conference on High-Voltage Engineering (ICHVE 2020), Beijing, China, 6–10 September 2020. [Google Scholar]
- Gao, Y.Q. Study on Soil Impulse Breakdown Mechanism and Transient Characteristics of Grounding System. Ph.D. Thesis, Tsinghua University, Beijing, China, 2003. [Google Scholar]
- Wang, J.P.; Liew, A.C.; Darveniza, M. Extension of dynamic model of impulse behavior of concentrated grounds at high currents. IEEE Trans. Power Delivery 2005, 20, 2160–2166. [Google Scholar] [CrossRef]
- Rakov, V.A. Triggered Lightning; Springer: Berlin, Germany, 2009. [Google Scholar]
- Liu, S.W. Study on X-ray Digital Image Characteristics of Soil Impulse Discharge and Transient Performance of Grounding Device. Ph.D. Thesis, Chongqing University, Chongqing, China, 2017. [Google Scholar]
- Feng, Z.Q. Study on the Impulse Characteristics of the Grounding Devices and the Morphology Features of the Soil Sparkover. Ph.D. Thesis, Wuhan University, Wuhan, Hubei, China, 2016. [Google Scholar]
- Zhu, B.; Sima, W.X.; Yuan, T. Structure parameter optimization of grounding device with needle-shaped conductors based electric field distribution in soil. Power Syst. Technol. 2015, 39, 2907–2914. [Google Scholar]
- Li, J.L.; Jiang, J.D.; Li, L.L. Simulation and experiment study on resistance-reducing mechanism of grounding device with spicules. Power Syst. Technol. 2013, 37, 211–217. [Google Scholar]
- He, J.L.; Zhang, B. Progress in Lightning Impulse Characteristics of Grounding Electrodes with Soil Ionization. IEEE Trans. Ind. Appl. 2015, 51, 4924–4933. [Google Scholar] [CrossRef]
- Yang, L.; Wu, G.N.; Tian, X.F. Analysis of impulse characteristic grounding electrode in frequency and time domain based on EMTP. Trans. China Electrotech. Soc. 2011, 26, 194–198. [Google Scholar]
- Jose, C.; Antonio, F.O.; Carlos, G. Nodal frequency analysis of grounding systems considering the soil ionization effect. IEEE Trans. Power Deliv. 2000, 15, 103–107. [Google Scholar]
- Lu, H.L.; Feng, Z.Q.; Wen, X.S. Full-time electrical network model of the transient characteristics of the grounding devices considering soil sparkover. Proc. CSEE 2017, 37, 7058–7065+7098. [Google Scholar]
- Neknoul, B.; Labie, P.; Zgainski, F.X.; Meunier, G. Caculating the impedance of the grounding system. IEEE Trans. Nucl. Sci. 1996, 32, 1509–1512. [Google Scholar]
- Snowden, D.P.; Erler, J.W. Initiation of electrical breakdown of soil by water vaporization. IEEE Trans. Nucl. Sci. 1983, 30, 4568–4571. [Google Scholar] [CrossRef]
- Bellaschi, P.L.; Armington, R.E. Impulse and 60-cycle characteristics of driven grounds—Ill. effect of lead in ground installation. Trans. Am. Inst. Electr. Eng. 1943, 62, 334–345. [Google Scholar] [CrossRef]
- Liew, A.C.; Darveniza, M. Dynamic model of impulse characteristics of concentrated earths. Electr. Eng. Proc. Inst. 1974, 121, 123–135. [Google Scholar] [CrossRef]
- Sima, W.X.; Liu, S.W.; Yuan, T.; Luo, D.H.; Wu, P.; Zhu, B. Experimental study of the discharge area of soil breakdown under surge current using X-ray imaging technology. IEEE Trans. Ind. Appl. 2015, 51, 5343–5351. [Google Scholar] [CrossRef]
- Luo, D.H.; Cao, Y.X.; Zhang, Y.; Xie, S.J.; Zhang, C.M.; Cao, S.P. Study on Structural Parameters and Analysis Method of Soil Successive Impulse Discharge Channel. Energies 2021, 14, 877. [Google Scholar] [CrossRef]
- Radakovic, Z.R.; Kostic, M.B. Behaviour of grounding loop with bentonite during a ground fault at an overhead line tower. IEEE Trans. Gener. Transm. Distrib. 2001, 148, 275–279. [Google Scholar] [CrossRef]
- Bellaschi, P.L. Impulse and 60-Cycle Characteristics of Driven Grounds. Trans. Am. Inst. Electr. Eng. 1941, 60, 123–128. [Google Scholar] [CrossRef]
- Zhu, S.Y.; Yuan, T.; Zhu, B. Finite element model of impulse dispersing characteristics of grounding equipment in layered soil. Power Syst. Technol. 2014, 38, 2304–2309. [Google Scholar]
- Guo, Z.H.; Xing, T.F.; Wu, G.N. Grounding resistance change rule of vertical grounding electrode in frozen soil. High Volt. Eng. 2014, 40, 698–706. [Google Scholar]
- Wang, J.J.; He, J.L.; Zou, J. Influence of seasonal frozen soil layer on current division factor of substation grounding system. Power Syst. Technol. 2006, 30, 41–45. [Google Scholar]
- Chen, X.L.; Huang, Y.; Zhang, J.Y. Caculation formula of impulse grounding resistance for grounding device of power transmission tower. Power Syst. Technol. 1996, 20, 9–12. [Google Scholar]
- Li, T.X. Study on Grounding Resistance Reduction Performance of Super Absorbent Polymer Material. Ph.D. Thesis, Chongqing University, Chongqing, China, 2018. [Google Scholar]
- Xiao, Y.M. Preliminary study of standard system construction of new medical imaging devices. China Med. Device Inf. 2015, 21, 41–44+47. [Google Scholar]
- Yamane, H.; Ideguchi, T.; Tokuda, M. Stability against temperature and environment for ground resistance reducing material using watered absorbent polymer. Electron. Commun. 1994, 77, 100–110. [Google Scholar]
- Yamane, H.; Ideguchi, T.; Tokuda, M. A new ground resistance reducing material based on water-absorbent polymer. Electron. Commun. 2010, 77, 68–78. [Google Scholar] [CrossRef]
- Khan, Y.; Malik, N.H.; Arainy, A.A. Efficient use of low resistivity material for grounding resistance reduction in high soil resistivity areas. In Proceedings of the Tencon IEEE Region 10 Conference, Fukuok, Japan, 21–24 November 2011. [Google Scholar]


| Soil Water Content/% | Calculated Impulse Grounding Resistance Rch2/Ω | Measured Impulse Grounding Resistance Rch1/Ω | Soil Discharge Area VI/(cm3/kA) |
|---|---|---|---|
| 23.56 | 35.9 | 19.50 | 22.27 |
| 39.14 | 35.9 | 19.21 | 23.75 |
| 40.50 | 35.9 | 18.60 | 26.18 |
| 48.80 | 35.9 | 17.50 | 34.48 |
| The Variables | Correlation | Impulse Grounding Conduntance |
|---|---|---|
| VI and reciprocal of Rch | Person correlation index r | 0.985 |
| Significance (bilateral) Number of sample M | 0.002 5 |
Publisher’s Note: MDPI stays neutral with regard to jurisdictional claims in published maps and institutional affiliations. |
© 2021 by the authors. Licensee MDPI, Basel, Switzerland. This article is an open access article distributed under the terms and conditions of the Creative Commons Attribution (CC BY) license (https://creativecommons.org/licenses/by/4.0/).
Share and Cite
Han, X.; Luo, D.; Zhang, X.; Cao, Y.; Zhang, Y.; Ban, G. Study on Evaluation Method of Impulse Dispersion Performance of Grounding Device Using X-ray Imagining System. Energies 2021, 14, 5124. https://doi.org/10.3390/en14165124
Han X, Luo D, Zhang X, Cao Y, Zhang Y, Ban G. Study on Evaluation Method of Impulse Dispersion Performance of Grounding Device Using X-ray Imagining System. Energies. 2021; 14(16):5124. https://doi.org/10.3390/en14165124
Chicago/Turabian StyleHan, Xiaoyan, Donghui Luo, Xin Zhang, Yongxing Cao, Yu Zhang, and Gege Ban. 2021. "Study on Evaluation Method of Impulse Dispersion Performance of Grounding Device Using X-ray Imagining System" Energies 14, no. 16: 5124. https://doi.org/10.3390/en14165124
APA StyleHan, X., Luo, D., Zhang, X., Cao, Y., Zhang, Y., & Ban, G. (2021). Study on Evaluation Method of Impulse Dispersion Performance of Grounding Device Using X-ray Imagining System. Energies, 14(16), 5124. https://doi.org/10.3390/en14165124