Article

Decoupling Analysis of CO2 Emissions in the Industrial Sector from Economic Growth in China

1
Institute of Geographic Sciences and Natural Resources Research, Chinese Academy of Sciences, Beijing 100101, China
2
The University of Chinese Academy of Sciences, Beijing 100049, China
3
Department of Urban Planning and Design, The University of Hong Kong, Hong Kong, China
4
College of Water Resources & Civil Engineering, China Agricultural University, Beijing 100091, China
*
Authors to whom correspondence should be addressed.
Energies 2021, 14(16), 5099; https://doi.org/10.3390/en14165099
Submission received: 30 June 2021 / Revised: 5 August 2021 / Accepted: 14 August 2021 / Published: 19 August 2021
(This article belongs to the Special Issue Advances in CO2 Mitigation in Energy and the Environment)

Abstract

:
China has become the largest CO2 emission country since 2014. The industrial sector is the largest contributor to CO2 emissions in China. This paper uncovers the spatiotemporal characteristics of the decoupling status of industrial CO2 emissions from economic growth at the provincial level during 1995–2019 in China and analyzed the structural characteristics of the industrial CO2 emissions. The results suggested that 2010 is an important turning point. Since 2010, the decoupling status of industrial CO2 emissions from economic growth has kept a continuously improving trend. During 2016–2019, all provinces achieved decoupling of the industrial CO2 emissions from economic growth. More than 20% achieved absolute strong decoupling. Four subindustries, including raw chemical materials and chemical products, production and supply of electric power and heat power, petroleum processing and coking products, and smelting and pressing of non-ferrous metals, with large CO2 emissions’ contribution and a continuously increasing trend, should be paid more attention in the future CO2 reduction policies formulation.

1. Introduction

During 1996–2019, the economy in China experienced rapid growth, with the GDP (gross domestic product) increasing at an average annual growth rate of 13.2%, much higher than the global average growth rate of 4.7%. However, rapid economic growth causes many problems, such as extensive energy consumption and emissions [1,2,3,4,5], serious environmental pollution [6], and health problems [3]. In 2018, China emitted 10 billion tons of CO2 and accounted for approximately 28% of the global total emissions [7]. The industrial sector is the largest contributor (more than 60%) and has great potential in carbon abatement [4]. To achieve the CO2 mitigation commitment in the Paris Agreement, uncovering the spatial-temporal and structural characteristics of the industrial CO2 emissions in China is of great significance.
Many studies suggest that economic growth is an important driving factor of CO2 emissions, especially in developing countries. For example, Chong et al. [8] proposed that economic growth (GDP per capita) contributed 50.5% (13.3 Mt), 56.5% (35.3 Mt), and 48.4% (63.7 Mt) of energy-related CO2 emissions in Malaysia during 1987–1990, 1990–2002, and 2002–2014, respectively. Zhao et al. [9] indicated that with rapid economic development in China, energy consumption increased from 734.4 Mt to 2755.1 Mt during 1992–2012. This study also found that the industrial sector accounted for the largest proportion of all sectors in CO2 emissions. Therefore, the industrial sector attracted much attention in the research field of greenhouse gas emissions and climate change. During 1993–2013, the industrial sector, accounting for 35–44% of GDP, emitted more than 63% of CO2 emissions in China [10].
Economic growth is desirable, but CO2 emissions increment is not. Exploring the relationship between industrial CO2 emissions and economic growth can provide insights to formulate and implement measures to achieve the reduction targets. There are mainly six approaches to investigating the relationship between economic growth and CO2 emissions. (1) ARDL (the Autoregressive Distributed Lag) method. The ARDL method is suitable for small samples, but it is easy to produce endogenous deviation [11,12]. (2) Input-output method. The input-output method is convenient to calculate, but the input-output table is updated every five years [13]. (3) Granger causality test. The Granger causality method can reveal the unidirectional causality and bi-directional causality between economic development and CO2 emissions, but Granger causality detection pays more attention to the causal relationship of data and ignores the logic [5]. (4) EKC (the Environmental Kuznets Curve). This method is most frequently used to explore the trend of CO2 emissions and economic growth. EKC is more suitable to reveal the dynamic characteristics of the relationship between economic development and the environment [14,15]. (5) DEA (Data Envelopment Analysis) method. DEA method is applied to estimate the economic loss efficiency due to CO2 emissions control. However, when DEA is applied at the provincial level, the provinces are not all economically independent, so the analysis results will have a neighborhood effect and cause efficiency evaluation bias [16]. (6) Decoupling analysis method. The term “decoupling” was proposed by the Organization for Economic Cooperation and Development (OECD) as an indicator [17]. Decoupling could reveal the elasticity of CO2 emissions along with economic growth.
In recent years, the decoupling method has been widely used at various spatial scales. At the national level, Zhang and Da [18] used the decoupling index to analyze the decoupling relationship between industrial CO2 emissions and economic growth in China during 1996–2010. At the regional level, Dong et al. [19] constructed a novel decoupling index to analyze the relationship between energy-related CO2 emissions and economic growth during 1996–2014 in the northwest region of China. “Relative decoupling” and “coupling” are the major characteristics. In [20], Tapio’s decoupling extended model was used to explore the decoupling relationship between industrial carbon emissions and economic growth in 8 regions of China during 1996–2010. There was a weak decoupling relationship in most regions except the northwest region during 1993–2000, the southwestern region during 2001–2005, the southern and northern coastal regions, and Beijing and Tianjin during 2010–2012. The national and regional level research has provided scientific support for the macroscopic CO2 reduction policies and measures. At the provincial level, Wang, and Feng [21] quantitatively revealed the driving factors of industrial CO2 emissions and analyzed the decoupling of industrial CO2 emissions from GDP growth during 2000–2014. However, the decoupling analysis of this research focused on the entire study period 2000–2014, while the variation characteristics of the decoupling status were not be investigated even though many decoupling analyses found obvious periodical characteristics of the decoupling in the other sectors [22,23].
In the United Nations General Assembly in 2020, China proposed that China will strive to achieve carbon neutrality in 2060. As a crucial sector to mitigate climate change, the industrial sector is of great importance to achieve carbon neutrality. Since the “12th Five-year Plan”, the Chinese government has paid more attention to the transformation of the development model, and formulated and implemented series of carbon reduction policies and measures at the national level. In 2012, the Industrial Actions Plan for Addressing Climate Change (2012–2020), issued by the National Development and Reform Commission in China, proposed to improve the development of the low-carbon industry to conduct climate change mitigation work in the industrial sector. The Industrial Actions Plan for Addressing Climate Change (2012–2020) emphasized the construction of the low-carbon industrial system, the improvement of energy efficiency, and the development and application of low-carbon technology in the industrial sector. In 2016, the Ministry of Industry and Information Technology in China proposed the Industrial Green Development Plan (2016–2020). The Industrial Green Development Plan (2016–2020) proposed that optimizing the structure of the industry and energy consumption is an important approach to promote energy saving in the industrial sector. Further investigating the structural characteristics of the CO2 emissions in the industrial sector is necessary to provide scientific references to the structural optimization of the industrial sector. In terms of the industrial subsectors, the National Development and Reform Commission proposed the Modern Coal Chemical Industry Innovative Development Layout Plan in 2017, and Implementation Opinions on Ultra-Low Emissions in the Steel Industry in 2019. From a regional perspective, the Ministry of Industry and Information Technology put forward the Guidance Opinions on Strengthening Green Industrial Development of the Yangtze River Economic Belt in 2017. The national-level policies have provided macro direction for the carbon reduction of the whole nation. Identifying the provinces or cities where there are good local practices in both the economic development and the CO2 reduction in the industrial sector is essential to further mitigate climate change and achieve carbon neutrality in the next step.
This study uncovers the spatiotemporal characteristics of the decoupling status of CO2 emissions in the industrial sector from economic growth during the last two decades. It can help identify when and where there are good local CO2 reduction practices and provide scientific references to propose more reasonable reduction policies, especially in the industrial sector. The structural characteristics of the CO2 emissions in the industrial sector in China is investigated to identify which subsectors of the industrial sector have larger reduction potential. Paying more attention to the subsector with large CO2 reduction potential in advance is more efficient when formulating the relevant policies and implement the reduction measures.

2. Materials and Methods

2.1. Decoupling Model

Mostly, economic growth is accompanied by energy consumption and carbon emissions. “Decoupling” means the break of the connection of “environmental badness” and “economic goodness” [17]. This research applies the Tapio’s decoupling method to analyze the decoupling status of CO2 emissions in the industrial sector from economic growth. The Tapio’s decoupling model is as follows:
c i = C O 2 i G D P i    
where c i represents the CO2 intensity in the industrial sector in year i, and the right side of the equation consists of two parts: CO2i represents the CO2 emissions in year i and GDPi represents the gross national product in year i. Within a given time, the relationship between CO2 emissions and GDP can be given by the following equation:
e i = Δ C O 2 Δ G D P    
where e i represents the elasticity of Δ C O 2 and Δ G D P . Δ C O 2 represents the change of the industrial CO2 emissions, and Δ G D P represents the change of GDP.
There are two main types of decoupling classifications currently used. Juknys [24] specified three decoupling types: primary decoupling, secondary decoupling, and doubled decoupling. Tapio [20] expanded the decoupling based on the original typology into absolute decoupling and relative decoupling. Based on the Tapio’s decoupling typology, this paper refers to the decoupling typology including 12 categories Loo and Banister [25] proposed. The detailed decoupling typology is shown in Table 1.

2.2. The CO2 Emissions Evaluation

According to the IPCC (Intergovernmental Panel on Climate Change) Guidelines for National Greenhouse Gas Inventories [26], we applied the “up-down” method to evaluate CO2 emissions caused by fossil fuel combustion. The emissions model includes CO2 emissions caused by fossil fuel combustion and indirect electricity consumption. The calculation equation is as follows:
E C i j = n E n F n i j + e u j U i j   ,
where E C i j represents the industrial CO2 emissions from province j in year i; E n represents the emission factor of the type n fossil fuel; F n i j represents the type n fossil fuel consumption in year i in province j; e u j represents the CO2 conversion factor of electric power in province j; and U i j represents the electric power consumption from province j in year i. The types of fossil fuel included coke, crude oil, gasoline, kerosene, diesel, fuel oil, liquefied petroleum gas, and natural gas. The calorific value and CO2 emission factor of each type of fossil fuel are shown in Table 2. The parameters are all collected from the China Energy Statistical Yearbook. The factor of electric power-translated CO2 referred to China’s power grid unit power, which supplied the average emission factor.

2.3. Data Description

The industrial energy consumption and GDP data during 1995–2019 at the provincial level are collected. The industrial energy consumption data are collected from China Energy Statistical Yearbook (1996–2020) [27]. The GDP data are collected from the China Statistical Yearbook (1996–2020) [28]. To eliminate the influence of the price fluctuation, GDP are converted from the current prices to the constant prices in 2015 based on the CPI (consumer price index). Due to the lack of data in Tibet, Hong Kong, Macau, and Taiwan, the data of 30 provincial administrative units are collected. The 30 provincial administrative units include Beijing, Tianjin, Hebei, Shanxi, Inner Mongolia, Liaoning, Jilin, Heilongjiang, Shanghai, Jiangsu, Zhejiang, Anhui, Fujian, Jiangxi, Shandong, Henan, Hubei, Hunan, Guangdong, Guangxi, Hainan, Chongqing, Sichuan, Guizhou, Yunnan, Shaanxi, Gansu, Qinghai, Ningxia, and Xinjiang. The statistical description of the industrial CO2 emission, calculated based on the “bottom-up” method by using the energy consumption data, and the GDP (base year = 2015) is shown in Table 3. Since Chongqing was established as a provincial-level municipality in 1997, all analysis of Chongqing is during 1997–2019.

3. Results

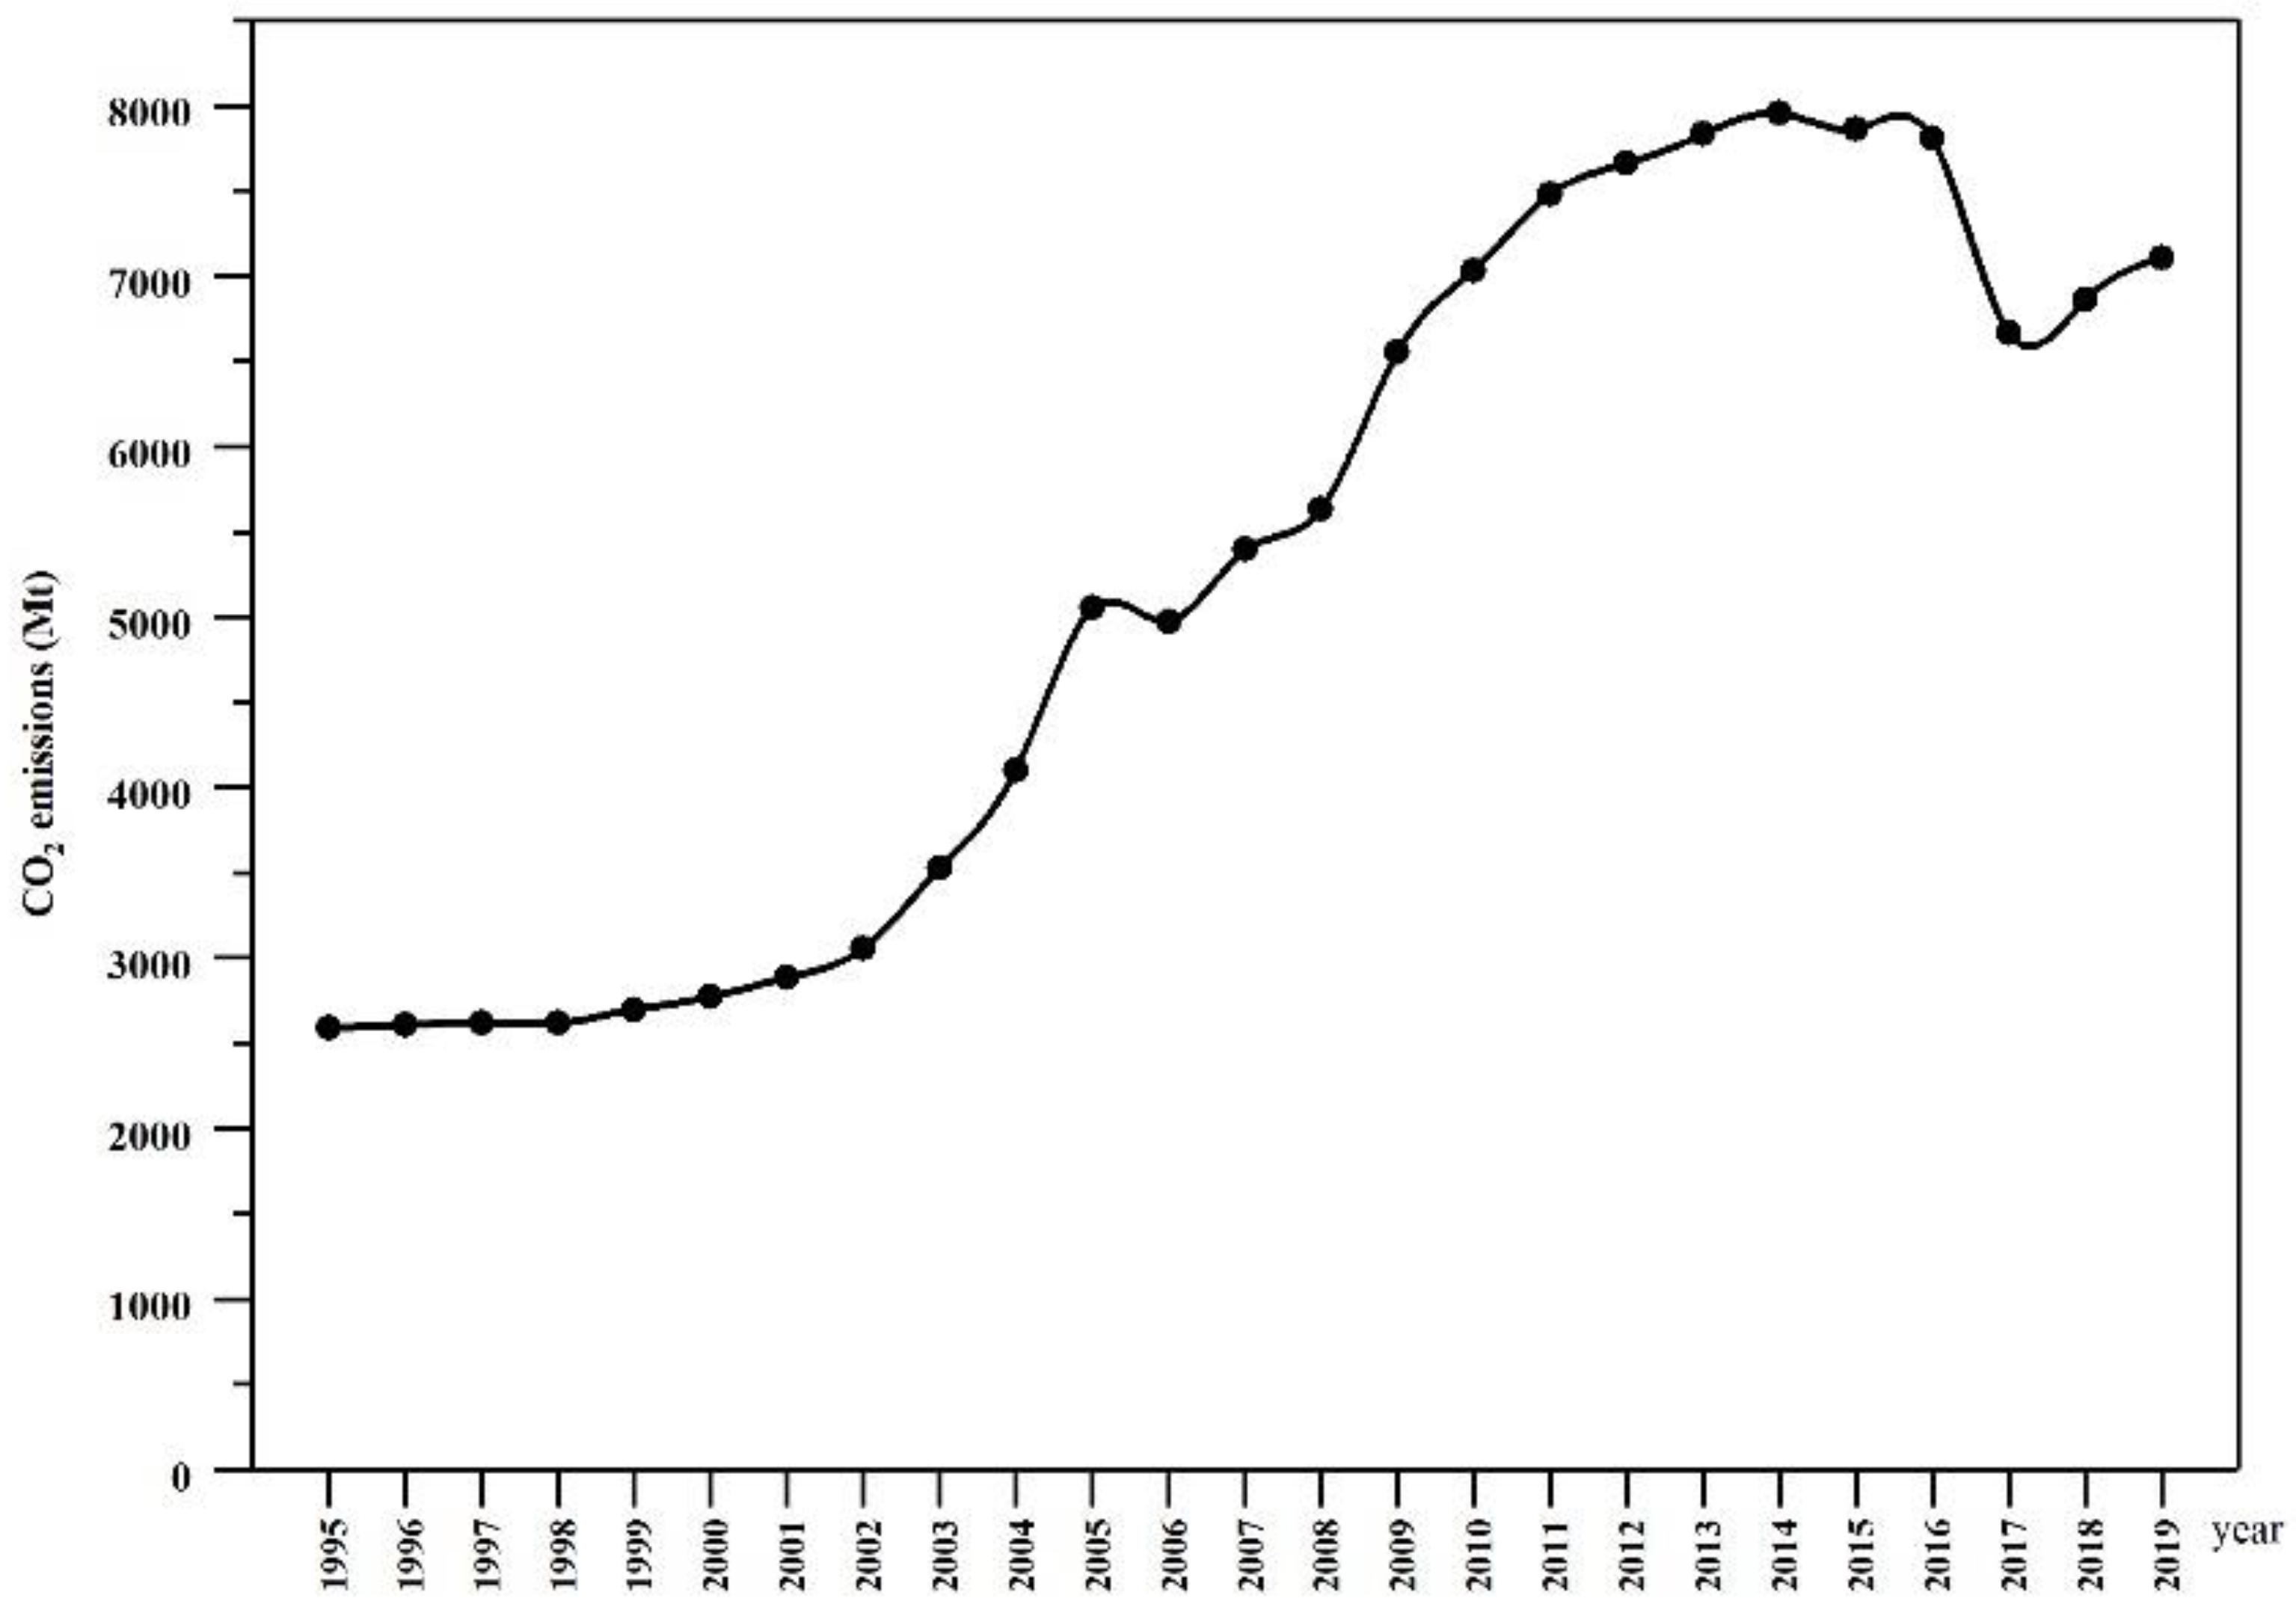
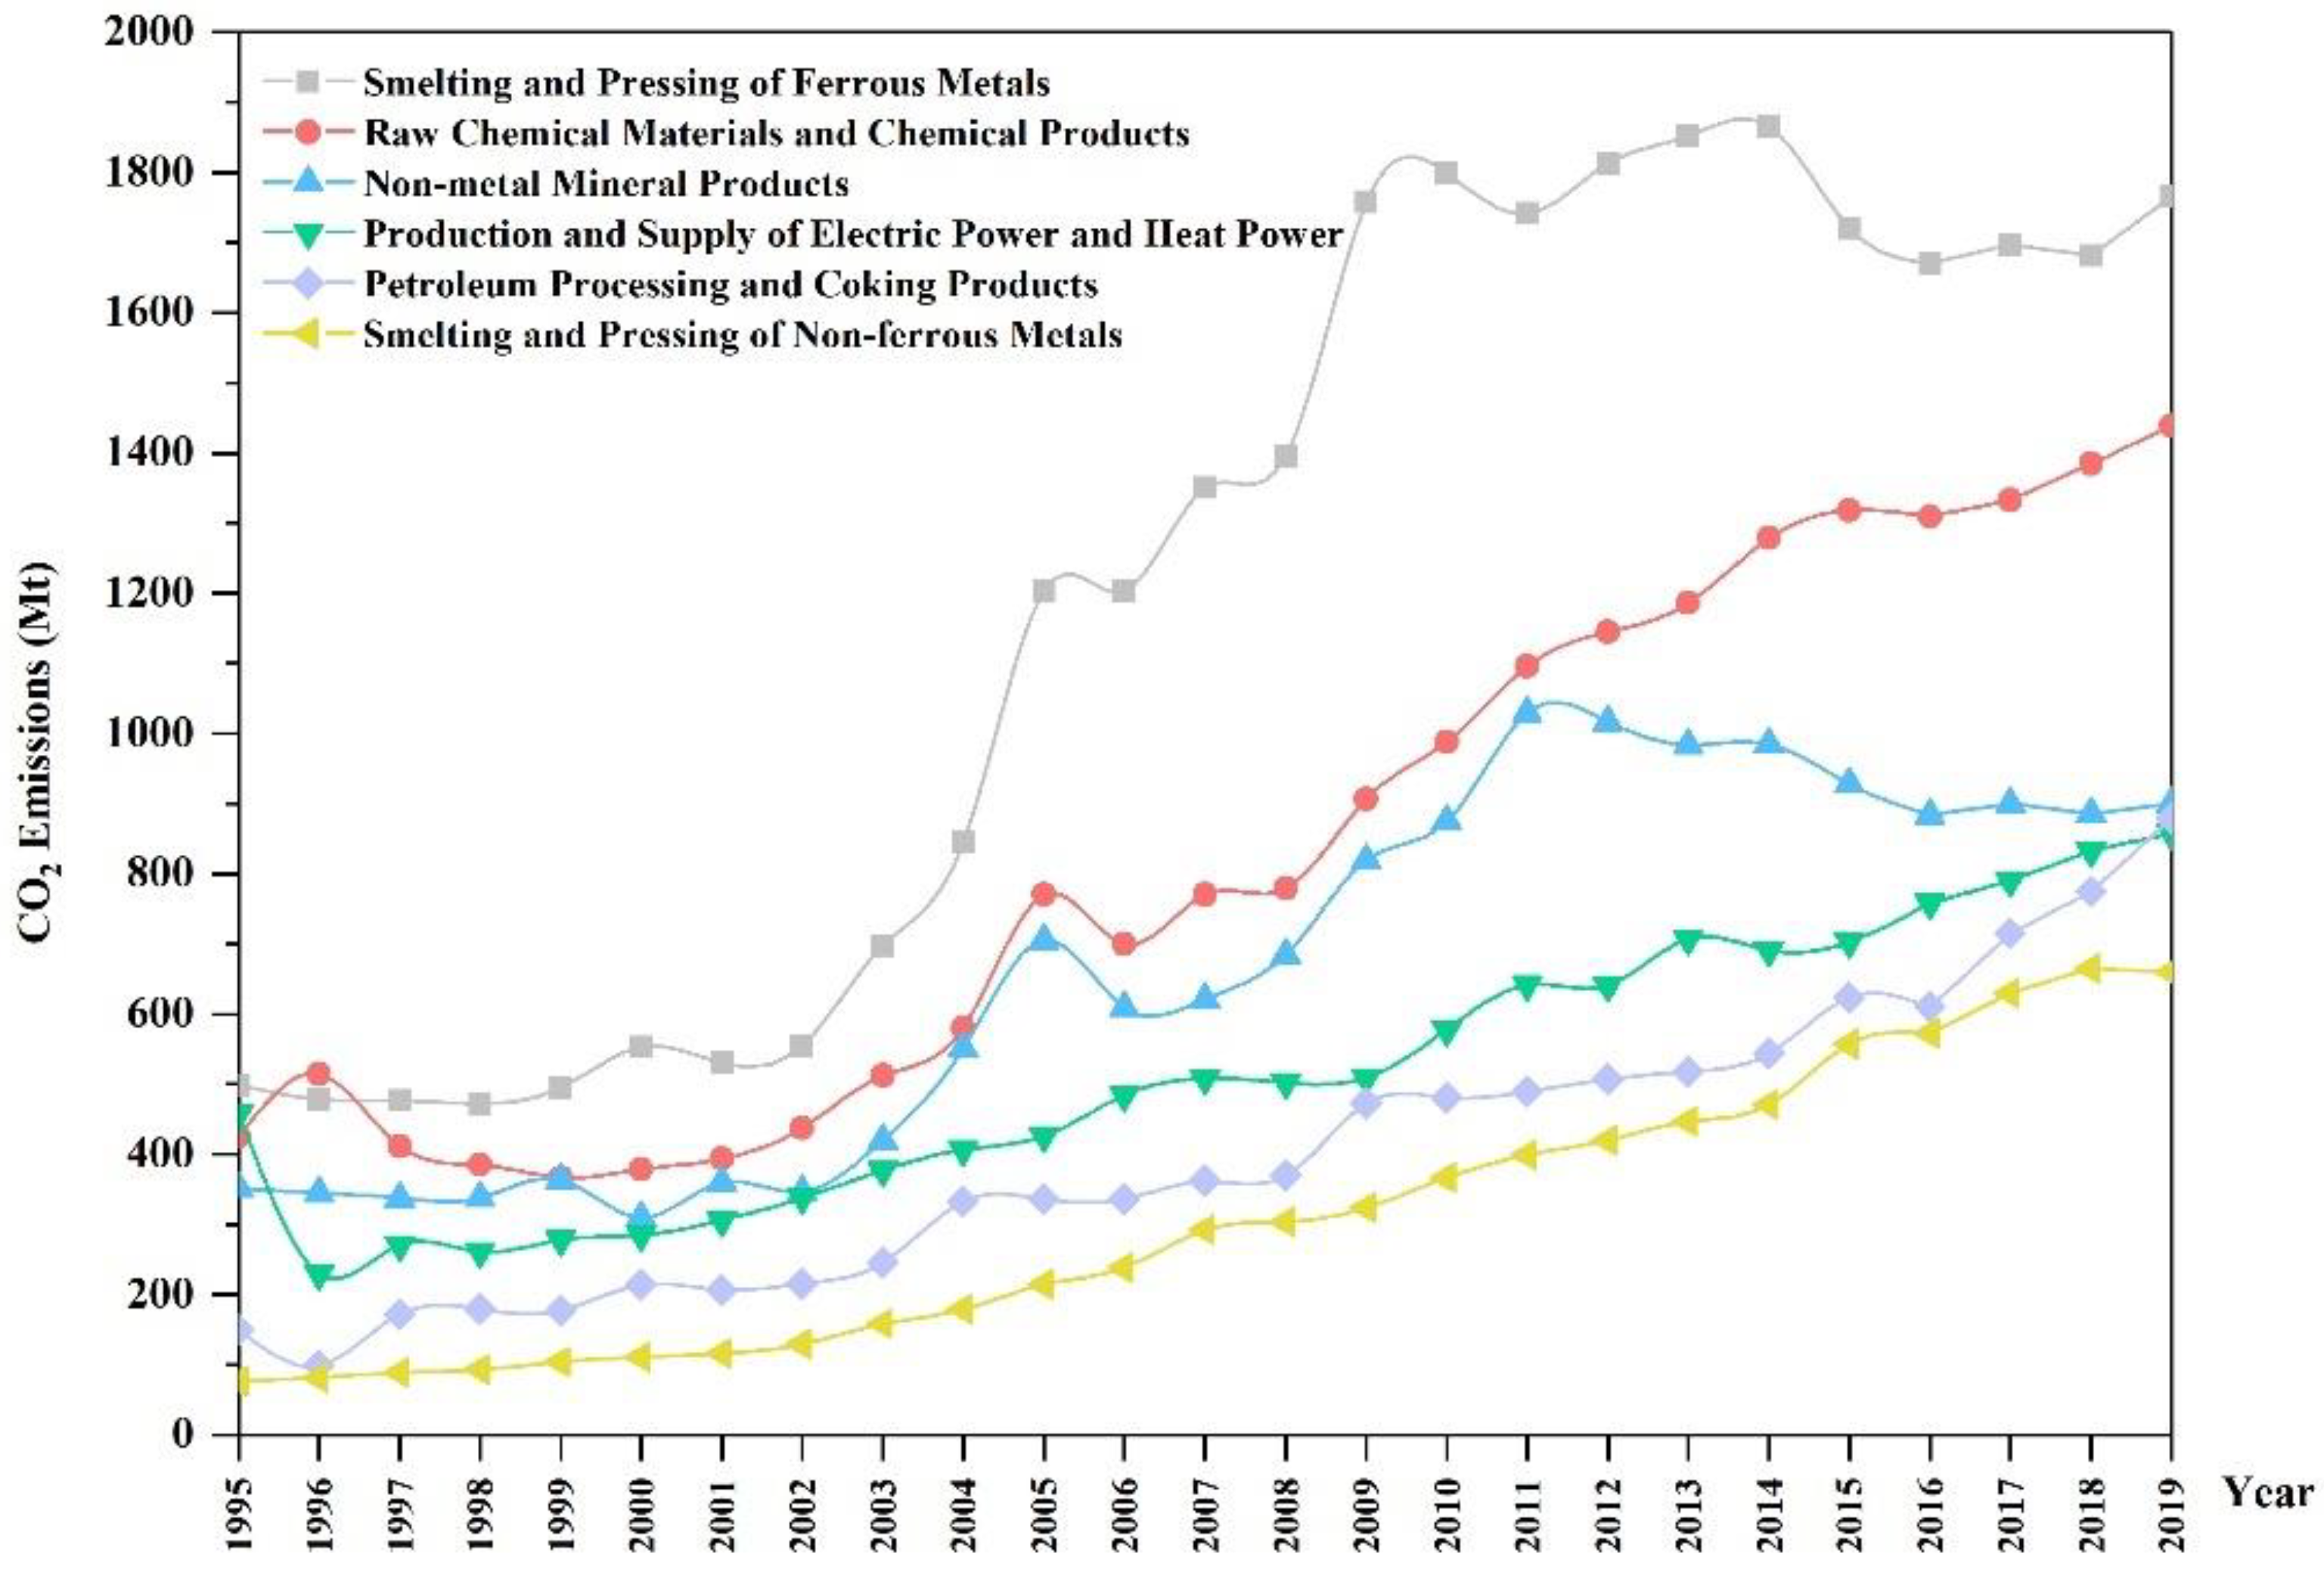
3.1. Industrial CO2 Emissions

The CO2 emissions in the industrial sector in China from 1995 to 2019 are shown in Figure 1. It mainly shows an increasing trend. The industrial CO2 emissions in China increases from 2589.5 Mt to 7107.97 Mt, with an average annual growth rate of 4.6%.
During the past two decades, the industrial CO2 emissions in China showed a significant phase characteristic. From 1995 to 2000, the industrial CO2 emissions showed a slow-growth trend, with an average annual growth rate of 1.4%. From 2001 to 2010, it increased rapidly, with an average annual growth rate of 10.0%. During 2011–2019, the industrial CO2 emissions fluctuated around 7000 Mt. In addition, an obvious decrease in the industrial CO2 emissions in 2017 was observed.
The spatiotemporal characteristics of the CO2 emissions in the industrial sector of 30 provincial administrative units in China are shown in Figure 2.
The obvious periodical variation characteristics are observed. From 1995 to 2005, the industrial CO2 emissions of the eastern and central regions in China obviously increased. Both the two provinces with more than 5000 Mt and higher than 10% average annual growth rate of the industrial CO2 emissions during 1995–2005 located in the eastern and central regions of China. The two provinces are Jiangxi and Shandong. The industrial CO2 emissions in Jiangxi, a province located in the central region, increased from 3242.0 Mt in 1995 to 13,067.4 Mt in 2005, with an average annual growth rate of 15.0%. The industrial CO2 emissions in Shandong, a province located in the eastern region, increased from 9004.2 Mt in 1995 to 24,381.3 Mt in 2005, with an average annual growth rate of 10.5%.
From 2006 to 2015, the industrial CO2 emissions increased rapidly in the western region and kept a relatively stable level in the eastern and central regions in China. The four provincial administrative units, including Qinghai (12.5%), Hainan (9.0%), Sichuan (8.6%), and Ningxia (8.4%), with an average annual growth rate of the industrial CO2 emissions higher than 8% mostly located in the western part of China. There are four provincial administrative units showing a decreasing trend of the CO2 emissions in the industrial sector. They are Beijing (−9.3%), Jiangxi (−3.7%, Shanghai (−1.3%), and Guizhou (−0.7%). In particular, the CO2 emissions in the industrial sector decreased more than 4000 Mt in Shanghai and more than 2000 Mt in Beijing during 2006–2015.
From 2016–2019, it showed an obvious decreasing trend of the industrial CO2 emissions. More than 80% of provincial administrative units showed a decrement in the industrial CO2 emissions during this period, except Inner Mongolia, Ningxia, Shanghai, Hainan, and Xinjiang. The top 10 provincial administrative units with a decrease in the industrial CO2 emissions are as follows: Shandong (−9181.7 Mt), Henan (−7205.7 Mt), Sichuan (−6860.2 Mt), Hebei (−5429.2 Mt), Zhejiang (−4268.5 Mt), Hubei (−3866.1 Mt), Jiangsu (−3584.8 Mt), Anhui (−3507.4 Mt), Chongqing (−3146.2 Mt), and Hunan (−3028.1 Mt).

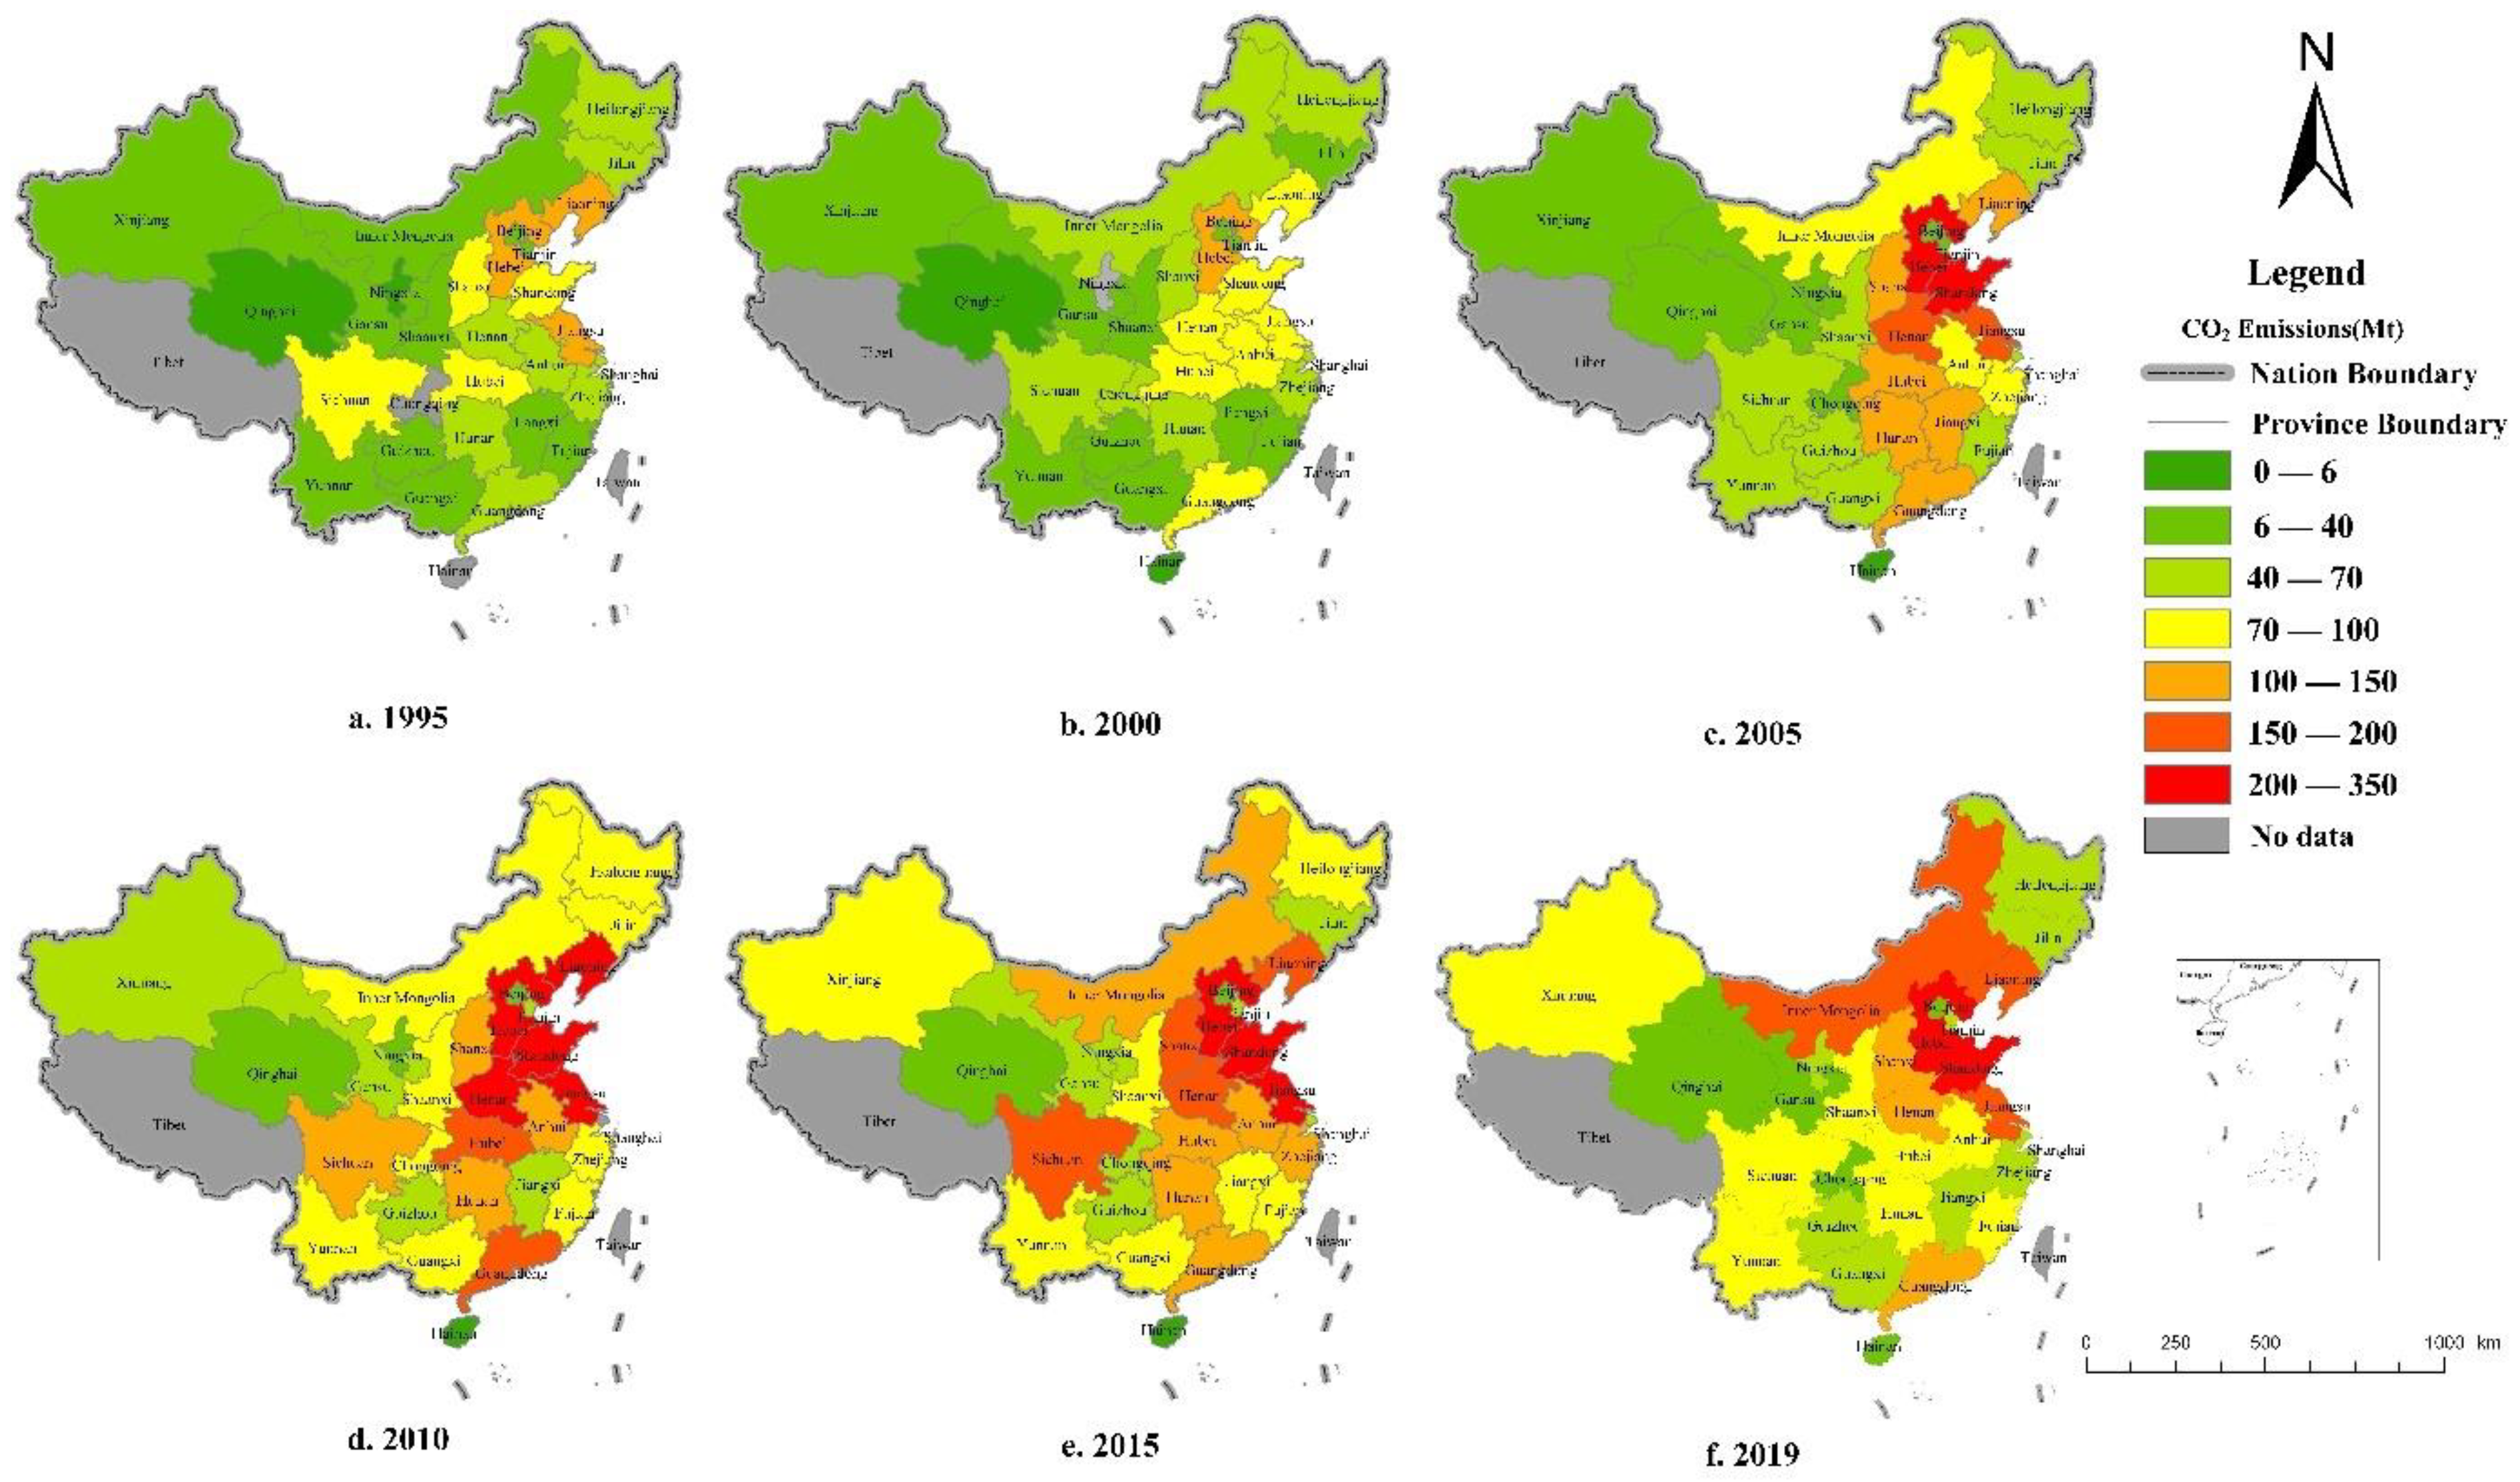
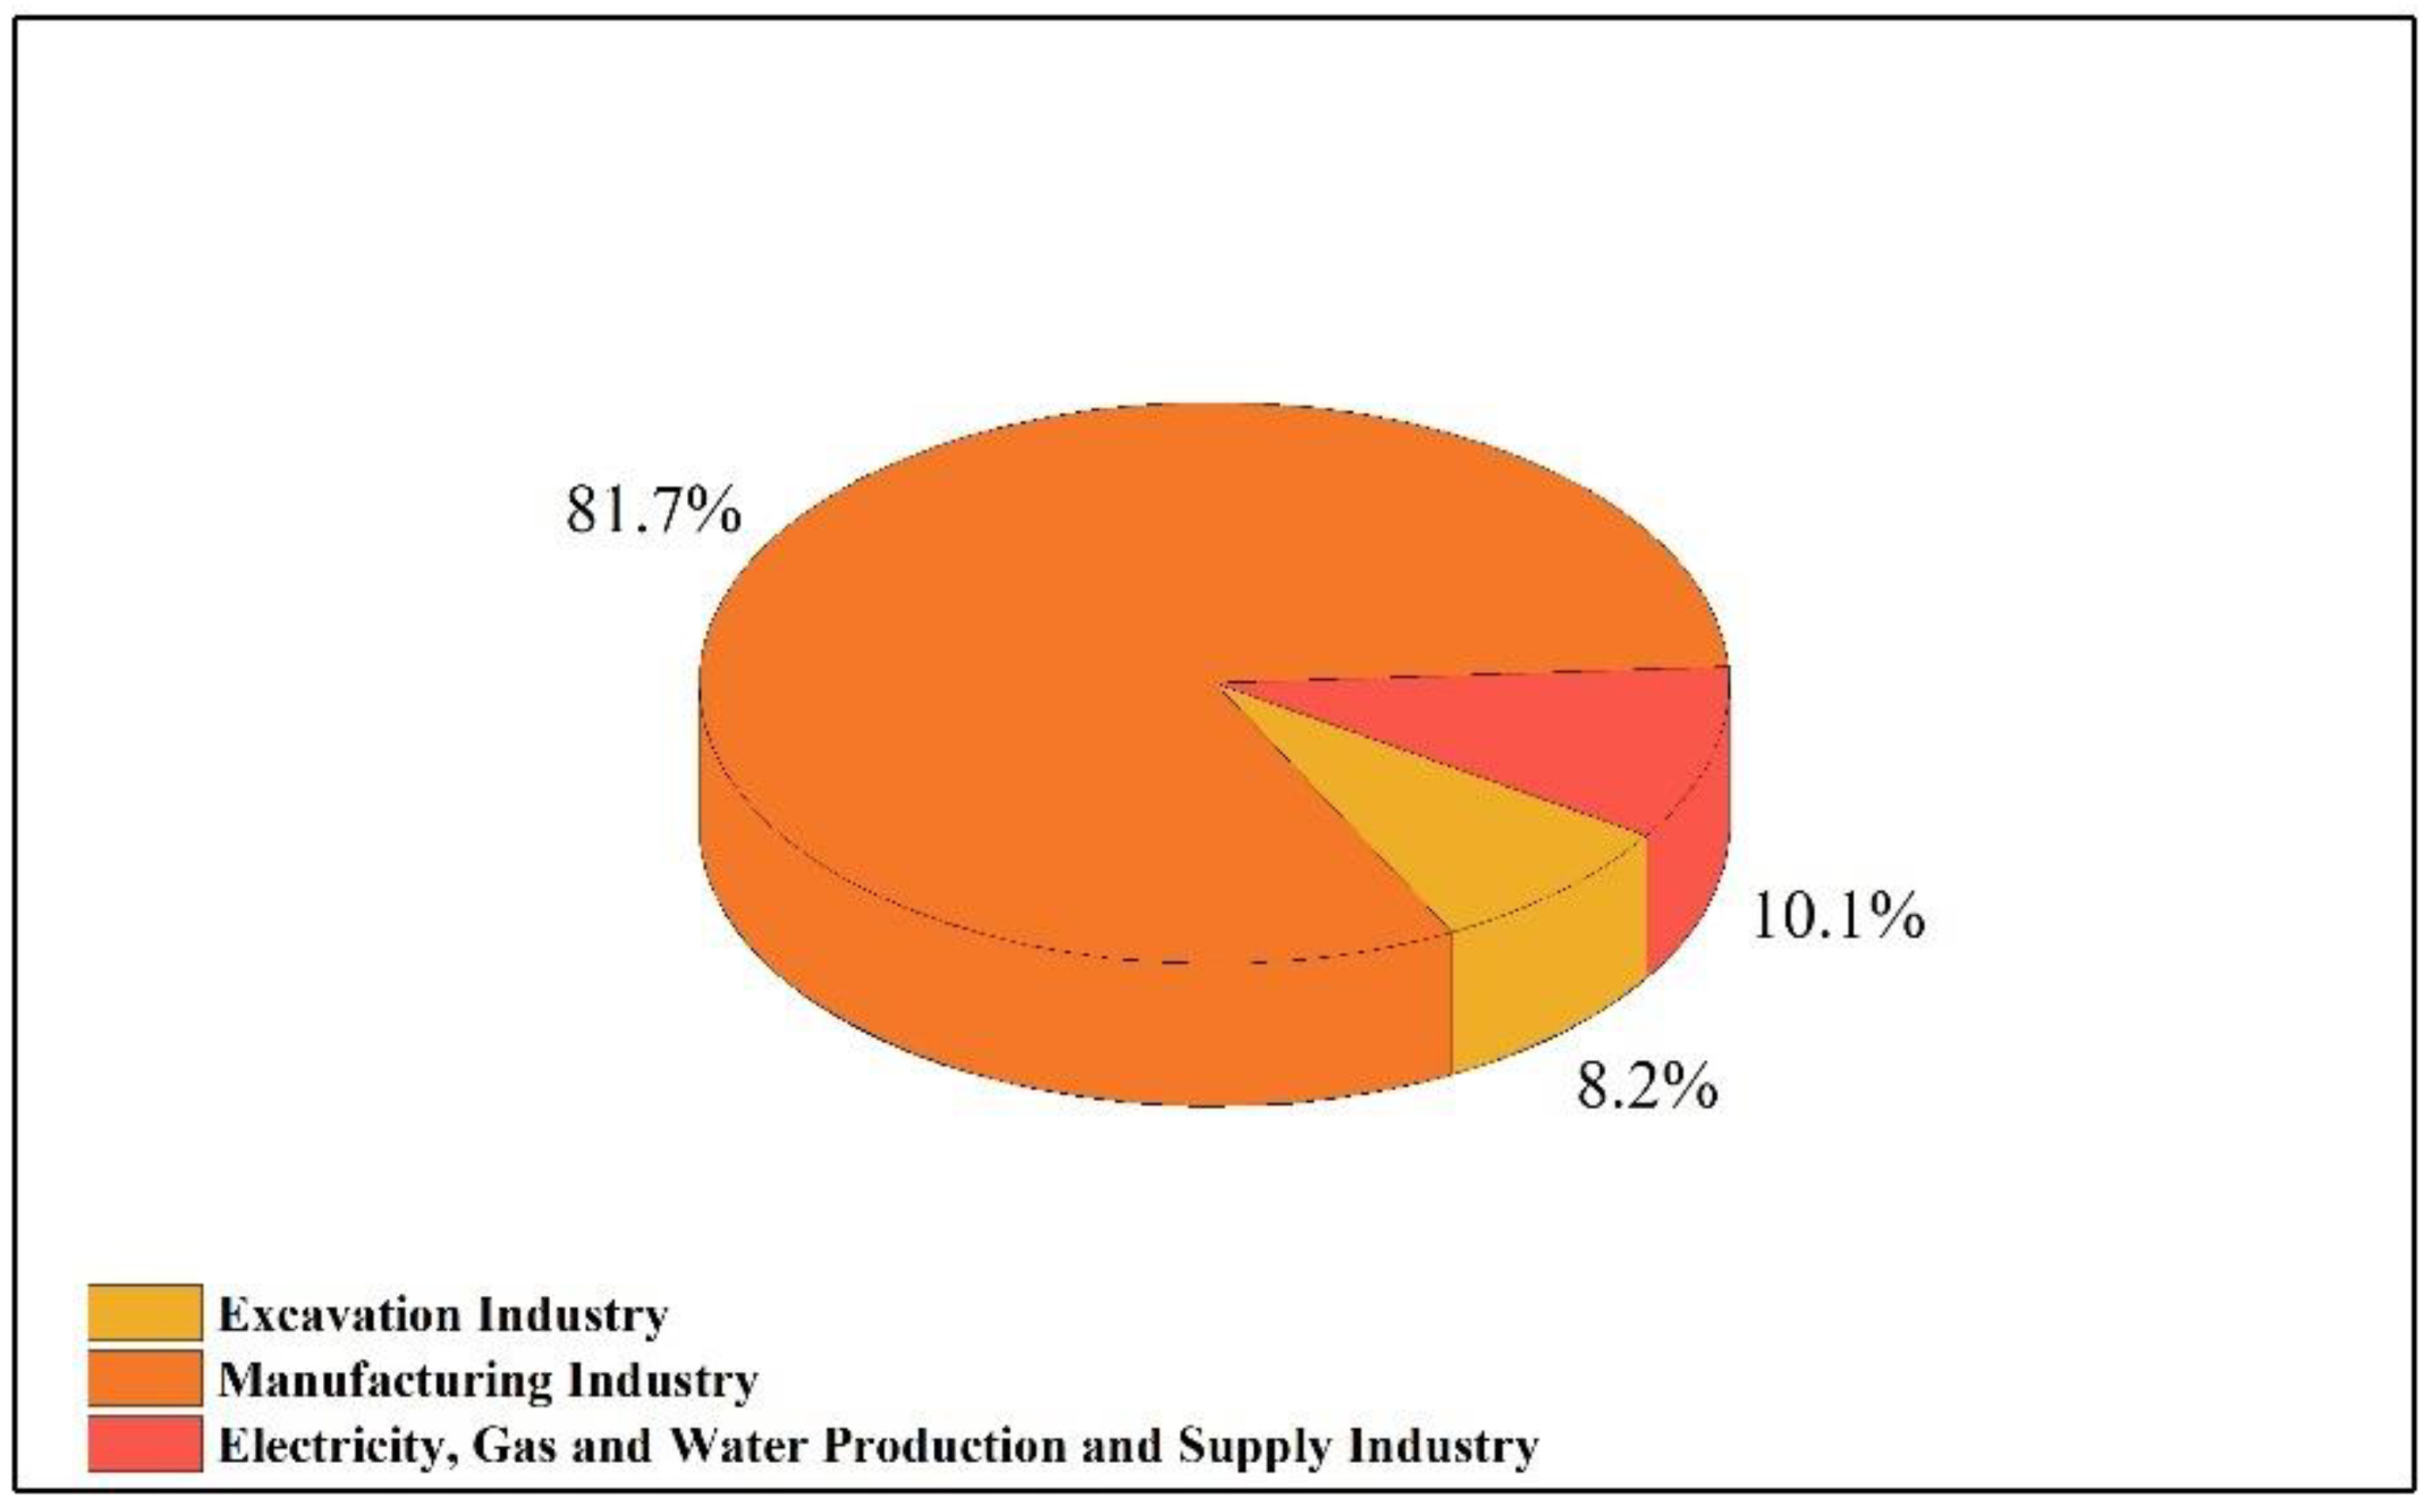
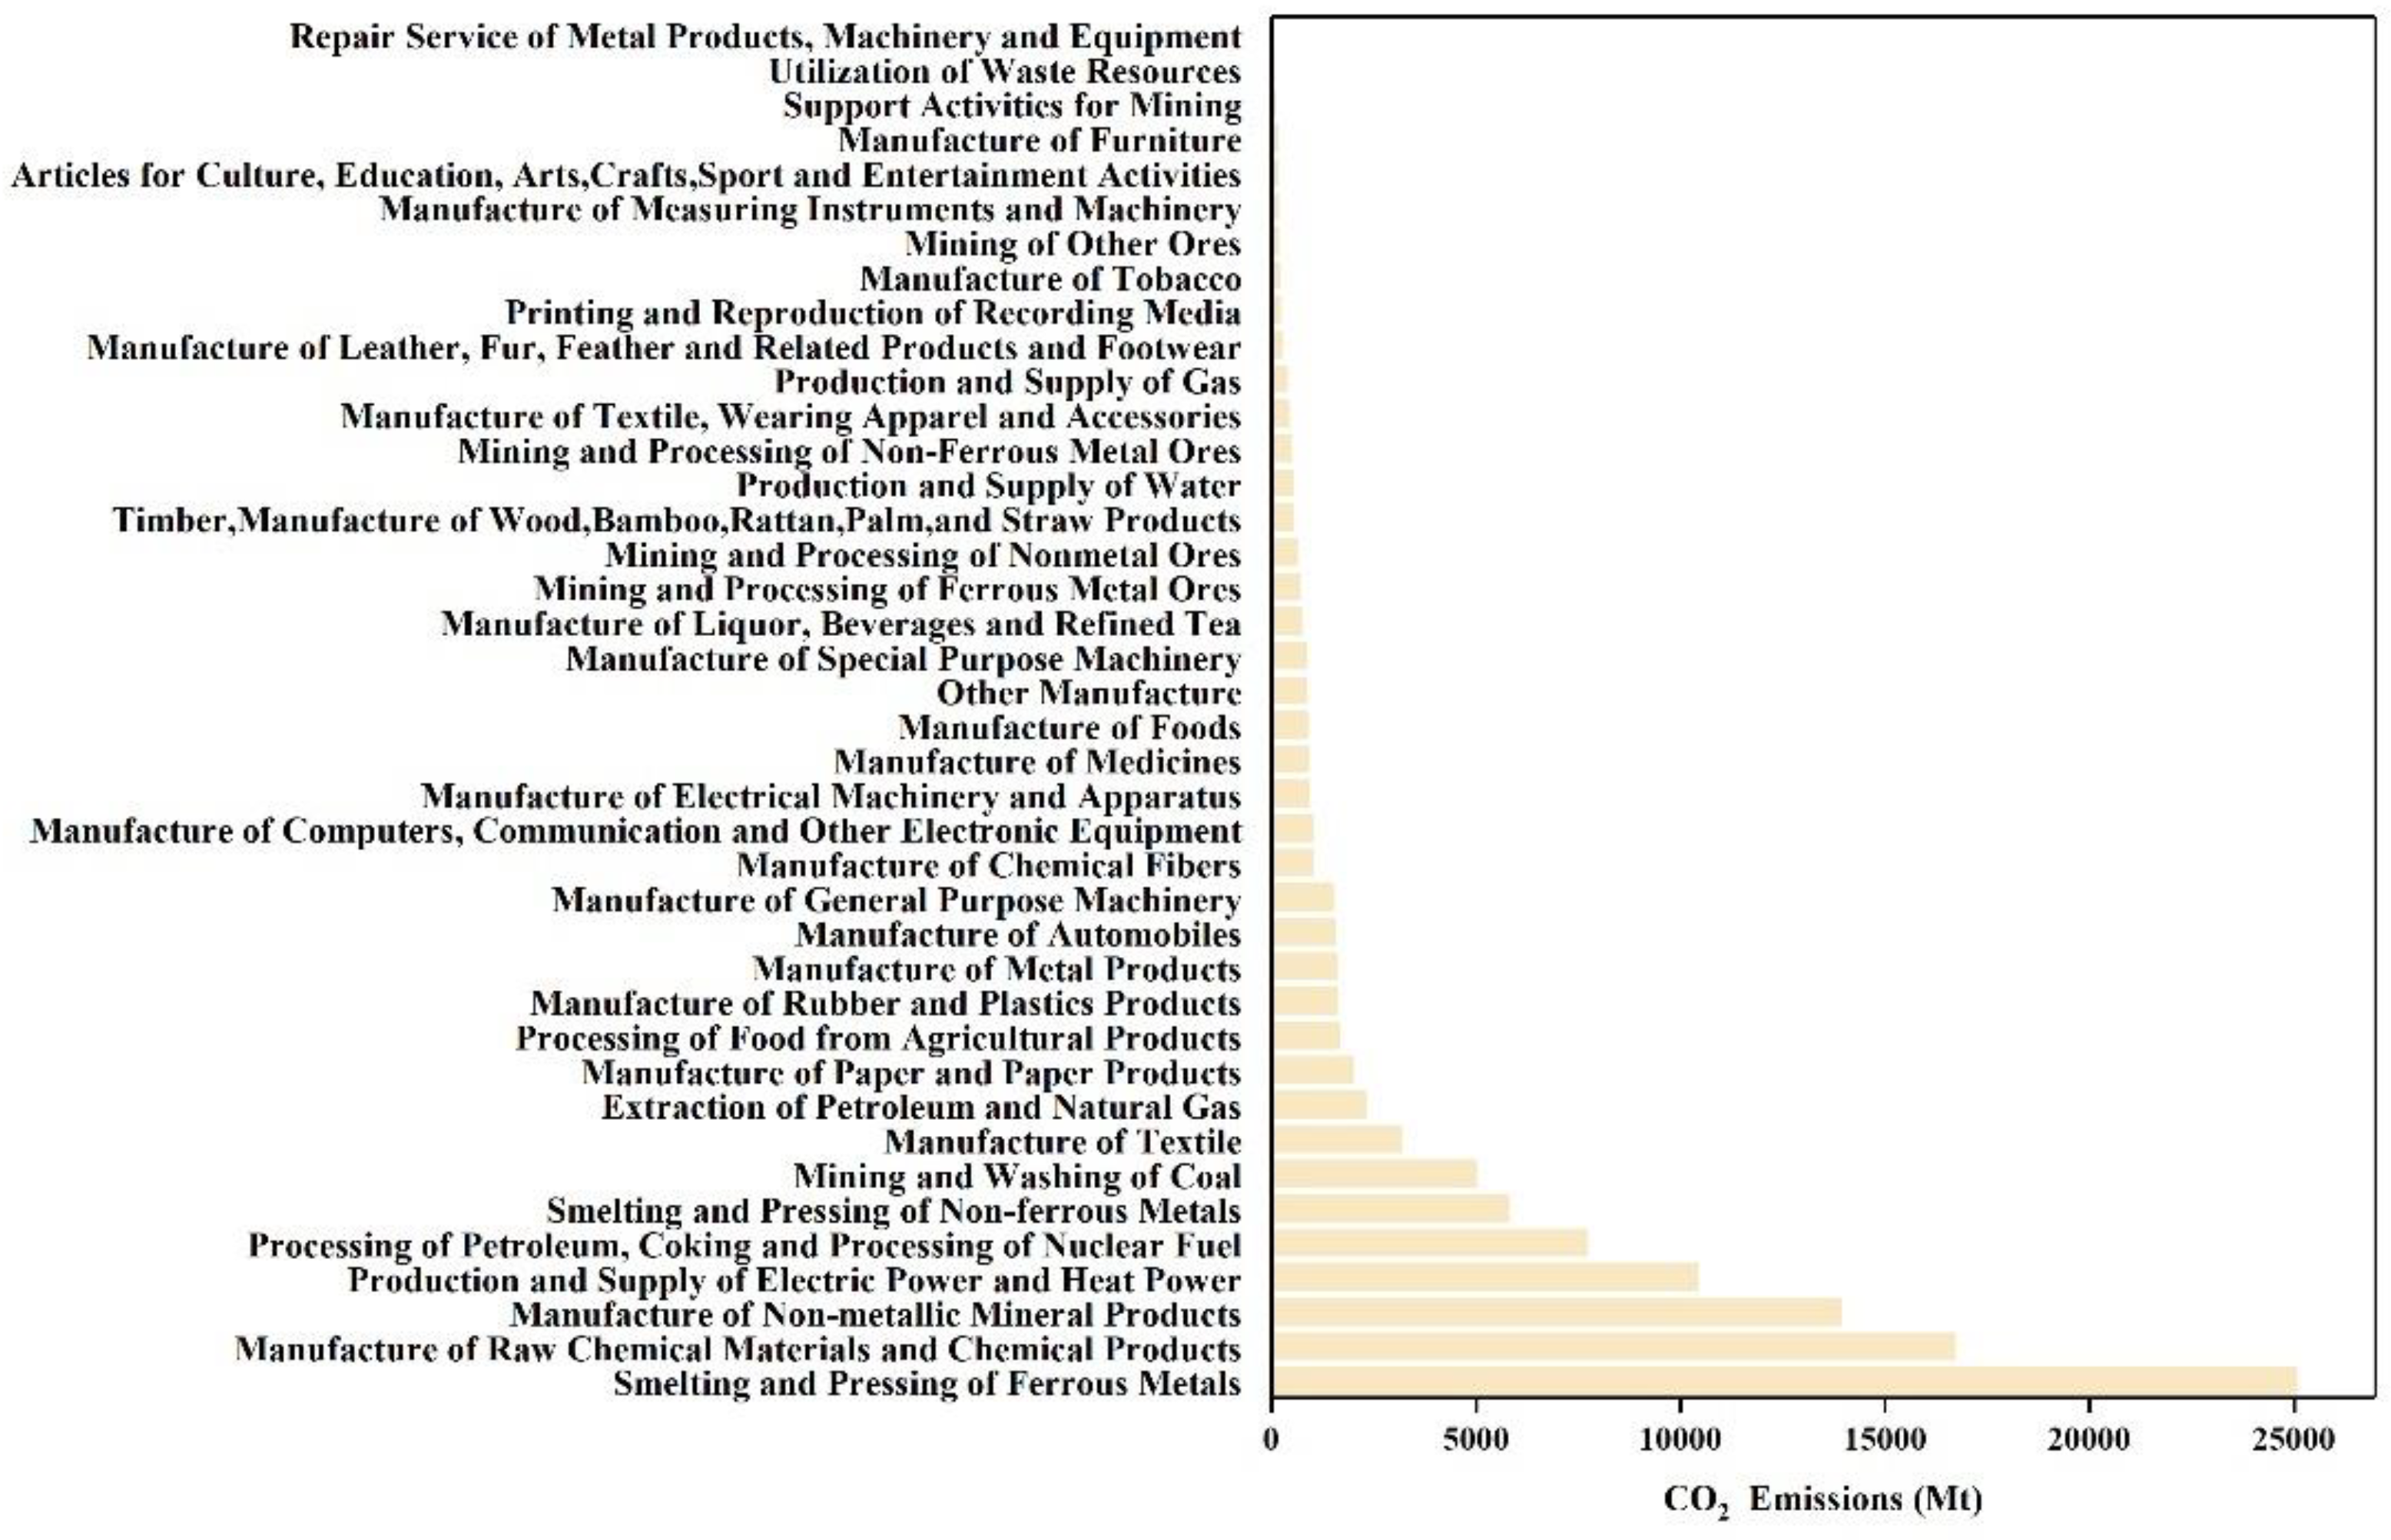
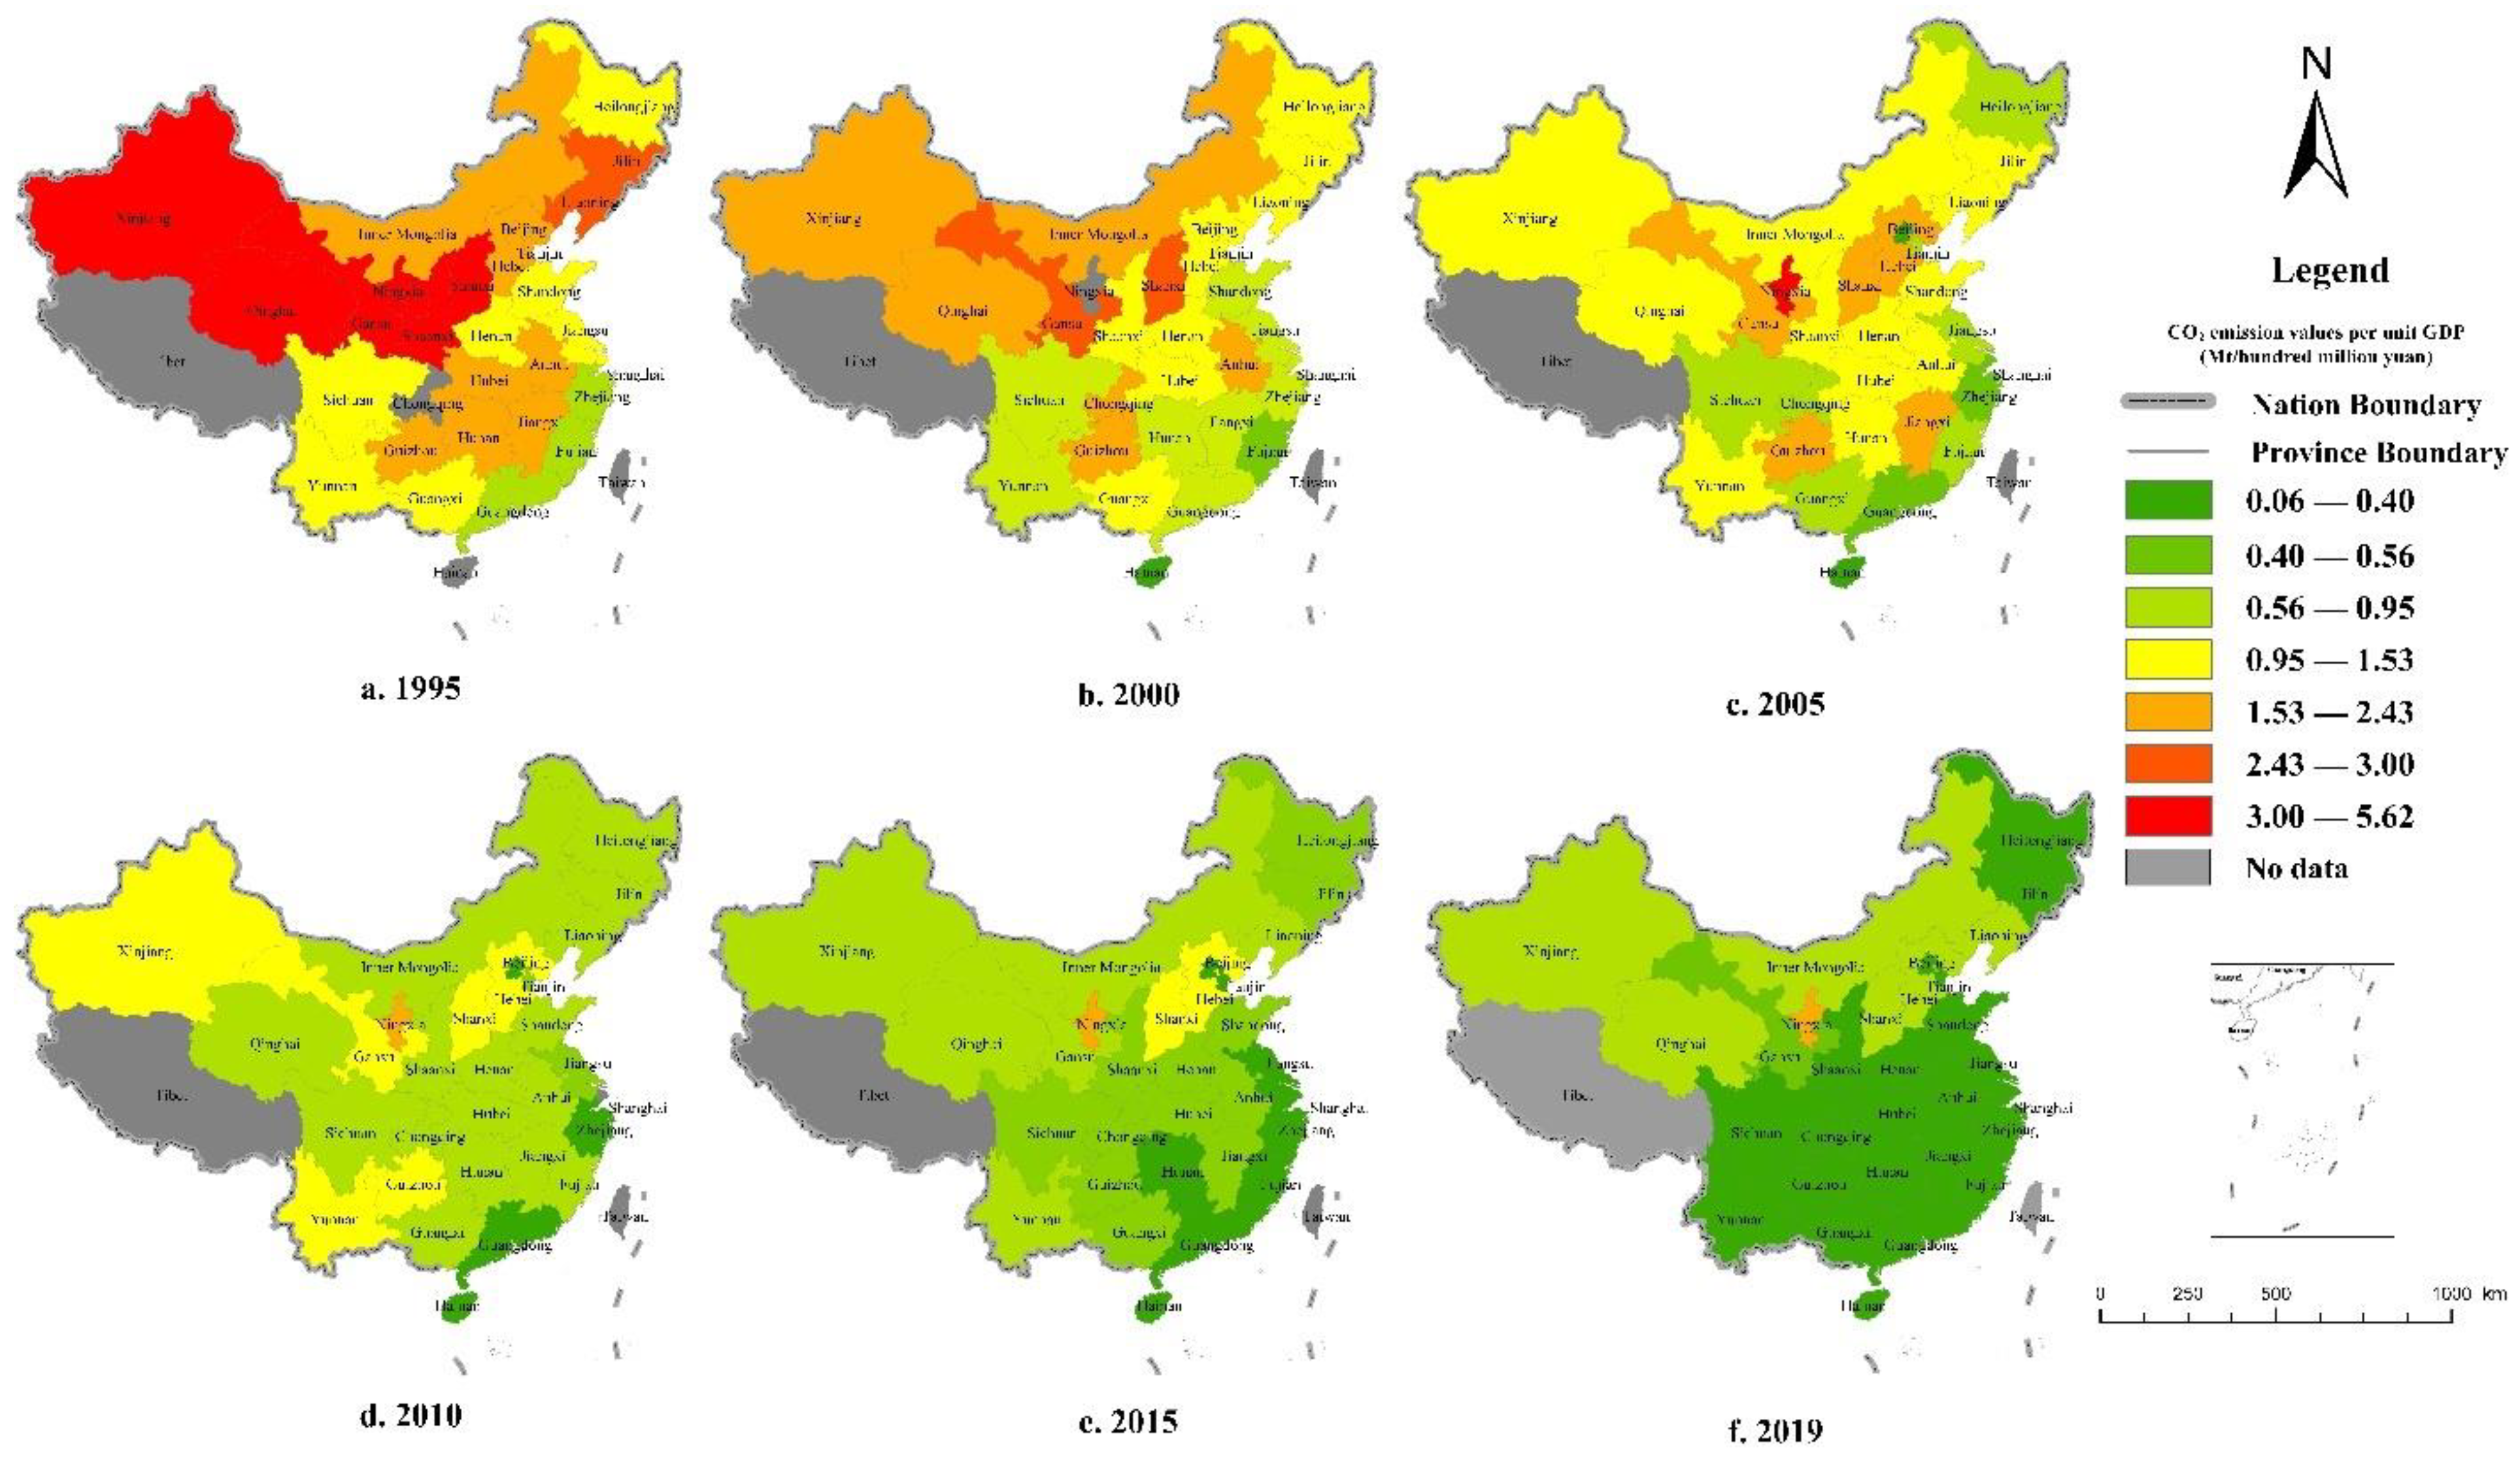
3.2. Structual Characteristics of National Industrial CO2 Emissions

According to Figure 3, during 1995–2019 manufacturing sector accounts for 81.7% of industrial CO2 emissions. From 1995 to 2019, seven subsectors of the top 10 CO2 emissions in the industrial sector belong to manufacturing. The seven subsectors include smelting and pressing of ferrous metals (24,972.9 Mt), raw chemical materials and chemical products (16,651.6 Mt), non-metal mineral products (13,863.8 Mt), petroleum processing and coking products sector (7640.1 Mt), smelting and pressing of non-ferrous metals (5744.0 Mt), textile (3136.3 Mt), and paper and paper products (1978.7 Mt). As shown in Figure 4, the CO2 emissions of smelting and pressing of ferrous metals subsector contributed most, accounting for 22.5% of the total industrial CO2 emissions during the study period. The smelting and pressing of the ferrous metals sector is an industrial subsector with large CO2 emissions.
Since the contributions of the top six CO2 emissions subsectors are above 5%, the temporal variation characteristics of the CO2 emissions of these six subsectors in the past 25 years are shown in Figure 5. During 1995–2019, the CO2 emissions of the six industrial subsectors mainly showed an increasing trend. In addition, the CO2 emissions of the smelting and pressing of ferrous metals and the non-metal mineral products fluctuated at a stable level or even showed a slowly decreasing trend after 2010. During 1995–2010, the period of “9th Five-year Plan”, “10th Five-year Plan”, and “11th Five-year Plan” in China, China paid more attention to economic growth rather than environmental protection. After 2010, the central government of China put forward a series of macroscopic energy saving, carbon reduction, and climate change mitigation-related policies. The Industrial Actions Plan for Addressing Climate Change (2012–2020) is one of the most important influencing policies during this period. In this document, the governor concentrated more on the ferrous metal, petroleum processing, chemical products, construction materials, textile, and electronic equipment-related sectors. This is the main reason why the slowly decreasing trend of the CO2 emissions in the two subsectors, smelting and pressing of ferrous metals and non-metal mineral products, appeared during the recent past decade.

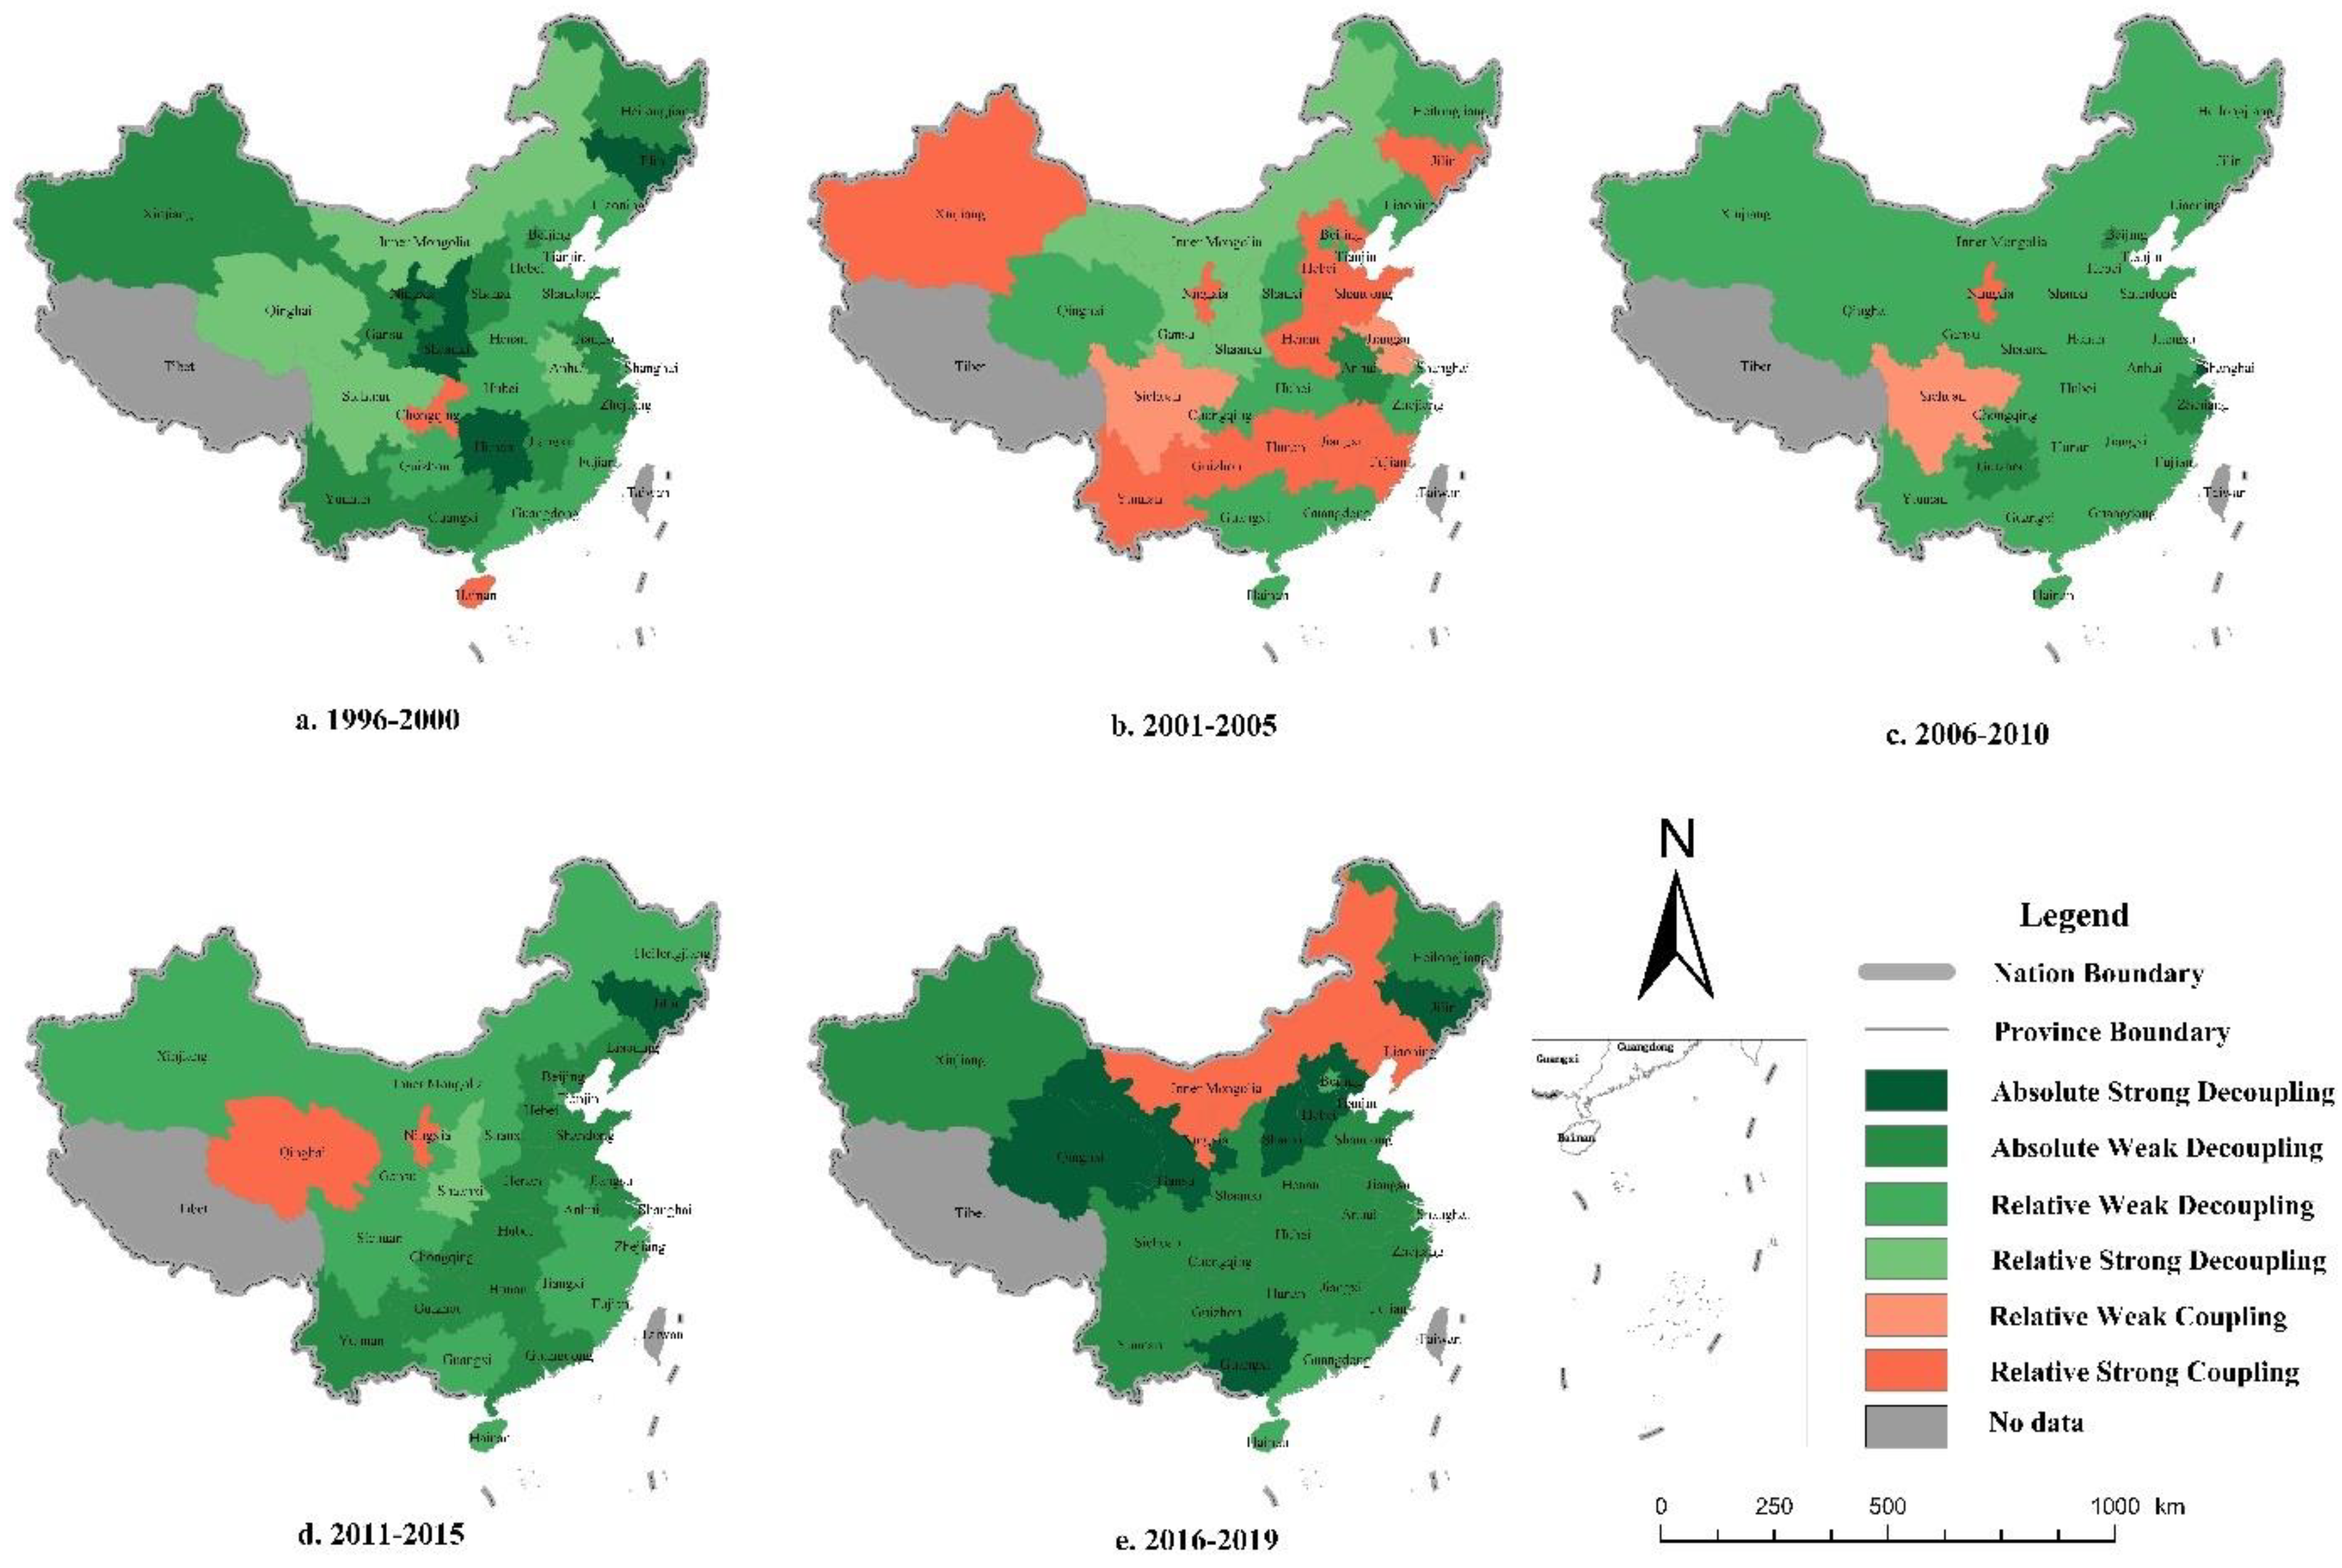
3.3. Industrial CO2 Emissions and Economic Decoupling Analysis

Based on the periodical variation characteristics of the industrial CO2 emissions illustrated above, the period 1995–2019 is divided into five phases according to the period of China’s Five-year Plan. The five phases are as follows: first phase (1995–2000), second phase (2001–2005), third phase (2006–2010), fourth phase (2011–2015), and fifth phase (2016–2019). Figure 6 describes the spatiotemporal variation characteristics of the CO2 emissions intensity in the industrial sector at the provincial level during 1995–2019. The industrial CO2 emissions intensity showed a decreasing variation trend, and “low-east high-west” “low-south high-north” combined spatial pattern.
Figure 7 and Table 4 illustrate the decoupling status of the CO2 emissions from economic growth at the provincial level at the 5 phases covering 1995–2019. In the first phase (1995–2000), more than 90% of provincial administrative units achieved decoupling status. Only Hainan and Chongqing did not achieve decoupling. The relationship between industrial CO2 emissions and economic growth during 1995–2000 in Hainan and Chongqing was relatively strong coupling status. There were 13 provincial administrative units, more than 40%, achieving the absolute decoupling status. In addition, the decoupling status of four provincial administrative units, including Jilin, Hunan, Shaanxi, and Ningxia, were absolute strong decoupling, which is the most desirable decoupling status of CO2 emissions from economic growth.
In the second phase (2001–2005), about 50% of provincial administrative units achieved the decoupling status. Only Anhui achieved the absolute decoupling of the industrial CO2 emissions from economic growth. However, the absolute decoupling status Anhui achieved is weak. The decoupling status of 13 provincial administrative units, including Hebei, Jilin, Jiangsu, Fujian, Jiangxi, Shandong, Henan, Hunan, Sichuan, Guizhou, Yunnan, Ningxia, and Xinjiang, changed from decoupling during 1995–2000 to coupling during 2001–2005. Generally, the decoupling status of the industrial CO2 emissions from economic growth became worse in the second phase.
In the third phase (2006–2010), more than 90% of provincial administrative units achieved decoupling of the industrial CO2 emissions from economic growth. The decoupling status became better during the third phase compared with the second phase. However, the decoupling status achieved during the third phase were mostly the relative decoupling status. Only three provincial administrative units achieved absolute decoupling of CO2 emissions in the industrial sector from economic growth. The decoupling of industrial CO2 emissions from economic growth in Beijing and Zhejiang was absolute weak decoupling. The decoupling status Shanghai achieved was absolute strong decoupling. In 2003, Shanghai proposed an important policy to construct Yangpu Innovation Region and transform the “Industrial Yangpu” to “Knowledgeable Yangpu”. The industrial structure shifted to modern design and intelligent manufacturing. The high-tech low-carbon industrial structure shift to local practice in Shanghai is worthy of reference for the developed regions, especially the provinces in the coastal eastern region.
In the fourth phase (2011–2015), the decoupling status of industrial CO2 emissions from economic growth improved further on the basis of the third phase. More than 90% of provincial administrative units achieved decoupling status. In particular, the absolute decoupling proportion increased from below 10% during 2006–2010 to nearly 50% in the fourth phase. Fourteen provincial administrative units, including Beijing, Hebei, Liaoning, Jilin, Shanghai, Jiangsu, Shandong, Henan, Hubei, Hunan, Guangdong, Chongqing, Guizhou, and Yunnan, achieved absolute decoupling of the industrial CO2 emissions from economic growth. The reason for the decoupling status improvement is mainly attributed to the macroscopic climate change mitigation policies.
In the fifth phase (2016–2019), all the 31 provincial administrative units in this research achieved decoupling of the CO2 emissions in the industrial sector from economic growth. More than 70% of provincial administrative units achieved absolute decoupling status, and more than 20% achieved absolute strong decoupling of the industrial CO2 emissions from economic growth. Generally, the decoupling status of industrial CO2 emissions from economic growth has kept a continuously improving trend since the second phase. However, efforts are still needed to achieve the absolute strong decoupling of the CO2 emissions from economic growth.

4. Conclusions

This paper revealed the spatiotemporal characteristics of the decoupling status of industrial CO2 emissions from economic growth and analyzed the structural characteristics of the industrial CO2 emissions. It can help identify the key subsector and good local practices to reduce the CO2 emissions in the industrial sector. This research will provide scientific support to the formulation and implementation of feasible CO2 reduction policies in the industrial sector in China.
Both the amount and the decoupling status of industrial CO2 emissions had obvious periodical variation characteristics. 2010 is a turning point. Since 2010, the decoupling status of industrial CO2 emissions from economic growth has kept a continuously improving trend. During the recent phase (2016–2019), all 31 provincial administrative units in this research achieved decoupling of the CO2 emissions in the industrial sector from economic growth. More than 20% achieved absolute strong decoupling, which is the most desirable status. The high-tech low-carbon industrial structure shift local practice in Shanghai is worthy of reference for the developed regions, especially the provinces in the coastal eastern region.
More attention should be paid to the four subsectors, including raw chemical materials and chemical products, production and supply of electric power and heat power, petroleum processing and coking products, and smelting and pressing of non-ferrous metals when formulating the energy-saving and carbon reduction policies in the next step.

Author Contributions

Conceptualization, J.Z. and D.M.; methodology, J.Z.; software, D.M.; validation, Y.L., J.Z., Z.L. and S.L.; formal analysis, D.M., J.Z., S.L. and H.Y.; investigation, D.M.; resources, D.M.; data curation, D.M.; writing—original draft preparation, D.M. and J.Z.; writing—review and editing, J.Z.; visualization, D.M. and J.Z.; supervision, Y.L. and J.Z.; project administration, Y.L.; funding acquisition, Y.L. All authors have read and agreed to the published version of the manuscript.

Funding

This research was funded by the National Natural Science Foundation of China (Grant No. 41771182), the National Key Research and Development Program of China (Grant No. 2017FY101303 and 2017FY101304).

Institutional Review Board Statement

Not applicable.

Informed Consent Statement

Not applicable.

Data Availability Statement

Not applicable.

Conflicts of Interest

The authors declare no conflict of interest.

References

  1. Song, M.; Wang, S.; Yu, H.; Wu, J. To reduce energy consumption and to maintain rapid economic growth: Analysis of the condition in China based on expended IPAT model. Renew. Sustain. Energy Rev. 2011, 15, 5129–5134. [Google Scholar] [CrossRef]
  2. Chontanawat, J. Driving forces of energy-related CO2 emissions based on expanded IPAT decomposition analysis: Evidence from ASEAN and four selected countries. Energies 2019, 12, 764. [Google Scholar] [CrossRef] [Green Version]
  3. Zaman, K.; Moemen, M.A. Energy consumption, carbon dioxide emissions and economic development: Evaluating alternative and plausible environmental hypothesis for sustainable growth. Renew. Sustain. Energy Rev. 2017, 74, 1119–1130. [Google Scholar] [CrossRef]
  4. Wu, R.; Geng, Y.; Cui, X.; Gao, Z.; Liu, Z. Reasons for recent stagnancy of carbon emissions in China’s industrial sectors. Energy 2019, 172, 457–466. [Google Scholar] [CrossRef]
  5. Han, J.; Du, T.Y. Correlation analysis of CO2 emissions, material stocks and economic growth nexus: Evidence from Chinese provinces. J. Clean. Prod. 2018, 180, 395–406. [Google Scholar] [CrossRef]
  6. Chen, N.; Xu, L. Relationship between air quality and economic development in the provincial capital cities of China. Environ. Sci. Pollut. Res. 2017, 24, 2928–2935. [Google Scholar] [CrossRef]
  7. GCP: Global Carbon Budget 2019. Available online: https://www.globalcarbonproject.org/ (accessed on 4 December 2019).
  8. Chong, C.H.; Tan, W.X.; Ting, Z.J.; Liu, P.; Ma, L.W.; Li, Z.; Ni, W.D. The driving factors of energy-related CO2 emission growth in Malaysia: The LMDI decomposition method based on energy allocation analysis. Renew. Sustain. Energy Rev. 2019, 115, 109356. [Google Scholar] [CrossRef]
  9. Zhao, X.R.; Zhang, X.; Li, N.; Shao, S.; Geng, Y. Decoupling economic growth from carbon dioxide emissions in China: A sectoral factor decomposition analysis. J. Clean. Prod. 2017, 142, 3500–3516. [Google Scholar] [CrossRef]
  10. Zhao, X.R.; Zhang, X.; Shao, S. Decoupling CO2 emissions and industrial growth in China over 1993–2013: The role of investment. Energy Econ. 2016, 60, 275–292. [Google Scholar] [CrossRef]
  11. Eng, Y.K.; Wong, C.Y. Tapered US carbon emissions during good times: What’s old, what’s new? Environ. Sci. Pollut. Res. Int. 2017, 24, 25047–25060. [Google Scholar] [CrossRef]
  12. Xie, P.J.; Yang, F.; Mu, Z.W.; Gao, S.S. Influencing factors of the decoupling relationship between CO2 emission and economic development in China’s power industry. Energy 2010, 209, 118341. [Google Scholar] [CrossRef]
  13. Akpan, U.S.; Green, O.A. Effect of Technology Change on CO2 Emissions in Japan’s Industrial Sectors in the Period 1995–2005: An Input–Output Structural Decomposition Analysis. Environ. Resour. Econ. 2015, 61, 165–189. [Google Scholar] [CrossRef]
  14. Zhou, Z.Z.; Wang, J.L. Research progress and implication about hypothesis test of environmental Kuznets curve (in Chinese). Chin. J. Agric. Resour. Reg. Plan. 2020, 1, 185–193. [Google Scholar]
  15. Kaika, D.; Zervas, E. The environmental Kuznets curve (EKC) theory. Part B: Critical issues. Energy Policy 2013, 62, 1403–1411. [Google Scholar] [CrossRef]
  16. Wang, K.; Wei, Y.M. Potential gains from carbon emissions trading in China: A DEA based estimation on abatement cost savings. Omega 2016, 63, 48–59. [Google Scholar] [CrossRef]
  17. Organization for Economic Cooperation and Development (OECD). Indicators to Measure Decoupling of Environmental Pressure from Economic Growth; Organization for Economic Cooperation: Paris, France, 2003. [Google Scholar]
  18. Zhang, Y.J.; Da, Y.B. The decomposition of energy-related carbon emission and its decoupling with economic growth in China. Renew. Sustain. Energy Rev. 2015, 41, 1255–1266. [Google Scholar] [CrossRef]
  19. Dong, J.F.; Deng, C.; Wang, X.M.; Zhang, X.L. Multilevel Index Decomposition of Energy-Related Carbon Emissions and Their Decoupling from Economic Growth in Northwest China. Energies 2016, 9, 680. [Google Scholar] [CrossRef]
  20. Tapio, P. Towards a theory of decoupling: Degrees of decoupling in the EU and the case of road traffic in Finland between 1970 and 2001. Transp. Policy 2005, 12, 137–151. [Google Scholar] [CrossRef] [Green Version]
  21. Wang, M.; Feng, C. Investigating the drivers of energy-related CO2 emissions in China’s industrial sector: From regional and provincial perspectives. Struct. Chang. Econ. Dyn. 2018, 46, 136–147. [Google Scholar] [CrossRef]
  22. Zheng, J.; Hu, Y.J.; Dong, S.C.; Li, Y. The spatiotemporal pattern of decoupling transport CO2 emissions from economic growth across 30 provinces in China. Sustainability 2019, 11, 2564. [Google Scholar] [CrossRef] [Green Version]
  23. Zhu, L.; He, L.; Shang, P.; Zhang, Y.; Ma, X. Influencing factors and scenario forecasts of carbon emissions of the Chinese power industry: Based on a Generalized Divisia Index Model and Monte Carlo Simulation. Energies 2018, 11, 2398. [Google Scholar] [CrossRef] [Green Version]
  24. Juknys, R. Transition period in Lithuania-do we move to sustainability. Eng. Manag. 2003, 4, 4–9. [Google Scholar]
  25. Loo, B.P.Y.; Banister, D. Decoupling transport from economic growth: Extending the debate to include environmental and social externalities. J. Transp. Geogr. 2016, 57, 134–144. [Google Scholar] [CrossRef]
  26. Intergovernmental Panel on Climate Change. 2006 IPCC Guidelines for National Greenhouse Gas Inventories; Institute for Global Environmental Strategies (IGES): Kyoto, Japan, 2006. [Google Scholar]
  27. National Bureau of Statistics of China. China Energy Statistical Yearbook (1996–2017); China Statistics Press: Beijing, China, 2018.
  28. National Bureau of Statistics of China. China Statistical Yearbook (1996–2017); China Statistics Press: Beijing, China, 2018.
Figure 1. The changes of China’s industrial CO2 emissions.
Energies 14 05099 g001
Figure 2. Industrial CO2 emissions at the provincial level during 1995–2019.
Energies 14 05099 g002
Figure 3. Proportion of CO2 emissions in the excavation, manufacturing, electricity, gas and water production, and supply first-layer subsectors.
Energies 14 05099 g003
Figure 4. CO2 emissions from industrial sub-sectors during 1995–2019.
Energies 14 05099 g004
Figure 5. Changes in CO2 emissions from the top six industrial subsectors from 1995 to 2019.
Energies 14 05099 g005
Figure 6. Industrial CO2 intensity at the provincial level during 1995–2019.
Energies 14 05099 g006
Figure 7. Decoupling status of industrial CO2 emissions from economic growth.
Energies 14 05099 g007
Table 1. Decoupling Types.
CO2 Emissions
Decrease   ( Δ CO 2   < 0 ) Increase   ( Δ CO 2   > 0 )
GDPGrowth
( Δ G D P > 0 )
c i decrease, | Δ G D P | > | Δ C O 2 |
| e i | < 1 , negative
Absolute Weak Decoupling
c i increase, | Δ G D P | | Δ C O 2 |
| e i | 1 , positive
Relative Strong Coupling
c i decrease, | Δ G D P | | Δ C O 2 |
| e i | 1 , negative
Absolute Strong Decoupling
c i decrease, | Δ G D P | > | Δ C O 2 |
| e i | < 1 , positive
Relative Weak Decoupling
not possible c i decrease, | Δ G D P | | Δ C O 2 |
| e i | 1 , positive
Relative Strong Decoupling
not possible c i increase, | Δ G D P | > | Δ C O 2 |
| e i | < 1 , positive
Relative Weak Coupling
Decline
( Δ G D P < 0 )
c i increase, | Δ G D P | > | Δ C O 2 |
| e i | < 1 , positive
Relative Weak Coupling
c i increase, | Δ G D P | > | Δ C O 2 |
| e i | < 1 , negative
Absolute Weak Coupling
c i decrease, | Δ G D P | > | Δ C O 2 |
| e i | < 1 , positive
Relative Weak Decoupling
not possible
c i decrease, | Δ G D P | | Δ C O 2 |
| e i | 1 , positive
Relative Strong Decoupling
c i increase, | Δ G D P | | Δ C O 2 |
| e i | 1 , negative
Absolute Strong Coupling
c i increase, | Δ G D P | | Δ C O 2 |
| e i | 1 , positive
Relative Strong Coupling
not possible
Table 2. Calorific values and CO2 emission factors of fossil fuel combustion 1.
Fossil FuelCalorific Value
( kj / kg   or   kj / m 3 )
Unit Calorific Value
( kJ / TJ )
CO2 Emission Factor
( kj / kg     or   kj / m 3 )  
Raw coal20,90896,6902.022
Coke28,435107,0003.043
Crude oil41,81673,3003.065
Gasoline43,07069,3002.985
Kerosene43,07071,9003.097
Diesel42,65274,1003.161
Liquefied Petroleum gas 50,17963,1003.166
Natural gas38,93156,1002.184
Coke28,435107,0003.043
1 According to the China Energy Statistics Yearbook, 1 kg of standard coal is converted to a value of 2.204 kg/kg.
Table 3. The statistical description of industrial CO2 emissions and GDP at the provincial level.
RegionIndustrial CO2 Emissions (Mt)GDP (100 Million Yuan, Base Year = 2015)
199520002005201020152019199520002005201020152019
Beijing33.536.235.522.813.310.92162.33514.59131.316196.123014.632455.6
Tianjin29.226.434.548.659.752.01426.32324.44903.110585.616538.218087.6
Hebei104.6109.3245.1325.7349.4295.14417.27215.413387.523403.529806.132210.9
Shanxi70.669.8116.3144.4156.1126.71693.52330.75542.110558.512766.515623.2
Inner Mongolia29.640.474.796.6132.5178.51291.11986.45165.513394.317831.520455.2
Liaoning105.898.2105.3201.7190.4176.44330.26620.010620.021180.728669.022856.2
Jilin48.836.858.688.469.748.21750.42582.24800.59946.514063.116403.5
Heilongjiang41.848.152.273.372.053.53122.84612.37308.311898.515083.717497.8
Shanghai48.654.961.90.054.158.13817.46452.912138.519698.925123.535010.2
Jiangsu104.893.4166.0209.2218.0182.27991.412169.124273.547538.070116.491418.9
Zhejiang49.750.793.996.1100.457.75464.08558.617818.731812.942886.557212.1
Anhui56.173.575.6107.4123.087.93105.94307.87127.514183.022005.634054.7
Fujian20.925.760.798.597.777.53349.15558.18710.516911.725979.838900.4
Jiangxi32.423.8130.769.789.766.51930.12840.15379.310845.816723.822716.8
Shandong90.096.0243.8312.2295.3203.57754.412111.924553.544949.663002.373836.6
Henan64.370.1153.0220.7175.6103.54654.77284.414039.026499.837002.249786.6
Hubei76.884.0107.1162.7136.597.93707.16063.28645.818323.729550.242050.7
Hunan67.540.5113.2133.9115.184.83403.75234.58634.118404.428902.236475.4
Guangdong69.377.7127.9183.5145.1128.48888.513699.629658.252802.572812.698795.8
Guangxi36.032.746.380.485.666.52489.82906.85404.510981.916803.119486.6
Hainan0.01.92.85.46.67.9564.5735.11186.22369.13702.84871.3
Chongqing--44.236.378.969.738.3--2253.54071.59095.015717.321660.0
Sichuan76.644.569.5135.7157.989.35478.25685.99792.719721.330053.142773.3
Guizhou22.827.459.459.155.243.4946.71408.72624.35281.210502.615387.1
Yunnan26.124.168.188.183.181.21870.52772.04605.18290.113619.221309.4
Shaanxi36.123.649.574.199.873.5816.61660.93675.710123.518021.923667.1
Gansu25.424.836.242.152.434.3451.7983.41934.04120.86790.37999.7
Qinghai4.44.86.210.720.215.6138.2263.6543.31350.42417.12721.5
Ningxia6.00.021.929.349.063.3134.0265.6606.11689.72911.83439.5
Xinjiang21.422.039.860.474.374.5673.71364.42604.25437.59324.812476.3
Table 4. The decoupling types for each province in five phases.
The First PhaseThe Second PhaseThe Third PhaseThe Fourth PhaseThe Fifth Phase
BeijingAbsolute Weak DecouplingRelative Weak DecouplingAbsolute Weak DecouplingAbsolute Weak DecouplingRelative Weak Decoupling
TianjinRelative Weak DecouplingRelative Weak DecouplingRelative Weak DecouplingRelative Weak DecouplingAbsolute Strong Decoupling
HebeiRelative Weak DecouplingRelative Strong CouplingRelative Weak DecouplingAbsolute Weak DecouplingAbsolute Strong Decoupling
ShanxiAbsolute Weak DecouplingRelative Weak DecouplingRelative Weak DecouplingRelative Weak DecouplingAbsolute Strong Decoupling
Inner MongoliaRelative Strong DecouplingRelative Strong DecouplingRelative Weak DecouplingRelative Weak DecouplingRelative Strong Coupling
LiaoningRelative Weak DecouplingRelative Weak DecouplingRelative Weak DecouplingAbsolute Weak DecouplingRelative Strong Coupling
JilinAbsolute Strong DecouplingRelative Strong CouplingRelative Weak DecouplingAbsolute Strong DecouplingAbsolute Strong Decoupling
HeilongjiangAbsolute Weak DecouplingRelative Weak DecouplingRelative Weak DecouplingRelative Weak DecouplingAbsolute Weak Decoupling
ShanghaiRelative Weak DecouplingRelative Weak DecouplingAbsolute Strong DecouplingAbsolute Weak DecouplingRelative Weak Decoupling
JiangsuAbsolute Weak DecouplingRelative Weak CouplingRelative Weak DecouplingAbsolute Weak DecouplingAbsolute Weak Decoupling
ZhejiangAbsolute Weak DecouplingRelative Weak DecouplingAbsolute Weak DecouplingRelative Weak DecouplingAbsolute Weak Decoupling
AnhuiRelative Strong DecouplingAbsolute Weak DecouplingRelative Weak DecouplingRelative Weak DecouplingAbsolute Weak Decoupling
FujianRelative Weak DecouplingRelative Strong CouplingRelative Weak DecouplingRelative Weak DecouplingAbsolute Weak Decoupling
JiangxiAbsolute Weak DecouplingRelative Strong CouplingRelative Weak DecouplingRelative Weak DecouplingAbsolute Weak Decoupling
ShandongRelative Weak DecouplingRelative Strong CouplingRelative Weak DecouplingAbsolute Weak DecouplingAbsolute Weak Decoupling
HenanRelative Weak DecouplingRelative Strong CouplingRelative Weak DecouplingAbsolute Weak DecouplingAbsolute Weak Decoupling
HubeiRelative Weak DecouplingRelative Weak DecouplingRelative Weak DecouplingAbsolute Weak DecouplingAbsolute Weak Decoupling
HunanAbsolute Strong DecouplingRelative Strong CouplingRelative Weak DecouplingAbsolute Weak DecouplingAbsolute Weak Decoupling
GuangdongRelative Weak DecouplingRelative Weak DecouplingRelative Weak DecouplingAbsolute Weak DecouplingRelative Weak Decoupling
GuangxiAbsolute Weak DecouplingRelative Weak DecouplingRelative Weak DecouplingRelative Weak DecouplingAbsolute Strong Decoupling
HainanRelative Strong CouplingRelative Weak DecouplingRelative Weak DecouplingRelative Weak DecouplingRelative Weak Decoupling
ChongqingRelative Strong CouplingRelative Weak DecouplingRelative Weak DecouplingAbsolute Weak DecouplingAbsolute Weak Decoupling
SichuanRelative Strong DecouplingRelative Weak CouplingRelative Weak CouplingRelative Weak DecouplingAbsolute Weak Decoupling
GuizhouRelative Weak DecouplingRelative Strong CouplingAbsolute Weak DecouplingAbsolute Weak DecouplingAbsolute Weak Decoupling
YunnanAbsolute Weak DecouplingRelative Strong CouplingRelative Weak DecouplingAbsolute Weak DecouplingAbsolute Weak Decoupling
ShaanxiAbsolute Strong DecouplingRelative Strong DecouplingRelative Weak DecouplingRelative Strong DecouplingAbsolute Weak Decoupling
GansuAbsolute Weak DecouplingRelative Strong DecouplingRelative Weak DecouplingRelative Weak DecouplingAbsolute Strong Decoupling
QinghaiRelative Strong DecouplingRelative Weak DecouplingRelative Weak DecouplingRelative Strong CouplingAbsolute Strong Decoupling
NingxiaAbsolute Strong DecouplingRelative Strong CouplingRelative Strong CouplingRelative Strong CouplingRelative Strong Coupling
XinjiangAbsolute Weak DecouplingRelative Strong CouplingRelative Weak DecouplingRelative Weak DecouplingAbsolute Weak Decoupling
Publisher’s Note: MDPI stays neutral with regard to jurisdictional claims in published maps and institutional affiliations.

