
A Comparative Evaluation of Multi-Criteria Analysis Methods for Sustainable Transport


Abstract
:1. Introduction
- updating the review of the current applications of the MCDM/MCDA methods to the selected decision-making problems in the field of transport, along with indication of the latest trends;
- carrying out a multi-criteria analysis of design variants using a hybrid approach that includes the DEMATEL, REMBRANDT, and VIKOR methods;
- carrying out a comparative analysis of the results obtained with previous tests, which used a combination of the AHP, Fuzzy AHP, TOPSIS, and PROMETHEE methods; and
- an assessment of the methods applied in both studies in the context of their advantages, disadvantages, and limitations in solving contemporary problems in the field of transport.
2. Literature Review Materials and Methods
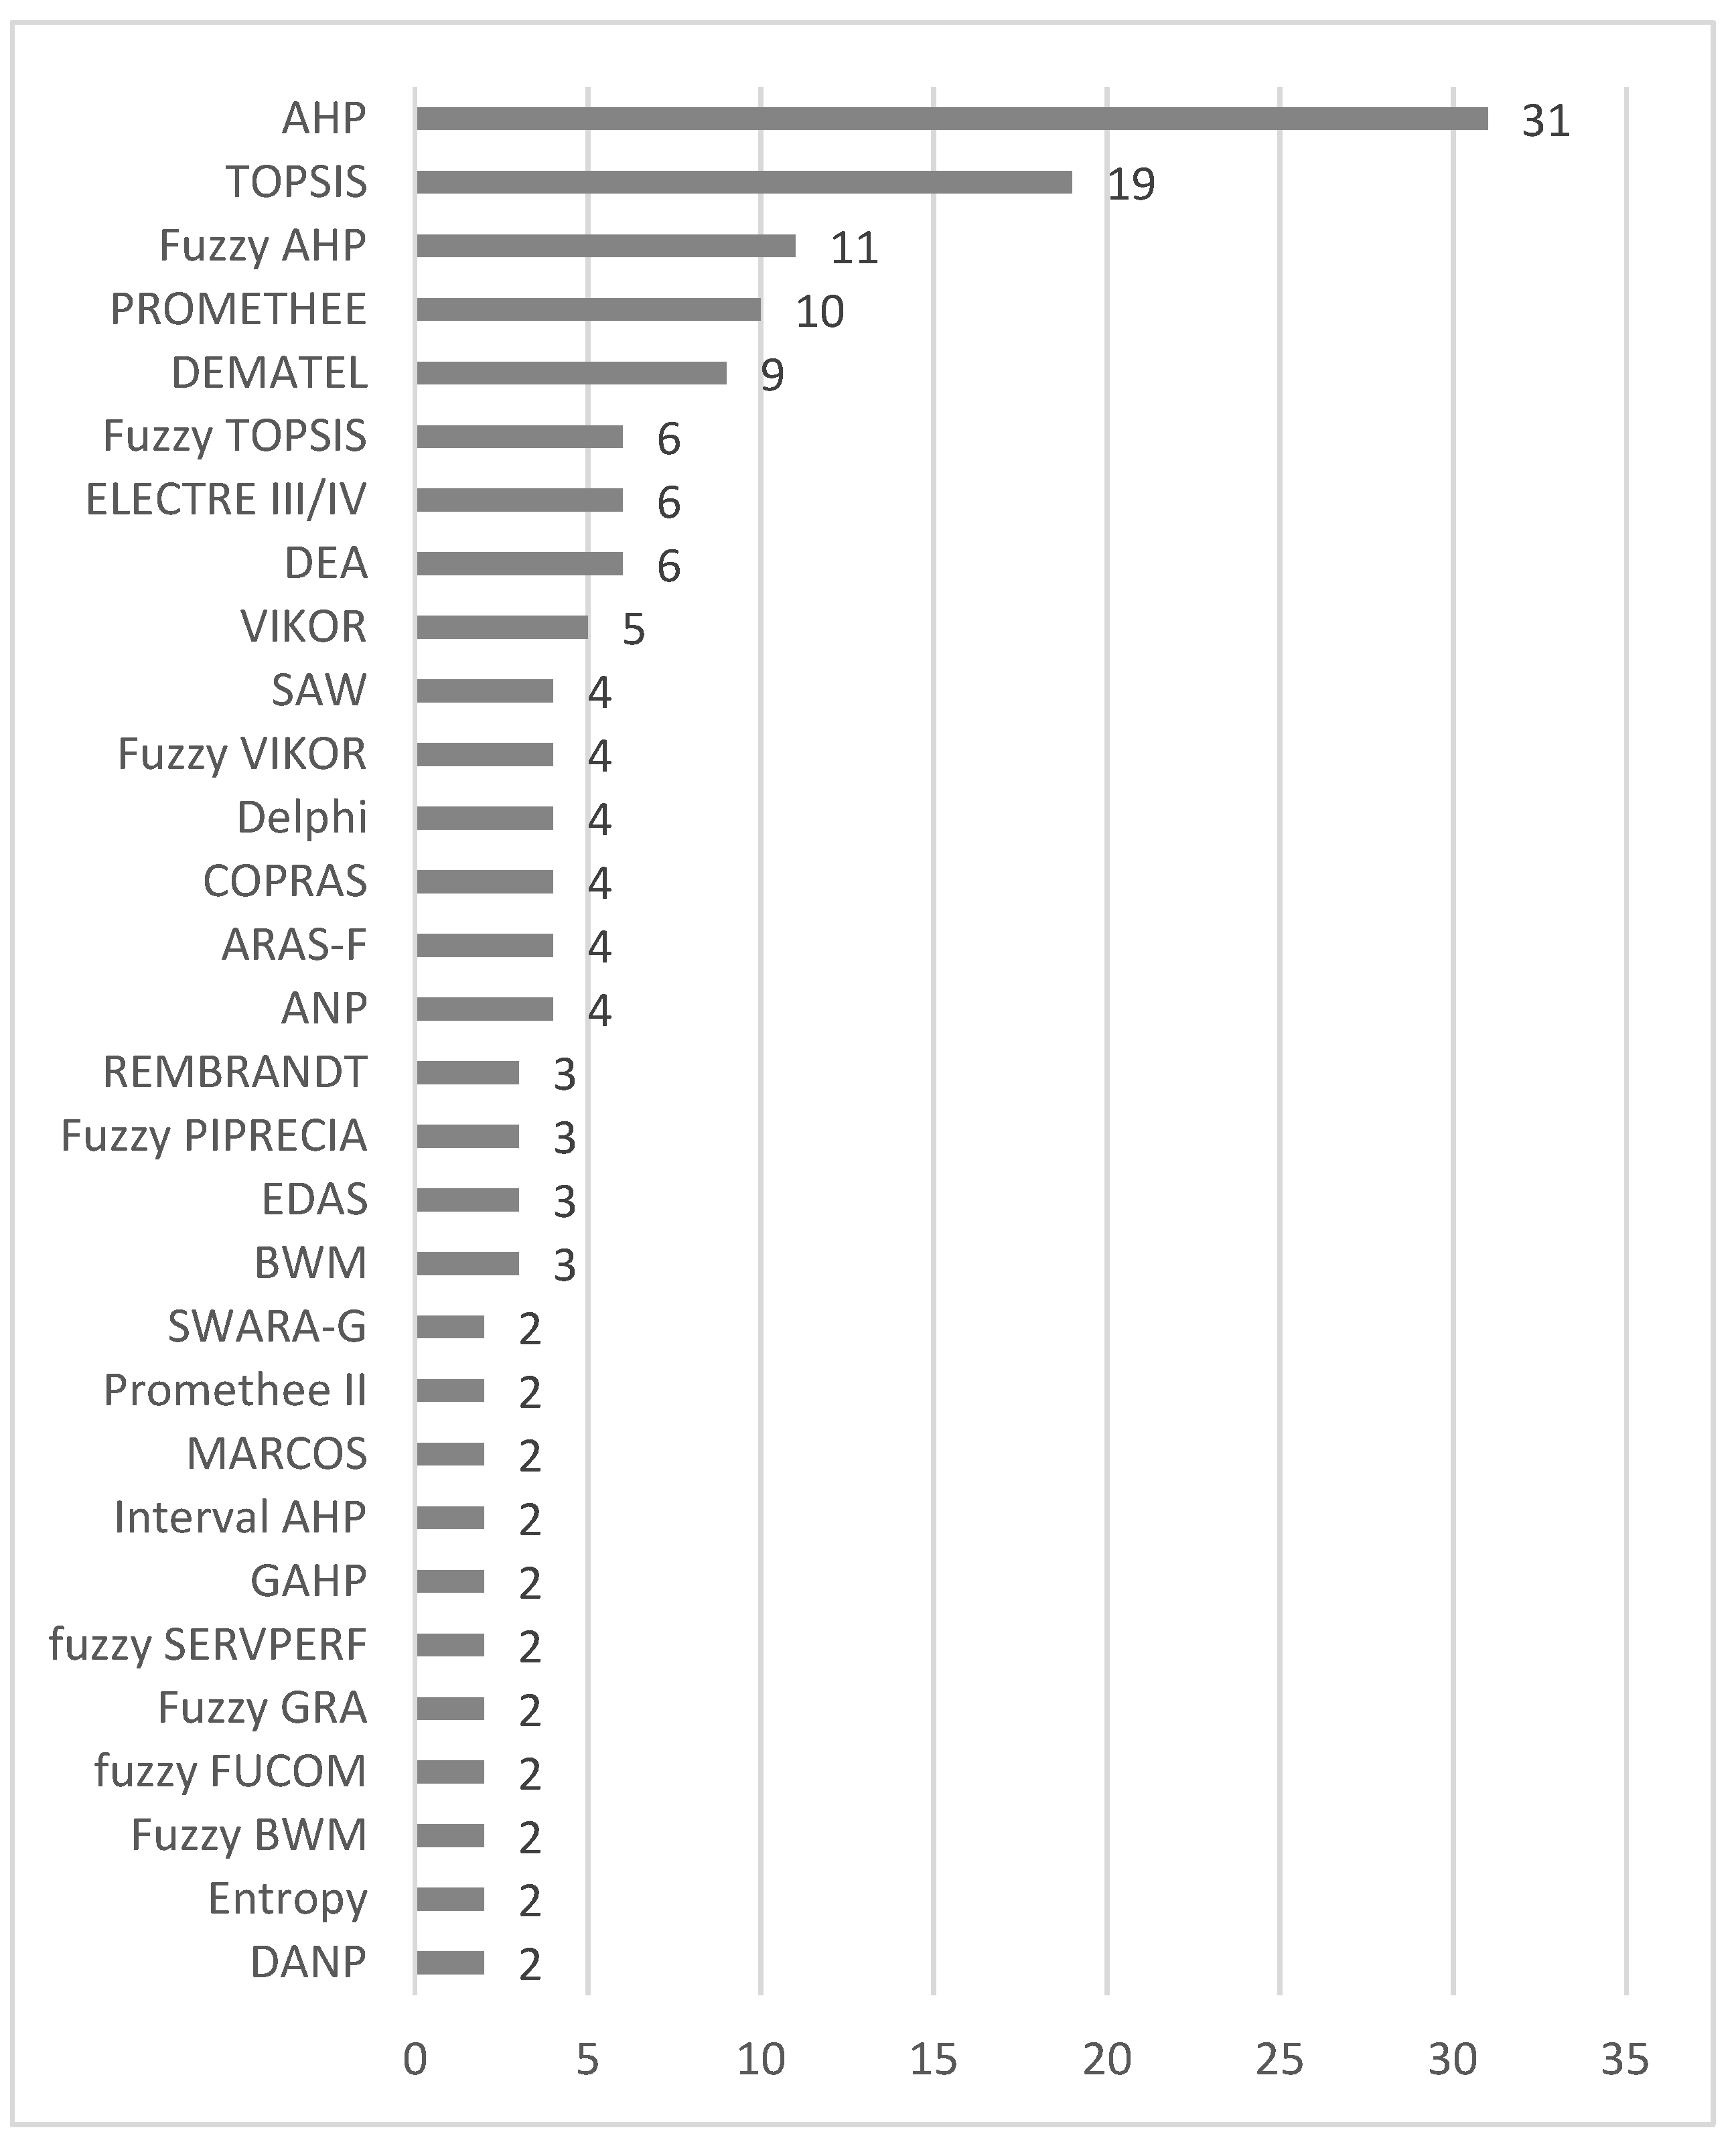
- DEMATEL; the method placed fifth in the ranking. This method makes it possible to perform dependency analyses at the level of decision factors, making it possible to conduct a multi-criteria analysis in a new dimension.
- VIKOR; the method was placed, along with other methods, in the seventh position, selected as an alternative to the TOPSIS method from the first research part.
- REMBRANDT; although this method was placed in a distant nineth place, it is one of the few methods enabling the weighting of decision factors. It was selected as an alternative to the AHP and Fuzzy AHP methods from the first part of the study.
3. Research Methods
3.1. DEMATEL Method (Decision-Making Trial and Evaluation Laboratory)
3.2. REMBRANDT Method
- in the REMBRANDT method, a logarithmic scale is used instead of a Saaty scale;
- a logarithmic method of least squares is used to derive scale vectors; and
- the geometric mean aggregation is used for the generalized evaluation of variants.
3.3. VIKOR Method
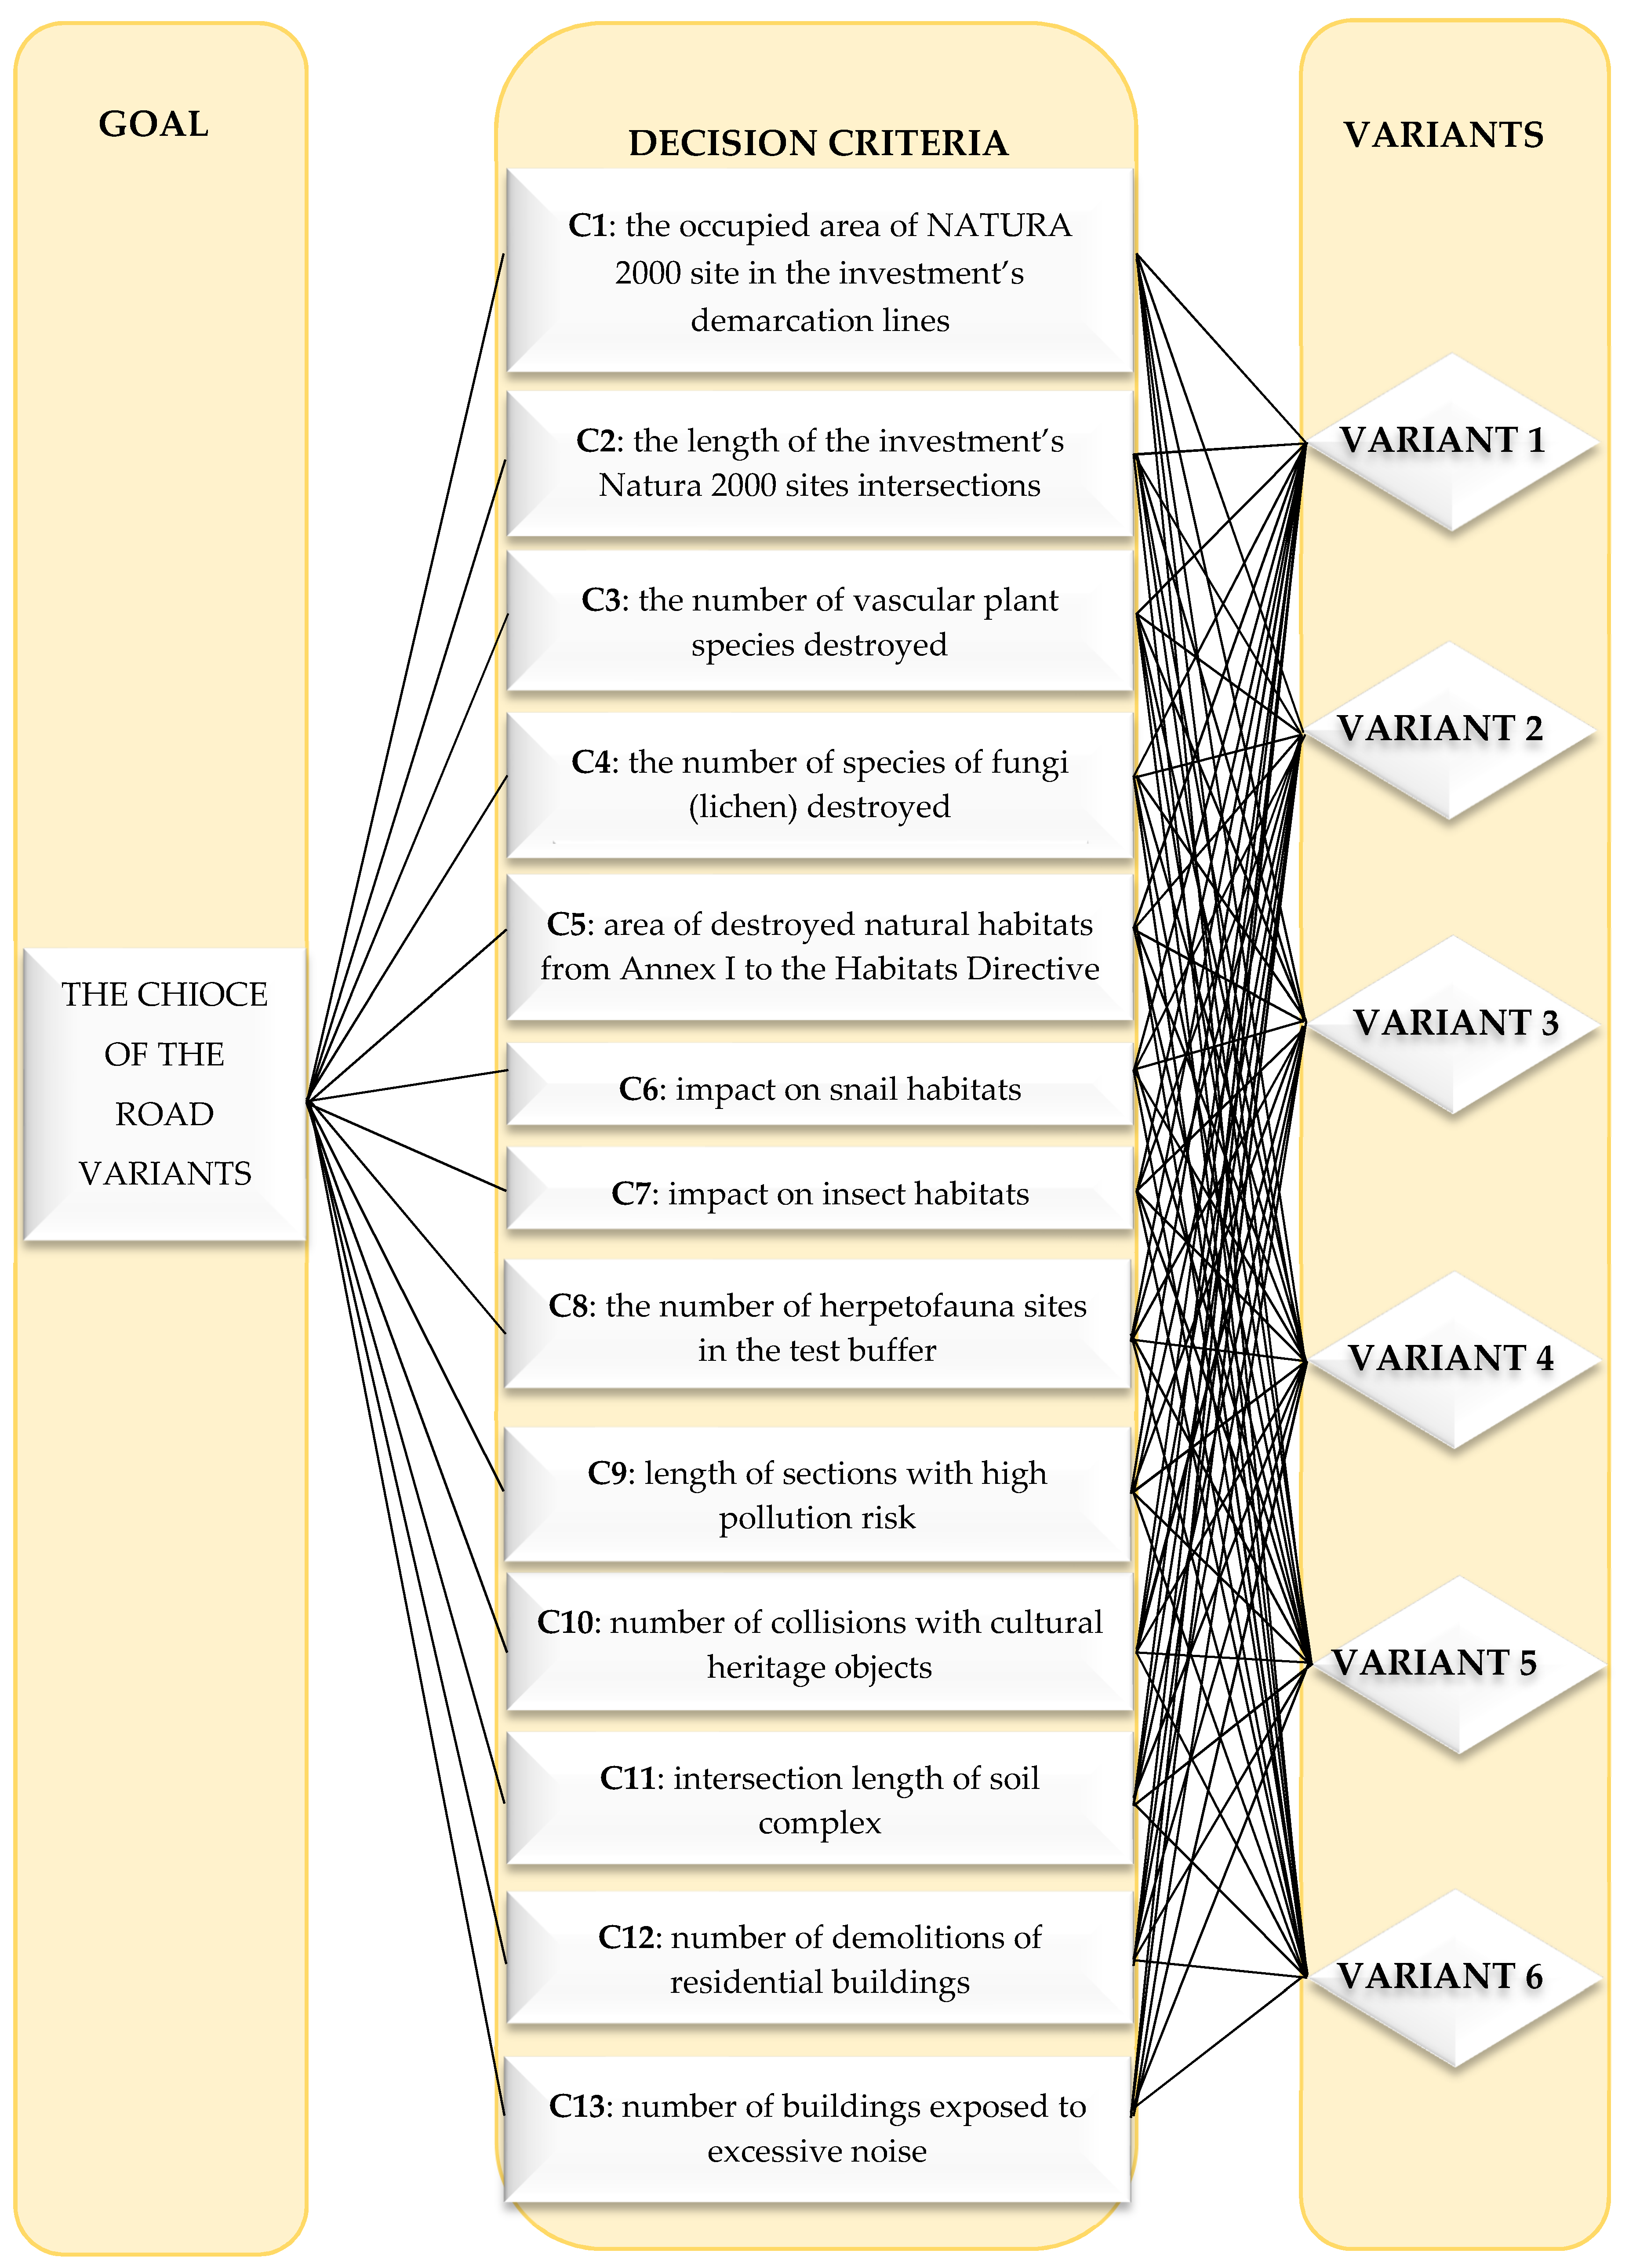
4. Case Study
4.1. Decomposing a Decision-Making Problem
4.2. Numerical Example
4.3. Comparative Analysis
5. Discussion and Conclusions
- Multi-criteria decision support in the field of transport is invariably based mainly on the methods from the AHP, PROMETHEE, and TOPSIS family. This is primarily due to their universal nature, transparent and proven algorithms, and the available software to facilitate the performance of multi-dimensional analyses. However, each year, new methods not yet observed in the field of transport emerge, such as CODAS, COMET, CRITIC, EDAS, MARCOS, PIPRECIA, or MEW.
- In any multi-criteria analysis, the weighting of decision-making factors serves as a crucial stage, especially in investments in the field of transport, which are usually characterized by large dimensions and thus a large scale of potential impacts. Therefore, it seems appropriate to use methods that enable pairwise comparisons of factors as part of the expert research stage (AHP, Fuzzy AHP, or REMBRANDT).
- The DEMATEL method can serve as a support tool at the stage of selecting and analyzing decision factors. To increase objectivity, the analysis of dependencies can be successfully performed as part of expert interviews.
- When ranking decision alternatives, the number of multi-criteria methods available is significant. Concerning decision-making problems in the field of transport, especially in a situation where the considered alternatives are similar, it is recommended to use at least two methods.
Author Contributions
Funding
Data Availability Statement
Conflicts of Interest
Appendix A

| Author (Year of Publication) | Location | MCDM/MCDA Methods Used | The Main Subject of the Research |
|---|---|---|---|
| Safety and Quality of Public Transport | |||
| Vavrek and Bečica (2020) [6] | Czech Republic | CV-TOPISIS | Evaluation of transport companies |
| Blagojević et al. (2020) [7] | Bosnia and Herzegovina | Fuzzy PIPRECIA and Entropy method | Safety evaluation of railway traffic |
| Damidavičius et al. (2020) [8] | Lithuania | COPRAS, TOPSIS, ARAS, and EDAS | Assessment of urban transport systems and their potential in terms of sustainable mobility |
| Zehmed and Jawab (2020) [9] | Fez, Morocco | Fuzzy SERVPERF and DEA | Quality of urban bus transport service |
| Kumar and Anbanandam (2020) [10] | India | Fuzzy Best–Worst method (FBWM) | Assessment of social sustainability indicators in the freight transport industry |
| Kumar and Anbanandam (2020A) [11] | India | Intuitionistic fuzzy AHP (IF-AHP) and IF-VICOR | Assessment of environmental sustainability indicators in the freight transport industry |
| Pamucar et al. (2020) [12] | Istanbul (Turkey) | Fuzzy Full Consistency Method-Dombi–Bonferroni (fuzzy FUCOM-D’Bonferroni) | Assessment of transport demand management measures |
| Kumar et al. (2020B) [13] | India | AHP, DEA, VICOR, and MPI | Assessment of the performance of public road transportation systems |
| Blagojević et al. (2021) [14] | Bosnia and Herzegovina | Fuzzy FUCOM, fuzzy PIPRECIA, and fuzzy MARCOS | Evaluation of safety degree at railway crossings |
| Karim and Jawab (2020) [15] | Morocco | DEA and fuzzy SERVPERF | Assessment of the quality of urban bus transport |
| Scenarios for the Development of Public Transport Systems | |||
| Kizielewicz and Dobryakova (2020) [16] | Poland | COMET (Characteristic Objects METhod) | The assessment of model electric scooters in cities |
| D’Orso et al. (2020) [17] | Spain | AHP | The optimal allocation of economic resources for identifying the actions in the transport sector |
| Ogrodnik (2020) [18] | Poland | PROMETHEE | Sustainable solutions for public transport and infrastructure |
| Hamurcu and Eren (2020) [19] | Kırıkkale, Turkey | TOPSIS | Prioritizing alternative public transportation projects |
| Kim et al. (2020) [20] | Korea | FAHP | Strategies for efficient use of Trans-Siberian Railway for multimodal transport |
| Görçün (2021) [21] | Istanbul, Turkey | CRITIC (CRiteria Importance Through Intercriteria Correlation) and EDAS (Evaluation based on Distance from Average Solution) | Evaluation of the selection of urban rail vehicles |
| Choice of Investment Location | |||
| Palczewski and Sałabun (2019) [22] | Poland | PROMETHEE II | Location of the airport |
| Akin and Kara (2020) [23] | Istanbul, Turkey | Additive value (AV) model | Location of intercity bus terminal |
| Ortega et al. (2020) [24] | Ecuador, Cuenca | Fuzzy AHP | Location of park-and-ride facility |
| Broniewicz and Ogrodnik (2020) [1] | Poland | AHP, Fuzzy AHP, TOPSIS, and PROMETHEE | Location of the expressway section |
| Tadic et al. (2020) [25] | Western Balkans region | AHP and CODAS | Dry port terminal location selection |
| Aljohani and Thompson (2020) [26] | Inner Melbourne, Australia | TOPSIS | Location of freight consolidation facility |
| Sukmanee et al. (2020) [27] | Thailand | Analytic Network Process (ANP) and Design Structure Matrix (DSM) | Location of dry port |
| Zagorskas and Turskis (2020) [28] | Kaunas, Lithuania | MEW, EDAS, ARAS, and SWARA | Location of new pedestrian bridges |
| Aksoy and Gursoy (2020) [29] | Turkey | AHP and ELECTRE | Locations of logistic villages |
| Muravev et al. (2020) [30] | China | DEMATEL–MAIRCA | Location optimization of international logistics centers |
| Ayub and Balogun (2021) [31] | Bandar Seri Iskandar Malaysia | AHP | Optimal bus-stop locations |
| Road, Air, Railway, and Sea Transport | |||
| Li et al. (2020) [32] | China | Best–Worst method (BWM) | Customers’ preferences for the main attributes that define the transport service |
| Shishegaran et al. (2020) [33] | Tehran, Iran | TOPSIS | Sustainability evaluation of scenarios transport network condition |
| Stokic et al. (2020) [34] | Belgrade, Serbia | Hybrid DANP–TOPSIS | Selection of the most suitable vehicle |
| Stoilova et al. (2020) [35] | Trans-European Transport Network (TEN-T) | SIMUS | Evaluation of railway network performance |
| Tolga and Durak (2020) [36] | Istanbul, Turkey | Fuzzy COPRAS | Evaluation of innovation projects in the air cargo sector |
| Lameira et al. (2020) [37] | the Amazon | AHP, DEMATEL, and ELECTRE | Evaluation and selection of the best river train in the Amazon region |
| Electric Vehicles | |||
| Shekhovtsov et al. (2020) [38] | Poland | VICOR and TOPSIS | Evaluation of electric bicycles |
| Kaya et al. (2020) [39] | Istanbul | VIKOR and PROMETHEE | Location of electric vehicle charging stations |
| Wilken et al. (2020) [40] | Germany | PROMETHEE | Comparison of electric vehicles with internal combustion engine vehicles |
| Cheng and Wei (2020) [41] | Beijing, China | AHP and DEA | Location selection of bike-sharing parking points |
| Other | |||
| Solecka et al. (2020) [42] | Krakow, Poland | Compensation-Conjunctive method (CC) | Adaptation of interchanges to the needs of people with reduced mobility |
| Dang and Yeo (2020) [43] | Vietnam | Fuzzy TOPSIS | Synchronization in developing transport infrastructures, such as between transport systems and dry port networks |
| Zapolskytė et al. (2020) [44] | Vilnius, Lithuania | AHP, COPRAS, TOPSIS, and SAW | Assessment of the level of development of infrastructure and transport services |
| Zagorskas and Turskis (2020) [45] | Vilnius, Lithuania | Additive Ratio ASsessment with Fuzzy (ARAS-F) | Ranking the priorities for development and the renewal of bicycle pathway segments |
| Galinska (2019) [46] | Poland | Promethee II | Selection of logistics operator |
| Pamucar et al. (2020) [47] | Romania | BWM and MARCOS | Prioritizing the alternatives of the hydrogen bus development |
| Liachovičius et al. (2020) [48] | Lithuania | SAW, COPRAS, TOPSIS, EDAS, and PROMETHEE | Business valuation of road freight transport companies |
| Ur Rehman and Ali (2021) [49] | China Pakistan Economic Corridor (CPEC) | Fuzzy-TOPSIS | Identification of China’s most optimal route for crude oil import |
| Kaska and Tolga (2021) [50] | Turkey | TOPSIS | Selection of software for a maritime organization |
| Koohathongsumrit and Meethom (2021) [51] | Thailand | AHP, DEA, and TOPSIS | Route selection in multimodal supply chains |
| Aghamohagheghi et al. (2001) [52] | Iran | Interval-valued pythagorean fuzzy set (IVPFS) | Assessment of sustainable transport projects |
| Ðalić et al. (2021) [53] | Bosnia and Herzegovina | Model based on the integration of fuzzy PIPRECIA, FUCOM, and MARCOS | Set of business strategies of the transport company |
| Risk Analysis | |||
| Cunha et al. (2021) [54] | Brazilian airports | MCDA-C | Analysis of risks related to airport runway maintenance |
| Erdoğan and Kaya (2020) [55] | Istanbul, Turkey | Fuzzy rule-based system FRBS and particle swarm optimization PSO | Evaluation of risks and failures of public transport systems |
| Bakioglu and Atahan (2021) [56] | Turkey | AHP, PF-TOPSIS, and PF-VIKOR | Risk prioritization in self-driving vehicles |
Appendix B
| Method | Safety snd Quality of Public Transport | Scenarios for the Development of the Public Transport System | Choice of Investment Location | Road, Air, Rail, and Sea Transport | Electric Vehicles | Other | Total |
|---|---|---|---|---|---|---|---|
| AHP | 7 | 6 | 5 | 6 | 1 | 6 | 31 |
| ANOVA | 1 | 0 | 0 | 0 | 0 | 0 | 1 |
| ANP | 0 | 1 | 1 | 0 | 0 | 2 | 4 |
| ARAS-F | 1 | 0 | 2 | 0 | 0 | 1 | 4 |
| AV | 0 | 0 | 1 | 0 | 0 | 0 | 1 |
| BWM | 0 | 0 | 0 | 2 | 0 | 1 | 3 |
| CC | 0 | 0 | 0 | 0 | 0 | 1 | 1 |
| CFA | 0 | 0 | 1 | 0 | 0 | 0 | 1 |
| CODAS | 0 | 0 | 1 | 0 | 0 | 0 | 1 |
| COMET | 0 | 1 | 0 | 0 | 0 | 0 | 1 |
| COPRAS | 2 | 0 | 0 | 0 | 0 | 2 | 4 |
| COPRAS-G | 0 | 1 | 0 | 0 | 0 | 0 | 1 |
| COSIMA | 0 | 0 | 0 | 1 | 0 | 0 | 1 |
| CRITIC | 0 | 1 | 0 | 0 | 0 | 0 | 1 |
| CV-TOPSIS | 1 | 0 | 0 | 0 | 0 | 0 | 1 |
| DANP | 0 | 0 | 0 | 2 | 0 | 0 | 2 |
| De Borda | 0 | 0 | 0 | 1 | 0 | 0 | 1 |
| DEA | 3 | 0 | 0 | 0 | 1 | 2 | 6 |
| Delphi | 2 | 0 | 1 | 0 | 0 | 1 | 4 |
| DEMATEL | 1 | 2 | 1 | 2 | 1 | 2 | 9 |
| DSM | 0 | 0 | 1 | 0 | 0 | 0 | 1 |
| EDAS | 1 | 0 | 1 | 0 | 0 | 1 | 3 |
| ELECTRE III/IV | 0 | 3 | 1 | 2 | 0 | 0 | 6 |
| Entropy | 2 | 0 | 0 | 0 | 0 | 0 | 2 |
| FARE | 1 | 0 | 0 | 0 | 0 | 0 | 1 |
| FSWARA | 0 | 0 | 0 | 1 | 0 | 0 | 1 |
| Fuzzy AHP | 3 | 2 | 2 | 2 | 0 | 2 | 11 |
| Fuzzy ANP | 0 | 0 | 1 | 0 | 0 | 0 | 1 |
| Fuzzy BWM | 1 | 0 | 0 | 1 | 0 | 0 | 2 |
| Fuzzy COPRAS | 0 | 0 | 0 | 1 | 0 | 0 | 1 |
| Fuzzy Delphi | 0 | 0 | 1 | 0 | 0 | 0 | 1 |
| Fuzzy DEMATEL | 0 | 0 | 0 | 0 | 0 | 1 | 1 |
| fuzzy FUCOM-D’Bonferroni | 1 | 0 | 0 | 0 | 0 | 1 | 2 |
| Fuzzy GRA | 1 | 1 | 0 | 0 | 0 | 0 | 2 |
| Fuzzy MARCOS | 1 | 0 | 0 | 0 | 0 | 0 | 1 |
| Fuzzy MULTIMOORA | 0 | 0 | 0 | 1 | 0 | 0 | 1 |
| Fuzzy particle swarm Optimisation PSO | 0 | 0 | 0 | 0 | 0 | 1 | 1 |
| Fuzzy PIPRECIA | 2 | 0 | 0 | 0 | 0 | 1 | 3 |
| Fuzzy SERVPERF | 2 | 0 | 0 | 0 | 0 | 0 | 2 |
| Fuzzy TOPSIS | 1 | 1 | 0 | 0 | 1 | 3 | 6 |
| Fuzzy VIKOR | 1 | 1 | 1 | 0 | 0 | 1 | 4 |
| GAHP | 1 | 0 | 0 | 1 | 0 | 0 | 2 |
| GRA | 1 | 0 | 0 | 0 | 0 | 0 | 1 |
| Hybrid DANP-TOPSIS | 0 | 0 | 0 | 1 | 0 | 0 | 1 |
| Interval AHP | 1 | 1 | 0 | 0 | 0 | 0 | 2 |
| IVPFS | 0 | 0 | 0 | 0 | 0 | 1 | 1 |
| MABAC | 0 | 0 | 0 | 1 | 0 | 0 | 1 |
| MACBETH | 0 | 0 | 1 | 0 | 0 | 0 | 1 |
| MARCOS | 0 | 0 | 0 | 0 | 0 | 2 | 2 |
| MAUT | 0 | 1 | 0 | 0 | 0 | 0 | 1 |
| MCDA-C | 0 | 0 | 0 | 0 | 0 | 1 | 1 |
| MEW | 0 | 0 | 1 | 0 | 0 | 0 | 1 |
| Modified rough AHP | 0 | 0 | 0 | 1 | 0 | 0 | 1 |
| Modified VIKOR | 0 | 0 | 0 | 1 | 0 | 0 | 1 |
| MPI | 1 | 0 | 0 | 0 | 0 | 0 | 1 |
| MULTIMOORA | 0 | 0 | 0 | 0 | 0 | 1 | 1 |
| PROMETHEE | 1 | 1 | 2 | 1 | 3 | 2 | 10 |
| Promethee II | 0 | 0 | 1 | 0 | 0 | 1 | 2 |
| REMBRANDT | 0 | 0 | 0 | 1 | 0 | 2 | 3 |
| ROC | 0 | 1 | 0 | 0 | 0 | 0 | 1 |
| SAW | 0 | 0 | 0 | 1 | 0 | 3 | 4 |
| SMARTER | 0 | 0 | 0 | 0 | 0 | 1 | 1 |
| Stochastic TOPSIS | 1 | 0 | 0 | 0 | 0 | 0 | 1 |
| SWARA-G | 0 | 1 | 1 | 0 | 0 | 0 | 2 |
| TOPSIS | 2 | 3 | 3 | 4 | 1 | 6 | 19 |
| VIKOR | 2 | 0 | 0 | 1 | 2 | 0 | 5 |
| WASPAS | 0 | 0 | 1 | 0 | 0 | 0 | 1 |
References
- Broniewicz, E.; Ogrodnik, K. Multi-criteria analysis of transport infrastructure projects. Transp. Res. Part D Transp. Environ. 2020, 83, 102351. [Google Scholar] [CrossRef]
- Brundtland Commission. Our Common Future, Report of the World Commission on Environment and Development; Brundtland Commission: Rio de Janeiro, Brazil, 1987. [Google Scholar]
- Daly, H.E. Allocation, Distribution, and Scale: Towards an Economics that is Efficient, Just, and Sustainable. Ecol. Econ. 1992, 6, 185–193. [Google Scholar] [CrossRef]
- Pearce, D.W.; Atkinson, G.D. Capital theory and the measurement of sustainable development: An indicator of “weak” sustainability. Ecol. Econ. 1993, 8, 103–108. [Google Scholar] [CrossRef]
- Urbanyi-Popiołek, I. Podstawy Organizacji i ekonomiki transportu–wybrane zagadnienia. In Ekonomiczne I Organizacyjne Aspekty Transportu, Urbanyi-Popiołek, I., Ed.; Wydawnictwo Uczelniane Wyższej Szkoły Gospodarki w Bydgoszczy: Bydgoszcz, Poland, 2013; pp. 9–27. (In Polish) [Google Scholar]
- Zavadskas, E.K.; Turskis, Z.; Kildienė, S. State of art surveys of overviews on MCDM/MADM methods. Technol. Econ. Dev. Econ. 2014, 20, 165–179. [Google Scholar] [CrossRef] [Green Version]
- Ogrodnik, K. The use of the DEMATEL method to analyze cause and effect relationships between sustainable development indicators. Ekonomia i Środowisko 2018, 4, 60–72. [Google Scholar]
- Kumar, A.; Sah, B.; Singh, A.R.; Deng, Y.; He, X.; Kumar, P.; Bansal, R. A review of multi criteria decision making (MCDM) towards sustainable renewable energy development. Renew. Sustain. Energy Rev. 2017, 69, 596–609. [Google Scholar] [CrossRef]
- Stojčić, M.; Zavadskas, E.K.; Pamučar, D.; Stević, Ž.; Mardani, A. Application of MCDM Methods in Sustainability Engineering: A Literature Review 2008–2018. Symmetry 2019, 11, 350. [Google Scholar] [CrossRef] [Green Version]
- Vavrek, R.; Bečica, J. Capital City as a Factor of Multi-Criteria Decision Analysis—Application on Transport Companies in the Czech Republic. Mathematics 2020, 8, 1765. [Google Scholar] [CrossRef]
- Blagojević, A.; Stević, Ž.; Marinković, D.; Kasalica, S.; Rajilić, S. A Novel Entropy-Fuzzy PIPRECIA-DEA Model for Safety Evaluation of Railway Traffic. Symmetry 2020, 12, 1479. [Google Scholar] [CrossRef]
- Damidavičius, J.; Burinskienė, M.; Antuchevičienė, J. Assessing Sustainable Mobility Measures Applying Multicriteria Decision Making Methods. Sustainability 2020, 12, 6067. [Google Scholar] [CrossRef]
- Zehmed, K.; Jawab, F. A Combined Approach Based on Fuzzy SERVPERF and DEA for Measuring and Benchmarking the Quality of Urban Bus Transport Service at the Route Level. Ind. Eng. Manag. Syst. 2020, 19, 442–459. [Google Scholar] [CrossRef]
- Kumar, A.; Anbanandam, R. An MCDM framework for assessment of social sustainability indicators of the freight transport industry under uncertainty. A multi-company perspective. J. Enterp. Inf. Manag. 2020, 33, 1023–1058. [Google Scholar] [CrossRef]
- Kumar, A.; Anbanandam, R. Environmentally responsible freight transport service providers’ assessment under data-driven information uncertainty. J. Enterp. Inf. Manag. 2020, 34, 506–542. [Google Scholar] [CrossRef]
- Pamucar, D.; Deveci, M.; Canıtez, F.; Bozanic, D. A fuzzy Full Consistency Method-Dombi-Bonferroni model for prioritizing transportation demand management measures. Appl. Soft Comput. 2020, 87, 105952. [Google Scholar] [CrossRef]
- Kumar, A.; Singh, G.; Vaidya, O.S. A Comparative Evaluation of Public Road Transportation Systems in India Using Multicriteria Decision-Making Techniques. J. Adv. Transp. 2020, 2020, 1–16. [Google Scholar] [CrossRef]
- Blagojević, A.; Kasalica, S.; Stević, Ž.; Tričković, G.; Pavelkić, V. Evaluation of Safety Degree at Railway Crossings in Order to Achieve Sustainable Traffic Management: A Novel Integrated Fuzzy MCDM Model. Sustainability 2021, 13, 832. [Google Scholar] [CrossRef]
- Kizielewicz, B.; Dobryakova, L. How to choose the optimal single-track vehicle to move in the city? Electric scooters study case. Procedia Comput. Sci. 2020, 176, 2243–2253. [Google Scholar] [CrossRef]
- D’Orso, G.; Migliore, M.; Peri, G.; Rizzo, G. Using AHP methodology for prioritizing the actions in the transport sector in the frame of SECAPs. In Proceedings of the 2020 IEEE International Conference on Environment and Electrical Engineering and 2020 IEEE Industrial and Commercial Power Systems Europe 2020, Madrid, Spain, 9–12 June 2020. [Google Scholar]
- Ogrodnik, K. Multi-criteria analysis of smart cities in Poland. Geogr. Pol. 2020, 93, 163–181. [Google Scholar] [CrossRef]
- Hamurcu, M.; Eren, T. Strategic Planning Based on Sustainability for Urban Transportation: An Application to Decision-Making. Sustainability 2020, 12, 3589. [Google Scholar] [CrossRef]
- Kim, G.-S.; Lee, S.-W.; Seo, Y.-J.; Kim, A.-R. Multimodal transportation via TSR for effective Northern logistics: Perspectives of Korean logistics companies. Marit. Bus. Rev. 2020, 5, 295–312. [Google Scholar] [CrossRef]
- Görçün, Ö.F. Evaluation of the selection of proper metro and tram vehicle for urban transportation by using a novel integrated MCDM approach. Sci. Prog. 2021, 104. [Google Scholar] [CrossRef] [PubMed]
- Palczewski, K.; Sałabun, W. Influence of various normalization methods in PROMETHEE II: An empirical study on the selection of the airport location. Procedia Comput. Sci. 2019, 159, 2051–2060. [Google Scholar] [CrossRef]
- Akin, D.; Kara, D. Multicriteria analysis of planned intercity bus terminals in the metropolitan city of Istanbul, Turkey. Transp. Res. Part A Policy Pr. 2020, 132, 465–489. [Google Scholar] [CrossRef]
- Ortega, J.; Tóth, J.; Moslem, S.; Péter, T.; Duleba, S. An Integrated Approach of Analytic Hierarchy Process and Triangular Fuzzy Sets for Analyzing the Park-and-Ride Facility Location Problem. Symmetry 2020, 12, 1225. [Google Scholar] [CrossRef]
- Tadić, S.; Krstić, M.; Roso, V.; Brnjac, N. Dry Port Terminal Location Selection by Applying the Hybrid Grey MCDM Model. Sustainability 2020, 12, 6983. [Google Scholar] [CrossRef]
- Aljohani, K.; Thompson, R.G. A multi-criteria spatial evaluation framework to optimise the siting of freight consolidation facilities in inner-city areas. Transp. Res. Part A Policy Pr. 2020, 138, 51–69. [Google Scholar] [CrossRef]
- Sukmanee, J.; Kesvarakul, R.; Janthong, N. Network Modeling with ANP to Determine the Appropriate Area for the Development of Dry Port in Thailand. Adv. Sci. Technol. Eng. Syst. J. 2020, 5, 676–683. [Google Scholar] [CrossRef]
- Zagorskas, J.; Turskis, Z. Setting priority list for construction works of bicycle path segments based on eckenrode rating and aras-f decision support method integrated in gis. Transport 2020, 35, 179–192. [Google Scholar] [CrossRef]
- Aksoy, B.; Gursoy, M. Evaluation of location selection process of logistics villages using Analytic Hierarchy Process and ELECTRE methods: A case study for Turkey. Sigma J. Eng. Nat. Sci.Sigma Muhendis. Bil. Derg. 2020, 38, 1897–1910. [Google Scholar]
- Muravev, D.; Hu, H.; Zhou, H.; Pamucar, D. Location Optimization of CR Express International Logistics Centers. Symmetry 2020, 12, 143. [Google Scholar] [CrossRef] [Green Version]
- Ayub, U.B.; Balogun, A.-L.B. Spatial Analysis for Sustainable Campus Transportation: A Case Study of UTP. Lect. Notes Civil Eng. 2021, 132, 870–882. [Google Scholar]
- Li, Q.; Rezaei, J.; Tavasszy, L.; Wiegmans, B.; Guo, J.; Tang, Y.; Peng, Q. Customers’ preferences for freight service attributes of China Railway Express. Transp. Res. Part A Policy Pract. 2020, 142, 225–236. [Google Scholar] [CrossRef]
- Shishegaran, A.; Shishegaran, A.; Mazzulla, G.; Forciniti, C. A Novel Approach for a Sustainability Evaluation of Developing System Interchange: The Case Study of the Sheikhfazolah-Yadegar Interchange, Tehran, Iran. Int. J. Environ. Res. Public Health 2020, 17, 435. [Google Scholar] [CrossRef] [PubMed] [Green Version]
- Stokic, M.; Vujanovic, D.; Sekulic, D. A New Comprehensive Approach for Efficient Road Vehicle Procurement Using Hybrid DANP-TOPSIS Method. Sustainability 2020, 12, 4044. [Google Scholar] [CrossRef]
- Stoilova, S.; Munier, N.; Kendra, M.; Skrúcaný, T. Multi-Criteria Evaluation of Railway Network Performance in Countries of the TEN-T Orient–East Med Corridor. Sustainability 2020, 12, 1482. [Google Scholar] [CrossRef] [Green Version]
- Tolga, A.C.; Durak, G. Valuating innovation projects in air cargo sector with fuzzy COPRAS, In Intelligent and Fuzzy Techniques in Big Data Analytics and Decision Making. INFUS 2019. Advances in Intelligent Systems and Computing 1029; Kahraman, C., Cebi, S., Cevik Onar, S., Oztaysi, B., Tolga, A., Sari, I., Eds.; Springer: Berlin/Heidelberg, Germany, 2020; pp. 702–710. [Google Scholar]
- Lameira, P.I.D.; Filgueiras, T.C.G.M.; Botter, R.C.; Saavedra, R.D.S. An Approach using Multicriteria Decision Methods to Barges Configuration for Pushed Convoys in the Amazon. Int. J. Inf. Technol. Decis. Mak. 2020, 19, 317–341. [Google Scholar] [CrossRef]
- Shekhovtsov, A.; Kozlov, V.; Nosov, V.; Sałabun, W. Efficiency of Methods for Determining the Relevance of Criteria in Sustainable Transport Problems: A Comparative Case Study. Sustainability 2020, 12, 7915. [Google Scholar] [CrossRef]
- Kaya, Ö.; Tortum, A.; Alemdar, K.D.; Çodur, M.Y. Site selection for EVCS in Istanbul by GIS and multi-criteria decision-making. Transp. Res. Part D Transp. Environ. 2020, 80, 102271. [Google Scholar] [CrossRef]
- Wilken, D.; Oswald, M.; Draheim, P.; Pade, C.; Brand, U.; Vogt, T. Multi-dimensional assessment of passenger cars: Comparison of electric vehicles with internal combustion engine vehicles. Procedia CIRP 2020, 90, 291–296. [Google Scholar] [CrossRef]
- Cheng, M.; Wei, W. An AHP-DEA Approach of the Bike-Sharing Spots Selection Problem in the Free-Floating Bike-Sharing System. Discret. Dyn. Nat. Soc. 2020, 2020, 1–15. [Google Scholar] [CrossRef]
- Solecka, K.; Hoy, K.N.; Deryło, A. Assessment of transport interchanges for the needs of people with reduced mobility. Travel Behav. Soc. 2020, 21, 48–56. [Google Scholar] [CrossRef]
- Dang, V.L.; Yeo, G.T. Finding the optimal order of priority for dry port construction: Case study in the North of Vietnam. Int. J. Shipp. Transp. Logist. 2020, 12, 597. [Google Scholar] [CrossRef]
- Zapolskytė, S.; Vabuolytė, V.; Burinskienė, M.; Antuchevičienė, J. Assessment of Sustainable Mobility by MCDM Methods in the Science and Technology Parks of Vilnius, Lithuania. Sustainability 2020, 12, 9947. [Google Scholar] [CrossRef]
- Zagorskas, J.; Turskis, Z. Location Preferences of New Pedestrian Bridges Based on Multi-Criteria Decision-Making and GIS-Based Estimation. Balt. J. Road Bridg. Eng. 2020, 15, 158–181. [Google Scholar] [CrossRef]
- Galińska, B. MCDM as the Tool of Intelligent Decision Making in Transport. Case Study Analysis. In Smart and Green Solutions for Transport Systems. TSTP 2019. Advances in Intelligent Systems and Computing 1091 AISC 2020; Sierpiński, G., Ed.; Springer: Berlin/Heidelberg, Germany, 2020; pp. 67–79. [Google Scholar]
- Pamucar, D.; Iordache, M.; Deveci, M.; Schitea, D.; Iordache, I. A new hybrid fuzzy multi-criteria decision methodology model for prioritizing the alternatives of the hydrogen bus development: A case study from Romania. Int. J. Hydrog. Energy 2020, 46, 29616–29637. [Google Scholar] [CrossRef]
- Liachovičius, E.; Skrickij, V.; Podviezko, A. MCDM Evaluation of Asset-Based Road Freight Transport Companies Using Key Drivers That Influence the Enterprise Value. Sustainability 2020, 12, 7259. [Google Scholar] [CrossRef]
- Rehman, O.U.; Ali, Y. Optimality study of China’s crude oil imports through China Pakistan economic corridor using fuzzy TOPSIS and Cost-Benefit analysis. Transp. Res. Part E Logist. Transp. Rev. 2021, 148, 102246. [Google Scholar] [CrossRef]
- Kaska, M.; Tolga, A.C. Blockchain Software Selection for a Maritime Organization with MCDM Method. In Intelligent and Fuzzy Techniques: Smart and Innovative Solutions. INFUS 2020. Advances in Intelligent Systems and Computing; Kahraman, C., Cevik Onar, S., Oztaysi, B., Sari, I., Cebi, S., Tolga, A., Eds.; Springer: Berlin/Heidelberg, Germany, 2021; Volume 1197. [Google Scholar]
- Koohathongsumrit, N.; Meethom, W. Route selection in multimodal transportation networks: A hybrid multiple criteria decision-making approach. J. Ind. Prod. Eng. 2021, 38, 171–185. [Google Scholar] [CrossRef]
- Aghamohagheghi, M.; Hashemi, S.M.; Tavakkoli-Moghaddam, R. An advanced decision support framework to assess sustainable transport projects using a new uncertainty modelling tool: Interval-valued Pythagorean trapezoidal fuzzy numbers. Iran. J. Fuzzy Syst. 2021, 18, 53–73. [Google Scholar]
- Ðalić, I.; . Stević, Z.; Ateljević, J.; Turskis, Z.; Zavadskas, E.K.; Mardani, A. A novel integrated MCDM-SWOT-TOWS model for the strategic decision analysis in transportation company. Mech. Eng. 2021, 32, 1–22. [Google Scholar]
- Cunha, D.A.; Andrade, M.; Prado, L.A.; Santana, L.O.; da Silv, M.P.G. RISK assessment in airport maintenance runway condition using MCDA-C. J. Air Transp. Manag. 2021, 90, 101948. [Google Scholar] [CrossRef]
- Erdoğan, M.; Kaya, I. A systematic approach to evaluate risks and failures of public transport systems with a real case study for bus rapid system in Istanbul. Sustain. Cities Soc. 2020, 53, 101951. [Google Scholar] [CrossRef]
- Bakioglu, G.; Atahan, A.O. AHP integrated TOPSIS and VIKOR methods with Pythagorean fuzzy sets to prioritize risks in self-driving vehicles. Appl. Soft Comput. 2021, 99, 106948. [Google Scholar] [CrossRef]
- Tamura, H.; Akazawa, K. Structural modeling and systems analysis of uneasy factors for realizing safe, secure and reliable society. J. Telecommun. Inf. Technol. 2005, 3, 64–72. [Google Scholar]
- Dytczak, M. Selected Methods for Multi-Criteria Decision Analysis in Civil Engineering; Oficyna Wydawnicza Politechniki Opolskiej: Opole, Poland, 2010. (In Polish) [Google Scholar]
- Michnik, J. Wielokryterialne Metody Wspomagania Decyzji W Procesie Innowacji; Wydawnictwo Uniwersytetu Ekonomicznego w Katowicach: Katowice, Poland, 2013. (In Polish) [Google Scholar]
- Si, S.-L.; You, X.-Y.; Liu, H.-C.; Zhang, P. DEMATEL Technique: A Systematic Review of the State-of-the-Art Literature on Methodologies and Applications. Math. Probl. Eng. 2018, 2018, 1–33. [Google Scholar] [CrossRef] [Green Version]
- Saaty, T.L. Decision making with the analytic hierarchy process. Int. J. Serv. Sci. 2008, 1, 83. [Google Scholar] [CrossRef] [Green Version]
- Ayhan, M.B. A Fuzzy Ahp Approach For Supplier Selection Problem: A Case Study In A Gearmotor Company. Int. J. Manag. Value Supply Chains 2013, 4, 11–23. [Google Scholar] [CrossRef]
- Forman, E.H. Facts and fictions about the analytic hierarchy process. Math. Comput. Model. 1993, 17, 19–26. [Google Scholar] [CrossRef]
- Moghtadernejad, S.; Chouinard, L.E.; Mirza, M.S. Multi-criteria decision-making methods for preliminary design of sustainable facades. J. Build. Eng. 2018, 19, 181–190. [Google Scholar] [CrossRef]
- Olson, D.L.; Fliedner, G.; Currie, K. Comparison of the REMBRANDT system with analytic hierarchy process. Eur. J. Oper. Res. 1995, 82, 522–539. [Google Scholar] [CrossRef]
- Górecka, D. Comparison of chosen methods for determining the weights of criteria for evaluating decision variants. In Zastosowania Badań Operacyjnych. Zarządzanie Projektami. Decyzje Finansowe, Logistyka; Konarzewska-Gubała, I., Ed.; Wydawnictwo Uniwersytetu Ekonomicznego we Wrocławiu: Wroclaw, Poland, 2011. (In Polish) [Google Scholar]
- Trzaskalik, T. Multicriteria decision support. Review of methods and applications. Sci. Pap. Silesian Univ. Technol Organ. Manag. Ser. 2014, 74, 239–263. [Google Scholar]
- Dachowski, R.; Gałek, K. Risk of Emergency Situations of Underground Objects in the Perspective of Multi-Criteria Decision Making. Arch. Civ. Eng. 2019, 65, 149–162. [Google Scholar] [CrossRef]
- Opricovic, S.; Tzeng, G.-H. Compromise solution by MCDM methods: A comparative analysis of VIKOR and TOPSIS. Eur. J. Oper. Res. 2004, 156, 445–455. [Google Scholar] [CrossRef]
- Kobryń, A. Wielokryterialne Wspomaganie Decyzji w Gospodarowaniu Przestrzenią; Difin: Warszawa, Poland, 2014. (In Polish) [Google Scholar]
- Pośpiech, E.; Mastalerz-Kodzis, A. Multi-criteria method choice to investment decision making. Zesz. Naukowe Politech. Śląskiej 2015, 86, 379–388. [Google Scholar]
- Environmental Impact Assessment Report: Construction of the S19 Road on the Section Choroszcz-Ploski along with the Construction of the Section of National Road No. 65 Kudrycze-Kuriany-Grabówka as well as the Construction, Extension and Reconstruction of Roads of Other Categories and the Necessary Technical Infrastructure; General Directorate for National Roads and Motorways, Department in Bialystok: Bialystok, Poland, 2018. (In Polish)
- Sałabun, W.; Urbaniak, K. A New Coefficient of Rankings Similarity in Decision-Making Problems. In Computational Science–ICCS 2020; Krzhizhanovskaya, V., Ed.; Springer: Berlin/Heidelberg, Germany, 2020; Volume 12138. [Google Scholar]
- Shekhovtsov, A.; Sałabun, W. A comparative case study of the VIKOR and TOPSIS rankings similarity. Procedia Comput. Sci. 2020, 176, 3730–3740. [Google Scholar] [CrossRef]
- Velasquez, M.; Hester, P.T. An Analysis of Multi-Criteria Decision Making Methods. Int. J. Op. Res. 2013, 10, 56–66. [Google Scholar]
- Mandic, K.; Bobar, V.; Delibašić, B. Modeling Interactions Among Criteria in MCDM Methods: A Review. In Proceedings of the International Conference on Decision Support System Technology, Belgrade, Serbia, 27–29 May 2015; pp. 98–109. [Google Scholar]
- Alsalem, M.; Zaidan, A.A.; Zaidan, B.B.; Hashim, M.; Albahri, O.S.; Hadi, A.; Mohammed, K.I. Systematic Review of an Automated Multiclass Detection and Classification System for Acute Leukaemia in Terms of Evaluation and Benchmarking, Open Challenges, Issues and Methodological Aspects. J. Med Syst. 2018, 42, 204. [Google Scholar] [CrossRef]
- Siksnelyte-Butkiene, I.; Zavadskas, E.K.; Streimikiene, D. Multi-Criteria Decision-Making (MCDM) for the Assessment of Renewable Energy Technologies in a Household: A Review. Energies 2020, 13, 1164. [Google Scholar] [CrossRef] [Green Version]
- Ghorbanzadeh, O.; Moslem, S.; Blaschke, T.; Duleba, S. Sustainable Urban Transport Planning Considering Different Stakeholder Groups by an Interval-AHP Decision Support Model. Sustainability 2018, 11, 9. [Google Scholar] [CrossRef] [Green Version]
- Nosal, K.; Solecka, K. Application of AHP Method for Multi-criteria Evaluation of Variants of the Integration of Urban Public Transport. Transp. Res. Procedia 2014, 3, 269–278. [Google Scholar] [CrossRef] [Green Version]
- Kiciński, M.; Solecka, K. Application of MCDA/MCDM methods for an integrated urban public transportation system–case study, city of Cracow. Arch. Transp. 2018, 46, 71–84. [Google Scholar] [CrossRef]
- Zavadskas, E.K.; Turskis, Z.; Bagočius, V. Multi-criteria selection of a deep-water port in the Eastern Baltic Sea. Appl. Soft Comput. 2015, 26, 180–192. [Google Scholar] [CrossRef]
- Nanda, S.; Singh, S. Evaluation of Factors Responsible for Road Accidents in India by Fuzzy AHP. In Networking Communication and Data Knowledge Engineering. Lecture Notes on Data Engineering and Communications Technologies 3; Perez, G., Mishra, K., Tiwari, S., Trivedi, M., Eds.; Springer: Singapore, 2018. [Google Scholar]
- Jimenez-Delgado, G.; Balmaceda-Castro, N.; Hernández-Palma, H.; de la Hoz-Franco, E.; García-Guiliany, J.; Martinez-Ventura, J. An Integrated Approach of Multiple Correspondences Analysis (MCA) and Fuzzy AHP Method for Occupational Health and Safety Performance Evaluation in the Land Cargo Transportation. In Digital Human Modeling and Applications in Health, Safety, Ergonomics and Risk Management. Human Body and Motion. HCII 2019. LectureNotes in Computer Science 11581; Duffy, V., Ed.; Springer: Berlin/Heidelberg, Germany, 2019. [Google Scholar]
- Barfod, M.B.; Jensen, A.V.; Leleur, S. Examination of Decision Support Systems for Composite CBA and MCDA Assessments of Transport Infrastructure Projects. In New State of MCDM in the 21st Century, Lecture Notes in Economics and Mathematical Systems; Shi, Y., Wang, S., Kou, G., Wallenius, J., Eds.; Springer: Berlin/Heidelberg, Germany, 2011; Volume 648, pp. 167–176. [Google Scholar]
- Cadena, B.P.C.; Magro, J.M.V. Setting the weights of sustainability criteria for the appraisal of transport projects. Transport 2015, 30, 298–306. [Google Scholar] [CrossRef] [Green Version]
- Liu, H.C.; You, X.Y.; Xue, Y.X.; Luan, X. Exploring critical factors influencing the diffusion of electric vehicles in China: A multi-stakeholder perspective. Res. Transp. Econ. 2017, 66, 46–58. [Google Scholar] [CrossRef]
- Komchornrit, K. The Selection of Dry Port Location by a Hybrid CFA-MACBETH-PROMETHEE Method: A Case Study of Southern Thailand. Asian J. Shipp. Logist. 2017, 33, 141–153. [Google Scholar] [CrossRef]
- Hsu, C.-C.; Liou, J.J.; Lo, H.-W.; Wang, Y.-C. Using a hybrid method for evaluating and improving the service quality of public bike-sharing systems. J. Clean. Prod. 2018, 202, 1131–1144. [Google Scholar] [CrossRef]
- Lambas, M.E.L.; Giuffrida, N.; Ignaccolo, M.; Inturri, G. Comparison between Bus Rapid Transit and Light-Rail Transit Systems: A Multi-Criteria Decision Analysis Approach. WIT Trans. Built Environ. 2017, 176, 143–154. [Google Scholar] [CrossRef] [Green Version]
- Deveci, M.; Canıtez, F.; Gökaşar, I. WASPAS and TOPSIS based interval type-2 fuzzy MCDM method for a selection of a car sharing station. Sustain. Cities Soc. 2018, 41, 777–791. [Google Scholar] [CrossRef]


| Classic Saaty Scale | Fuzzy Triangular Scale | Classic Fontela and Gabus Scale | Modification Fontela and Gabus Scale |
|---|---|---|---|
| 1 | 1, 1, 1 | 0 | 0 |
| 2 | 1, 2, 3 | 1 | 1 |
| 3 | 2, 3, 4 | 2 | |
| 4 | 3, 4, 5 | 2 | 3 |
| 5 | 4, 5, 6 | 4 | |
| 6 | 5, 6, 7 | 3 | 5 |
| 7 | 6, 7, 8 | 6 | |
| 8 | 7, 8, 9 | 4 | 7 |
| 9 | 9, 9, 9 | 8 |
| Definition | Classic Saaty Scale | REMBRANDT Scale |
|---|---|---|
| Equal importance | 1 | 0 |
| Weak or slight | 2 | 1 |
| Moderate importance | 3 | 2 |
| Moderate plus | 4 | 3 |
| Strong importance | 5 | 4 |
| Strong plus | 6 | 5 |
| Very strong | 7 | 6 |
| Very, very strong | 8 | 7 |
| Extremely strong | 9 | 8 |
| “If activity i has one of the above non-zero numbers assigned to it when compared with activity j, then j has the reciprocal value when compared with i” | 1/9, 1/8, 1/7, 1/6, 1/5, 1/4, 1/3, 1/2 | −8, −7, −6, −5, −4, −3, −2, −1 |
| Number | Name | Variant of the Expressway Route | Variant of the National Road Route | Length (km) | Number of Engineering Objects |
|---|---|---|---|---|---|
| V1 | Variant 1 | 1 | 1 | 53 856.37 | 80 |
| V2 | Variant 2 | 1 | 2 | 53 651.39 | 82 |
| V3 | Variant 3 | 1 | 3 | 53 517.19 | 77 |
| V4 | Variant 4 | 2 | 2 | 52 249.97 | 78 |
| V5 | Variant 5 | 2 | 1 | 53 230.57 | 79 |
| V6 | Variant 6 | 2 | 3 | 52 891.39 | 76 |
| M | C1 | C2 | C3 | C4 | C5 | C6 | C7 | C8 | C9 | C10 | C11 | C12 | C13 |
|---|---|---|---|---|---|---|---|---|---|---|---|---|---|
| C1 | 0.000 | 4.000 | 4.000 | 4.000 | 4.000 | 4.000 | 4.000 | 4.000 | 0.000 | 0.000 | 0.000 | 0.000 | 0.000 |
| C2 | 3.000 | 0.000 | 3.000 | 3.000 | 3.000 | 3.000 | 3.000 | 3.000 | 0.000 | 0.000 | 0.000 | 0.000 | 0.000 |
| C3 | 0.000 | 0.000 | 0.000 | 0.000 | 0.000 | 0.000 | 0.000 | 0.000 | 0.000 | 0.000 | 0.000 | 0.000 | 0.000 |
| C4 | 0.000 | 0.000 | 0.000 | 0.000 | 0.000 | 0.000 | 0.000 | 0.000 | 0.000 | 0.000 | 0.000 | 0.000 | 0.000 |
| C5 | 0.000 | 0.000 | 4.000 | 4.000 | 0.000 | 4.000 | 4.000 | 4.000 | 0.000 | 0.000 | 0.000 | 0.000 | 0.000 |
| C6 | 0.000 | 0.000 | 0.000 | 0.000 | 0.000 | 0.000 | 0.000 | 3.000 | 0.000 | 0.000 | 0.000 | 0.000 | 0.000 |
| C7 | 0.000 | 0.000 | 0.000 | 0.000 | 0.000 | 0.000 | 0.000 | 3.000 | 0.000 | 0.000 | 0.000 | 0.000 | 0.000 |
| C8 | 0.000 | 0.000 | 0.000 | 0.000 | 0.000 | 2.000 | 2.000 | 0.000 | 0.000 | 0.000 | 0.000 | 0.000 | 0.000 |
| C9 | 0.000 | 0.000 | 4.000 | 4.000 | 0.000 | 4.000 | 4.000 | 4.000 | 0.000 | 0.000 | 0.000 | 0.000 | 4.000 |
| C10 | 0.000 | 0.000 | 0.000 | 0.000 | 0.000 | 0.000 | 0.000 | 0.000 | 0.000 | 0.000 | 0.000 | 0.000 | 0.000 |
| C11 | 0.000 | 0.000 | 3.000 | 3.000 | 0.000 | 3.000 | 3.000 | 3.000 | 0.000 | 0.000 | 0.000 | 0.000 | 0.000 |
| C12 | 0.000 | 0.000 | 0.000 | 0.000 | 0.000 | 0.000 | 0.000 | 0.000 | 0.000 | 0.000 | 0.000 | 0.000 | 0.000 |
| C13 | 0.000 | 0.000 | 0.000 | 0.000 | 0.000 | 0.000 | 0.000 | 0.000 | 0.000 | 0.000 | 0.000 | 0.000 | 0.000 |
| M’ | C1 | C2 | C3 | C4 | C5 | C6 | C7 | C8 | C9 | C10 | C11 | C12 | C13 |
|---|---|---|---|---|---|---|---|---|---|---|---|---|---|
| C1 | 0.000 | 0.143 | 0.143 | 0.143 | 0.143 | 0.143 | 0.143 | 0.143 | 0.000 | 0.000 | 0.000 | 0.000 | 0.000 |
| C2 | 0.107 | 0.000 | 0.107 | 0.107 | 0.107 | 0.107 | 0.107 | 0.107 | 0.000 | 0.000 | 0.000 | 0.000 | 0.000 |
| C3 | 0.000 | 0.000 | 0.000 | 0.000 | 0.000 | 0.000 | 0.000 | 0.000 | 0.000 | 0.000 | 0.000 | 0.000 | 0.000 |
| C4 | 0.000 | 0.000 | 0.000 | 0.000 | 0.000 | 0.000 | 0.000 | 0.000 | 0.000 | 0.000 | 0.000 | 0.000 | 0.000 |
| C5 | 0.000 | 0.000 | 0.143 | 0.143 | 0.000 | 0.143 | 0.143 | 0.143 | 0.000 | 0.000 | 0.000 | 0.000 | 0.000 |
| C6 | 0.000 | 0.000 | 0.000 | 0.000 | 0.000 | 0.000 | 0.000 | 0.107 | 0.000 | 0.000 | 0.000 | 0.000 | 0.000 |
| C7 | 0.000 | 0.000 | 0.000 | 0.000 | 0.000 | 0.000 | 0.000 | 0.107 | 0.000 | 0.000 | 0.000 | 0.000 | 0.000 |
| C8 | 0.000 | 0.000 | 0.000 | 0.000 | 0.000 | 0.071 | 0.071 | 0.000 | 0.000 | 0.000 | 0.000 | 0.000 | 0.000 |
| C9 | 0.000 | 0.000 | 0.143 | 0.143 | 0.000 | 0.143 | 0.143 | 0.143 | 0.000 | 0.000 | 0.000 | 0.000 | 0.143 |
| C10 | 0.000 | 0.000 | 0.000 | 0.000 | 0.000 | 0.000 | 0.000 | 0.000 | 0.000 | 0.000 | 0.000 | 0.000 | 0.000 |
| C11 | 0.000 | 0.000 | 0.107 | 0.107 | 0.000 | 0.107 | 0.107 | 0.107 | 0.000 | 0.000 | 0.000 | 0.000 | 0.000 |
| C12 | 0.000 | 0.000 | 0.000 | 0.000 | 0.000 | 0.000 | 0.000 | 0.000 | 0.000 | 0.000 | 0.000 | 0.000 | 0.000 |
| C13 | 0.000 | 0.000 | 0.000 | 0.000 | 0.000 | 0.000 | 0.000 | 0.000 | 0.000 | 0.000 | 0.000 | 0.000 | 0.000 |
| n | C1 | C2 | C3 | C4 | C5 | C6 | C7 | C8 | C9 | C10 | C11 | C12 | C13 | Score L |
|---|---|---|---|---|---|---|---|---|---|---|---|---|---|---|
| C1 | 0.016 | 0.145 | 0.184 | 0.184 | 0.161 | 0.200 | 0.200 | 0.226 | 0.000 | 0.000 | 0.000 | 0.000 | 0.000 | 1.314 |
| C2 | 0.109 | 0.016 | 0.142 | 0.142 | 0.124 | 0.155 | 0.155 | 0.175 | 0.000 | 0.000 | 0.000 | 0.000 | 0.000 | 1.017 |
| C3 | 0.000 | 0.000 | 0.000 | 0.000 | 0.000 | 0.000 | 0.000 | 0.000 | 0.000 | 0.000 | 0.000 | 0.000 | 0.000 | 0.000 |
| C4 | 0.000 | 0.000 | 0.000 | 0.000 | 0.000 | 0.000 | 0.000 | 0.000 | 0.000 | 0.000 | 0.000 | 0.000 | 0.000 | 0.000 |
| C5 | 0.000 | 0.000 | 0.143 | 0.143 | 0.000 | 0.155 | 0.155 | 0.176 | 0.000 | 0.000 | 0.000 | 0.000 | 0.000 | 0.773 |
| C6 | 0.000 | 0.000 | 0.000 | 0.000 | 0.000 | 0.008 | 0.008 | 0.109 | 0.000 | 0.000 | 0.000 | 0.000 | 0.000 | 0.124 |
| C7 | 0.000 | 0.000 | 0.000 | 0.000 | 0.000 | 0.008 | 0.008 | 0.109 | 0.000 | 0.000 | 0.000 | 0.000 | 0.000 | 0.124 |
| C8 | 0.000 | 0.000 | 0.000 | 0.000 | 0.000 | 0.073 | 0.073 | 0.016 | 0.000 | 0.000 | 0.000 | 0.000 | 0.000 | 0.161 |
| C9 | 0.000 | 0.000 | 0.143 | 0.143 | 0.000 | 0.155 | 0.155 | 0.176 | 0.000 | 0.000 | 0.000 | 0.000 | 0.143 | 0.916 |
| C10 | 0.000 | 0.000 | 0.000 | 0.000 | 0.000 | 0.000 | 0.000 | 0.000 | 0.000 | 0.000 | 0.000 | 0.000 | 0.000 | 0.000 |
| C11 | 0.000 | 0.000 | 0.107 | 0.107 | 0.000 | 0.117 | 0.117 | 0.132 | 0.000 | 0.000 | 0.000 | 0.000 | 0.000 | 0.580 |
| C12 | 0.000 | 0.000 | 0.000 | 0.000 | 0.000 | 0.000 | 0.000 | 0.000 | 0.000 | 0.000 | 0.000 | 0.000 | 0.000 | 0.000 |
| C13 | 0.000 | 0.000 | 0.000 | 0.000 | 0.000 | 0.000 | 0.000 | 0.000 | 0.000 | 0.000 | 0.000 | 0.000 | 0.000 | 0.000 |
| Score C | 0.124 | 0.161 | 0.719 | 0.719 | 0.285 | 0.870 | 0.870 | 1.119 | 0.000 | 0.000 | 0.000 | 0.000 | 0.143 |
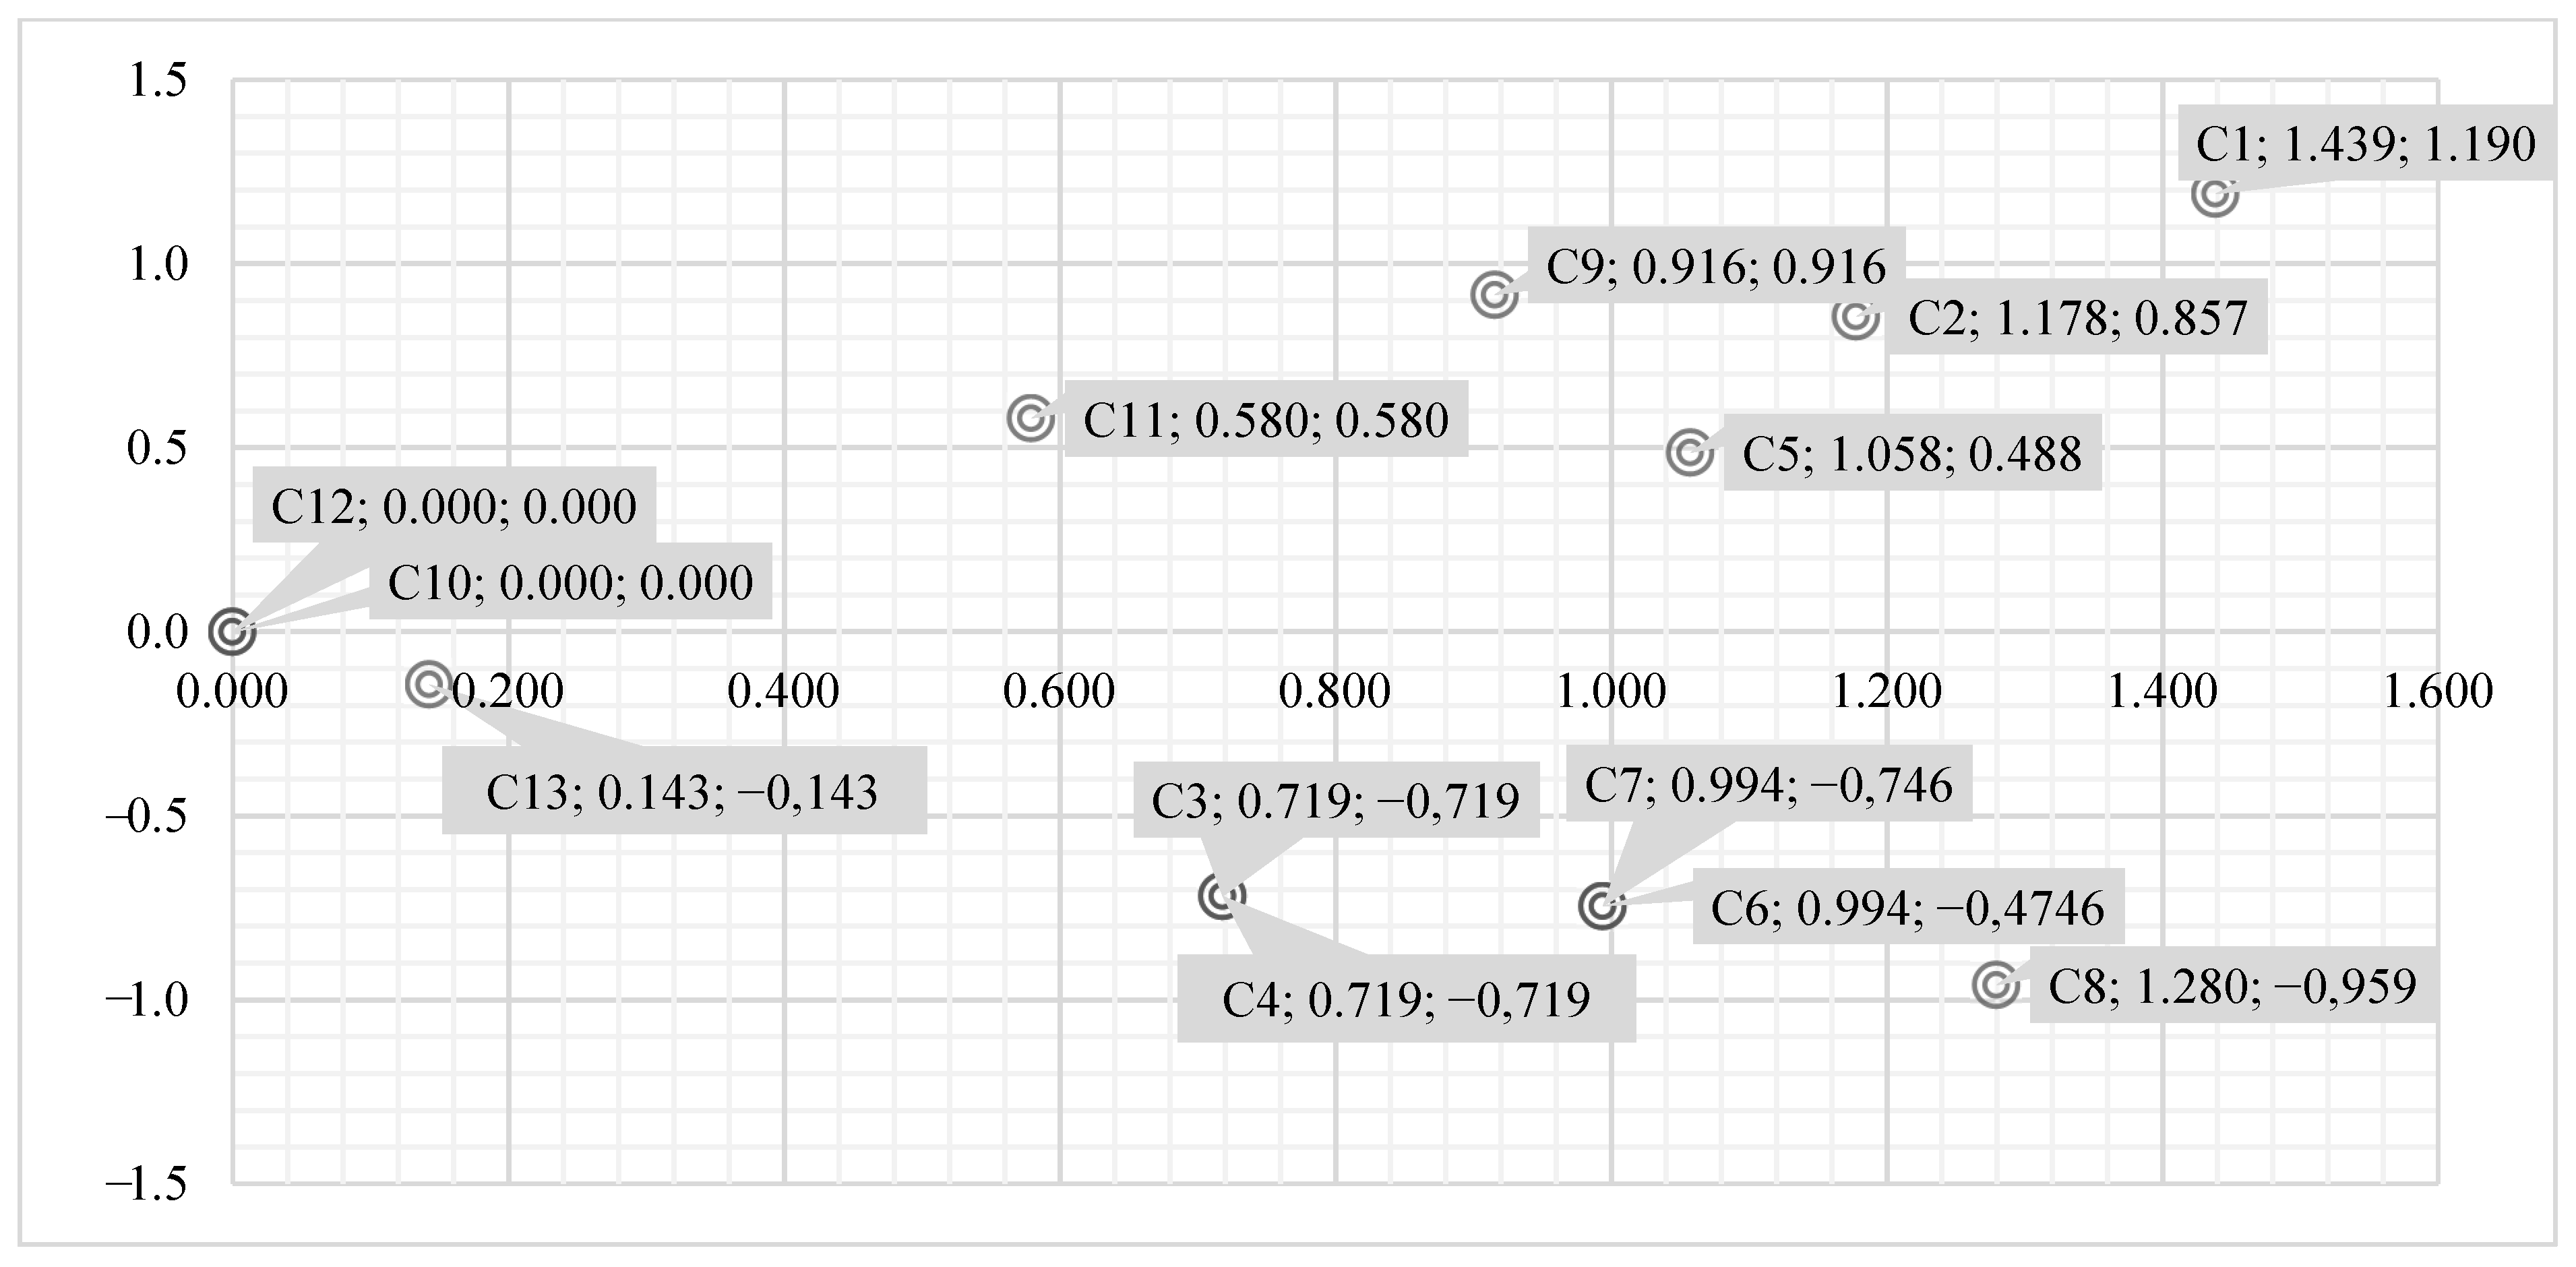
| Score L | Score C | Prominence | Relation | |
|---|---|---|---|---|
| C1 | 1.314 | 0.124 | 1.439 | 1.190 |
| C2 | 1.017 | 0.161 | 1.178 | 0.857 |
| C3 | 0.000 | 0.719 | 0.719 | −0.719 |
| C4 | 0.000 | 0.719 | 0.719 | −0.719 |
| C5 | 0.773 | 0.285 | 1.058 | 0.488 |
| C6 | 0.124 | 0.870 | 0.994 | −0.746 |
| C7 | 0.124 | 0.870 | 0.994 | −0.746 |
| C8 | 0.161 | 1.119 | 1.280 | −0.959 |
| C9 | 0.916 | 0.000 | 0.916 | 0.916 |
| C10 | 0.000 | 0.000 | 0.000 | 0.000 |
| C11 | 0.580 | 0.000 | 0.580 | 0.580 |
| C12 | 0.000 | 0.000 | 0.000 | 0.000 |
| C13 | 0.000 | 0.143 | 0.143 | −0.143 |
| C1 | C2 | C3 | C4 | C5 | C6 | C7 | C8 | C9 | C10 | C11 | C12 | C13 | Weight | |
|---|---|---|---|---|---|---|---|---|---|---|---|---|---|---|
| C1 | 1.000 | 1.000 | 3.000 | 3.000 | 1.000 | 1.000 | 1.000 | 1.000 | 5.000 | 3.000 | 5.000 | 1.000 | 1.000 | 0.106 |
| C2 | 1.000 | 1.000 | 3.000 | 3.000 | 1.000 | 1.000 | 1.000 | 1.000 | 5.000 | 3.000 | 5.000 | 1.000 | 1.000 | 0.106 |
| C3 | 0.333 | 0.333 | 1.000 | 1.000 | 0.333 | 0.333 | 0.333 | 0.333 | 3.000 | 1.000 | 3.000 | 0.333 | 0.333 | 0.039 |
| C4 | 0.333 | 0.333 | 1.000 | 1.000 | 0.333 | 0.333 | 0.333 | 0.333 | 3.000 | 1.000 | 3.000 | 0.333 | 0.333 | 0.039 |
| C5 | 1.000 | 1.000 | 3.000 | 3.000 | 1.000 | 1.000 | 1.000 | 1.000 | 5.000 | 3.000 | 5.000 | 1.000 | 1.000 | 0.106 |
| C6 | 1.000 | 1.000 | 3.000 | 3.000 | 1.000 | 1.000 | 1.000 | 1.000 | 5.000 | 3.000 | 5.000 | 1.000 | 1.000 | 0.106 |
| C7 | 1.000 | 1.000 | 3.000 | 3.000 | 1.000 | 1.000 | 1.000 | 1.000 | 5.000 | 3.000 | 5.000 | 1.000 | 1.000 | 0.106 |
| C8 | 1.000 | 1.000 | 3.000 | 3.000 | 1.000 | 1.000 | 1.000 | 1.000 | 5.000 | 3.000 | 5.000 | 1.000 | 1.000 | 0.106 |
| C9 | 0.200 | 0.200 | 0.333 | 0.333 | 0.200 | 0.200 | 0.200 | 0.200 | 1.000 | 0.333 | 1.000 | 0.200 | 0.200 | 0.019 |
| C10 | 0.333 | 0.333 | 1.000 | 1.000 | 0.333 | 0.333 | 0.333 | 0.333 | 3.000 | 1.000 | 3.000 | 0.333 | 0.333 | 0.039 |
| C11 | 0.200 | 0.200 | 0.333 | 0.333 | 0.200 | 0.200 | 0.200 | 0.200 | 1.000 | 0.333 | 1.000 | 0.200 | 0.200 | 0.019 |
| C12 | 1.000 | 1.000 | 3.000 | 3.000 | 1.000 | 1.000 | 1.000 | 1.000 | 5.000 | 3.000 | 5.000 | 1.000 | 1.000 | 0.106 |
| C13 | 1.000 | 1.000 | 3.000 | 3.000 | 1.000 | 1.000 | 1.000 | 1.000 | 5.000 | 3.000 | 5.000 | 1.000 | 1.000 | 0.106 |
| Consistency check λmax = 13.009 and CR = 0.005 | ||||||||||||||
| C1 | C2 | C3 | C4 | C5 | C6 | C7 | C8 | C9 | C10 | C11 | C12 | C13 | |
|---|---|---|---|---|---|---|---|---|---|---|---|---|---|
| C1 | 0.000 | 0.000 | 2.000 | 2.000 | 0.000 | 0.000 | 0.000 | 0.000 | 4.000 | 2.000 | 4.000 | 0.000 | 0.000 |
| C2 | 0.000 | 0.000 | 2.000 | 2.000 | 0.000 | 0.000 | 0.000 | 0.000 | 4.000 | 2.000 | 4.000 | 0.000 | 0.000 |
| C3 | −2.000 | −2.000 | 0.000 | 0.000 | −2.000 | −2.000 | −2.000 | −2.000 | 2.000 | 0.000 | 2.000 | −2.000 | −2.000 |
| C4 | −2.000 | −2.000 | 0.000 | 0.000 | −2.000 | −2.000 | −2.000 | −2.000 | 2.000 | 0.000 | 2.000 | −2.000 | −2.000 |
| C5 | 0.000 | 0.000 | 2.000 | 2.000 | 0.000 | 0.000 | 0.000 | 0.000 | 4.000 | 2.000 | 4.000 | 0.000 | 0.000 |
| C6 | 0.000 | 0.000 | 2.000 | 2.000 | 0.000 | 0.000 | 0.000 | 0.000 | 4.000 | 2.000 | 4.000 | 0.000 | 0.000 |
| C7 | 0.000 | 0.000 | 2.000 | 2.000 | 0.000 | 0.000 | 0.000 | 0.000 | 4.000 | 2.000 | 4.000 | 0.000 | 0.000 |
| C8 | 0.000 | 0.000 | 2.000 | 2.000 | 0.000 | 0.000 | 0.000 | 0.000 | 4.000 | 2.000 | 4.000 | 0.000 | 0.000 |
| C9 | −4.000 | −4.000 | −2.000 | −2.000 | −4.000 | −4.000 | −4.000 | −4.000 | 0.000 | −2.000 | 0.000 | −4.000 | −4.000 |
| C10 | −2.000 | −2.000 | 0.000 | 0.000 | −2.000 | −2.000 | −2.000 | −2.000 | 2.000 | 0.000 | 2.000 | −2.000 | −2.000 |
| C11 | −4.000 | −4.000 | −2.000 | −2.000 | −4.000 | −4.000 | −4.000 | −4.000 | 0.000 | −2.000 | 0.000 | −4.000 | −4.000 |
| C12 | 0.000 | 0.000 | 2.000 | 2.000 | 0.000 | 0.000 | 0.000 | 0.000 | 4.000 | 2.000 | 4.000 | 0.000 | 0.000 |
| C13 | 0.000 | 0.000 | 2.000 | 2.000 | 0.000 | 0.000 | 0.000 | 0.000 | 4.000 | 2.000 | 4.000 | 0.000 | 0.000 |
| C1 | C2 | C3 | C4 | C5 | C6 | C7 | C8 | C9 | C10 | C11 | C12 | C13 | Avg. | Weight | |
|---|---|---|---|---|---|---|---|---|---|---|---|---|---|---|---|
| C1 | 1.000 | 1.000 | 2.000 | 2.000 | 1.000 | 1.000 | 1.000 | 1.000 | 4.000 | 2.000 | 4.000 | 1.000 | 1.000 | 1.452 | 0.100 |
| C2 | 1.000 | 1.000 | 2.000 | 2.000 | 1.000 | 1.000 | 1.000 | 1.000 | 4.000 | 2.000 | 4.000 | 1.000 | 1.000 | 1.452 | 0.100 |
| C3 | 0.500 | 0.500 | 1.000 | 1.000 | 0.500 | 0.500 | 0.500 | 0.500 | 2.000 | 1.000 | 2.000 | 0.500 | 0.500 | 0.726 | 0.050 |
| C4 | 0.500 | 0.500 | 1.000 | 1.000 | 0.500 | 0.500 | 0.500 | 0.500 | 2.000 | 1.000 | 2.000 | 0.500 | 0.500 | 0.726 | 0.050 |
| C5 | 1.000 | 1.000 | 2.000 | 2.000 | 1.000 | 1.000 | 1.000 | 1.000 | 4.000 | 2.000 | 4.000 | 1.000 | 1.000 | 1.452 | 0.100 |
| C6 | 1.000 | 1.000 | 2.000 | 2.000 | 1.000 | 1.000 | 1.000 | 1.000 | 4.000 | 2.000 | 4.000 | 1.000 | 1.000 | 1.452 | 0.100 |
| C7 | 1.000 | 1.000 | 2.000 | 2.000 | 1.000 | 1.000 | 1.000 | 1.000 | 4.000 | 2.000 | 4.000 | 1.000 | 1.000 | 1.452 | 0.100 |
| C8 | 1.000 | 1.000 | 2.000 | 2.000 | 1.000 | 1.000 | 1.000 | 1.000 | 4.000 | 2.000 | 4.000 | 1.000 | 1.000 | 1.452 | 0.100 |
| C9 | 0.250 | 0.250 | 0.500 | 0.500 | 0.250 | 0.250 | 0.250 | 0.250 | 1.000 | 0.500 | 1.000 | 0.250 | 0.250 | 0.363 | 0.025 |
| C10 | 0.500 | 0.500 | 1.000 | 1.000 | 0.500 | 0.500 | 0.500 | 0.500 | 2.000 | 1.000 | 2.000 | 0.500 | 0.500 | 0.726 | 0.050 |
| C11 | 0.250 | 0.250 | 0.500 | 0.500 | 0.250 | 0.250 | 0.250 | 0.250 | 1.000 | 0.500 | 1.000 | 0.250 | 0.250 | 0.363 | 0.025 |
| C12 | 1.000 | 1.000 | 2.000 | 2.000 | 1.000 | 1.000 | 1.000 | 1.000 | 4.000 | 2.000 | 4.000 | 1.000 | 1.000 | 1.452 | 0.100 |
| C13 | 1.000 | 1.000 | 2.000 | 2.000 | 1.000 | 1.000 | 1.000 | 1.000 | 4.000 | 2.000 | 4.000 | 1.000 | 1.000 | 1.452 | 0.100 |
| C1 | C2 | C3 | C4 | C5 | C6 | C7 | C8 | C9 | C10 | C11 | C12 | C13 | |
|---|---|---|---|---|---|---|---|---|---|---|---|---|---|
| W1 | 86.1 | 2425 | 9 | 0 | 39.1 | 4 | 11 | 64 | 3.1 | 23 | 12850 | 7 | 7 |
| W2 | 42.6 | 953 | 11 | 0 | 44.8 | 5 | 10 | 62 | 2.9 | 22 | 12268 | 9 | 7 |
| W3 | 42.6 | 937 | 11 | 0 | 41.8 | 4 | 11 | 60 | 2.9 | 23 | 11806 | 8 | 7 |
| W4 | 48.6 | 1573 | 9 | 1 | 62.9 | 6 | 6 | 65 | 2.9 | 33 | 14353 | 14 | 26 |
| W5 | 92.1 | 3045 | 7 | 1 | 57.2 | 5 | 7 | 68 | 3.1 | 34 | 15185 | 17 | 26 |
| W6 | 48.6 | 1557 | 9 | 1 | 59.9 | 5 | 7 | 64 | 2.9 | 34 | 14141 | 14 | 26 |
| Character | dest. | dest. | dest. | dest. | dest. | dest. | dest. | dest. | dest. | dest. | dest. | dest. | dest. |
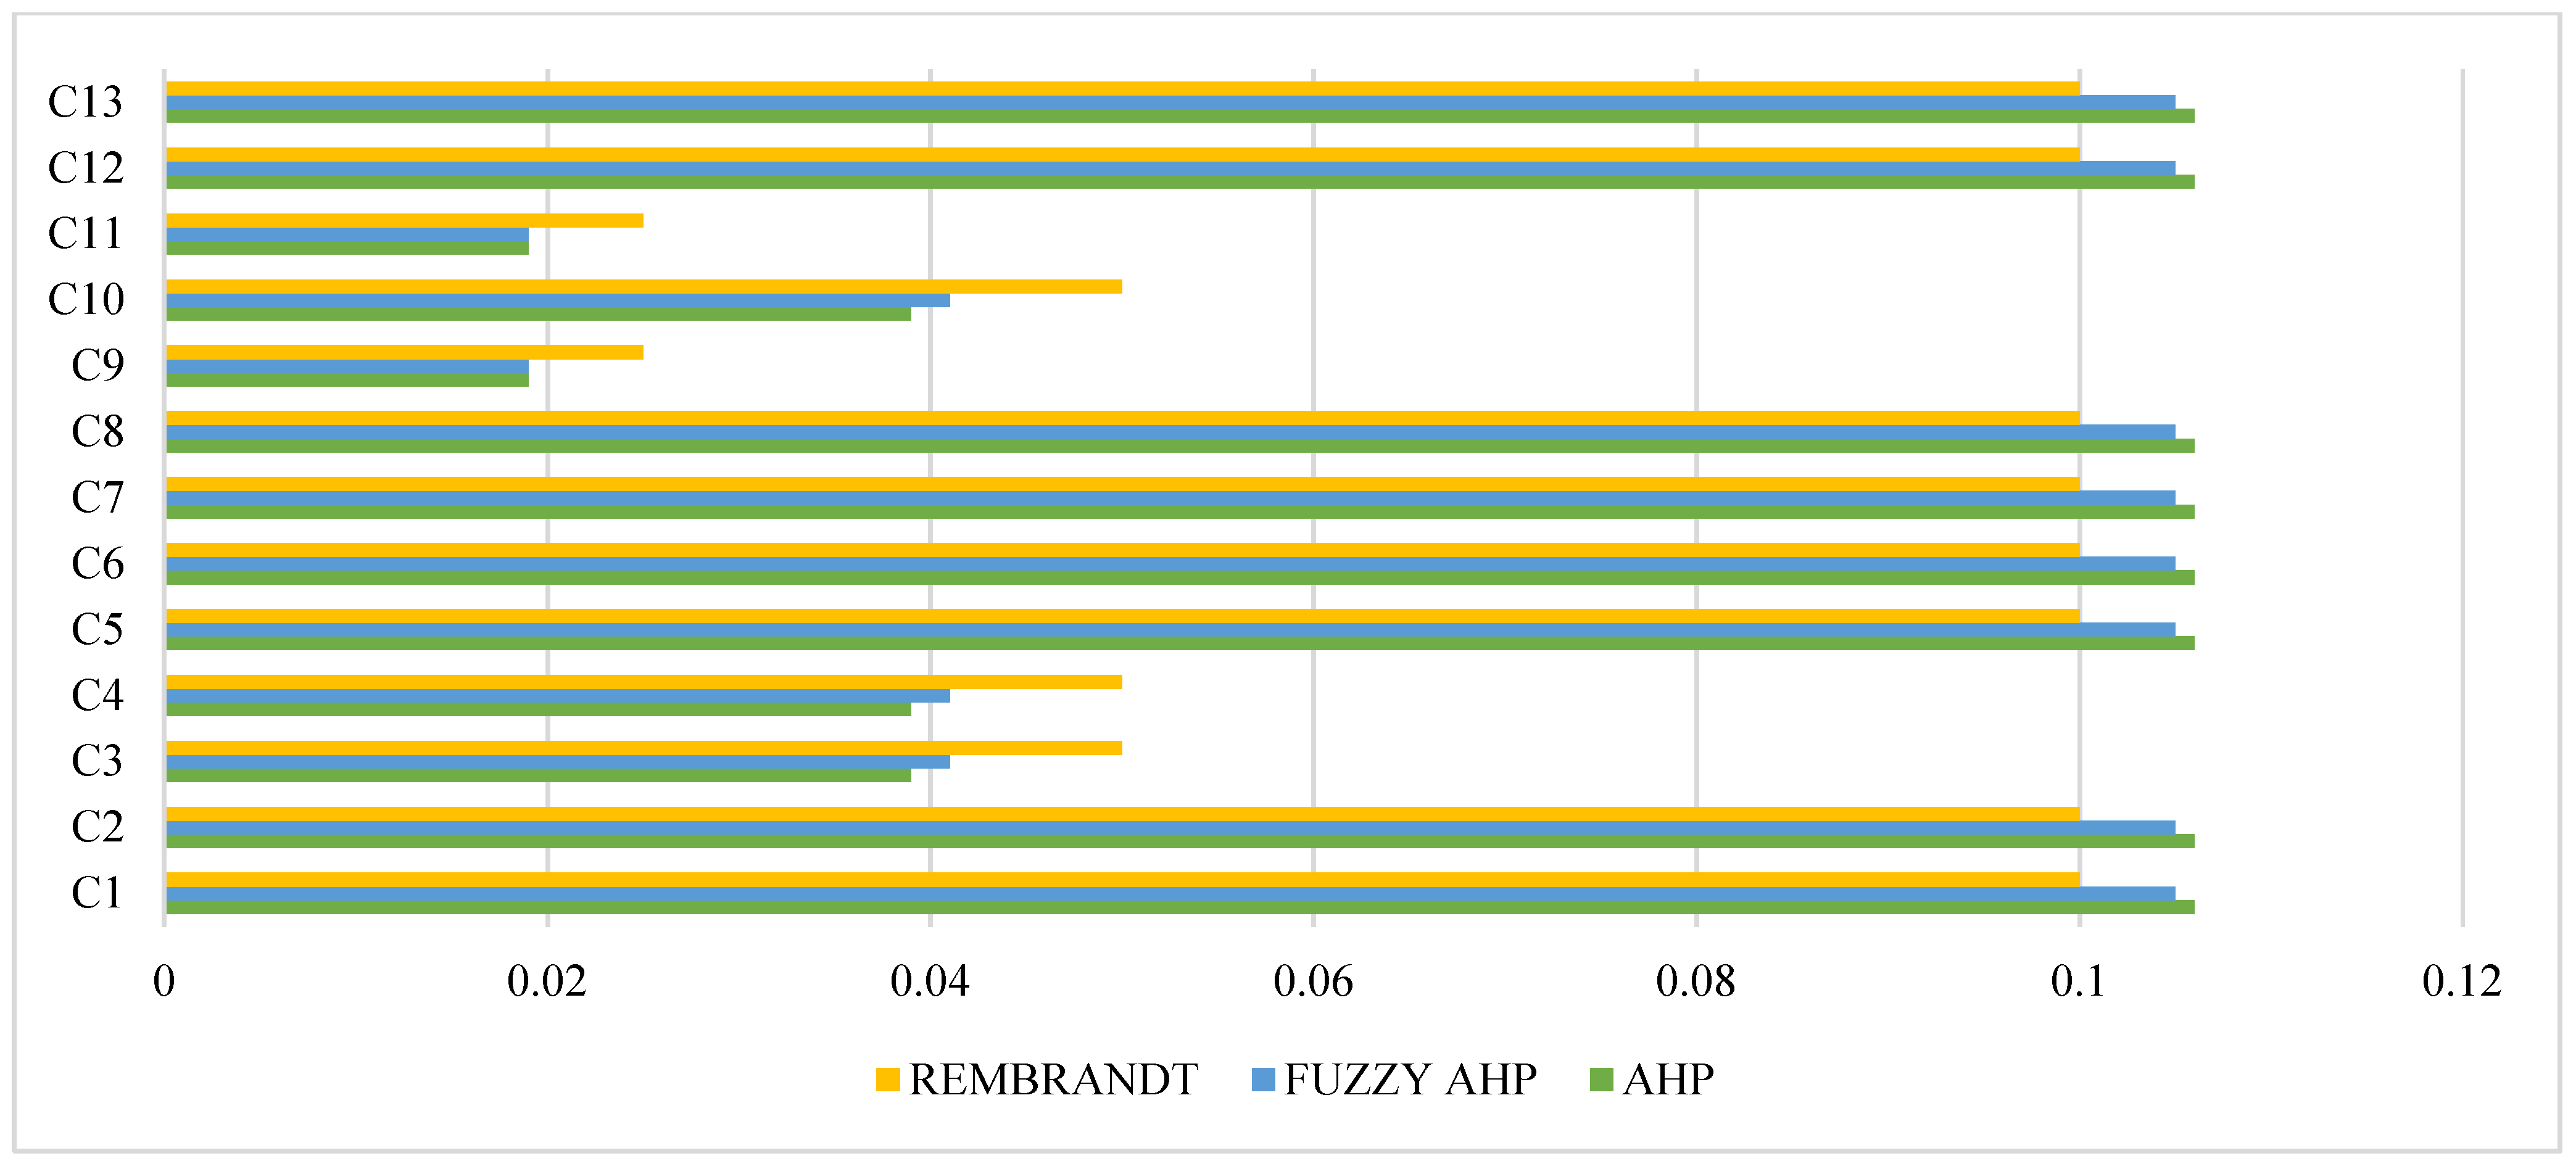
| Weights (AHP) | 0.106 | 0.106 | 0.039 | 0.039 | 0.106 | 0.106 | 0.106 | 0.106 | 0.019 | 0.039 | 0.019 | 0.106 | 0.106 |
| Weights (FAHP) | 0.105 | 0.105 | 0.041 | 0.041 | 0.105 | 0.105 | 0.105 | 0.105 | 0.019 | 0.041 | 0.019 | 0.105 | 0.105 |
| Weights (REMBRANDT) | 0.100 | 0.100 | 0.050 | 0.050 | 0.100 | 0.100 | 0.100 | 0.100 | 0.025 | 0.050 | 0.025 | 0.100 | 0.100 |
| Methods | Variants | C1 | C2 | C3 | C4 | C5 | C6 | C7 | C8 | C9 | C10 | C11 | C12 | C13 | S | R | Q | Ranking |
|---|---|---|---|---|---|---|---|---|---|---|---|---|---|---|---|---|---|---|
| VIKOR method, AHP weights | W1 | 0.093 | 0.075 | 0.020 | 0.000 | 0.000 | 0.000 | 0.106 | 0.053 | 0.019 | 0.003 | 0.006 | 0.000 | 0.000 | 0.375 | 0.106 | 0.662 | 3 |
| W2 | 0.000 | 0.001 | 0.039 | 0.000 | 0.025 | 0.053 | 0.085 | 0.027 | 0.000 | 0.000 | 0.003 | 0.021 | 0.000 | 0.253 | 0.085 | 0.065 | 1 | |
| W2 | 0.000 | 0.000 | 0.039 | 0.000 | 0.012 | 0.000 | 0.106 | 0.000 | 0.000 | 0.003 | 0.000 | 0.011 | 0.000 | 0.171 | 0.106 | 0.500 | 2 | |
| W4 | 0.013 | 0.032 | 0.020 | 0.039 | 0.106 | 0.106 | 0.000 | 0.066 | 0.000 | 0.036 | 0.014 | 0.074 | 0.106 | 0.612 | 0.106 | 0.850 | 5 | |
| W5 | 0.106 | 0.106 | 0.000 | 0.039 | 0.081 | 0.053 | 0.021 | 0.106 | 0.019 | 0.039 | 0.019 | 0.106 | 0.106 | 0.801 | 0.106 | 1.000 | 6 | |
| W6 | 0.013 | 0.031 | 0.020 | 0.039 | 0.093 | 0.053 | 0.021 | 0.053 | 0.000 | 0.039 | 0.013 | 0.074 | 0.106 | 0.555 | 0.106 | 0.805 | 4 | |
| Condition 1. Acceptable advantage, yes; Condition 2. Acceptable stability, yes | ||||||||||||||||||
| VIKOR method, Fuzzy AHP weights | W1 | 0.092 | 0.074 | 0.021 | 0.000 | 0.000 | 0.000 | 0.105 | 0.053 | 0.019 | 0.003 | 0.006 | 0.000 | 0.000 | 0.373 | 0.105 | 0.660 | 3 |
| W2 | 0.000 | 0.001 | 0.041 | 0.000 | 0.025 | 0.053 | 0.084 | 0.026 | 0.000 | 0.000 | 0.003 | 0.021 | 0.000 | 0.253 | 0.084 | 0.065 | 1 | |
| W2 | 0.000 | 0.000 | 0.041 | 0.000 | 0.012 | 0.000 | 0.105 | 0.000 | 0.000 | 0.003 | 0.000 | 0.011 | 0.000 | 0.172 | 0.105 | 0.500 | 2 | |
| W4 | 0.013 | 0.032 | 0.021 | 0.041 | 0.105 | 0.105 | 0.000 | 0.066 | 0.000 | 0.038 | 0.014 | 0.074 | 0.105 | 0.612 | 0.105 | 0.851 | 5 | |
| W5 | 0.105 | 0.105 | 0.000 | 0.041 | 0.080 | 0.053 | 0.021 | 0.105 | 0.019 | 0.041 | 0.019 | 0.105 | 0.105 | 0.798 | 0.105 | 1.000 | 6 | |
| W6 | 0.013 | 0.031 | 0.021 | 0.041 | 0.092 | 0.053 | 0.021 | 0.053 | 0.000 | 0.041 | 0.013 | 0.074 | 0.105 | 0.556 | 0.105 | 0.806 | 4 | |
| Condition 1. Acceptable advantage, yes; Condition 2. Acceptable stability, yes | ||||||||||||||||||
| VIKOR method, REMBRANDT weights | W1 | 0.088 | 0.071 | 0.025 | 0.000 | 0.000 | 0.000 | 0.100 | 0.050 | 0.025 | 0.004 | 0.008 | 0.000 | 0.000 | 0.370 | 0.100 | 0.657 | 3 |
| W2 | 0.000 | 0.001 | 0.050 | 0.000 | 0.024 | 0.050 | 0.080 | 0.025 | 0.000 | 0.000 | 0.003 | 0.020 | 0.000 | 0.253 | 0.080 | 0.063 | 1 | |
| W2 | 0.000 | 0.000 | 0.050 | 0.000 | 0.011 | 0.000 | 0.100 | 0.000 | 0.000 | 0.004 | 0.000 | 0.010 | 0.000 | 0.176 | 0.100 | 0.500 | 2 | |
| W4 | 0.012 | 0.030 | 0.025 | 0.050 | 0.100 | 0.100 | 0.000 | 0.063 | 0.000 | 0.046 | 0.019 | 0.070 | 0.100 | 0.614 | 0.100 | 0.854 | 5 | |
| W5 | 0.100 | 0.100 | 0.000 | 0.050 | 0.076 | 0.050 | 0.020 | 0.100 | 0.025 | 0.050 | 0.025 | 0.100 | 0.100 | 0.796 | 0.100 | 1.000 | 6 | |
| W6 | 0.012 | 0.029 | 0.025 | 0.050 | 0.087 | 0.050 | 0.020 | 0.050 | 0.000 | 0.050 | 0.017 | 0.070 | 0.100 | 0.561 | 0.100 | 0.811 | 4 | |
| Condition 1. Acceptable advantage, yes; Condition 2. Acceptable stability, yes | ||||||||||||||||||
| Method Used | Variant Ranking (from Best to Worst) |
|---|---|
| Report method | W3 > W2 > W1 > W6 > W4 > W5 |
| TOPSIS (AHP weights) | W2 > W3 > W1 > W6 > W4 > W5 |
| TOPSIS (FAHP weights) | W2 > W3 > W1 > W6 > W4 > W5 |
| TOPSIS (REMBRANDT weights) | W2 > W3 > W1 > W6 > W4 > W5 |
| PROMETHEE (AHP weights) | W3 > W2 > W1 > W6 > W4 > W5 |
| PROMETHEE (FAHP weights) | W3 > W2 > W1 > W6 > W4 > W5 |
| PROMETHEE (REMBRANDT weights) | W3 > W2 > W1 > W6 > W4 > W5 |
| VIKOR (AHP weights) | W2 > W3 > W1 > W6 > W4 > W5 |
| VIKOR (FAHP weights) | W2 > W3 > W1 > W6 > W4 > W5 |
| VIKOR (REMBRANDT weights) | W2 > W3 > W1 > W6 > W4 > W5 |
| Method | Strengths/Opportunities | Weaknesses Limitations | Examples of Problems Present in the Field of Transport |
|---|---|---|---|
| AHP |
|
| |
| Fuzzy AHP |
|
|
|
| REMBRANDT |
|
|
|
| DEMATEL |
|
|
|
| PROMETHEE |
|
|
|
| VIKOR |
|
|
|
| TOPSIS |
|
|
Publisher’s Note: MDPI stays neutral with regard to jurisdictional claims in published maps and institutional affiliations. |
© 2021 by the authors. Licensee MDPI, Basel, Switzerland. This article is an open access article distributed under the terms and conditions of the Creative Commons Attribution (CC BY) license (https://creativecommons.org/licenses/by/4.0/).
Share and Cite
Broniewicz, E.; Ogrodnik, K. A Comparative Evaluation of Multi-Criteria Analysis Methods for Sustainable Transport. Energies 2021, 14, 5100. https://doi.org/10.3390/en14165100
Broniewicz E, Ogrodnik K. A Comparative Evaluation of Multi-Criteria Analysis Methods for Sustainable Transport. Energies. 2021; 14(16):5100. https://doi.org/10.3390/en14165100
Chicago/Turabian StyleBroniewicz, Elzbieta, and Karolina Ogrodnik. 2021. "A Comparative Evaluation of Multi-Criteria Analysis Methods for Sustainable Transport" Energies 14, no. 16: 5100. https://doi.org/10.3390/en14165100
APA StyleBroniewicz, E., & Ogrodnik, K. (2021). A Comparative Evaluation of Multi-Criteria Analysis Methods for Sustainable Transport. Energies, 14(16), 5100. https://doi.org/10.3390/en14165100