Abstract
Uneven air distribution in chamber dryers is a common and serious technological challenge. A study using CFD (Computer Fluid Dynamics) simulation, supported by measurements in a heat pump chamber dryer, confirmed irregular airflows. Performing simulations with modified settings and additional chamber modifications enabled the airflows to be visualized and optimized. It was shown that a modification of the chamber where a rotating disc had been used had a positive effect on the uniform distribution of air flows in the drying chamber. The modification significantly improves the energy balance of the beef drying process. Optimization of the process resulted in obtaining a high quality final product-beef jerky. This investigation proves that appropriate drying process control and introduced modifications enable high product quality and a safe level of water activity without the preservatives supplementation.
1. Introduction
1.1. Microbiological Safety of the Beef Jerky Drying Process
Longer storage and the associated extension of a food product’s shelf life is important from the point of view of the organization of the production process and for the distribution of finished products. Obtaining acceptable durability and shelf-life is possible thanks to the application of, among others, thermal preservation processes. One of the oldest and commonly used methods of meat preservation is the process of drying. It consists of reducing the amount of water in meat tissues, thus limiting its susceptibility to microbial proliferation and slowing down the rate of chemical reactions occurring in meat [1]. Correctly selected drying temperature yields the same results as adding preservatives or maintaining the correct pH level, limiting the ability of microorganisms to multiply [2]. Evaporation of water from meat tissue happens at temperatures no higher than 65 °C [3,4,5].
Beef jerky, a product known and appreciated by consumers the world over, should satisfy a number of standards for it to be considered a healthy and safe food. According to the recommendations of the U.S. Food Safety and Inspection Service (FSIS), food products such as beef jerky should have an appropriate ratio of water to protein MPR, i.e., no more than 0.75:1, compared to 4.5:1 for raw meat. Additionally, beef jerky should contain more than 50% protein and no more than 4% fat [6,7]. Water activity in dried meat snacks should not exceed 0.85 [8], whereas achieving a water activity level (Wa) below 0.75 is desirable due to the reduction of growth of yeasts (e.g., Candida, Totulopsis, Ransemla), molds (mycotoxic penicillia), most halophilic bacteria, and mycotoxin-producing Aspergillus molds [9]. In addition, poorly dried meat can harbor E.coli 0157:H7 group bacteria, which is a common cause of food poisoning [10,11].
Dried beef snacks, apart from being safe for health reasons, should also be characterized by high quality, characteristic flavor, and a sufficiently long shelf life. Drying meat at too high a temperature causes physical and chemical changes in the product and significantly deteriorate its quality. At the same time, using lower drying temperatures prolongs the process contributing to the growth of undesirable microorganisms and fungi [7,8,11,12]. Furthermore, it is also important to control the drying process in such a way as to obtain the desired organoleptic properties of the snack, determining its quality as assessed by color, flavor, texture and (especially important in terms of product storage) product moisture and water activity [13,14,15,16]. Water activity is understood as the ratio of the water vapor pressure over the product surface to the water vapor pressure over the surface of pure water at the same temperature [3].
The level of expected product moisture and water activity is defined by the process, storage and marketing objectives to be satisfied. Product drying is a complex endeavor involving the issues of energy and mass transfer. Energy motion determines the biochemical phenomena occurring in the product [1,14,17,18,19]. Drying significantly extends shelf life and also contributes to lower transportation costs thanks to the reduction in the final product weight. In addition, drying makes it possible to obtain the required physical form, e.g., flakes or powder, and to obtain specific organoleptic characteristics (taste, texture, color).
1.2. Use of Heat Pumps in Drying Chambers
Many process factors are known to influence drying quality and efficiency. These include, but are not limited to, the temperature, speed and direction of the pumped drying air, its initial and final moisture content as well as the type of dryer [5,8,15,20,21,22].
With regard to the drying behavior, raw materials can be divided into two groups. The first group includes crystalline or granulated bodies, for which moisture is found in the intermolecular fissures or open pores. The second group comprises solids of organic origin—for which moisture, although an integral part of the structure, can also be enclosed in fibers and fine internal pores. Based on the above criteria, beef should be classified as an organic material [7,23,24].
Mechanical drying of beef involves conducting the process in drying chambers, in which it is possible to control the process parameters. Depending on the method of heat supply, drying can be divided into:
- Convection drying—heat energy is supplied by means of a heating agent, usually steam or gas. The agent flows around the surface of the material or through a layer of dried material;
- Contact drying—a process in which heat energy is obtained by conduction as the material rests or moves on heated surfaces during contact drying;
- Radiation drying—the material is radiated with heat energy by radiators;
- Dielectric—is the drying by applying an alternating electric field;
- Sublimation—involving the removal of water from frozen material by sublimation of ice [24].
The selection of the dryer must address, among others, the nature of the operation (continuous or intermittent), the pressure in the dryer, the design of the apparatus (chamber, tunnel, belt, shaft, drum, fluidized, roller, pneumatic or vibrating), and the scale of production [7,22].
The drying process is associated with a high demand for thermal energy. It is estimated that drying processes use up to 25% of industrial energy resources [9,25]. Therefore, reducing energy inputs is a priority given the depletion of fossil fuels, environmental pollution as well as financial considerations. This can be achieved by increasing the efficiency of systems and the drying process itself and by using technological solutions and equipment that guarantee the reduction of energy demand. Therefore, there is a need for a drying system that provides both high energy efficiency and excellent product quality [1,13,18,20,21,26,27,28].
A solution that is able to satisfy the aforementioned requirements concerning product properties, as well as care for the proper performance of the drying process, is the convection chamber (tray) dryer, which is commonly used in food industry for long, but not intensive drying. The advantage of this appliance is the simple structure of the apparatus, which consists of one or several chambers filled with trays. Fans force the movement of the drying air in the chamber. The use of perforated trays causes the air to flow also through the product “bed”, the so-called cross-flow. In order to ensure low flow resistance and pressure drops in the chamber, the distance between the trays/shelves should be approx. 80 mm, and the height of the bed on the shelves varies from 30 to 50 mm. The flow velocity of the drying air stream in the chamber should not exceed 5 m/s, but is typically 1.5 m/s [7,19,29,30].
Researchers concerned with the drying processes of biological materials point to numerous disadvantages of chamber dryers, such as, for instance [7,30]:
- High energy input per dry mass unit,
- Non-uniformity of the drying process related to the distribution of air across different parts of the chamber,
- Drying process management.
The CFM method significantly accelerates the work on optimization of the drying chamber structure and flow analysis of the drying medium streams. However, as indicated in their works [31,32,33], most of the numerical approaches dealing with this problem are based on the Euler’s equations. Therefore, in most cases, initialization of the inlet boundary conditions is necessary using a synthetic approach, which is, for example, the Synthetic Eddy Method (SEM). However, maintaining the level of environmental turbulence in the entire computational domain becomes very complicated, and this has been largely emphasized, for example, in [34]. Some research teams try to solve the equations by increasing the order of the numerical scheme and/or reducing the size of the grid use the Lagrange Vortex method. One of the main advantages of this approach to synthetic turbulence is that the level and characteristics of environmental turbulence are fully preserved throughout the computational domain.
Apart from them, the innovative solution may be to use a heat pump. In conventional dryers, the air is ejected outside the chamber, causing an irreversible loss of energy. The ejection of air increases the demand for thermal energy necessary to obtain the required quality parameters of dried meat. The increased energy expenditure translates into increased product costs. The use of a heat pump makes it possible to utilize the waste air stream escaping from the chamber and the enthalpy charge contained in it. In addition, the condensate is drained out of the chamber, and the moisture-free air is heated and returned to the circuit. In addition to the energy yield, the use of a heat pump reduces the environmental impact of the drying process by reducing the electricity required to operate the drying chamber [11,18,35]. Employing a heat pump can result in up to a 40% lower energy requirement compared to a standard dryer, calculated per mass of raw material dried [4,14]. The wide range of drying temperatures achieved (from 20 to 100 °C), with low humidity of the air entering the chamber, makes it possible to control the drying conditions in relation to the physicochemical properties of the raw material. This is very important from the standpoint of energy optimization of the process. Studies confirm that the use of a heat pump as an energy source, imparts a favorable color and aroma to agricultural products [4,9,26,28,36]. However, there are no literature references related to beef drying based on heat pump drying chamber design solutions. Reducing the thermal energy demand of the drying process is very important from a utilitarian point of view, as it allows for reducing production costs [7,14,25,30,37].
The use of a heat pump in a convection dryer, however, does not solve the main problem identified for this type of dryer, which is the uneven distribution of the drying medium-air. The single-point air inlet to the chamber, located in the lower section of the chamber, means that the direction and speed of the drying medium is not equal in every place in the chamber (Figure 1). As a result, an uneven degree of drying of the raw materials in the chamber is observed. After the drying cycle, products placed in the bottom section of the chamber contain the least moisture. One of the possible solutions to this problem is the use of appropriate distribution and guidance system of the drying airflow inside the chamber. Controlling the airflow and the appropriate temperature level in the beef drying process is of paramount importance [38], as it determines both the efficiency of the dryer and the uniform rate of drying of the products. The uniform rate of drying is construed as a similar level of product moisture and water activity in all products dried in the chamber, regardless of the placement and distance from the air inlet [6,19,29,39,40,41,42,43]. Applying an innovative solution of the dryer design involving a change of air distribution inside the chamber allowed the elimination of irregularities in drying and increased the efficiency of the dryer.
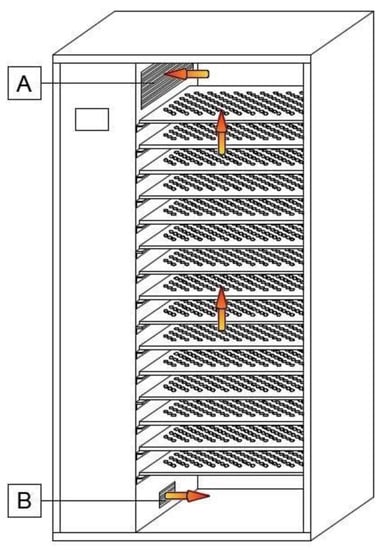
Figure 1.
Diagram of air flow through a classic drying chamber, without modification. A—air inlet; B—air outlet. The arrows indicate the direction of the air flow.
2. Methods and Simulations
The aim of this study was to optimize the drying process of beef in a heat pump convection chamber dryer. A critical analysis of the drying literature indicated that the optimization could be achieved by upgrading a standard heat pump drying chamber. A commercial convection heat pump chamber dryer (Ike Brand Heat Pump Dehydrator/Dryer-WRH 100G) was purchased in an effort to find solutions to reduce the heat energy requirements of the beef drying chamber. The air inlet to the chamber was located in the lower section of the chamber. The air outlet vent from the chamber was located in the upper space. Air flow measurements performed with a hand-held flow meter (AZ Instruments AZ8901 air flow and temperature meter) in the chamber showed that the average flow velocity measured at the chamber inlet was approx. 30 m/s. At the air outlet it was approx. 3 m/s. The air velocity on the trays was also examined; the highest velocity was recorded on the lowest trays, closest to the air inlet, where it was about 2 m/s, with the middle trays indicating approximately 0.7 m/s, and the highest trays about 0.5 m/s. Dryer parameters were set at 65 °C and 20% humidity.
Beef drying technology recommends that drying be divided into two stages. In the first, an initial heating of the meat is undertaken, leading to the evaporation of moisture from its surface. This phase is characterized by a constant rate of surface drying. Reaching the state of equilibrium of moisture at the meat-air interface starts the second stage in which the rate of drying decreases with time. This is when the transfer of moisture from the meat tissues towards the open surface of the raw material occurs (diffusion) [6]. Optimization of air movement in the dryer facilitates designing an appropriate shape of the chamber so as to reduce heat loss and intensify the evaporation of moisture from the raw material surface and increase the driving force of the diffusion of moisture from internal meat layers.
Modifications to the Drying Chamber
The drying chamber under test was modified as shown in Table 1.

Table 1.
Modification scope of the drying chamber.
3. Results and Discussion
3.1. CFD Simulations
The introduced modifications enabled computer simulations of the drying medium flows with the Ansys software. Computational fluid dynamics (CFD) flow simulations were performed in Ansys Fluent Software, in which turbulence flow analysis processes are described using turbulence models based on RANS (Reynolds Averaged Navier–Stokes Equations). This group includes the Spalart–Alimaras single equation model and two or more equation models: Standard k-“, RNG k-“, Realizable k-“, Standard k-!, SST k-!, or the Reynolds stress model. Mathematical descriptions of these models can be found in [37,38]. A numerical model of the geometry of the tested unit was made for the simulation. A model prepared in an * stp file and converted from Autodesk Inventor was used as the base. The model was discredited in Ansyss Meshing. An unstructured polyhedral grid of over 4.6 million elements was generated. The grid was introduced into the Ansys Fluent slower in order to combine the advantages of a hexahedral grid (i.e., high accuracy of results) with those of a tetrahedral grid (e.g., high generation speed). The main advantage of a polyhedral grid is that each element has many adjacent elements, so the gradients of the variables can be better approximated than with tetrahedral meshes [39]. In addition, polyhedral grids are able to generate fewer elements than tetrahedral grids, which reduces the time required for calculations and lowers hardware requirements. A model with 4.6 million nodes was used for the simulation. The simulations were made on the largest mesh allowed by the hardware capabilities (amount of RAM). The tests were carried out on the following meshes: 500,000, 4,000,000 and 6,000,000. For the last two meshes, the difference in mass flow and average pressures did not exceed 2%. The 4,600,000 mesh was used. The mass, momentum and energy conservation result in the continuity, Navier–Stokes and energy equation, respectively. The turbulent model used in this CFD simulation, with the following aspects like the turbulent kinetic energy, k, and its rate of dissipation, ε, are calculated from the following transport equations:
Convective heat and mass transfer modeling in the k-ε models is given by the following Equation (3):
Product trays are assumed as a porous media for airflow. Porous media are modeled by the addition of a momentum source term to the standard fluid flow equations. The source term is composed of two parts: a viscous loss term and an inertial loss term.
For the drying chamber with the heat pump in the unmodified version as well as with each of the five modifications, visualizations of the drying medium flows were made by determining the distribution patterns of the drying medium streams inside the chambers. The conclusions obtained from the analyses led to the rejection of three design solutions, i.e., modifications 1, 2, and 3 due to a lack of visible improvement in air flows compared to the chamber without modification. Figure 2 and Figure 3 present graphically the main aspects of the drying chamber modification, for the chamber with modification 4 and with modification 5, respectively, as well as the corresponding computer simulations of airflow distribution (Figure 4, Figure 5 and Figure 6).
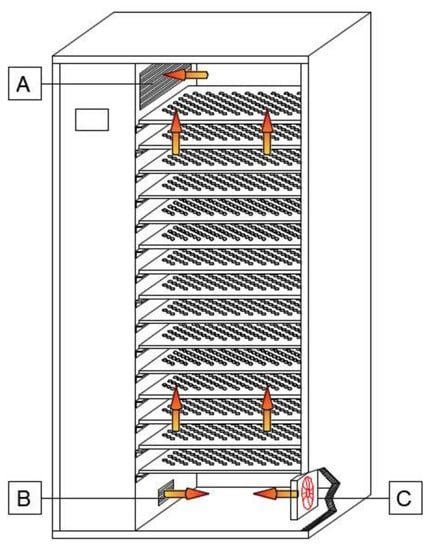
Figure 2.
Diagram of air flow through a drying chamber, with modification 4. A—air inlet; B—air outlet; C—additional fan. The arrows indicate the direction of the air flow.
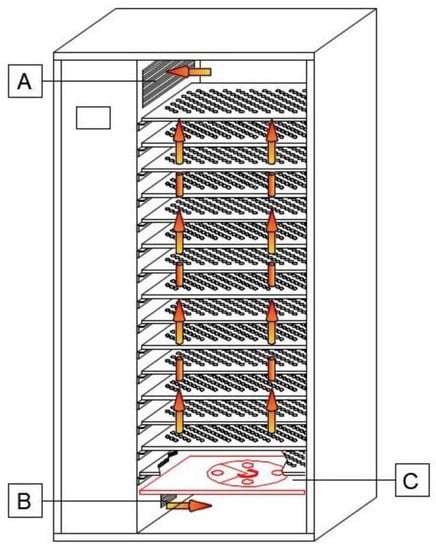
Figure 3.
Diagram of air flow through a drying chamber, with modification 5. A—air inlet; B—air outlet; C—rotating disc. The arrows indicate the direction of the air flow.
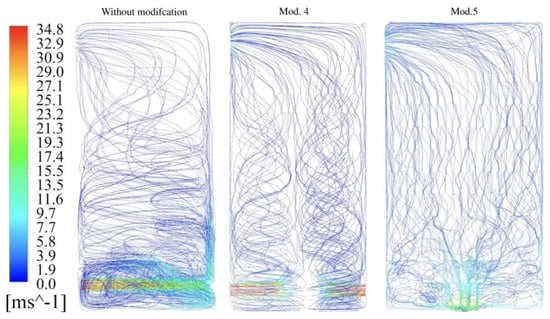
Figure 4.
Visualization of the streamline-comparison of the chamber without modifications with the chamber with modification 4 and 5.
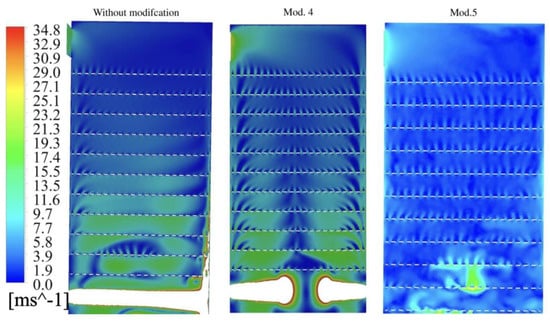
Figure 5.
Velocity field visualization-comparison of 3 chambers.
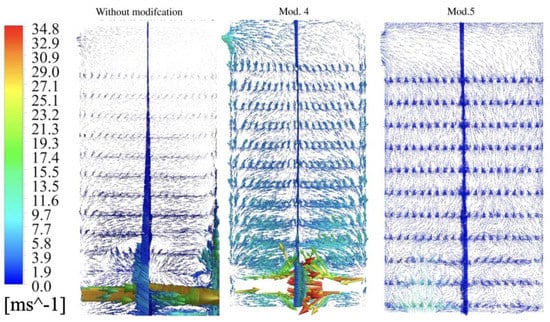
Figure 6.
Visualization of velocity vectors-comparison of 3 chambers.
The visualizations presented in Figure 4, Figure 5 and Figure 6 show the results of CFD (Computer Fluid Dynamics) simulations of the streamline, vector and velocity field. Three chambers are compared: a standard chamber without modification (1), a chamber with modification (4) and a chamber with modification (5). Figure 4 represents the results of modeling the drying medium streamlines for the classic chamber (factory) and with modification 4 and 5.
In the unmodified chamber, the streamlines are very dense in the lower section of the chamber. In the upper section of the chamber, an uneven distribution of streamlines is evident, resulting in a concentration in some areas, while other areas remain empty. A non-uniformity of the streamlines has been observed. Furthermore, horizontal air streams dominate in the lower and middle sections of the standard chamber. In modifications 4 and 5 the streams run horizontally only in the lower section of the chamber, gradually changing direction to vertical, which produces the most favorable distribution of air streams. For modification 5, distribution of streams is the most favorable from the point of view of energy transport inside the chamber. Figure 5 represents the results of modelling the velocity field distributions of the drying medium for the classic (factory) chamber and with modification 4 and 5.
In the unmodified chamber, the highest value of the velocity field is observed in the lower section of the chamber, with the velocity field decreasing as air reaches the trays placed higher in the chamber. A similar pattern is observed in modification (4), but it is apparent that the velocity field in the higher trays has a higher value than in the unmodified chamber. In modification 5, the highest value of the velocity field has been observed adjacent to the openings of the disc through which air is pumped into the chamber by pulsation. In the case of this modification, the velocity field is also most evenly distributed throughout the chamber, irrespective of the height of the trays. Figure 6 represents the results of modelling of velocity vectors of the drying medium for the classic (factory) chamber and with modification 4 and 5.
An analysis of the visualization indicated a highly non-uniform distribution of velocity vectors in the unmodified chamber as well as in the chamber with modification 4. The most uniform distribution of velocity vectors was observed in modification 5, in the case of which velocity vectors have a similar value throughout the chamber.
The conducted CFD simulations of streamlines, velocity fields and velocity vectors revealed that there is a large variation of airflow in the unmodified chamber. The greatest variation of the fields occurs in the middle and upper sections of the chamber, where the values of the streamlines, vectors and velocity fields are significantly smaller than in the lower section of the chamber. CFD simulations have demonstrated that the proposed modifications 4 and 5 can beneficially affect the drying process. For these solutions, the calculated distributions of streamlines, velocity vectors and velocity fields in the entire chamber are more uniform compared to the calculated distributions in the unmodified chamber. Based on the CFD simulations performed, the chamber was upgraded to be structurally identical to the chamber used in simulations 4 and 5. A rotary disc located in the lower section of the chamber 5, directly above the air inlet, and rotating at 50 rpm, by blocking and opening the air distribution ports, introduced a pulsating flow of the medium in the chamber. Thus, a homogeneous distribution of the drying air streams was obtained. Due to the rotational movement of the disc and simultaneous opening and closing of the openings the ports, the movement of air streamlines very similar to the piston movement was obtained, which is the most advantageous in terms of energy and mass transport (Figure 6). The uniform distribution of the velocity field of the drying medium in the chamber 4, and especially in the chamber 5, causes the drying process to be even in the chamber, regardless of the location of the beef billets. The energy charge accumulated in a unit of drying air volume evenly reaches each of the shelves of the chamber, taking the moisture with it, so that the drying curves have a similar shape. At the same time, the even release of moisture from the meat means that there is no need to stop the drying process and move the chunks between the shelves in order to obtain the technologically required moisture content and a low level of water activity. Each opening of the chamber door causes a decrease in the average temperature of the drying medium and increases the energy expenditure necessary to obtain a microbiologically acceptable water content in the meat.
3.2. Examination of Physicochemical Properties
Dried meat was examined to determine its water activity and moisture content. Analyses were performed for meat samples dried in the classic chamber and in the chamber modified to variant IV and variant V. Raw beef haunch (topside) purchased from a local abattoir, cut into strips 7 cm long, 1 cm thick and 1 cm wide, was used in the study (Figure 7). The beef was subjected to physicochemical analyses and the following percentages were found: protein 23%, water 75%, fat 1% and 1% of other organic compounds.
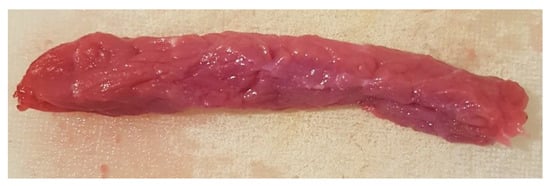
Figure 7.
Raw beef formed into strips before drying.
As mentioned above, beef jerky should be characterized by adequately low values of meat dryness and water activity. Therefore, drying was performed until the mean Aw value of less than 0.75 and moisture content of less than 25% were obtained [9,20].
Samples were taken over a period of 10 h at hourly intervals. The drying temperature was 65 °C, the humidity of the medium (air) introduced into the chamber was 20%. Figure 8 depicts the drying chamber divided into 3 sampling zones. Zone I, located in the lower section of the chamber from where DL and DR samples were taken. Zone II, located in the middle section of the chamber from where ML and MR samples were taken. Zone III, located in the uppermost section of the chamber from where UL and UR samples were taken.
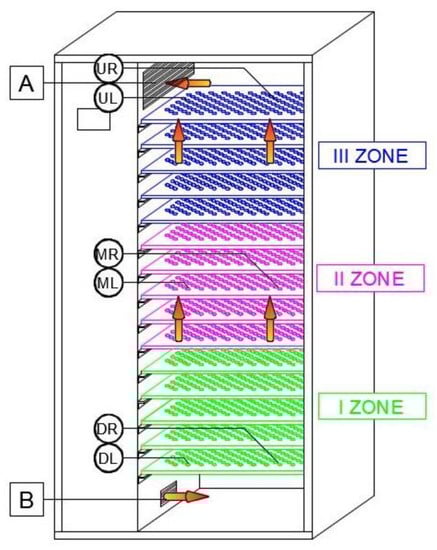
Figure 8.
Diagram of the drying chamber with the sampling points marked. A—air inlet; B—air outlet. The arrows indicate the direction of the air flow. Sampling locations: UL—up left, UR—up right, ML—middle left, MR—middle right, DL—down left, DR—down right.
Dried meat (Figure 9) was tested for Water activity (Wa) as well as for its water content. The principle for determining the water content consists in subjecting the samples to oven drying at 100 °C for 24 h. The water content is determined by calculating the difference between the weights of the test product vessels before and after drying (AOAC methods, 2000). Tests were carried out using an Axis ATS60 moisture analyzer.
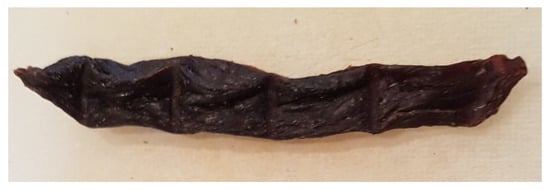
Figure 9.
Dried beef.
Water activity, defined as the ratio of the water vapor pressure above the product surface to the water vapor pressure above the surface of pure water at the same temperature and pressure, was determined using a Rotronic HygroPalm electronic water activity meter (HP23-AW, HC2-AW Rotronic ag., Bassersdorf, Switzerland).
Table 1 presents the results of laboratory tests for three variants of the chamber dryer with heat pump-unmodified chamber (I), chamber with modification 4 and chamber with modification 5. In order to demonstrate the changes in the drying process, the results of water activity (Wa) and water content (Wc) were compared after, respectively: 1 h, 3 h, 6 h, 9 h and after the 10th hour, in which the drying process was completed.
In a standard chamber, differences in water content can be linked to the product placement in the chamber. It can be seen that irrespective of time, there is a significant disproportion between samples taken from the upper left-hand shelf (UL) with the highest water content and samples taken from the lower right-hand shelf (DR) with the lowest water content (Figure 10). The longer the drying time, the more pronounced this disproportion becomes. The greatest difference in product moisture content is seen after 10 h. For the sample taken from UL, the moisture content is more than 11% higher than for the sample taken from DR. Thus, a very significant difference in the degree of meat dryness can be observed depending on the placement in the chamber.
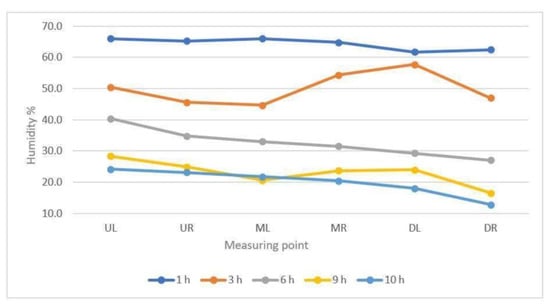
Figure 10.
Change in moisture content of beef samples, taken from different zones in the drying chamber, chamber 1.
As with chamber 4, variation in water content was also noted depending on the placement of the product in the chamber. The most dried items with the lowest water content are located on the bottom shelf (DL and DR), the least dried samples with the highest water content were taken from the top shelves (UL and UR). The differences between the individual samples are not as pronounced as for chamber 1. The average percentage of dryness of the meat in the chamber after 10 h is 22.2% and is higher than in chamber 1 for which it is 20% (Figure 11).
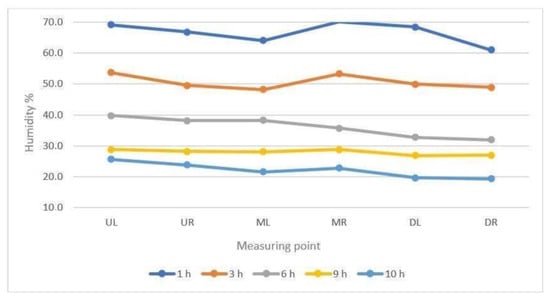
Figure 11.
Changes in moisture content of beef samples taken from different zones of the drying chamber, chamber 4.
In the chamber with the modification 5, the most uniform degree of meat dryness has been confirmed. Minor differences were observed between the water content of products taken from the lower (UL and UR) and upper shelves (UL and UR). Meat samples taken from different locations in the chamber after 10 h showed no significant differences in moisture content. The analyses demonstrate that the difference does not exceed 2%. The sample taken from MR has the highest value of moisture content, at 20%, whereas the sample taken from DR has the lowest, at 18.2% (Figure 12).
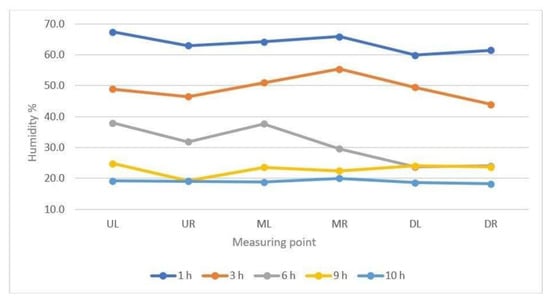
Figure 12.
Changes in moisture content of beef samples taken from different zones of the drying chamber, chamber 5.
Analysis of drying curves for the three selected solutions of the dryer construction are showed in Figure 13, Figure 14, Figure 15 and Figure 16. After 10 h, meat dried in a chamber with modification 5 obtained an average lowest result of 19% water content (Figure 15), while the highest average value of drying products was observed in chamber 4, and was 22%. Figure 16 shows the drying curve in three analyzed chambers.
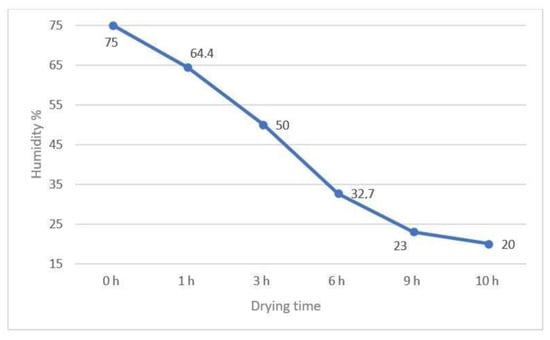
Figure 13.
Drying curve—product moisture in chamber 1.
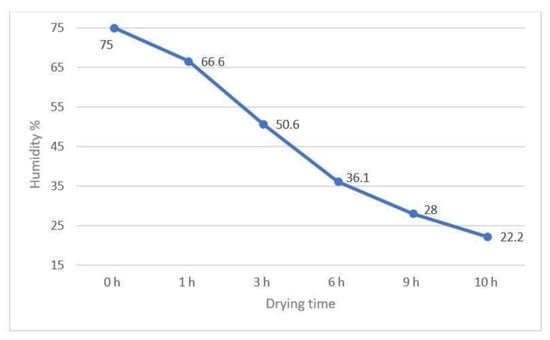
Figure 14.
Drying curve—product moisture in chamber 4.
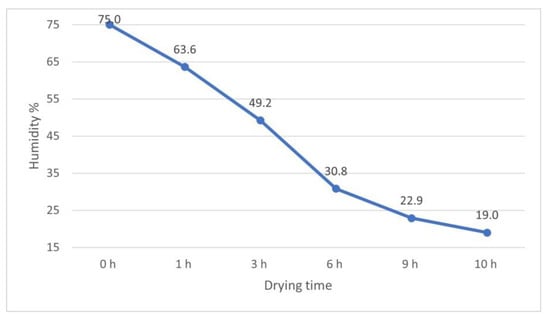
Figure 15.
Drying curve—product moisture in chamber 5.
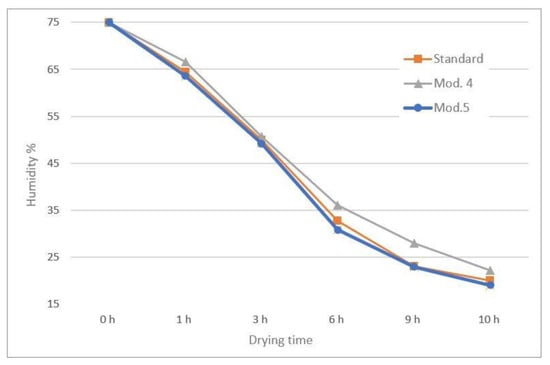
Figure 16.
Drying curve—comparison of average product moisture in analyzed chambers.
Analogous trends were observed in the analysis of drying results in chamber 4. The highest Wa values were found on the upper shelves, while the lowest on the bottom shelves (Figure 17 and Figure 18).
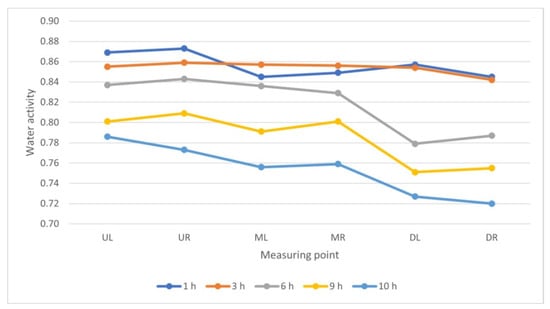
Figure 17.
Comparison of changes of Wa (water activity) in dried beef in chamber 1, taken from different zones of the chamber.
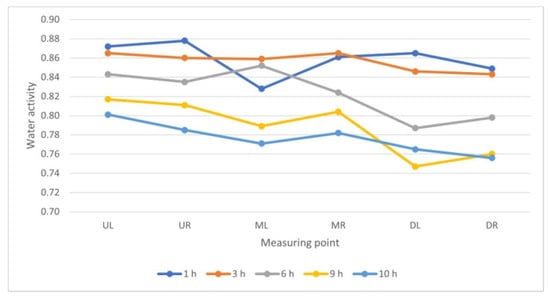
Figure 18.
Comparison of changes in water activity (Wa) of beef samples in chamber 4 depending on sampling location.
Analyses performed on the dryer with the modification 5 showed that the dried beef yielded the most uniform Wa values throughout the chamber, regardless of the sampling location (Table 2 and Figure 19).
Table 2.
Comparison of product moisture and water activity in the tested chambers at selected hours.
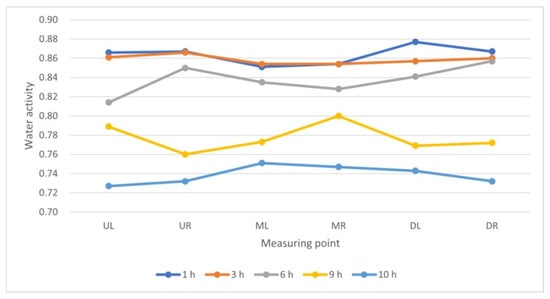
Figure 19.
Comparison of changes in water activity (Wa) of beef samples in chamber 5 depending on sampling location.
Figure 20, Figure 21, Figure 22 and Figure 23 show the average change in water activity for the three analyzed chambers. Comparison of the Wa results shows that after 10 h of the drying process, beef in chamber 5 exhibits the lowest average water activity of 0.739. At the same time, the highest average water activity of 0.777 was observed for the tested samples in chamber 4. The conducted study has proved that the chamber 5 rotary disk convection dryer is advantageous in optimizing the drying process. The most uniform level of meat dryness was achieved in chamber 5, irrespective of the placement of the beef in the chamber.
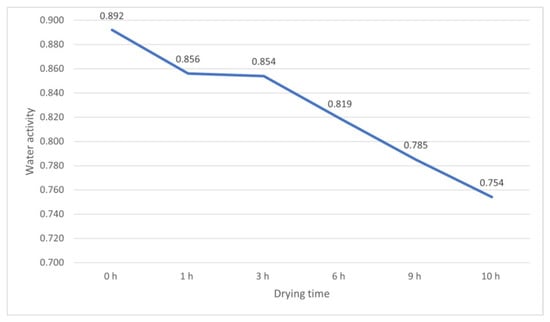
Figure 20.
Drying curve—mean Wa in the chamber 1.
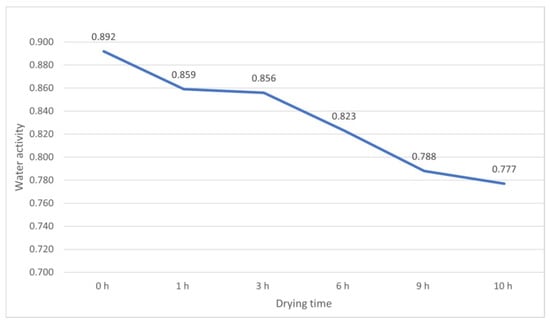
Figure 21.
Drying curve—mean Wa in the chamber 4.
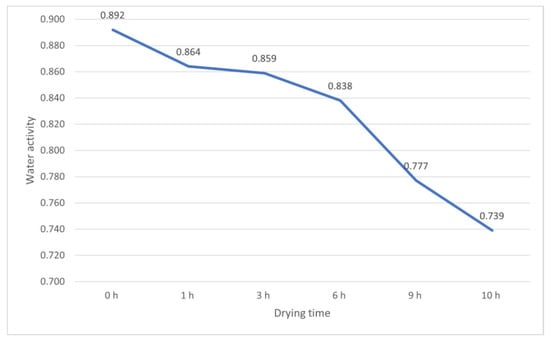
Figure 22.
Drying curve—mean Wa in the chamber 5.
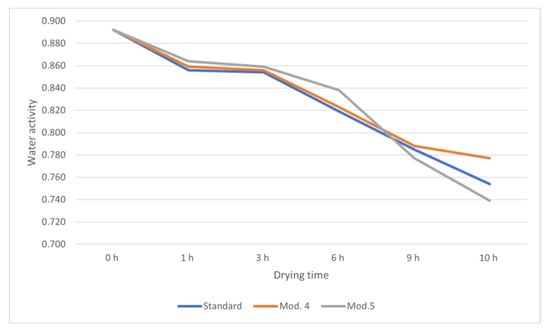
Figure 23.
Comparison of changes in average Wa in different chambers.
4. Conclusions
The introduced modifications to the structure of the drying chamber confirmed the conclusions of other authors dealing with this problem of CFD simulations [44,45,46,47,48]. However, their works focused mainly on simulations of the drying agent flow through the chambers and did not deal with the optimization of the drying process, especially of beef. In view of the conclusions from the simulations performed for the structurally different drying chambers, the following conclusions can be drawn:
- It was found that in drying chambers used in beef processing technologies, non-uniform distribution of drying medium streams leads to a non-uniform degree of meat drying, and depends on the placement in the drying chamber. This leads to the necessity of moving the meat inside the chamber, which prolongs the drying process and increases energy demand.
- Conducting CFD simulations enabled optimization of the drying process, by identifying possible modifications to the design of the drying chamber.
- The best drying results were obtained in chamber 5, in which a disc rotating at 50 rpm was installed at the bottom of the chamber, directly above the air inlet, forcing a pulsating movement of the air stream in the chamber. CFD simulation of this chamber design showed a significant improvement in meat drying, both in terms of activity and water content after 10 h of the process.
Bearing in mind the obtained results, which concerned a chamber with a small capacity (25–50 kg of bach), further research will be carried out on:
- i.
- increasing the capacity of the chamber so that about 200 kg of meat can be dried,
- ii.
- use of heat pump power by renewable energy sources, e.g., solar energy from PV panels.
The second solution will significantly reduce the energy demand to produce a functional, preservative-free snack.
Author Contributions
Conceptualization, T.P.O. and T.M.; methodology, T.M. and T.P.O.; software, P.T.; validation, R.M., T.M. and T.P.O.; formal analysis, T.P.O. and T.M.; investigation, P.T. and T.M.; resources, T.M.; data curation, T.P.O.; writing—original draft preparation, T.P.O. and T.M.; writing—review and editing, T.P.O.; visualization, P.T.; supervision, T.P.O.; project administration, T.P.O. All authors have read and agreed to the published version of the manuscript.
Funding
This research was funded by the “Industrial Doctorate” project implemented at the Faculty of Biotechnology and Food Sciences of the Technical University of Lodz, contract No. 40/DW/2017/01/1, financed in the years 2017–2021 by Ministry of Science and Education.
Institutional Review Board Statement
Not applicable.
Informed Consent Statement
Not applicable.
Data Availability Statement
The data presented in this study are available on request from the corresponding author. The data are not publicly available due to the internal founding research of co-authors in their affiliation places.
Conflicts of Interest
The authors declare no conflict of interest.
Nomenclature
| C:D | prescribed matrices σk turbulent Prandtl numbers for k |
| C0, C1 | empirical coefficients σε turbulent Prandtl numbers for ε |
| Cij | prescribed matrices E total energy |
| Dij | mass diffusion coefficient vi velocity vector |
| ρ | density of fluid vmag velocity magnitude |
| k | turbulent kinetic energy (τij)eff deviatoric stress tensor |
| ε | rate of dissipation p pressure |
| μ | dynamic viscosity Prt Prandtl number |
| μt | turbulent viscosity T temperature |
| Gk | generation of turbulent kinetic energy cp specific heat capacity at constant |
| due to the mean velocity gradients pressure | |
| Gb | generation of turbulent kinetic energy u velocity magnitude in xdirection |
| due to buoyancy t time | |
| YM | contribution of the fluctuating dilatation Sk, Sε, Shuser-defined source terms |
| in compressible turbulence to the overall Si source term for ith momentum | |
| dissipation rate equation | |
| C1ε, C2ε, C3ε | constants used in turbulent model |
References
- Erbay, Z.; Icier, F. A Review of Thin Layer Drying of Foods: Theory, Modeling, and Experimental Results. Crit. Rev. Food Sci. Nutr. 2010, 50, 441–464. [Google Scholar] [CrossRef]
- Calicioglu, M.; Sofos, J.N.; Kendall, P. Fate of acid-adapted and non-adapted Escherichia coli O157:H7 inoculated post-drying on beef jerky treated with marinades before drying. Food Microbiol. 2003, 20, 169–177. [Google Scholar] [CrossRef]
- Cwiertniewski, K.; Polak, E.; Egierski, K. Aktywność wody, parametr trwałości produktów spożywczych (in Polish). Przemysł Spożywczy 2005, 59, 16–19. [Google Scholar]
- Perera, C.O.; Rahman, M.S. Heat pump dehumidifier drying of food. Trends Food Sci. Technol. 1997, 8, 75–79. [Google Scholar] [CrossRef]
- Ojha, K.S.; Granato, D.; Rajuria, G.; Barba, F.J.; Kerry, J.P.; Tiwari, B.K. Application of chemometrics to assess the influence of ultrasound frequency, Lactobacillus sakei culture and drying on beef jerky manufacture: Impact on amino acid profile, organic acids, texture and colour. Food Chem. 2018, 239, 544–550. [Google Scholar] [CrossRef]
- Konieczny, P.; Kowalski, R.; Prycz, J. Wybrane wyróżniki jakościowe suszonych produktów przekąskowych z mięsa wołowego (in-polish). Żywność. Nauka. Technologia. Jakość 2004, 3, 32–39. [Google Scholar]
- Mysakowski, T.; Olejnik, T. The impact of the selected methods of drying beef on the quality of the finished product. Przemysł Spożywczy 2019, 1, 24–28. [Google Scholar] [CrossRef]
- Mohan, V.P.C.; Talukdar, P. Design of an experimental set up for convective drying: Experimental studies at different drying temperature. Heat Mass Transf. 2012, 49, 31–40. [Google Scholar] [CrossRef]
- Chua, K.J.; Chou, S.K.; Yang, W.M. Advances in heat pump systems: A review. Appl. Energy 2010, 87, 3611–3624. [Google Scholar] [CrossRef]
- Margaris, D.P.; Ghiaus, A.-G. Dried product quality improvement by air flow manipulation in tray dryers. J. Food Eng. 2006, 75, 542–550. [Google Scholar] [CrossRef]
- Gaur, A.S.; Fitiwi, D.Z.; Curtis, J. Heat pumps and our low-carbon future: A comprehensive review. Energy Res. Soc. Sci. 2020, 71, 101764. [Google Scholar] [CrossRef]
- Mishra, B.; Mishra, J.; Pati, P.; Rath, P. Dehydrated Meat Products: A Review. Int. J. Livest. Res. 2017, 1. [Google Scholar] [CrossRef]
- Ghasemkhani, H.; Keyhani, A.; Aghbashlo, M.; Rafiee, S.; Mujumdar, A.S. Improving exergetic performance parameters of a rotating-tray air dryer via a simple heat exchanger. Appl. Therm. Eng. 2016, 94, 13–23. [Google Scholar] [CrossRef]
- Hossain, M.A.; Gottschalk, K.; Hassan, M.S. Mathematical model for a heat pump dryer for aromatic plant. Procedia Eng. 2013, 56, 510–520. [Google Scholar] [CrossRef]
- Şevik, S. Experimental investigation of a new design solar-heat pump dryer under the different climatic conditions and drying behavior of selected products. Sol. Energy 2014, 105, 190–205. [Google Scholar] [CrossRef]
- Yang, Z.; Zhu, E.; Zhu, Z.; Wang, J.; Li, S. A comparative study on intermittent heat pump drying process of Chinese cabbage (Brassica campestris L.ssp) seeds. Food Bioprod. Process. 2013, 91, 381–388. [Google Scholar] [CrossRef]
- Fiduccia, K. The Jerky Bible: How to Dry, Cure, and Preserve Beef, Venison, Fish, and Fowl; Skyhorse Publishing: New York, NY, USA, 2015; pp. 24–26. ISBN 13 978-1629145549. [Google Scholar]
- Minea, V. Heat-Pump–Assisted Drying: Recent Technological Advances and R&D Needs. Dry. Technol. 2013, 31, 1177–1189. [Google Scholar] [CrossRef]
- Misha, S.; Mat, S. Review on the Application of a Tray Dryer System for Agricultural Products. World Appl. Sci. J. 2013, 22, 424–433. [Google Scholar] [CrossRef]
- Aktas, M.; Khanlari, A.; Aktekeli, B.; Amini, A. Analysis of a new drying chamber for heat pumpmint leaves dryer. Int. J. Hydrog. Energy 2017, 42, 18034–18044. [Google Scholar] [CrossRef]
- Erbay, Z.; Hepbasli, A. Advanced exergoeconomic evaluation of a heat pump food dryer. Biosyst. Eng. 2014, 124, 29–39. [Google Scholar] [CrossRef]
- Kneule, F. Suszenie; Wyd. Arkady: Warszawa, Poland, 1970; pp. 85–86. [Google Scholar]
- Boruch, M.; Nowakowska, K. Procesy Technologi Żywności; Wydawnictwo Politechniki Łódzkiej: Łódź, Poland, 1996; pp. 40–50. [Google Scholar]
- Skotnicka, E. Przegląd technologii suszenia materiałów sypkich (in polish). Piece Przemysłowe Kotły 2011, 4, 41–44. [Google Scholar]
- Blaszczyk, M.; Heim, A.; Olejnik, T.P. The Effect of wetting on the Course of the Drum Granulation. Chem. Process. Eng. Inz. Chem. Proces. 2017, 38, 331–342. [Google Scholar] [CrossRef][Green Version]
- Erbay, Z.; Hepbasli, A. Advanced Exergy Analysis of a Heat Pump Drying System Used in Food Drying. Dry. Technol. 2013, 31, 802–810. [Google Scholar] [CrossRef]
- Obraniak, A.; Orczykowska, M.; Olejnik, T.P. The effects of viscoelastic properties of the wetting liquid on the kinetics of the disc granulation process. Powder Technol. 2018, 342, 328–334. [Google Scholar] [CrossRef]
- Shi, Q.; Zheng, Y.; Zhao, Y. Mathematical modeling on thin-layer heat pump drying of yacon (Smallanthus sonchifolius) slices. Energy Convers. Manag. 2013, 71, 208–216. [Google Scholar] [CrossRef]
- Misha, S.; Mat, S.; Ruslan, M.H.; Sopian, K.; Salleh, E. The Prediction of Drying Uniformity in Tray Dryer System using CFD Simulation. Int. J. Mach. Learn. Comput. 2013, 3, 419–423. [Google Scholar] [CrossRef]
- Strumiłło, C. Podstawy Teorii i Techniki Suszenia; WNT: Warszawa, Poland, 1975; p. 71. [Google Scholar]
- Hawlader, M.N.A.; Chou, S.K.; Jahangeer, K.A.; Rahman, S.M.A.; Lau, K.W. Solar-assisted heat-pump dryer and water heater. Appl. Energy 2003, 74, 185–193. [Google Scholar] [CrossRef]
- Aktaş, M.; Şevik, S.; Aktekeli, B. Development of heat pump and infrared-convective dryer and performance analysis for stale bread drying. Energy Convers. Manag. 2016, 113, 82–94. [Google Scholar] [CrossRef]
- Boetticher, T.; Miller, T. Jerky: The Fatted Calf’s Guide to Preserving and Cooking Dried Meaty Goods; Random House USA Inc.: New York, NY, USA, 2018; pp. 20–21. ISBN 10:1524759023. [Google Scholar]
- Ahmat, T.; Barka, M.; Aregba, A.-W.; Bruneau, D. Convective Drying Kinetics of Fresh Beef: An Experimental and Modeling Approach. J. Food Process. Preserv. 2015, 39, 2581–2595. [Google Scholar] [CrossRef]
- Gomez, M.A.D.; Velasco, C.A.G.; Ratkovich, N.; Daza, J.C.G. Numerical Analysis of a Convective Drying Chamber from Drying Air Velocity and Temperature Perspective. In Proceedings of the 3rd World Congress on Momentum, Heat and Mass Transfer, Budapest, Hungary, 12–14 April 2018. [Google Scholar]
- Mirage, P.S. Prediction of the air velocity field in modern meat dryersusing unsteady computational fluid dynamics (CFD) models. J. Food Eng. 2003, 60, 41–48. [Google Scholar]
- Wilcox, D.C. Turbulence Modeling for CFD, 3rd ed.; DCW Industries: La Canada, CA, USA, 2006; ISBN 1928729088. [Google Scholar]
- ANSYS Inc. ANSYS Fluent Theory Guide; Release 15.0; ANSYS Inc.: Canonsburg, PA, USA, 2013; pp. 51–57. [Google Scholar]
- Sosnowski, M.; Krzywanski, J.; Gnatowska, R. Polyhedral meshing as an innovative approach to computational domain dis-cretization of a cyclone in a fluidized bed CLC unit. In APISAT 2019: Asia Pacific International Symposium on Aerospace Technology; Engineers Australia: Barton, Australia, 2018; Volume 180, p. 227. [Google Scholar]
- Misha, S.; Sohif, M.; Afzanizam Mohd Rosli, M.; Ruslan, M.H.; Bin Sopian, K.; Salleh, E. Simulation of Air Flow Distribution in a Tray Dryer by CFD, Recent Advances in Renewable Energy Sources, WSEAS. In Proceedings of the 9th International Conference on Renewable Energy Sources (RES’ 15), Kuala Lumpur, Malaysia, 23–25 April 2015. [Google Scholar]
- Misha, S.; Mat, S.; Ruslan, M.H.; Sopian, K.; Salleh, E. The CFD Simulation of Tray Dryer Design for Kenaf Core Drying. Appl. Mech. Mater. 2013, 393, 717–722. [Google Scholar] [CrossRef]
- Norton, T.; Sun, D.W. Computational fluid dynamics (CFD)—An effective and efficient design and analysis tool for the food industry: A review. Trends Food Sci. Technol. 2006, 17, 600–620. [Google Scholar] [CrossRef]
- Gavrila, C.; Ghiaus, A.G.; Gruia, I. Heat and Mass Transfer in Convective Drying Processes. In Proceedings of the COMSOL Conference, Hannover, Germany, 4–6 November 2008. [Google Scholar]
- Mathioulakis, E.; Karathanos, V.; Belessiotis, V. Simulation of air movement in a dryer by computational fluid dynamics: Application for the drying of fruits. J. Food Eng. 1998, 36, 183–200. [Google Scholar] [CrossRef]
- Slama, M.; Bex, C.C.; Pinon, G.; Togneri, M.; Evans, I. Lagrangian Vortex Computations of a Four Tidal Turbine Array: An Example Based on the NEPTHYD Layout in the Alderney Race. Energies 2021, 14, 3826. [Google Scholar] [CrossRef]
- Choi, S.K.; Choi, Y.S.; Jeong, Y.W.; Han, S.Y.; Van Nguyen, Q. Simulation of the Fast Pyrolysis of Coffee Ground in a Tilted-Slide Reactor. Energies 2020, 13, 6605. [Google Scholar] [CrossRef]
- De Oliveira, M.A.; De Moraes, P.G.; De Andrade, C.L.; Bimbato, A.M.; Pereira, L.A.A. Control and Suppression of Vortex Shedding from a Slightly Rough Circular Cylinder by a Discrete Vortex Method. Energies 2020, 13, 4481. [Google Scholar] [CrossRef]
- Jarrin, N.; Benhamadouche, S.; Laurence, D.; Prosser, R. A synthetic-eddy-method for generating inflow conditions for large-eddy simulations. Int. J. Heat Fluid Flow 2006, 27, 585–593. [Google Scholar] [CrossRef]
Publisher’s Note: MDPI stays neutral with regard to jurisdictional claims in published maps and institutional affiliations. |
© 2021 by the authors. Licensee MDPI, Basel, Switzerland. This article is an open access article distributed under the terms and conditions of the Creative Commons Attribution (CC BY) license (https://creativecommons.org/licenses/by/4.0/).