
Datafication Process in the Concept of Smart Cities


Abstract
:1. Introduction
2. Literature Review
3. Materials and Methods
4. Results and Discussion
5. Conclusions
Funding
Institutional Review Board Statement
Informed Consent Statement
Data Availability Statement
Acknowledgments
Conflicts of Interest
Appendix A

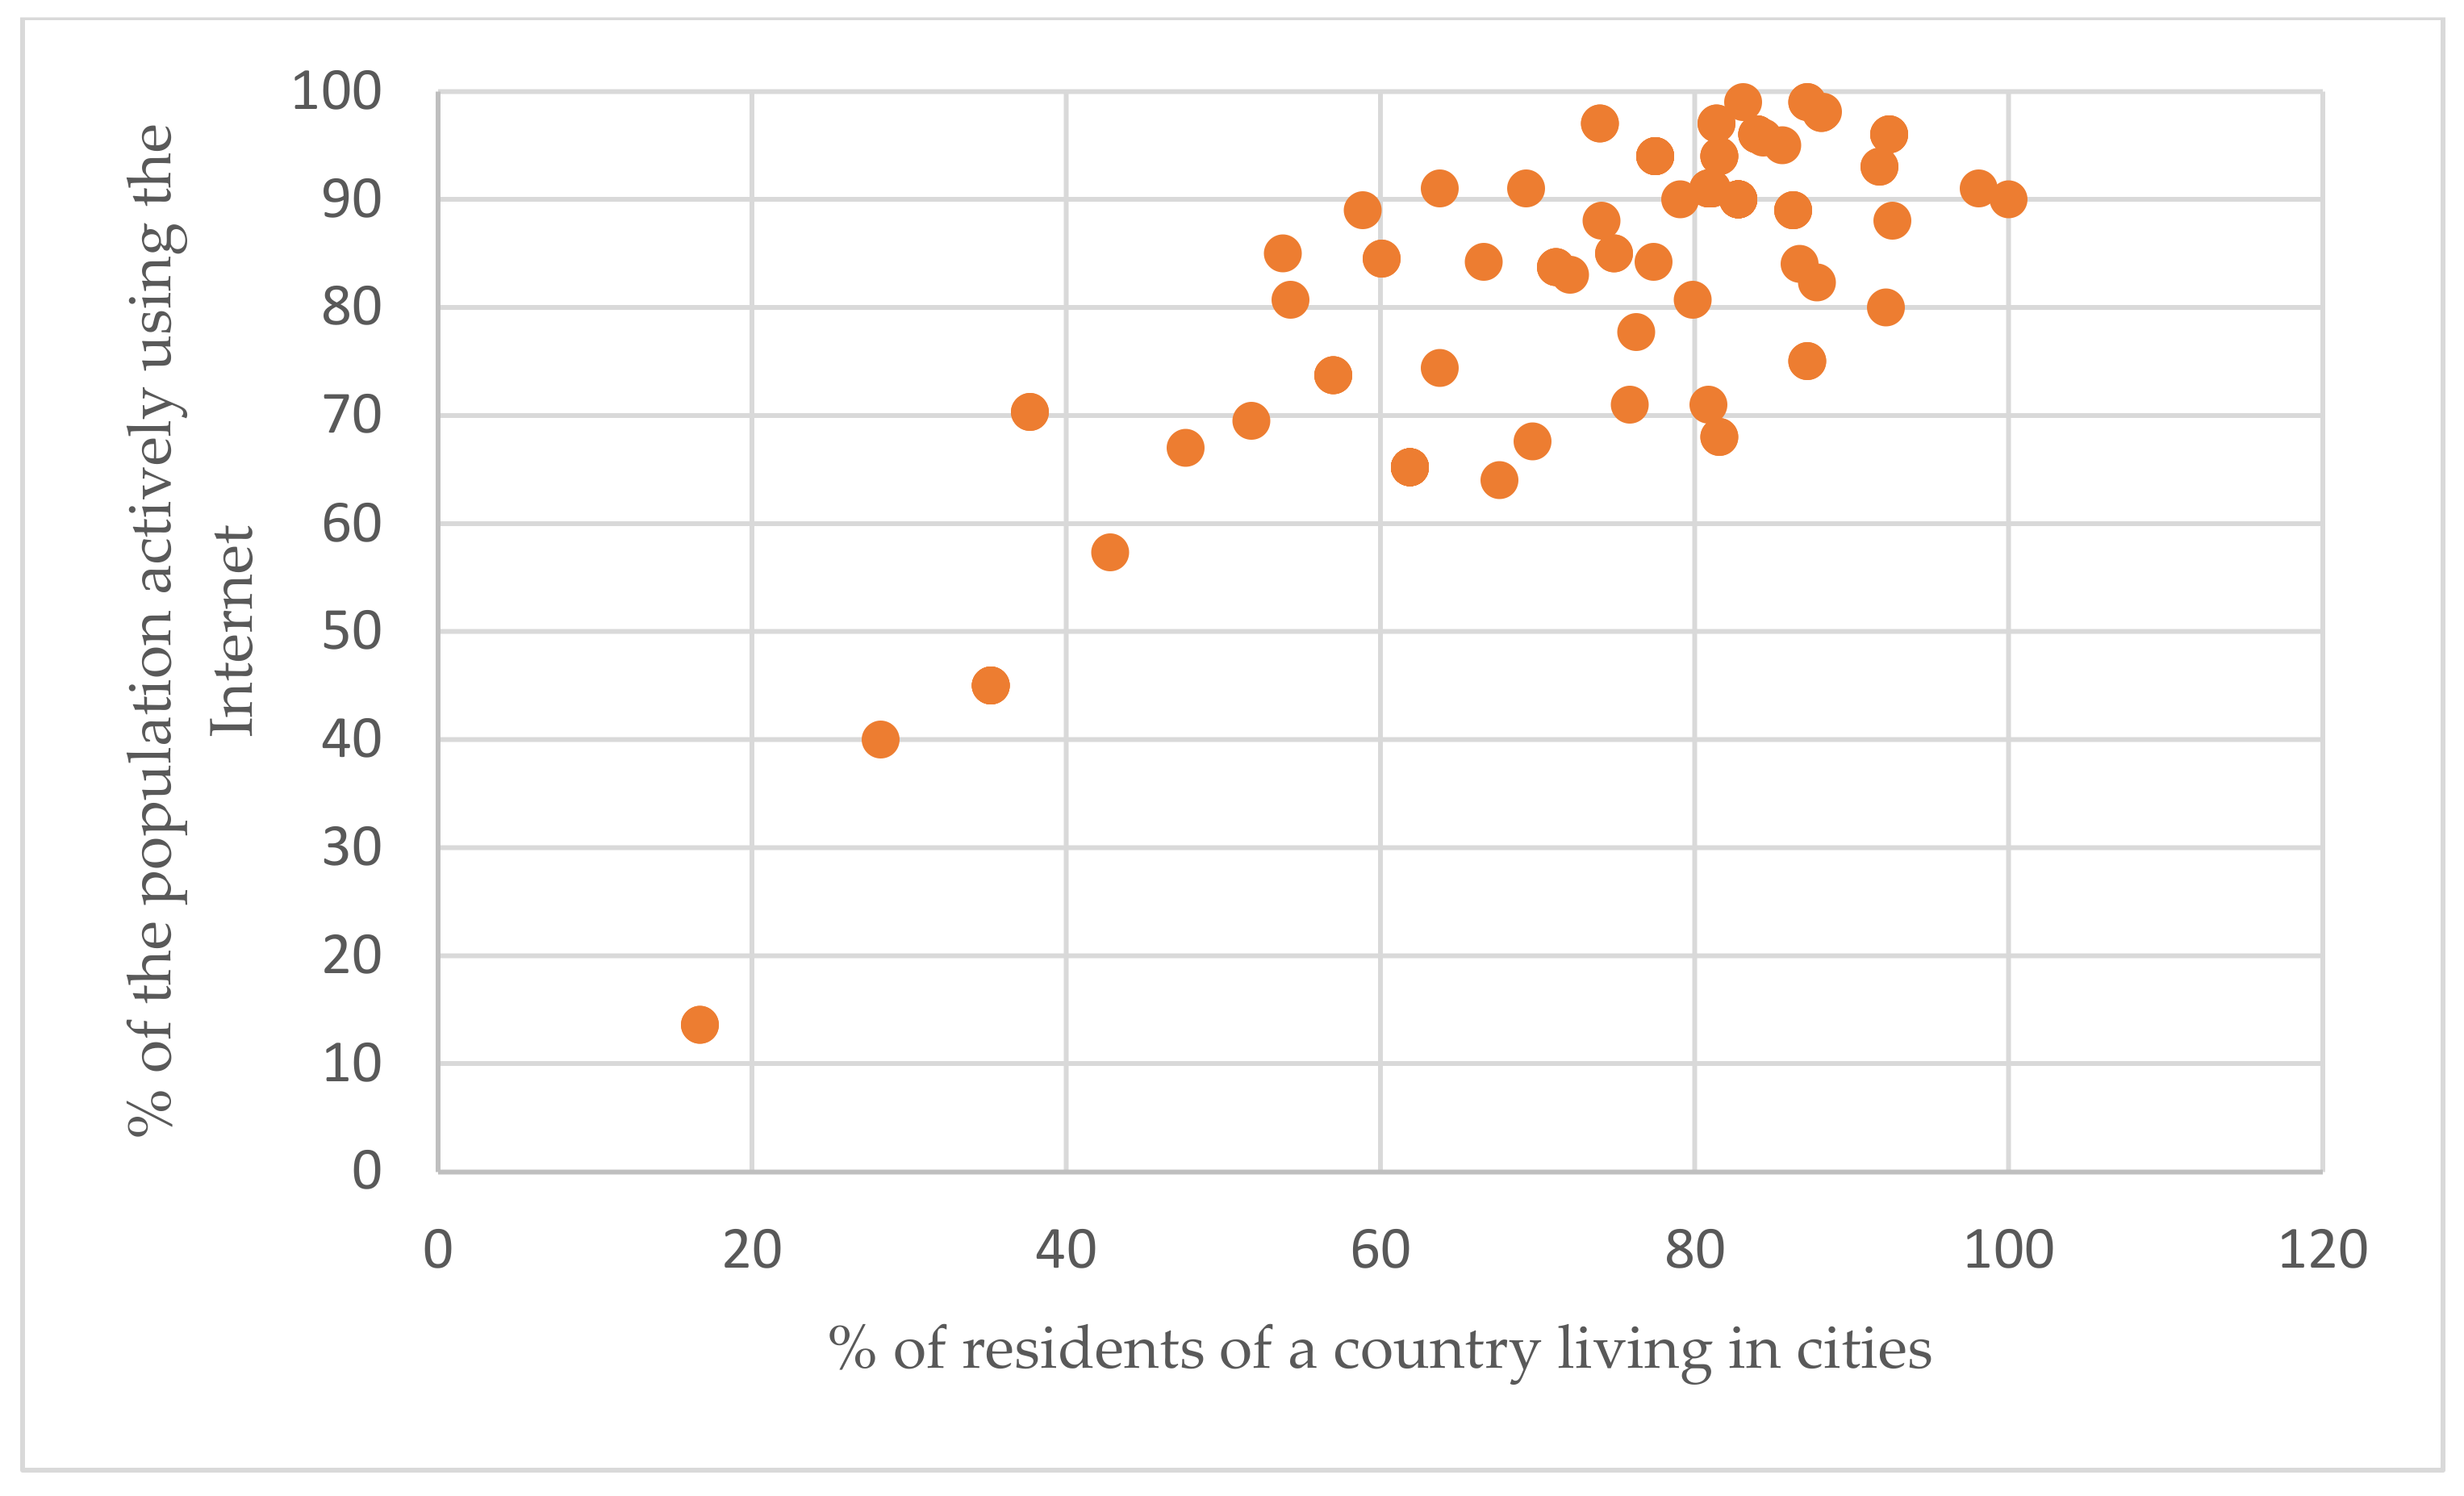
| No. | Smart City | Rating | Country | Continent | Percentage of Citizens of the Country Who: | ||
|---|---|---|---|---|---|---|---|
| Live In Cities | Use Internet | Use Social Media | |||||
| 1 | Singapore | AAA | Singapore | Asia | 100 | 90 | 84.4 |
| 2 | Helsinki | AA | Finlandia | Europe | 85.6 | 95 | 80.4 |
| 3 | Zurich | AA | Switzerland | Europe | 74 | 97 | 81.8 |
| 4 | Auckland | AA | New Zeeland | Oceania | 86.7 | 84 | 82 |
| 5 | Oslo | AA | Norway | Europe | 83.1 | 99 | 83.2 |
| 6 | Copenhagen | AA | Denmark | Europe | 88.2 | 98.1 | 83.6 |
| 7 | Geneva | AA | Switzerland | Europe | 74 | 97 | 81.8 |
| 8 | Taipei City | A | Taiwan | Asia | 79.1 | 90 | 82.6 |
| 9 | Amsterdam | A | The Netherland | Europe | 92.4 | 96 | 88 |
| 10 | New York | A | USA | North America | 82.8 | 90 | 72.3 |
| 11 | Munich | A | Germany | Europe | 77.5 | 94 | 78.7 |
| 12 | Washington D.C. | A | USA | North America | 82.8 | 90 | 72.3 |
| 13 | Dusseldorf | A | Germany | Europe | 77.5 | 94 | 78.7 |
| 14 | Brisbane | A | Australia | Oceania | 86.3 | 89 | 79.9 |
| 15 | London | A | England | Europe | 84 | 96 | 77.9 |
| 16 | Stockholm | A | Sweden | Europe | 88.1 | 98 | 82.1 |
| 17 | Manchester | A | England | Europe | 84 | 96 | 77.9 |
| 18 | Sydney | A | Australia | Oceania | 86.3 | 89 | 79.9 |
| 19 | Vancouver | A | Canada | North America | 81.6 | 94 | 84.9 |
| 20 | Melbourne | A | Australia | Oceania | 86.3 | 89 | 79.9 |
| 21 | Montreal | A | Canada | North America | 81.6 | 94 | 84.9 |
| 22 | Hamburg | A | Germany | Europe | 77.5 | 94 | 78.7 |
| 23 | Newcastle | A | England | Europe | 84 | 96 | 77.9 |
| 24 | Bilbao | BBB | Spain | Europe | 80.9 | 91 | 80 |
| 25 | Vienna | BBB | Austria | Europe | 58.9 | 89 | 79.9 |
| 26 | Los Angeles | BBB | USA | North America | 82.8 | 90 | 72.3 |
| 27 | San Francisco | BBB | USA | North America | 82.8 | 90 | 72.3 |
| 28 | The Hague | BBB | The Netherland | Europe | 92.4 | 96 | 88 |
| 29 | Rotterdam | BBB | The Netherland | Europe | 92.4 | 96 | 88 |
| 30 | Toronto | BBB | Canada | North America | 81.6 | 94 | 84.9 |
| 31 | Gothenburg | BBB | Sweden | Europe | 88.1 | 98 | 82.1 |
| 32 | Hong Kong | BBB | China | Asia | 61.9 | 65.2 | 64.6 |
| 33 | Hanover | BBB | Germany | Europe | 77.5 | 94 | 78.7 |
| 34 | Dublin | BBB | Ireland | Europe | 63.8 | 91 | 76.4 |
| 35 | Denver | BBB | USA | North America | 82.8 | 90 | 72.3 |
| 36 | Boston | BBB | USA | North America | 82.8 | 90 | 72.3 |
| 37 | Seattle | BBB | USA | North America | 82.8 | 90 | 72.3 |
| 38 | Berlin | BBB | Germany | Europe | 77.5 | 94 | 78.7 |
| 39 | Phoenix | BBB | USA | North America | 82.8 | 90 | 72.3 |
| 40 | Birmingham | BBB | England | Europe | 84 | 96 | 77.9 |
| 41 | Chicago | BBB | USA | North America | 82.8 | 90 | 72.3 |
| 42 | Abu Dhabi | BB | The United Arab Emirates | Asia | 87.2 | 99 | 99 |
| 43 | Dubai | BB | The United Arab Emirates | Asia | 87.2 | 99 | 99 |
| 44 | Prague | BB | Czechia | Europe | 74.1 | 88 | 69 |
| 45 | Madrid | BB | Spain | Europe | 80.9 | 91 | 80 |
| 46 | Busan | BB | South Korea | Asia | 81.4 | 97 | 89.3 |
| 47 | Seoul | BB | South Korea | Asia | 81.4 | 97 | 89.3 |
| 48 | Zaragoza | BB | Spain | Europe | 80.9 | 91 | 80 |
| 49 | Barcelona | BB | Spain | Europe | 80.9 | 91 | 80 |
| 50 | Tel Aviv | BB | Israel | Asia | 92.6 | 88 | 78.1 |
| 51 | Lyon | BB | France | Europe | 81.1 | 91 | 75.9 |
| 52 | Philadelphia | BB | USA | North America | 82.8 | 90 | 72.3 |
| 53 | Riyadh | B | Saudi Arabia | Asia | 84.4 | 95.7 | 79.3 |
| 54 | Kuala Lumpur | B | Malesia | Asia | 77.4 | 84.2 | 86 |
| 55 | Warsaw | B | Poland | Europe | 60.1 | 84.5 | 68.5 |
| 56 | Moscow | B | Russia | Europe | 74.9 | 85 | 67.8 |
| 57 | Ankara | B | Turkey | Asia | 76.3 | 77.7 | 70.8 |
| 58 | Krakow | B | Poland | Europe | 60.1 | 84,5 | 68.5 |
| 59 | Tallinn | B | Estonia | Europe | 69.3 | 91 | 74.4 |
| 60 | Brussels | B | Belgium | Europe | 98.1 | 91 | 76 |
| 61 | Paris | B | France | Europe | 81.1 | 91 | 75.9 |
| 62 | Zhuhai | CCC | China | Asia | 61.9 | 65.2 | 64.6 |
| 63 | Tianjin | CCC | China | Asia | 61.9 | 65.2 | 64.6 |
| 64 | Chongqing | CCC | China | Asia | 61.9 | 65.2 | 64.6 |
| 65 | Hangzhou | CCC | China | Asia | 61.9 | 65.2 | 64.6 |
| 66 | Nanjing | CCC | China | Asia | 61.9 | 65.2 | 64.6 |
| 67 | Shenzhen | CCC | China | Asia | 61.9 | 65.2 | 64.6 |
| 68 | Guangzhou | CCC | China | Asia | 61.9 | 65.2 | 64.6 |
| 69 | Chengdu | CCC | China | Asia | 61.9 | 65.2 | 64.6 |
| 70 | Bologna | CCC | Italy | Europe | 71.2 | 83.7 | 67.9 |
| 71 | Bangkok | CCC | Thailand | Asia | 51.8 | 69.5 | 78.7 |
| 72 | Medellin | CCC | Colombia | South America | 81.6 | 68 | 76.4 |
| 73 | St. Petersburg | CCC | Russia | Europe | 74.9 | 85 | 67.8 |
| 74 | Milan | CCC | Italy | Europe | 71.2 | 83.7 | 67.9 |
| 75 | Lisbon | CCC | Portugal | Europe | 66.6 | 84.2 | 76.6 |
| 76 | Bratislava | CCC | Slovakia | Europe | 53.8 | 85 | 73.8 |
| 77 | Budapest | CCC | Hungary | Europe | 72.1 | 83 | 73.5 |
| 78 | Marseille | CCC | France | Europe | 81.1 | 91 | 75.9 |
| 79 | Tokyo | CCC | Japan | Asia | 91.8 | 93 | 74.3 |
| 80 | Osaka | CCC | Japan | Asia | 91.8 | 93 | 74.3 |
| 81 | Shanghai | CC | China | Asia | 61.9 | 65.2 | 64.6 |
| 82 | Beijing | CC | China | Asia | 61.9 | 65.2 | 64.6 |
| 83 | Ho Chi Minh City | CC | Vietnam | Asia | 37.7 | 70.3 | 73.7 |
| 84 | Hanoi | CC | Vietnam | Asia | 37.7 | 70.3 | 73.7 |
| 85 | Hyderabad | CC | India | Asia | 35.2 | 45 | 32.3 |
| 86 | New Delhi | CC | India | Asia | 35.2 | 45 | 32.3 |
| 87 | Bucharest | CC | Romania | Europe | 54.3 | 80.7 | 62.6 |
| 88 | Buenos Aires | CC | Argentina | South America | 92.2 | 80 | 79.3 |
| 89 | Sofia | CC | Bulgaria | Europe | 75.9 | 71 | 62.1 |
| 90 | Mexico City | CC | Mexico | North America | 80.9 | 71 | 77.2 |
| 91 | Santiago | CC | Chile | South America | 87.8 | 82.3 | 83.5 |
| 92 | Bogota | CC | Colombia | South America | 81.6 | 68 | 76.4 |
| 93 | Mumbai | C | India | Asia | 35.2 | 45 | 32.3 |
| 94 | Jakarta | C | Indonesia | Asia | 57 | 73.7 | 61.8 |
| 95 | Bengaluru | C | India | Asia | 35.2 | 45 | 32.3 |
| 96 | Makassar | C | Indonesia | Asia | 57 | 73.7 | 61.8 |
| 97 | Medan | C | Indonesia | Asia | 57 | 73.7 | 61.8 |
| 98 | Kiev | C | Ukraine | Europe | 69.7 | 67.6 | 58.9 |
| 99 | Athens | C | Greece | Europe | 79.9 | 80.7 | 71.2 |
| 100 | Sao Paulo | C | Brazil | South America | 87.2 | 75 | 70.3 |
| 101 | Rome | C | Italy | Europe | 71.2 | 83.7 | 67.9 |
| 102 | Rio de Janeiro | C | Brazil | South America | 87.2 | 75 | 70.3 |
| 103 | Cape Town | D | South Africa | Africa | 67.6 | 64 | 41.9 |
| 104 | Manila | D | Philippines | Asia | 47.6 | 67 | 80.7 |
| 105 | Rabat | D | Morocco | Africa | 63.8 | 74.4 | 59.3 |
| 106 | Cairo | D | Egypt | Africa | 42.8 | 57.3 | 47.4 |
| 107 | Abuja | D | Nigeria | Africa | 16.7 | 13.6 | 2.4 |
| 108 | Nairobi | D | Kenya | Africa | 28.2 | 40 | 20.2 |
| 109 | Lagos | D | Nigeria | Africa | 16.7 | 13.6 | 2.4 |
References
- Gartner Glossary: Digitization. 2021. Available online: https://www.gartner.com/en/information-technology/glossary/digitization (accessed on 24 May 2021).
- Digitization, Digitalization, and Digital Transformation: Confuse Them at Your Peril. 2018. Available online: https://www.forbes.com/sites/jasonbloomberg/2018/04/29/digitization-digitalization-and-digital-transformation-confuse-them-at-your-peril/?sh=328f65b72f2c (accessed on 24 May 2021).
- Gartner Glossary: Digitalization. 2021. Available online: https://www.gartner.com/en/information-technology/glossary/digitalization (accessed on 24 May 2021).
- Śledziewska, K.; Włoch, R. Digital Economy. How New Technologies Are Changing the World (Gospodarka Cyfrowa. Jak Nowe Technologie Zmieniają Świat); Wydawnictwo Uniwersytetu Warszawskiego: Warsaw, Poland, 2020. [Google Scholar]
- Sinfonia-Smartcities.eu. Available online: http://www.sinfonia-smartcities.eu/contents/knowledgecenterfiles/sinfonia_d21_swot-analysis-report-of-the-refined-concept-baseline.pdf (accessed on 4 August 2021).
- Lazaroiu, G.C.; Roscia, M. Definition methodology for the smart cities model. Energy 2012, 47, 326–332. [Google Scholar] [CrossRef]
- Mejias, U.A.; Couldry, N. Datafication. Internet Policy Rev. 2019, 8, 1–10. [Google Scholar] [CrossRef]
- Maull, R.; Godsiff, P.; Mulligan, C.E. The impact of datafication on service systems. In Proceedings of the 47th Hawaii International Conference on System Sciences, Waikoloa, HI, USA, 6–9 January 2014. [Google Scholar]
- Ruckenstein, M.; Schüll, N. The datafication of health. Annu. Rev. Anthropol. 2017, 46, 261–278. [Google Scholar] [CrossRef] [Green Version]
- Sadowski, J. When data is capital: Datafication, accumulation, and extraction. Big Data Soc. 2019, 6. [Google Scholar] [CrossRef] [Green Version]
- Williamson, B. Datafication of Education: A Critical Approach to Emerging Analytics Technologies and Practices; Routledge: London, UK, 2019. [Google Scholar]
- Bélissent, J. Getting Clever about Smart Cities: New Opportunities Require New Business Models; Forrester: Cambridge, MA, USA, 2010; Volume 193, pp. 244–277. [Google Scholar]
- Zuccalà, M.; Verga, E.S. Enabling energy smart cities through urban sharing ecosystems. Energy Procedia 2017, 111, 826–835. [Google Scholar] [CrossRef]
- Gomede, E.; Gaffo, F.H.; Briganó, G.U.; De Barros, R.M.; Mendes, L.D.S. Application of computational intelligence to improve education in smart cities. Sensors 2018, 18, 267. [Google Scholar] [CrossRef] [Green Version]
- Rocha, N.P.; Dias, A.; Santinha, G.; Rodrigues, C.; Queirós, A. Smart cities and healthcare: A systematic review. Technology 2019, 7, 58. [Google Scholar] [CrossRef] [Green Version]
- Hajduk, S.; Jelonek, D. A decision-making approach based on TOPSIS method for ranking smart cities in the context of urban energy. Energies 2021, 14, 2691. [Google Scholar] [CrossRef]
- Calvillo, C.; Sánchez-Miralles, A.; Villar, J. Energy management and planning in smart cities. Renew. Sustain. Energy Rev. 2016, 55, 273–287. [Google Scholar] [CrossRef] [Green Version]
- Bibri, S.E. The anatomy of the data-driven smart sustainable city: Instrumentation, datafication, computerization and related applications. J. Big Data 2019, 6, 59. [Google Scholar] [CrossRef] [Green Version]
- Calvo, P. The ethics of Smart City (EoSC): Moral implications of hyperconnectivity, algorithmization and the datafication of urban digital society. Ethics Inf. Technol. 2019, 22, 141–149. [Google Scholar] [CrossRef]
- Gray, J.; Rumpe, B. Models for digitalization. Softw. Syst. Modeling 2015, 1319–1320. [Google Scholar] [CrossRef] [Green Version]
- Moseley, D.; Higgins, S.; Bramald, R. Ways Forward with ICT: Effective Pedagogy Using Information and Communications Technology for Literacy and Numeracy in Primary Schools; Durham University Press: Durham, UK, 1999. [Google Scholar]
- Williams, D.; Coles, L.; Wilson, K.; Richardson, A.; Tuson, J. Teachers and ICT: Current use and future needs. Br. J. Educ. Technol. 2000, 31, 307–320. [Google Scholar] [CrossRef]
- Hakkarainen, K.; Ilomäki, L.; Lipponen, L.; Muukkonen, H.; Rahikainen, M.; Tuominen, T.; Lakkala, M.; Lehtinen, E. Students’ skills and practices of using ICT: Results of a national assessment in Finland. Comput. Educ. 2000, 34, 103–117. [Google Scholar] [CrossRef]
- Danziger, J.N.; Jennings, J.S.; Yee, E. Enhancing End Users’ ICT Skills in the New Economy; University of California: Los Angeles, CA, USA, 2000. [Google Scholar]
- Wang, E.H.-H. ICT and economic development in Taiwan: Analysis of the evidence. Telecommun. Policy 1999, 23, 235–243. [Google Scholar] [CrossRef]
- Christiaanse, E.; Kumar, K. ICT-enabled coordination of dynamic supply webs. Int. J. Phys. Distrib. Logist. Manag. 2000, 30, 268–285. [Google Scholar] [CrossRef]
- Howells, J.R. Going global: The use of ICT networks in research and development. Res. Policy 1995, 24, 169–184. [Google Scholar] [CrossRef]
- Werthner, H.; Klein, S.; Werthner, S.K.H. ICT and the changing landscape of global tourism distribution. Electron. Mark. 1999, 9, 256–262. [Google Scholar] [CrossRef]
- Haddon, L. Explaining ICT consumption: The case of the home computer. In Consuming Technologies: Media and Information in Domestic Spaces; Silverstone, R., Hirsch, E., Eds.; Routledge: London, UK, 1992. [Google Scholar]
- McKnight, L.W.; Bailey, J.P. Internet Economics; MIT Press: Cambridge, MA, USA, 1998. [Google Scholar]
- Harris, C.; Straker, L. Survey of physical ergonomics issues associated with school childrens’ use of laptop computers. Int. J. Ind. Ergon. 2000, 26, 337–346. [Google Scholar] [CrossRef]
- Falaki, H.; Mahajan, R.; Kandula, S. Diversity in smartphone usage. In Proceedings of the 8th International Conference on Mobile Systems, Applications, and Services, San Francisco, CA, USA, 15–18 June 2010. [Google Scholar]
- Carroll, A.; Heiser, G. An analysis of power consumption in a smartphone. In Proceedings of the 2010 USENIX Annual Technical Conference, Boston, MA, USA, 23–25 June 2010; p. 21. [Google Scholar]
- Mai, J.-E. Big data privacy: The datafication of personal information. Inf. Soc. 2016, 32, 192–199. [Google Scholar] [CrossRef] [Green Version]
- Kaziunas, E.; Ackerman, M.; Lindtner, S. Caring through data: Attending to the social and emotional experience of health datafication. In Proceedings of the 2017 ACM Conference on Computer Supported Cooperative Work and Social Computing, Portland, OR, USA, 25 February–1 March 2017. [Google Scholar]
- Selwyn, N.; Gašević, D. The datafication of higher education: Discussing the promises and problems. Teach. High. Educ. 2020, 25, 527–540. [Google Scholar] [CrossRef]
- Nahirny, R. Love in the time of post-truth (Miłość w czasach postprawdy). Teksty Drugie 2019, 5, 155–165. [Google Scholar]
- Lupton, D.; Williamson, B. The datafied child: The dataveillance of children and implications for their rights. New Media Soc. 2017, 19, 780–794. [Google Scholar] [CrossRef]
- Who Knows What About Me. 2021. Available online: https://www.childrenscommissioner.gov.uk/digital/who-knows-what-about-me/ (accessed on 24 May 2021).
- What Happens in an Internet Minute in 2021: 88 Fascinating Online Stats. 2021. Available online: https://localiq.com/blog/what-happens-in-an-internet-minute-2021/ (accessed on 25 May 2021).
- Huang, W.-J. ICT-oriented urban planning strategies: A case study of Taipei City, Taiwan. J. Urban Technol. 2012, 19, 41–61. [Google Scholar] [CrossRef]
- Bifulco, F.; Tregua, M.; Amitrano, C.C.; D’Auria, A. ICT and sustainability in smart cities management. Int. J. Public Sect. Manag. 2016, 29, 132–147. [Google Scholar] [CrossRef]
- World Population. 2021. Available online: www.worldometers.info (accessed on 25 May 2021).
- Digital 2021 Local Country Headlines. 2021. Available online: https://datareportal.com/reports/digital-2021-local-country-headlines (accessed on 25 May 2021).
- Horbaty, R. Smart cities. European Energy Award 2013 (Intelligente Vernetzung Kommunaler Infrastruktur. Energie Schweiz 2013). In Smart Sustainable Cities: An Analysis of Definition; ITU-T Focus Group on Smart Sustainable Cities: Geneva, Switzerland, 2014. [Google Scholar]
- Stępniak, C.; Jelonek, D.; Wyrwicka, M.; Chomiak-Orsa, I. Integration of the infrastructure of system used in smart cities for the planning of transport and communication system in cities. Energies 2021, 14, 3069. [Google Scholar] [CrossRef]
- Nesmachnow, S.; Hernández-Callejo, L. CITIES: Ibero-American research network for sustainable, efficient, and integrated smart cities. Smart Cities 2020, 3, 38. [Google Scholar] [CrossRef]
- Molnar, A. Smart cities education: An insight into existing drawbacks. Telemat. Inform. 2020, 57, 101509. [Google Scholar] [CrossRef]
- Casino, F.; Patsakis, C.; Batista, E.; Borras, F.; Martinez-Balleste, A. Healthy routes in the smart city: A context-aware mobile recommender. IEEE Softw. 2017, 34, 42–47. [Google Scholar] [CrossRef]
- Saleh, Y. ICT, social media and COVID-19: Evidence from informal home-based business community in Kuwait City. J. Enterprising Communities People Places Glob. Econ. 2020, 15, 395–413. [Google Scholar] [CrossRef]
- Brindha, M.D.; Jayaseelan, R.; Kadeswara, S. Social media reigned by information or misinformation about COVID-19: A phenomenological study. Alochana Chakra J. 2020, 9, 585–602. [Google Scholar]
- Yang, S.; Fichman, P.; Zhu, X.; Sanfilippo, M.; Li, S.; Fleischmann, K.R. The use of ICT during COVID-19. Proc. Assoc. Inf. Sci. Technol. 2020, 57, 1–5. [Google Scholar] [CrossRef]
- Lee, Y.-C.; Malcein, L.; Kim, S. Information and communications technology (ICT) usage during COVID-19: Motivating factors and implications. Int. J. Environ. Res. Public Health 2021, 18, 3571. [Google Scholar] [CrossRef]
- Smart City Index. 2020. Available online: https://www.imd.org/smart-city-observatory/smart-city-index/ (accessed on 25 May 2021).
- WHO Timeline—COVID-19. 2020. Available online: https://www.who.int/news/item/27-04-2020-who-timeline---covid-19 (accessed on 14 July 2021).
- Visvizi, A.; Lytras, M. Sustainable smart cities and smart village research: Rethinking security, safety, well-being, and happiness. Suistainability 2020, 12, 215. [Google Scholar] [CrossRef] [Green Version]
- Kemp, S. Digital 2021 April Global Statshot Report. 2021. Available online: https://datareportal.com/reports/digital-2021-april-global-statshot (accessed on 25 May 2021).
- Graham, S. Switching cities off. City 2005, 9, 169–194. [Google Scholar] [CrossRef]
- Graham, S. Disrupted Cities: When Infrastructure Fails; Routledge: London, UK, 2010. [Google Scholar]
- Bai, X.; Dawson, R.; Ürge-Vorsatz, D.; Delgado, G.C.; Barau, A.S.; Dhakal, S.; Dodman, D.; Leonardsen, L.; Masson-Delmotte, V.; Roberts, D.C.; et al. Six research priorities for cities and climate change. Nat. Cell Biol. 2018, 555, 23–25. [Google Scholar] [CrossRef]
- Colding, J.; Barthel, S.; Sörqvist, P. Wicked problems of smart cities. Smart Cities 2019, 2, 31. [Google Scholar] [CrossRef] [Green Version]


| No. | Internet Platform | Type and Amount of Data Generated within 1 Min |
|---|---|---|
| 1 | 69,000 photos and videos shared | |
| 2 | Snapchat | 21,000,000 snaps created |
| 3 | 510,000 comments added | |
| 4 | 350,000 tweets | |
| 5 | 7000 active users use the platform | |
| 6 | 1300 tagged photos | |
| 7 | YouTube | 3,470,000 videos watched |
| 8 | TikTok | 694,000 TikToks watched |
| 9 | 4,200,000 searches | |
| 10 | Amazon | USD 283,000 spent on purchases |
| No. | System Infrastructure | Examples of System Features in the Smart City Concept |
|---|---|---|
| 1 | Administration | • Solutions supporting inter-system city management. • Technologies supporting the budgeting process. • The possibility of electronic handling of official matters by clients (e-office). • Ensuring security for public administrative transactions (data encryption, etc.). |
| 2 | Transport | • Real-time traffic management. • Optimization of transport routes. • Intelligent redirection of buses to designated lanes. • Integrated ticketing systems. • Available parking space sensors. • Convenient parking mobile payments. • Electric car charging station system. |
| 3 | Construction | • Smart homes (Internet of Things, photovoltaic systems, heat pumps). • Intelligent systems for controlling HVAC systems. • Monitoring public utility buildings. • Building automation. |
| 4 | Waste management | • Circular economy (waste segregation + reuse). • Promoting “zero waste” attitudes among citizens. • Card-based garbage cans equipped with filling sensors. |
| 5 | Education | • E-learning combined with the possibility of videoconferencing. • Communication and information technologies for conducting scientific research. • Intelligent security and building management on student campuses (e.g., monitoring system, student access to media). |
| 6 | Healthcare | • Electronic patient records and telemedicine. • Information exchange between hospitals and pharmacies. • Remote monitoring of specific groups of patients (e.g., elderly people). • Promoting healthy lifestyle. |
| 7 | Public security | • Modern crisis command center. • Quick notification of citizens about a threat (e.g., by sms). • Optimization of capacity and response time of emergency services. • Securing mass events. • Intelligent monitoring of public places (connected to emergency services systems). • Access to live images and archived images from city cameras. |
| 8 | Spaces for recreation and leisure | • Numerous green areas, enabling outdoors relaxation. • Infrastructure contributing to sports (e.g., bike lanes). • Websites providing information on tourist attractions. • Intuitive interactive maps of attractions and events. • Intelligent green space monitoring (in real time). • Quick access to information about accommodation and restaurants. |
| No. | Smart City | Rating | Country | Continent | Percentage of Citizens of the Country Who: | ||
|---|---|---|---|---|---|---|---|
| Live in Cities | Use Internet | Use Social Media | |||||
| 1 | Singapore | AAA | Singapore | Asia | 100.0% | 90.0% | 84.4% |
| 2 | Helsinki | AA | Finland | Europe | 85.6% | 95.0% | 80.4% |
| 3 | Zurich | AA | Switzerland | Europe | 74.0% | 97.0% | 81.8% |
| 4 | Auckland | AA | New Zealand | Oceania | 86.7% | 84.0% | 82.0% |
| 5 | Oslo | AA | Norway | Europe | 83.1% | 99.0% | 83.2% |
| 6 | Copenhagen | AA | Denmark | Europe | 88.2% | 98.1% | 83.6% |
| 7 | Geneva | AA | Switzerland | Europe | 74.0% | 97.0% | 81.8% |
| 8 | Taipei | A | Taiwan | Asia | 79.1% | 90.0% | 82.6% |
| 9 | Amsterdam | A | The Netherlands | Europe | 92.4% | 96.0% | 88.0% |
| 10 | New York | A | USA | North America | 82.8% | 90.0% | 72.3% |
| 100 | Sao Paulo | C | Brazil | South America | 87.2% | 75.0% | 70.3% |
| 101 | Rome | C | Italy | Europe | 71.2% | 83.7% | 67.9% |
| 102 | Rio de Janeiro | C | Brazil | South America | 87.2% | 75.0% | 70.3% |
| 103 | Cape Town | D | South Africa | Africa | 67.6% | 64.0% | 41.9% |
| 104 | Manila | D | Philippines | Asia | 47.6% | 67.0% | 80.7% |
| 105 | Rabat | D | Morocco | Africa | 63.8% | 74.4% | 59.3% |
| 106 | Cairo | D | Egypt | Africa | 42.8% | 57.3% | 47.4% |
| 107 | Abuja | D | Nigeria | Africa | 16.7% | 13.6% | 2.4% |
| 108 | Nairobi | D | Kenya | Africa | 28.2% | 40.0% | 20.2% |
| 109 | Lagos | D | Nigeria | Africa | 16.7% | 13.6% | 2.4% |
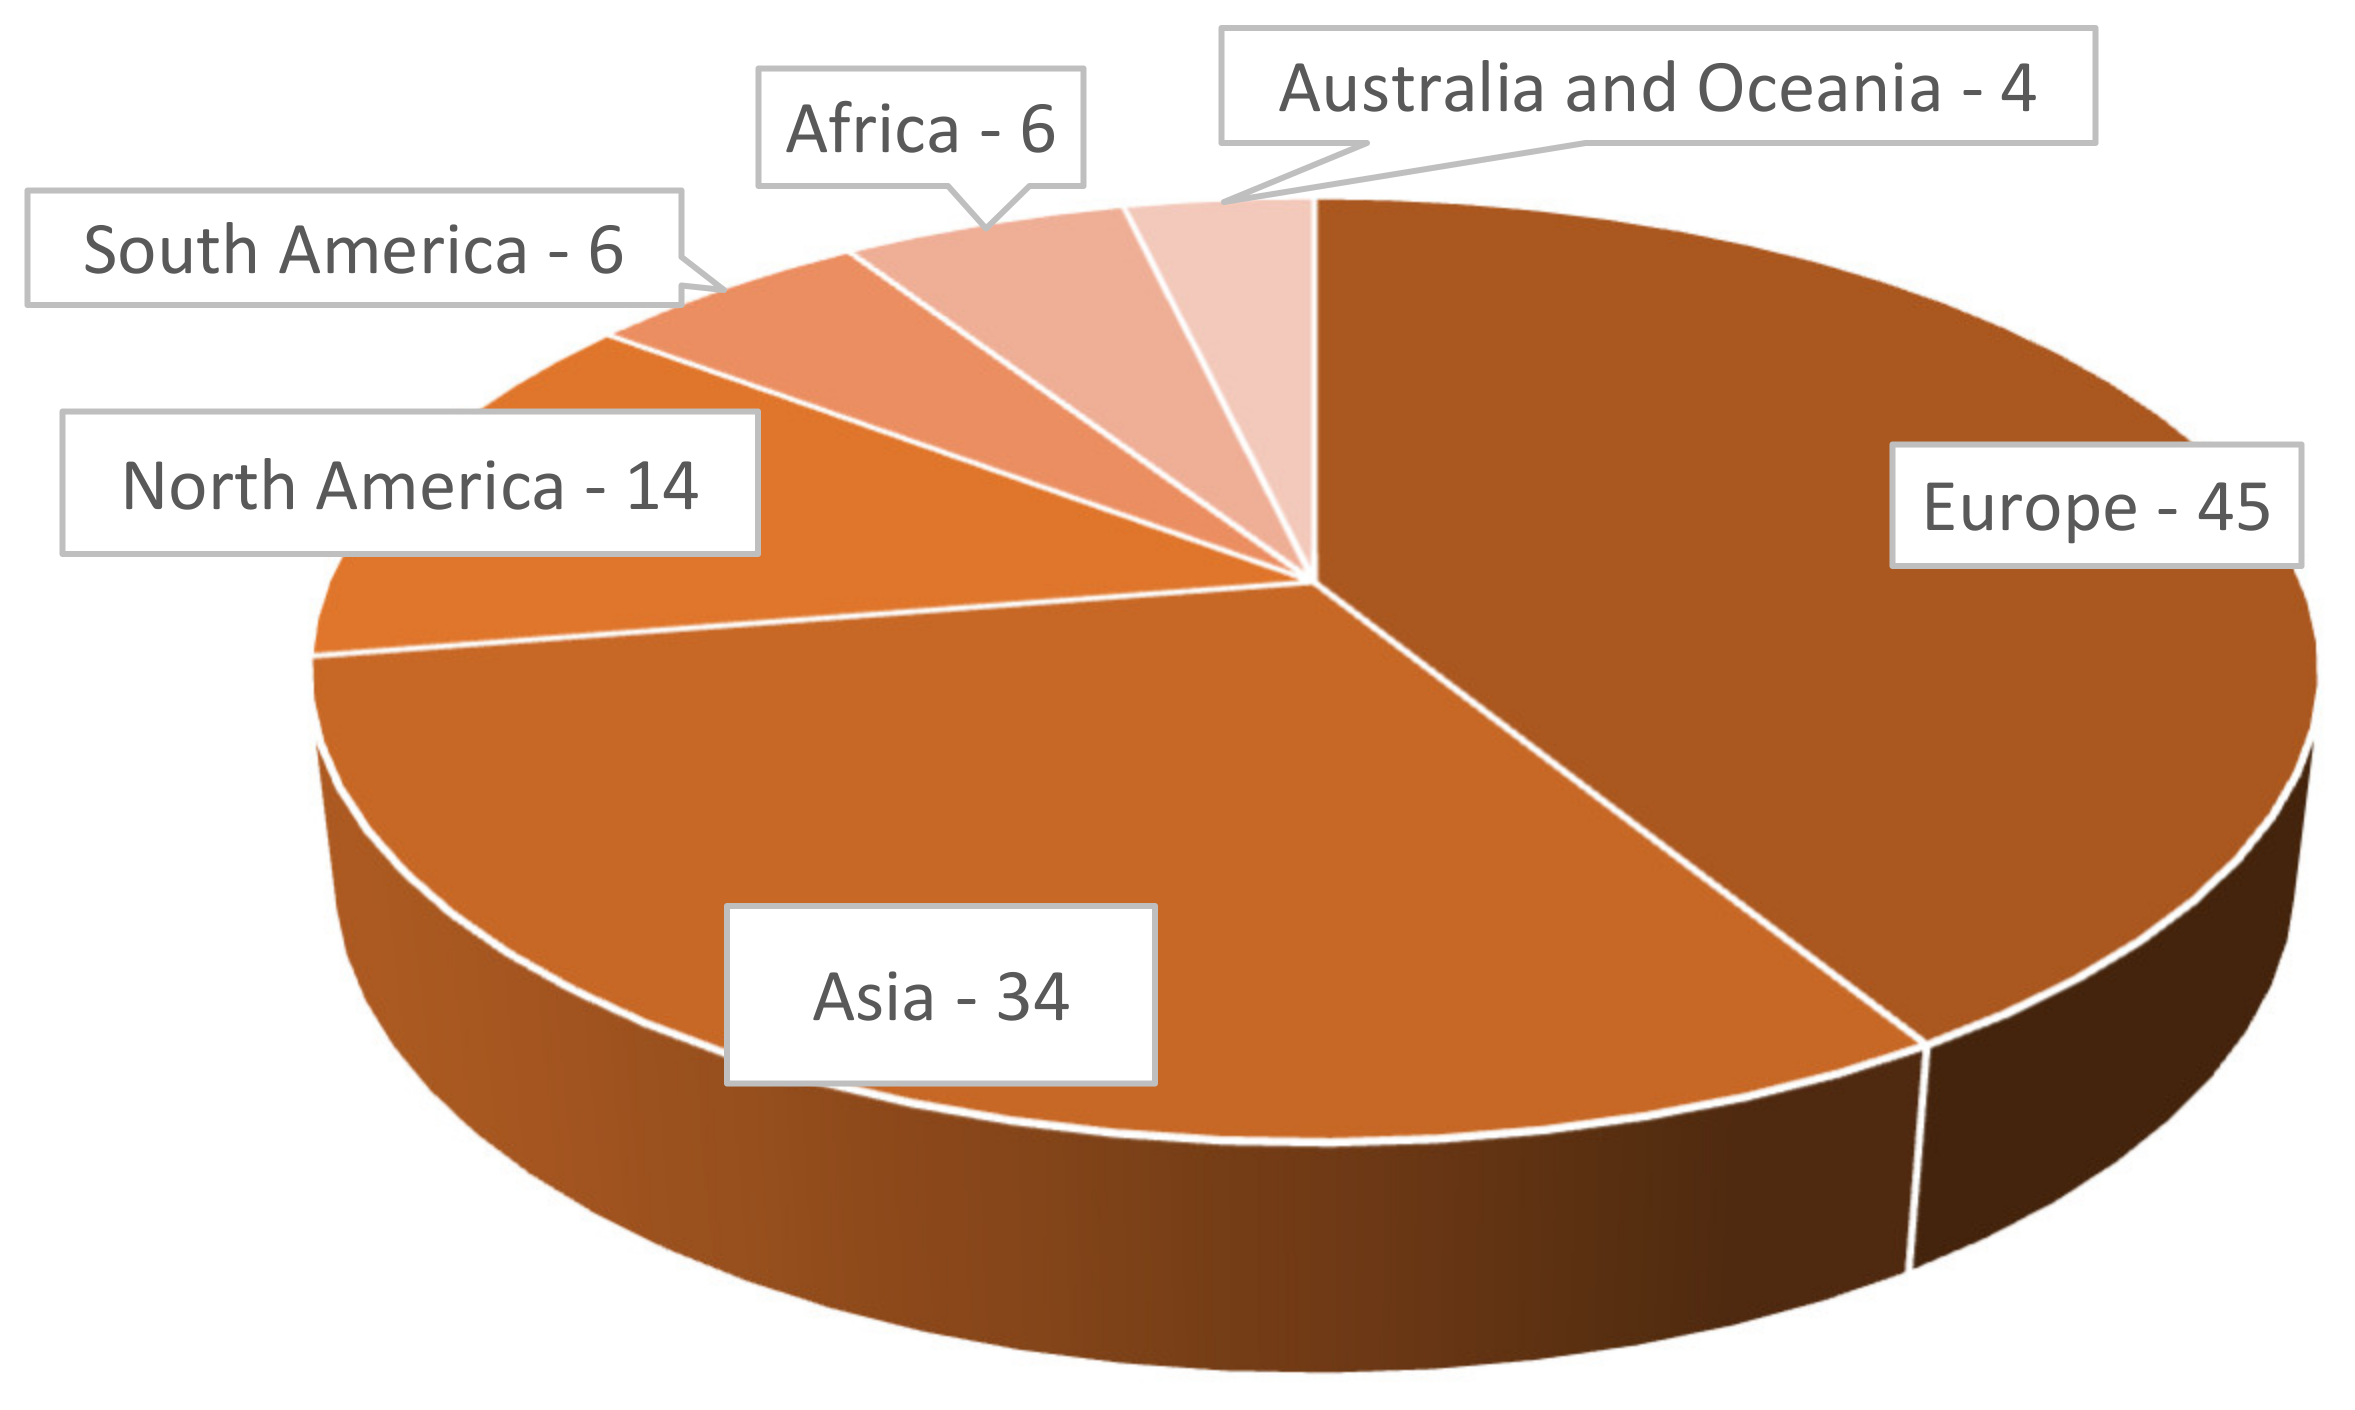
| Continent | Number of Countries | Total Number of Residents Included in the Ranking of Countries (Million) | City Residents | Internet Users | Social Media Users | |||
|---|---|---|---|---|---|---|---|---|
| Million | % | Million | % | Million | % | |||
| Europe | 25 | 703.90 | 533.3 | 75.8 | 617.1 | 87.7 | 512.70 | 72.8 |
| Asia | 15 | 3761.13 | 1981.5 | 52.7 | 2296.4 | 61.1 | 2061.9 | 54.8 |
| North America | 3 | 499.5 | 410.7 | 82.2 | 426.4 | 85.2 | 372.2 | 74.5 |
| South America | 4 | 328.93 | 286.4 | 87.1 | 246.8 | 75.0 | 241.0 | 73.3 |
| Africa | 5 | 279.69 | 127.7 | 45.7 | 150.1 | 53.7 | 107.6 | 38.5 |
| Oceania | 2 | 30.48 | 26.3 | 86.4 | 26.9 | 88.2 | 24.5 | 80.3 |
Publisher’s Note: MDPI stays neutral with regard to jurisdictional claims in published maps and institutional affiliations. |
© 2021 by the author. Licensee MDPI, Basel, Switzerland. This article is an open access article distributed under the terms and conditions of the Creative Commons Attribution (CC BY) license (https://creativecommons.org/licenses/by/4.0/).
Share and Cite
Walentek, D. Datafication Process in the Concept of Smart Cities. Energies 2021, 14, 4861. https://doi.org/10.3390/en14164861
Walentek D. Datafication Process in the Concept of Smart Cities. Energies. 2021; 14(16):4861. https://doi.org/10.3390/en14164861
Chicago/Turabian StyleWalentek, Dorota. 2021. "Datafication Process in the Concept of Smart Cities" Energies 14, no. 16: 4861. https://doi.org/10.3390/en14164861
APA StyleWalentek, D. (2021). Datafication Process in the Concept of Smart Cities. Energies, 14(16), 4861. https://doi.org/10.3390/en14164861