Article

Improving the Efficiency of Maritime Infrastructures through a BIM-Based Building Energy Modelling Approach: A Case Study in Naples, Italy

by
Giovanni Barone
,
Annamaria Buonomano
,
Cesare Forzano
,
Giovanni Francesco Giuzio
* and
Adolfo Palombo
Department of Industrial Engineering, University of Naples Federico II, 80125 Naples, Italy
*
Author to whom correspondence should be addressed.
Energies 2021, 14(16), 4854; https://doi.org/10.3390/en14164854
Submission received: 15 July 2021 / Revised: 30 July 2021 / Accepted: 1 August 2021 / Published: 9 August 2021
(This article belongs to the Special Issue Challenges and Research Trends of Building Energy Performance)

Abstract

:
Worldwide, the design, renovation, and sustainable management of port buildings play a crucial role for sustainability. In this framework, a computer simulation of a building’s thermal behaviour is an almost mandatory tool for making informed decisions. However, the development of a building energy model is a challenging task that could discourage its adoption. A possible solution would be to exploit an existing Building Information Modeling (BIM) model to automatically generate an accurate and flexible Building Energy Modeling (BEM) one. Such a method, which can substantially improve decision-making processes, still presents some issues and needs to be further investigated, as also detectable from the literature on the topic. In this framework, a novel workflow to extrapolate BIM data for energy simulation is proposed and analysed in this paper. Here, the BIM to BEM approach was tested as a useful tool for the maritime industry to improve the implementation of effective energy-saving measures. Specifically, in order to prove the capabilities of the proposed method, a maritime passenger station in Naples was chosen as case study and investigated by comparing different strategies to reduce the annual primary energy consumption. The optimal level of modelling detail required by a trustable building energy assessment was also investigated. By the proposed method, interesting primary energy savings (ranging from 24 to 41%) are achieved and CO2 emissions avoided (ranging from 16 to 34 tons CO2/year) for the investigated building, proving the potential of this approach. Definitely, this paper proves the validity of the proposed methodology and emphasizes its numerous benefits towards the achievements of the most modern sustainability standards.

1. Introduction

Attention to ecological issues has increased significantly in the maritime sector for both ports [1] and ships [2,3]. As stated in the 2020 Environmental Report [1], the European Sea Ports Organisation (ESPO) has ranked air quality, climate change, and energy efficiency as the top three of its ten environmental priorities. The growing awareness about this topic has led many ports to plan concrete actions to reduce energy consumption that are often carried out in the framework of international standards such as ISO 50001 and EN 16001, or specific tools developed to support environmental management in ports, i.e., the Port Environmental Review System (PERS). The enhancement of the energy efficiency of ports can also be seen as part of the broader research trend regarding independent and semi-independent energy communities [4,5,6].

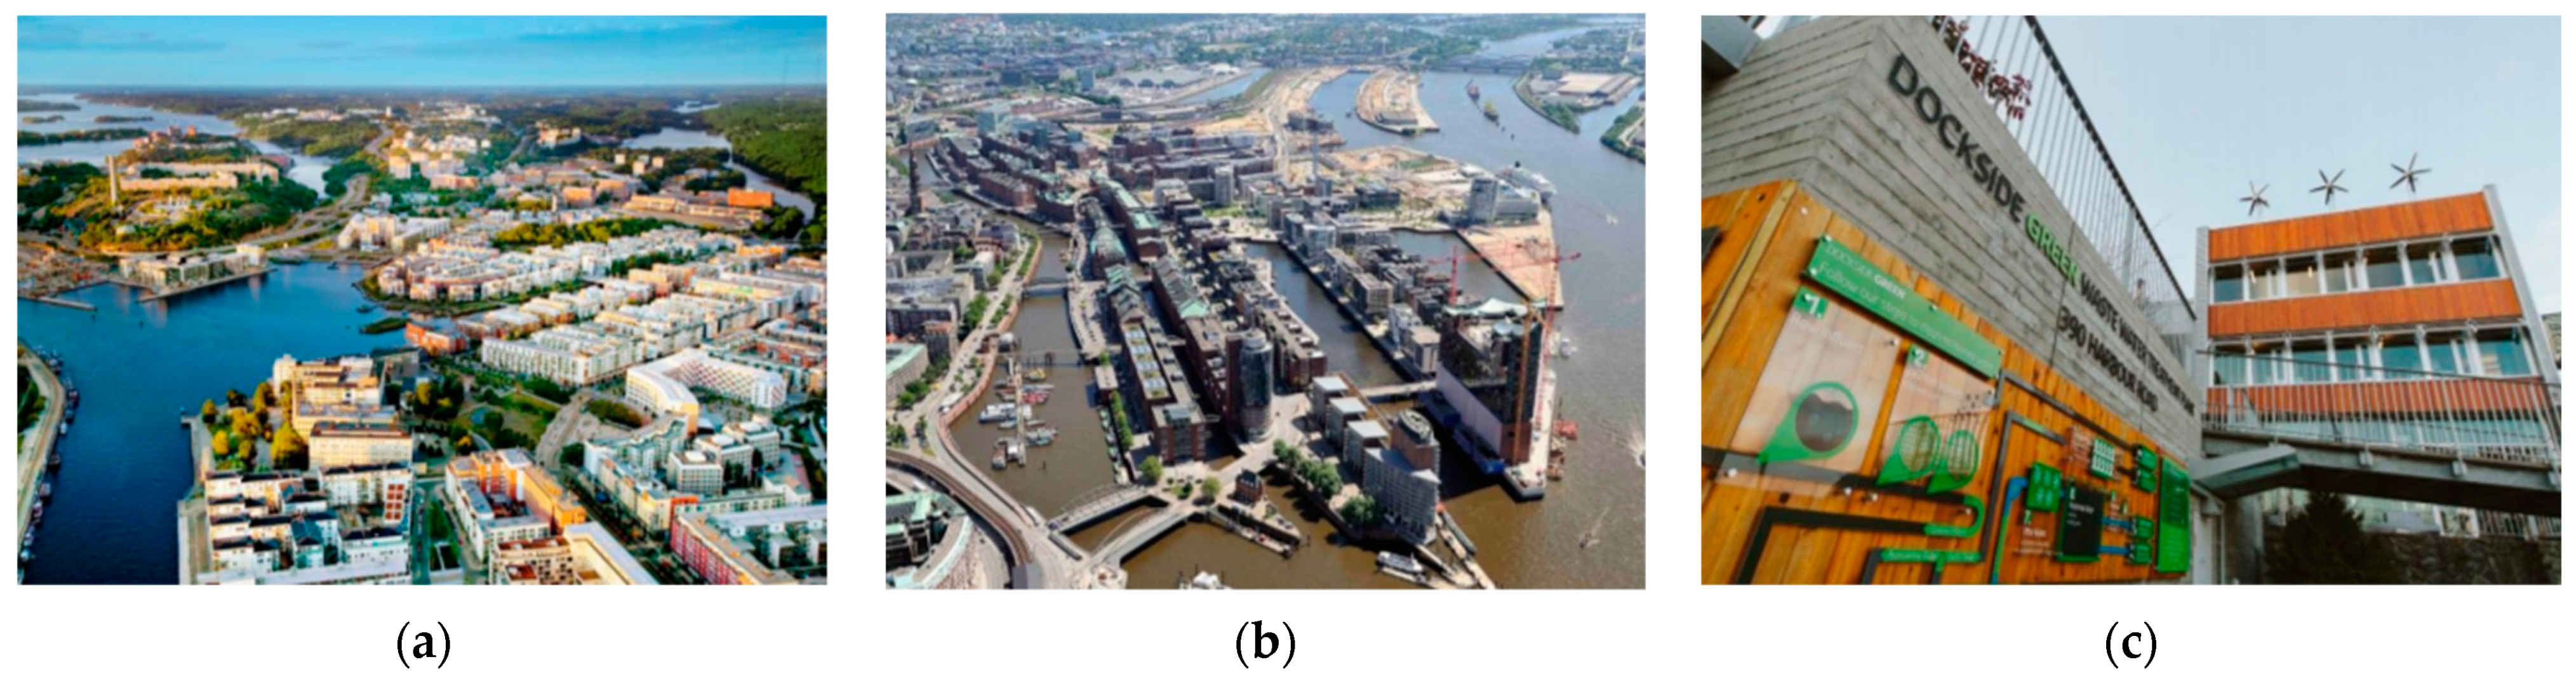
1.1. Renovation or Redevelopment Project of Port Areas

Among technological and operational energy-saving measures adopted in the European seaports, the improvement of building performance by means of innovative design and/or renovation of existing infrastructures has been considered as one of the key solutions to face ESPO priorities, highlighted also by Sdoukopoulos et al. in their recent work [7]. They provided an overview of the main policies, technologies, and practices that European ports have adopted to-date for enhancing energy efficiency. The authors collected several cases of actual building renovations that were developed in harbour areas in the last years, mainly in the Baltic Sea. The survey addressed different building typologies such as offices and passengers terminals, as well as warehouse buildings [8], involving passive design concepts, innovative heating, ventilation, and air conditioning (HVAC) systems, and renewable energy technologies for the in-site electricity and thermal energy production. It is worth mentioning the significant examples of the office buildings of Värtahamnen port and the terminal passengers’ building of the Port of Portsmouth. Both of them were designed following the most modern eco-building standards and their heating and cooling systems have been equipped with seawater source heat pumps exploiting the renewable thermal energy from seawater. Such a solution allows very high performance for hot and cold water production, however, its application is limited by seawater temperatures [9]. The North Adriatic Sea Port Authority also recognises the importance of renovating port buildings [10]. After energy audits on buildings located in the harbour area of Venice and Marghera (office and artisan activity buildings), it was found that, although they were renovated in 2007, the investigated buildings have low thermal insulation, which causes high energy consumption, both in terms of fuel for winter heating and electricity for summer air conditioning. Acting through the insulation of walls and floors, the replacement of windows and doors and the replacement of the current methane heat generators with heat pump systems, it could be possible to significantly reduce energy consumption and related CO2 emissions.
An interesting report dealing with the energy planning of the Port Lands of Toronto provides useful guidelines for a net zero energy district [11]. The adopted approach involves the calculation of energy use, energy demand, and GHG emissions for different strategies of development, in order to understand the potential future energy needs of the Port Lands. In addition, current trends and practices in developing net zero communities were investigated by exploring existing and in-development case studies buildings such as Hammarby Sjostad, HafenCity, and Dockside Green (see Figure 1). The pillars that the author identified to reach the goal of net zero energy districts were: (i) improving the codes and standards, (ii) enhancing energy conservation in new buildings, (iii) adopting a building-scale local energy supply, and (iv) adopting block-scale energy sharing networks. In addition, other unique opportunities, such as creating synergies with the Portlands Energy Centre and the geography of the Port Lands itself within Toronto’s waterfront, were identified, and specific technologies were then evaluated to understand their potential contribution towards achieving net zero.
Furthermore, in a recent study of Vaher et al. [12], a review of the active and passive strategies adopted in large buildings (i.e., non-residential, museum, airports, and a cruise terminal) is reported with the aim of making the Tallinn cruise terminal a nearly Zero Energy Building (nZEB) and providing useful guidelines for efficiency improvement of similar buildings in northern climates. From the experiences retrieved from other case studies and the modelling and simulation of the investigated one, the authors defined the pillars for the effective and sustainable operation of the Tallinn cruise terminal that may be also extended to other similar buildings. The solutions proposed were (i) reduction of window facade solar factor and adoption of solar protections; (ii) increasing heating and cooling efficiency by seawater source heat pumps; (iii) adoption of demand-controlled devices for ventilation and lighting in order to avoid energy waste due to irregular occupancy; (iv) on-site electricity generation. The authors assessed the potential energy savings and indoor air conditions by means of a commercial dynamic simulation software, i.e., IDA Indoor Climate and Energy [13], which is one of several commercial design tools available for building energy modelling (BEM). Although the methodology of BEM is currently widely used in the construction industry, as it represents the most effective state-of-the-art tool to predict building behaviour, the work of Vaher et al. is one of the few examples found in the scientific/technical literature that explicitly addresses BEM for building design in the maritime sector.

1.2. Application of BIM and BEM Methodologies

As said, BEM has experienced significant growth in recent years [14]. Its application within the construction industry by architects and engineers allows building energy consumption reduction by supporting informed choices of effective low energy-consuming strategies [15,16]. There are several software that enable whole-building performance simulations (BPS), both commercial and open-source. To encourage their application, the U.S. Department of Energy (US DOE) hosts and maintains the BEST Directory, a list of recognised Building Energy Software Tools (BEST) which counts 207 among BPS and other useful tools at the time the authors wrote this paper. In addition, many in-house BPS have been also developed within universities or scientific institutions for the purpose of more advanced research [17,18], or to enhance capabilities for complex simulations [19,20]. Modelling of innovative energy systems and multi-building simulations are also interesting applications of BPS [21,22].
Physics-based building energy models require a high number of input parameters to carry out detailed dynamic calculations on an hourly or subhourly basis, i.e., hourly outdoor boundary conditions, building surface and space geometry, envelope thermal characteristics, occupancy and operation profiles, HVAC systems configurations, etc. [23]. The implementation of such building models is often complex and time-consuming, furthermore, design or construction firms use BEM only at an advanced stage of the project which reduces its potential benefits [24]. Indeed, BEM technologies have the capability of improving design from the point of view of the end-use energy consumption if adopted in the early phase of the design, following an Integrated Design Process (IDP) [25]. In this framework, building information modelling (BIM) is fundamental to streamline project management and integrate all involved professionals and stakeholders [26]. Digitalisation of the project information in a unique BIM model introduces an important simplification for interoperability between the different project areas, such as architects, civil and mechanical, electrical, and plumbing (MEP) engineers, general contractors, etc. Therefore, energy modelers may also benefit from a BIM database to develop BEM models, avoiding redundant building model creation and speed up the design [27]. This methodology, called BIM-based BEM or BIM to BEM, has been investigated in literature and is becoming a common practice in the industry. Nevertheless, this methodology is still unperfect and can introduce geometry errors and loss of data during export/import procedures [28]. BIM to BEM relies on two transfer file formats: IFC (Industry Foundation Classes), developed by buildingSMART [29], and gbXML (Green Building XML) [30]. While the first one was mainly designed for exchanging data from BIM to BIM, gbXML embeds specific information allowing BEM model definition [31,32]. Both of them are continuously updated to provide essential tools in the context of building energy modelling and to boost collaboration among practitioners.
The validity of the described approach is proven for various building types, such as industrial [33], educational [27,34], and residential [35,36]. The current trend is to increasingly improve the integration of energy simulations within the BIM environment [37], which are particularly useful for preliminary sensitive analyses [38]. However, it is still incomplete and does not meet the users’ needs regarding flexibility [39]. Other authors studied and developed specific algorithms to join BIM and BEM capabilities, as in [40], where gbXML generated by different BIM authoring software were used to export geometry to custom metamodels for energy calculations. The authors also highlighted the need for the standardisation of data transfer schema, as several issues were encountered depending on the choice of the BIM software. This could also encourage the development of more complex workflows including multiphysics environment, such as advanced thermal and acoustic simulations [41], life cycle assessment (LCA) analyses [42], computational fluid dynamics (CFD) simulations [43], or daylighting and occupant thermal comfort assessments [44,45,46].
In this framework, aiming at boosting the adoption of the BIM to BEM methodology in the context of building construction or refurbishment, a novel workflow, purposely conceived to extrapolate and convert BIM data into readable inputs for BEM, has been developed and here presented. Specifically, the proposed methodology is suitably conceived to provide detailed and accurate dynamic calculations of the thermal and electrical needs starting from a digital model of the building. The developed workflow is based on the use of the two most used BIM and BEM software in the architecture, engineering and construction (AEC) industries, Autodesk Revit and OpenStudio. While Autodesk Revit is one of the most advanced BIM authoring software available on the market, OpenStudio is open-source, designed, and developed to be a flexible and easy tool for energy modelling. This combination has the potential to become an attractive tool for both professionals in the building sector, who increasingly pay attention to energy saving in their projects, and researchers. Aimed at testing the novel approach capabilities, this was adopted to investigate a suitable and innovative case study. Specifically, a detailed BIM-based BEM model of the new “Molo Beverello” maritime station of Naples (a real building located in the South of Italy and currently under construction) was developed with the twofold aims of supporting design decisions oriented to energy consumption reduction and providing a consistent tool for continuous improvement in facility management. The considered project is part of a wider redevelopment plan of the port area and aims to achieve high standards of efficiency. In addition, modelling and simulation of suitable energy-saving measures were carried out to test the proposed workflow and verify the model reliability for its usage during the entire life cycle of the building as a management tool. Indeed, facility managers in maritime industries might benefit from this work to implement strategies within their own PDCA cycles (plan, do, check, act) that standards such as ISO 50001 or PERS require. Further analyses were also conducted in order to identify the optimal level of detail, or level of development (LOD), required to obtain accurate energy models with acceptable modelling efforts.

2. Materials and Methods
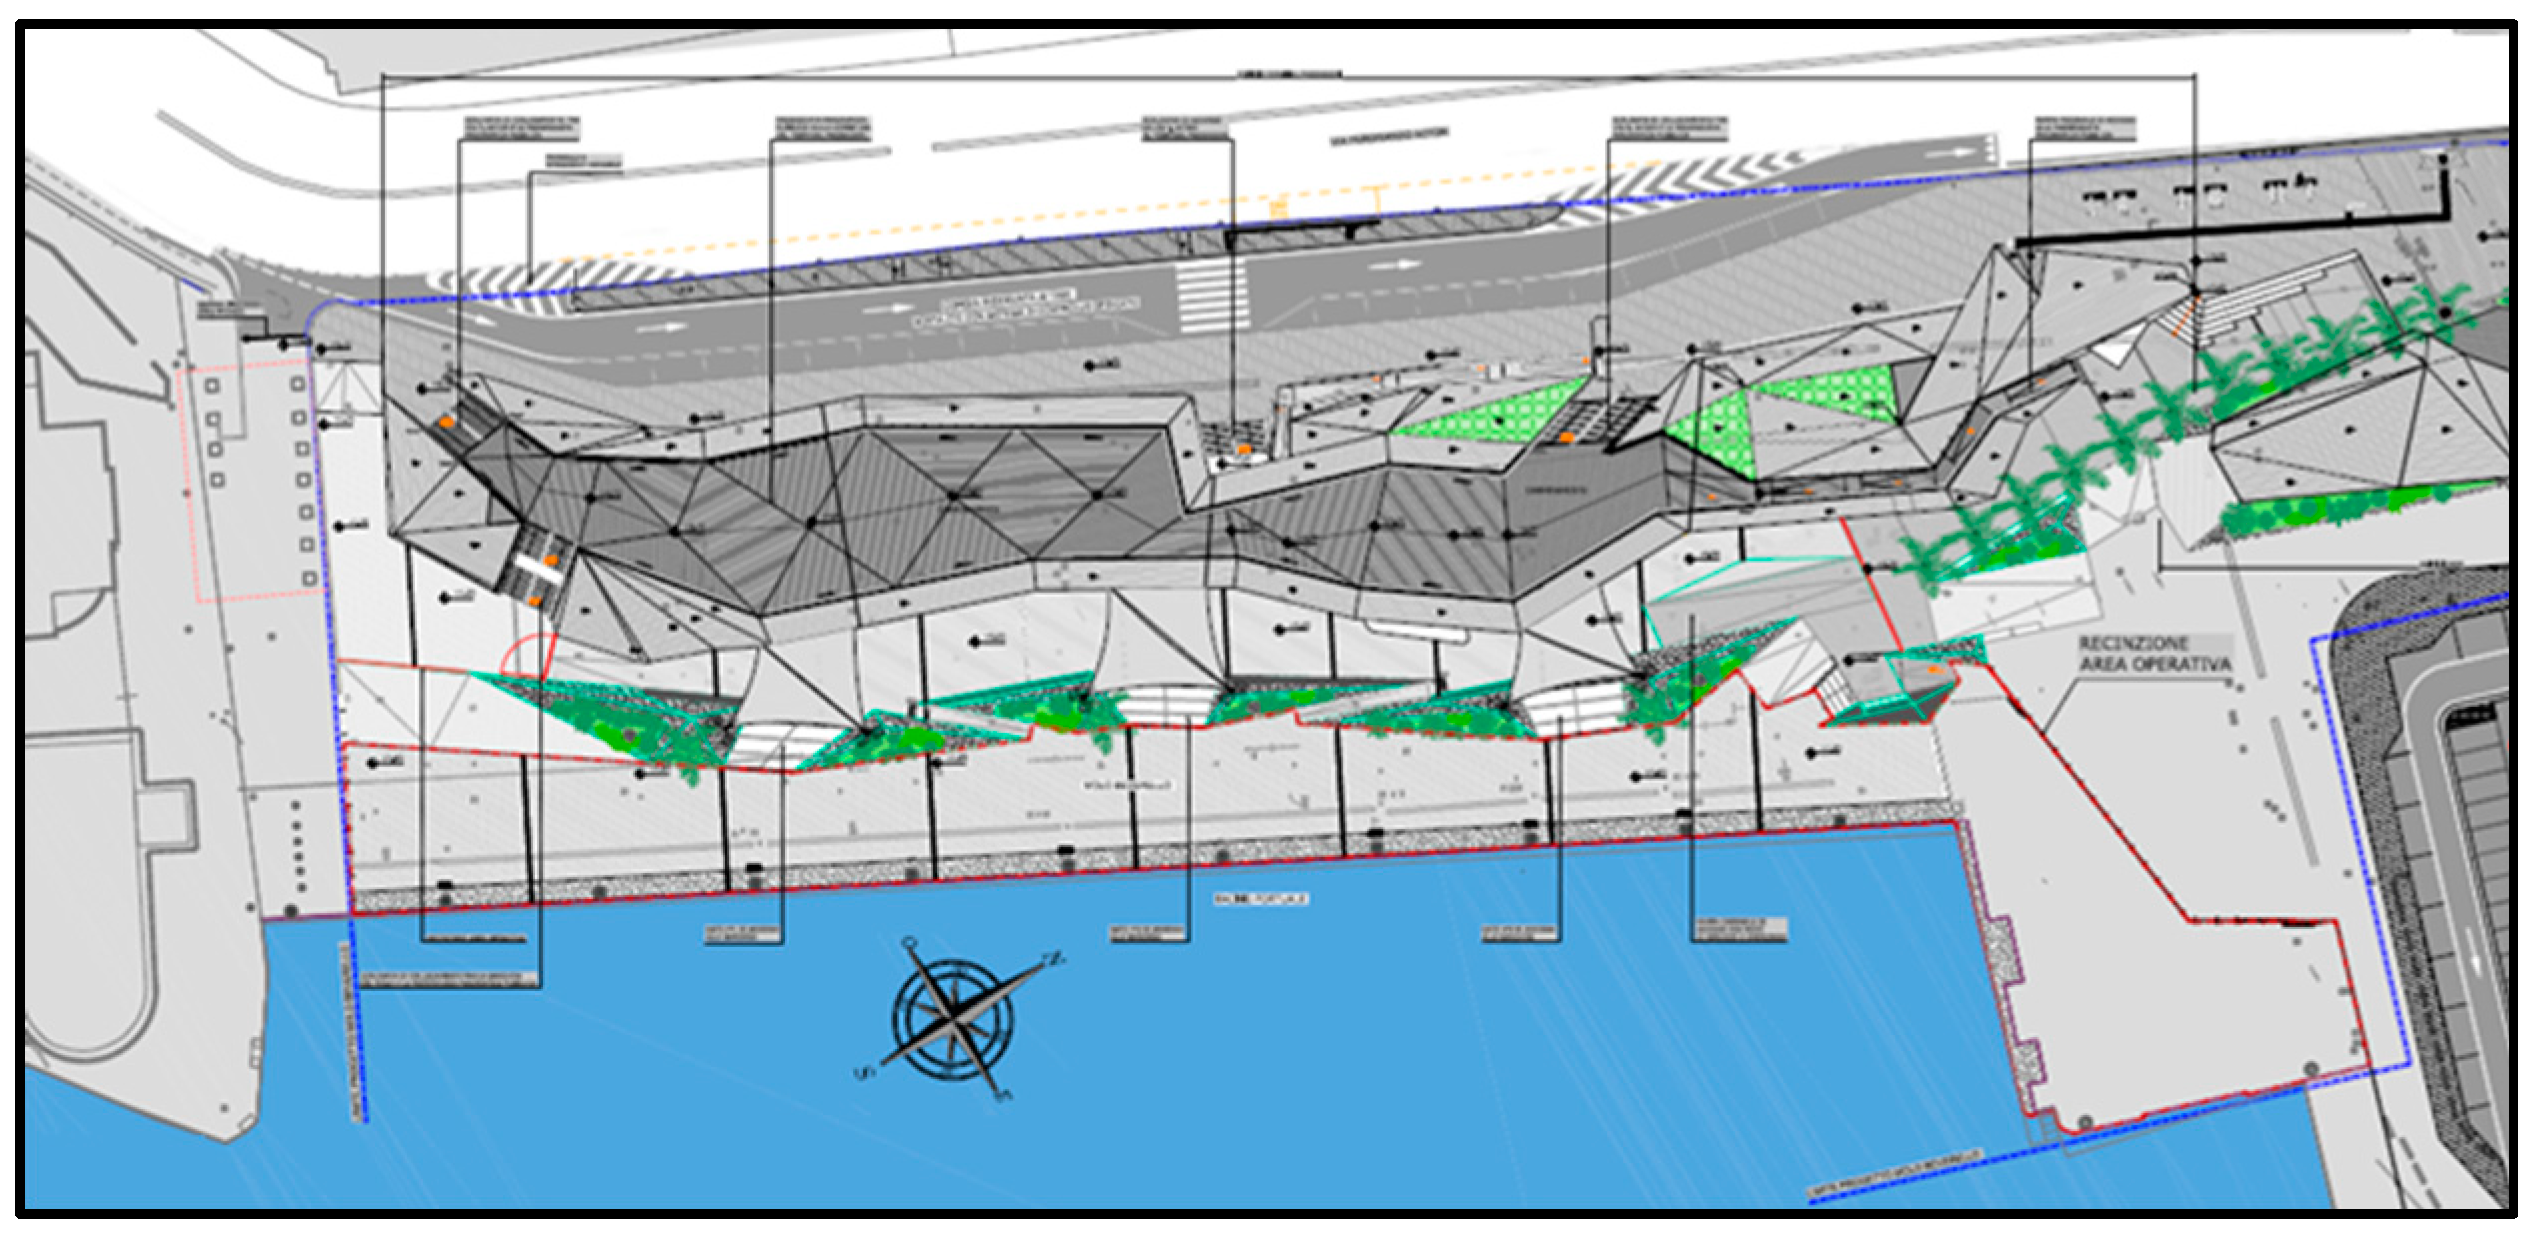
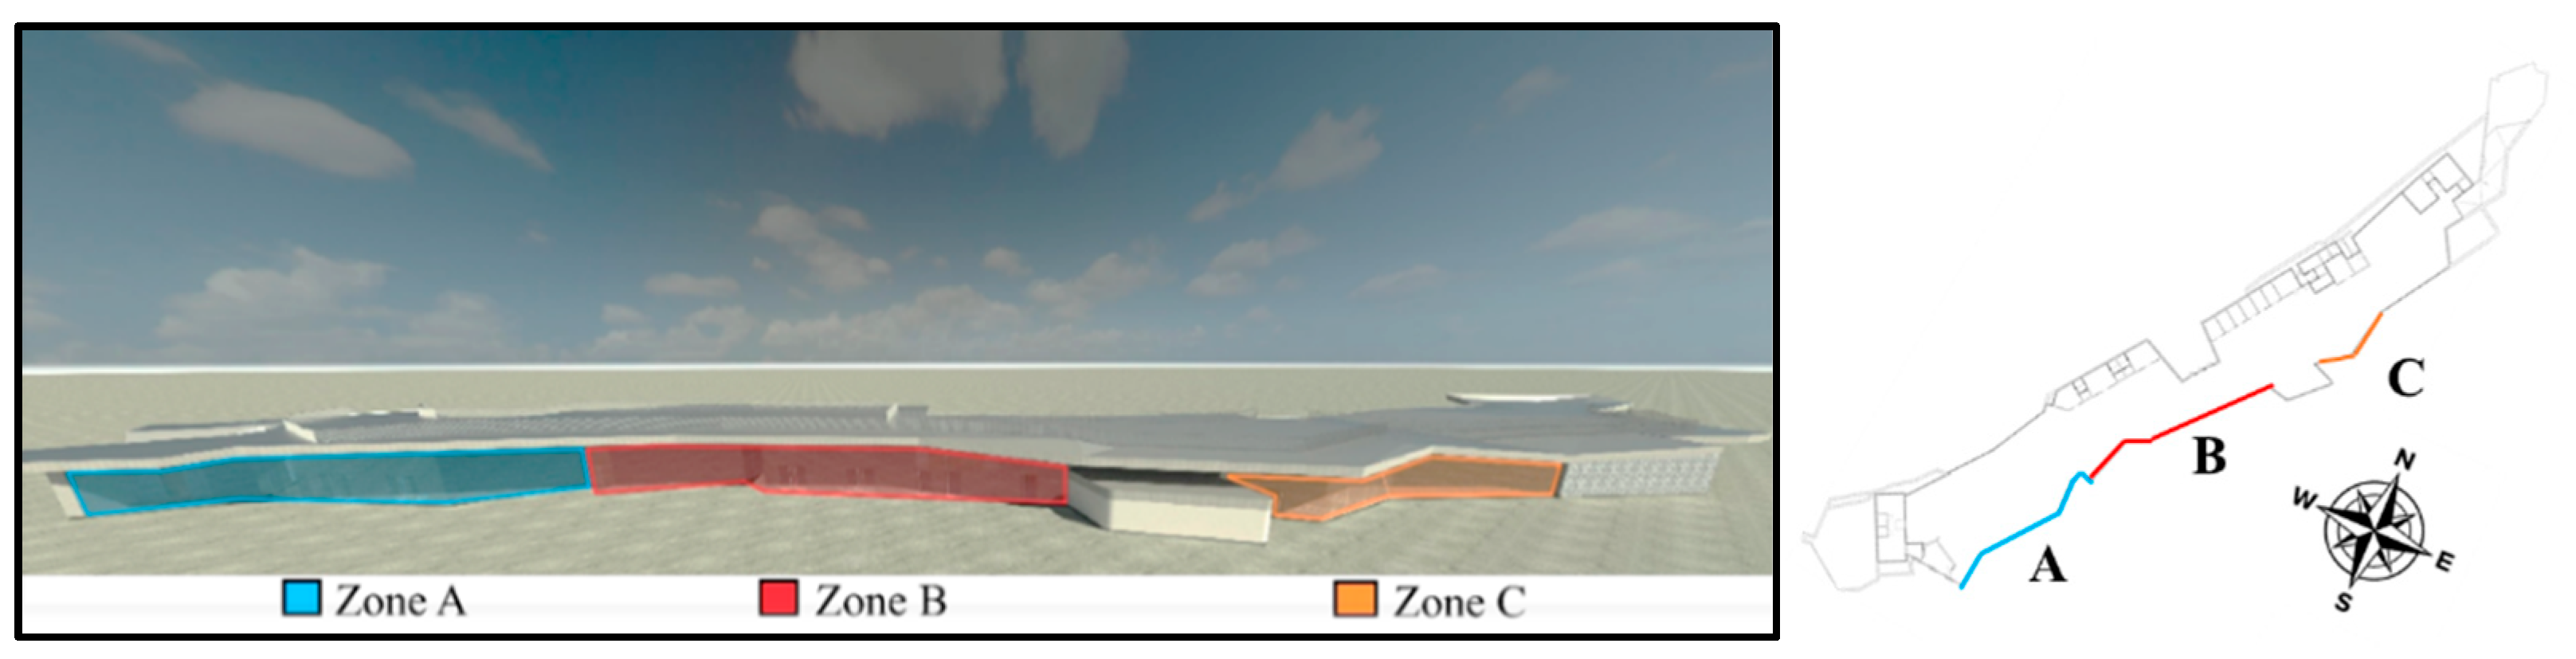
As previously specified, this paper aims to analyse a novel workflow based on the state-of-the-art practices of the BIM to BEM approach to be applied to the design and operation management of maritime station facilities. The proposed workflow, based on the Systems Analysis feature implemented within Autodesk Revit, one of the most used BIM authoring software, allows users to automatically export BIM-driven building and HVAC system data to gbXML that is consequently imported into OpenStudio, the building simulation software kit developed by the U.S. National Renewable Energy Laboratory (NREL). OpenStudio has the capability to create BEM models from a gbXML file, manipulate it programmatically or via its Graphical User Interface (GUI), and perform annual building energy simulations by means of EnergyPlus, the latest building simulation engine by the U.S. Department of Energy (DOE).
Revit introduced Systems Analysis with the Autodesk Revit version 2020.1, providing a series of scripts, called measures, to extrapolate and process information from gbXML, set simulation parameters, and query the calculation engine to obtain specific outputs. Furthermore, custom measures can be implemented to boost modelling and extend the BIM to BEM capabilities. In this framework, the proposed analysis was developed by means of Autodesk Revit 2022, OpenStudio CLI 3.2.0, and OpenStudio Application 1.1.0. The process phases are described in detail in the following sections after the presentation and characterisation of the case study, referred to the maritime station of “Molo Beverello”, a real project currently under development in the city of Napoli, southern Italy. A schematic diagram that reflects the methodology adopted is reported in Figure 2 which highlights the main tasks carried out during the process: data collection, BIM and BEM model development, model manipulation and review, simulation, and postprocessing. The entire process was carried out paying particular attention to the problems encountered along the way, to the operations necessary to eliminate such problems, and to the development of a real workflow able to optimize and speed up the whole process, including a postprocessing activity able to group, present and make easily analysable and usable the results provided by the software.

2.1. Case Study

The project of the Molo Beverello is part of a wider plan of “Redevelopment of the monumental area of the port of Naples” which follows the idea of improving the interaction and integration of the urban and port resources. The project, approved in 2018, consists of two parts:
  • The construction of a Commercial Area directly connected with the metro station of “Piazza Municipio”;
  • Re-arrangement of the “Molo Beverello” area, directly connected to the Commercial Area and to the pedestrian tunnel coming from the adjacent subway station. This project includes the construction of a new passenger terminal station for the fast sea lines to the islands of the Gulf of Naples.
Figure 3 shows a rendering of the project of the new terminal directly taken from the project documentation provided by the design and construction firm that is realizing the project. An energy survey was already carried out to assess energy consumption and to size the thermal plants, however, advanced modelling and simulations were carried out to propose new measures able to reduce consumption and promote energy efficiency.

2.2. Data Collection

All the information required to carry out the analysis were retrieved from the detailed design documentation, provided by the general contractor [47]. Furthermore, climate-related data of Naples were considered. Specifically, the Napoli Capodichino International Airport weather file from the IGDG collection was used for simulations. A 2D representation of the terminal within the context in which it is going to be built is provided in Figure 4. More detailed data related to the investigated facility design are omitted as they are intellectual property of the design engineering company [48].
With respect to the thermal properties of constructive elements such as walls, floors, ceiling, doors, and windows, the U-values and thermal capacities of the building components were calculated accounting for all materials they are made of. Specifically, the characteristics of the main envelope elements are summarised in Table 1. Please, note that these values are those selected by the design firm following the current Italian normative which provides mandatory thresholds for each building component feature (e.g., U-value, thermal mass, etc.) depending on the considered weather zone [49].
The facility, with a total area of 2340 m2 (2119 m2 conditioned) and an overall volume of 8675 m3, is expected to host a maximum number of 400 people during peak hours. The building consists of a total of 42 different spaces, grouped in 7 different thermal zones, while 7 not-conditioned spaces used as technical rooms are treated as single isolated thermal zones. Table 2 provides the information related to spaces and thermal zones as defined for energy modelling purposes. The HVAC system comprises two air handling units (AHU), balancing the latent and sensible (partially) heating and cooling loads, and a hydronic water loop to balance the remaining sensible loads by means of low temperature radiant systems. The generation system consists of two twin air source heat pumps/chillers that provide the thermal power required to keep thermal comfort (heating set-point 20 °C; cooling set-point 26 °C; relative humidity 50%). The two heat pumps/chillers are sequentially activated to maximise operational performance under nominal conditions. They are managed by a thermoregulation system that monitors the room temperature and relative humidity within the thermal zones.
The two heat pumps have a heating capacity of 157.8 kW (outdoor air condition 2 °C—water 45–40 °C; COP = 2.82) and a cooling capacity of 147.2 kW (outdoor air conditions 35 °C—water 7–12 °C; EER = 2.33). The maximum COP is recorded for a partial load ratio (PLR) of 25% which is equal to 4.60 at nominal conditions [48].
The zone equipment consists of radiant floors within the main zone (terminal one). On the other hand, the bathrooms of the perimetral area of the building are equipped with radiators. The hot water is sent to the radiators at 50 °C and to the radiant floor loop at 35 °C (according to the Italian standard UNI 1264 in order to limit the surface temperature of the floor to 29 °C). During the summer season, the radiant floor receives water at 19 °C to avoid surface condensation.
The two AHUs process only outdoor air and provide both the air needed for ventilation, as required by the UNI 10339 and EN 13779. The air circuit has a maximum flow rate of 14,000 m3/h and is equipped with an air heat exchanger to recover part of the exhaust air thermal energy. The air system treats the air by means of cooling coils, heating coils, re-heat coils, and humidifiers in order to supply the fresh air to the zones at 21.5 °C (relative humidity 45%) and 20.5 °C (relative humidity 55%) in heating and cooling mode respectively. It also allows free cooling when the outdoor air conditions are favourable.
The domestic hot water system consists of a air-water heat pump with a heating capacity of 18 kW that produces water at 60 °C and a 1500 L storage tank equipped with internal electrical resistance to ensure supply to all spaces of the building, such as toilets, shop, infirmary, and bar.
The waiting area of the terminal is open to the public from 7:00 a.m. to 9:00 p.m. Therefore, HVAC systems are operated when the terminal station is occupied. The occupancy schedule is supposed as maximum during the middle hours of the day, while the decrease in the number of passengers in the hours of the late afternoon is considered as few departures and arrivals are planned in the evening.

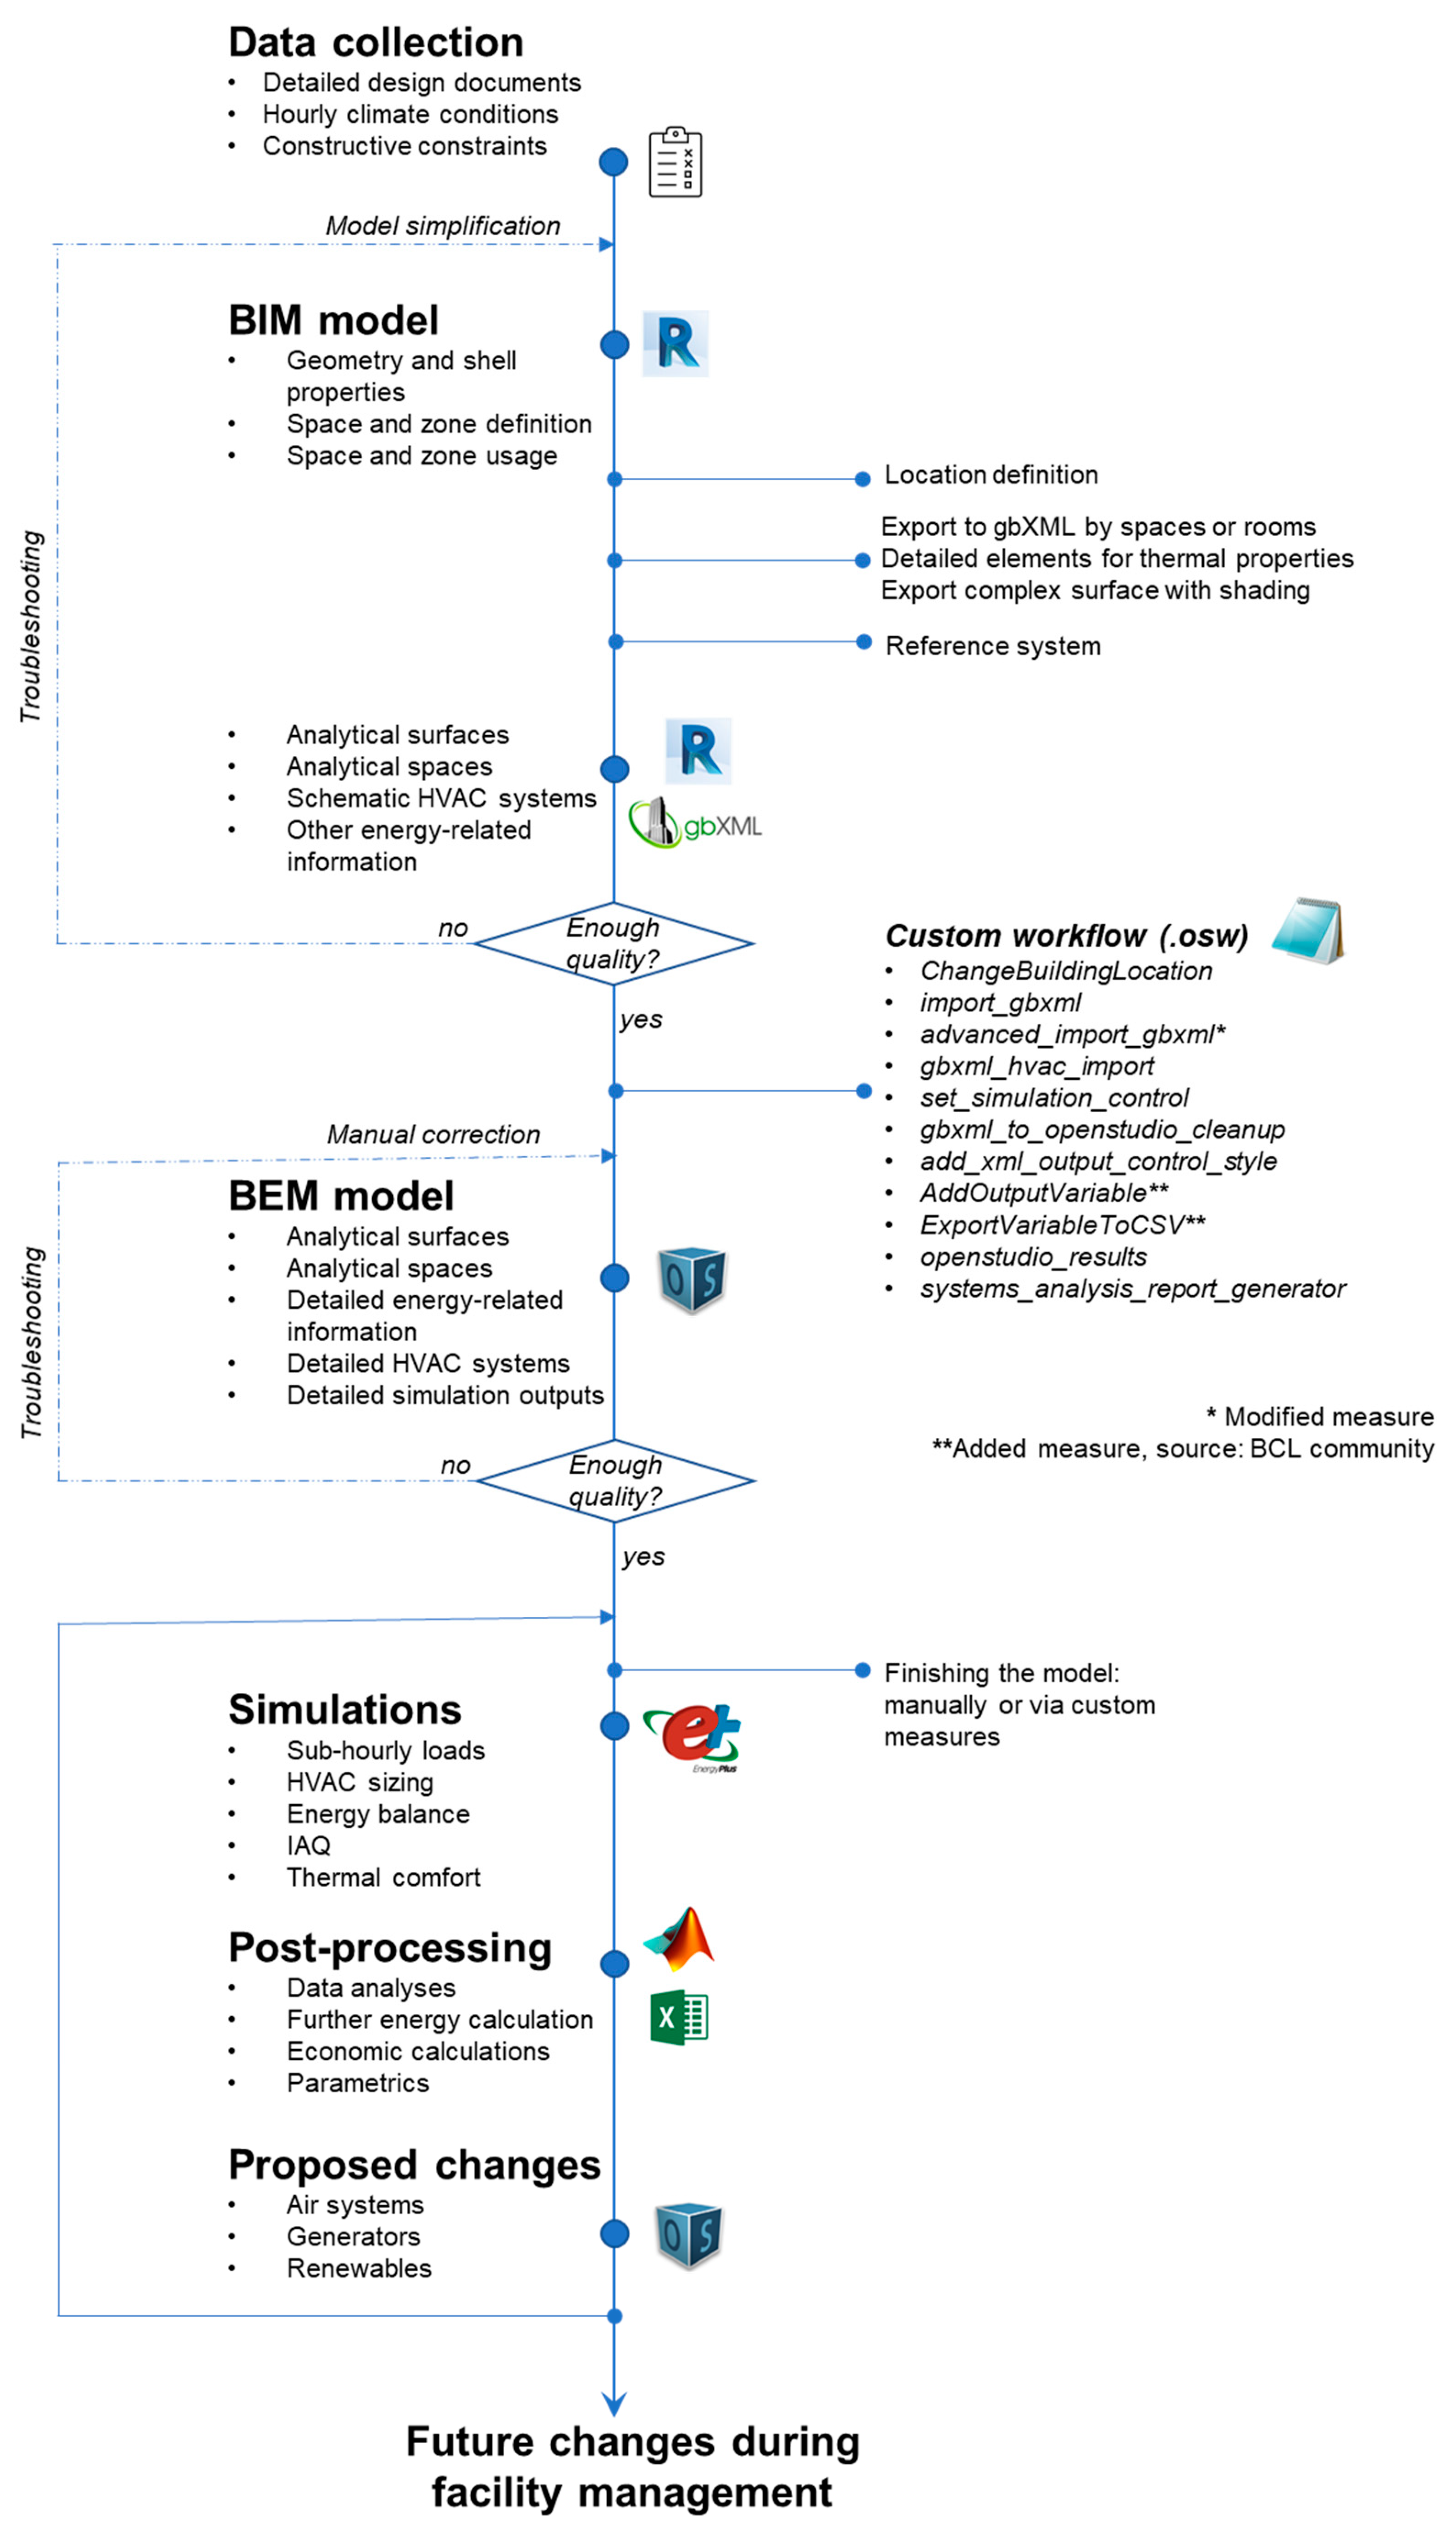
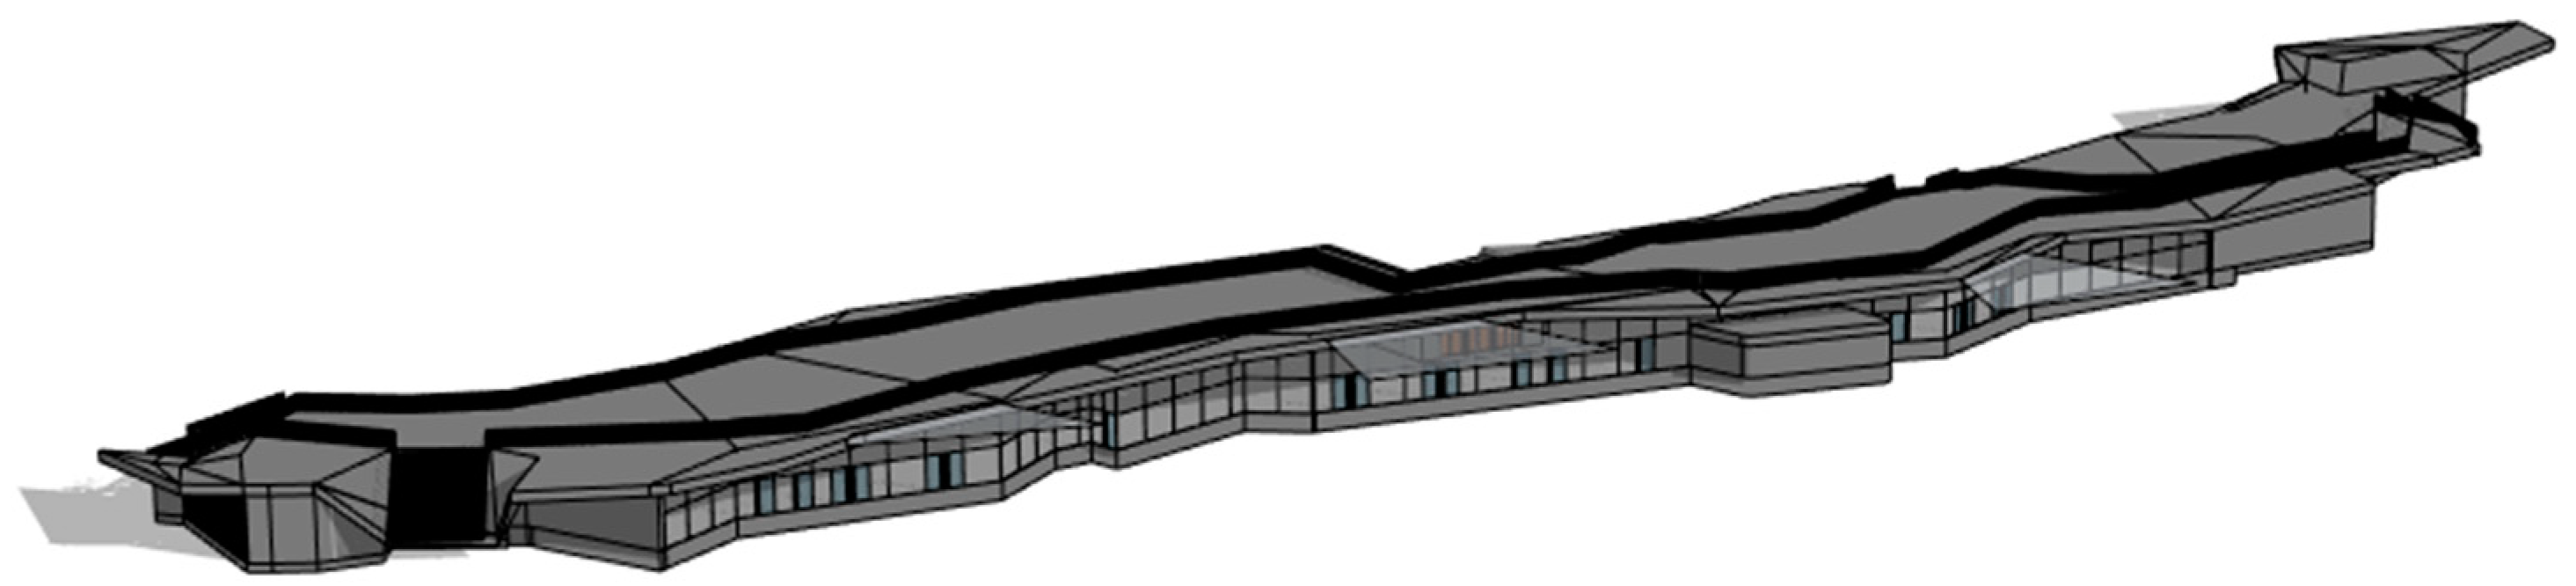
2.3. BIM Model Development

As the building geometry is very complex, the building shell has been simplified to obtain a reliable yet accurate energy model.
The level of detail, or level of development (LOD), is a parameter that indicates the level of detail and information of the graphical representation of the model. According to the American Institute of Architects (AIA) [50], the LOD is divided into 5 classes ranging from LOD 100, generic model poor of details, to LOD 500, a real model of the building [51].
The implementation of the BIM model was carried out with a LOD between the LOD 200 and the LOD 300 in order to ensure a faithful representation of each element of the building ensuring effective energy simulations. Particular attention was paid to glass elements, which contribute in large part to the final thermal demand. Parameters representing thermal properties are set according to the information collected for the case study. The same was done for space information, such as occupancy, lighting and equipment schedules, ventilation, infiltration, thermostat and humidistat set-points, etc., by creating custom libraries in the BIM software. Afterward, spaces were grouped into thermal zones (see Table 2) according to characteristics of HVAC systems and space boundary conditions. Figure 5 provides the prospective representation of the building as modelled in Autodesk Revit environment. The entire modelling process was facilitated by the user-friendly tools integrated into the BIM environment which allow the users to develop their own object families integrating the default libraries. Specifically, surface and space types are the main objects involved in the energy model. Each one needs to be characterised by means of all the above-mentioned information to represent the corresponding components in the actual building. However, complex projects such as the one analysed in this paper require significant commitment. Such input data have to be manually inserted, which involves a fair amount of time, especially when the number of spaces is high. Therefore, the need for time increases with the building complexity.

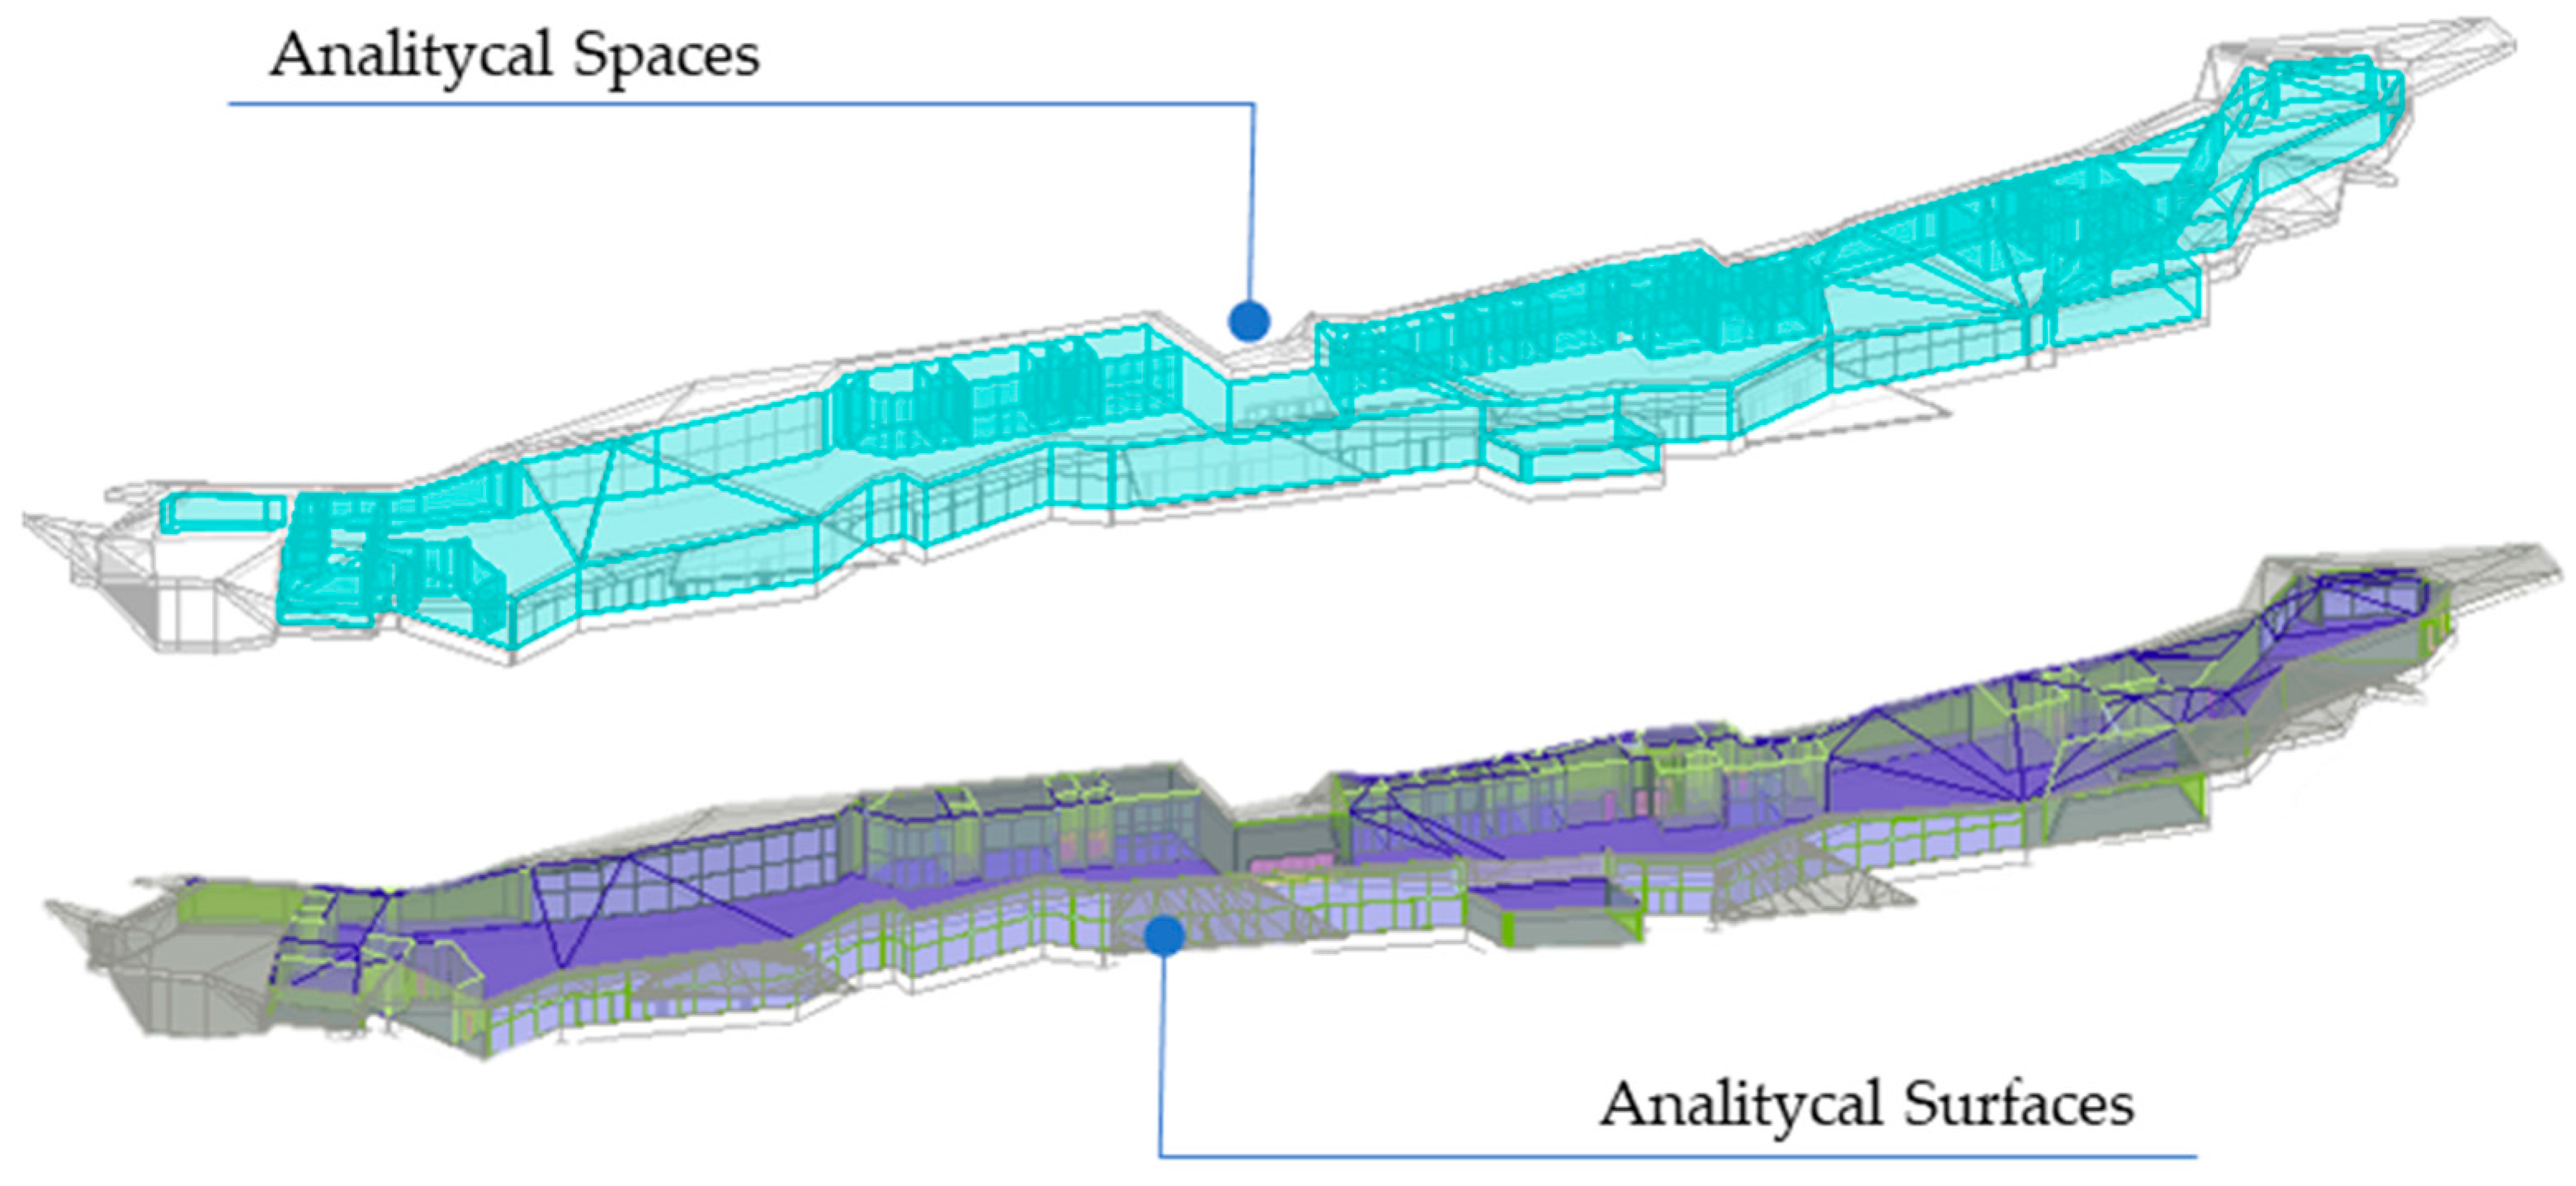
2.4. BEM Model Development

The energy model was created by means of the suitable features of Autodesk Revit that allow the automatic generation of analytical spaces and surfaces. Such objects contain the information embedded in the BIM database, inputted during modelling, and then collected in the gbXML. The energy model was then reviewed to ensure the proper boundary conditions to spaces and surfaces. Whenever required, the BIM model was simplified, keeping the lower LOD boundary of 200, in order to generate a more trustable energy model.
In Figure 6, both analytical spaces and surfaces are highlighted to show how the final building envelope model appears.
HVAC systems were schematically defined as energy objects included in the gbXML by means of the plant templates of the new Revit Systems Analysis tools. Specifically, air loop, and hot and cold water loops, were linked to radiant panel zone equipment. Those plant components do not reflect the actual complexity of the HVAC systems of the case study, however, they serve as the basis for more accurate modelling. By performing a systems analysis simulation, a detailed OpenStudio model is generated from gbXML by means of a suitable script (OpenStudio workflow) including commands to automatically manipulate the model. The latter was purposely modified to include custom simulation settings and collect specific outputs. Furthermore, some default OpenStudio measures were modified to reflect the modelling purposes of the authors. A list of the subroutines (OpenStudio measures) used to translate the gbXML information in a readable format for the BEM tool is provided in the previously shown Figure 2.

2.5. Model Manipulation and Review

The energy model was further elaborated in order to simulate the real system configuration designed for the terminal of Molo Beverello. Thus, after gbXML exporting, the HVAC system was rearranged to account for its higher complexity. Baseboard zone equipment were added to bathrooms and, two mixing valves were included in the piping system to mix supply and return water of radiant floor (Figure 7). Furthermore, an air-to-air heat exchanger was added to the air loop and, both air loop and water loop controllers were adapted to the operation strategies of the systems. Operation temperatures and the size of plant equipment were then adjusted to fully characterise them. All changes in the HVAC configuration were made with the help of OpenStudio Application, a user-friendly GUI to perform whole-building energy simulations by OpenStudio/EnergyPlus.
The energy model described so far is the one adopted as a reference for comparison with other energy-saving measures. Specifically, the following were considered as candidate strategies to enhance energy efficiency or reduce annual primary energy consumption:
-
Proposed System 1 (PS1), water-source heat pump;
-
Proposed System 2 (PS2), heat recovery from chiller condensers;
-
Proposed System 3 (PS3), replacement of window facade with photovoltaic glass;
-
Proposed System 4 (PS4), replacement of shading systems with photovoltaic canopies.

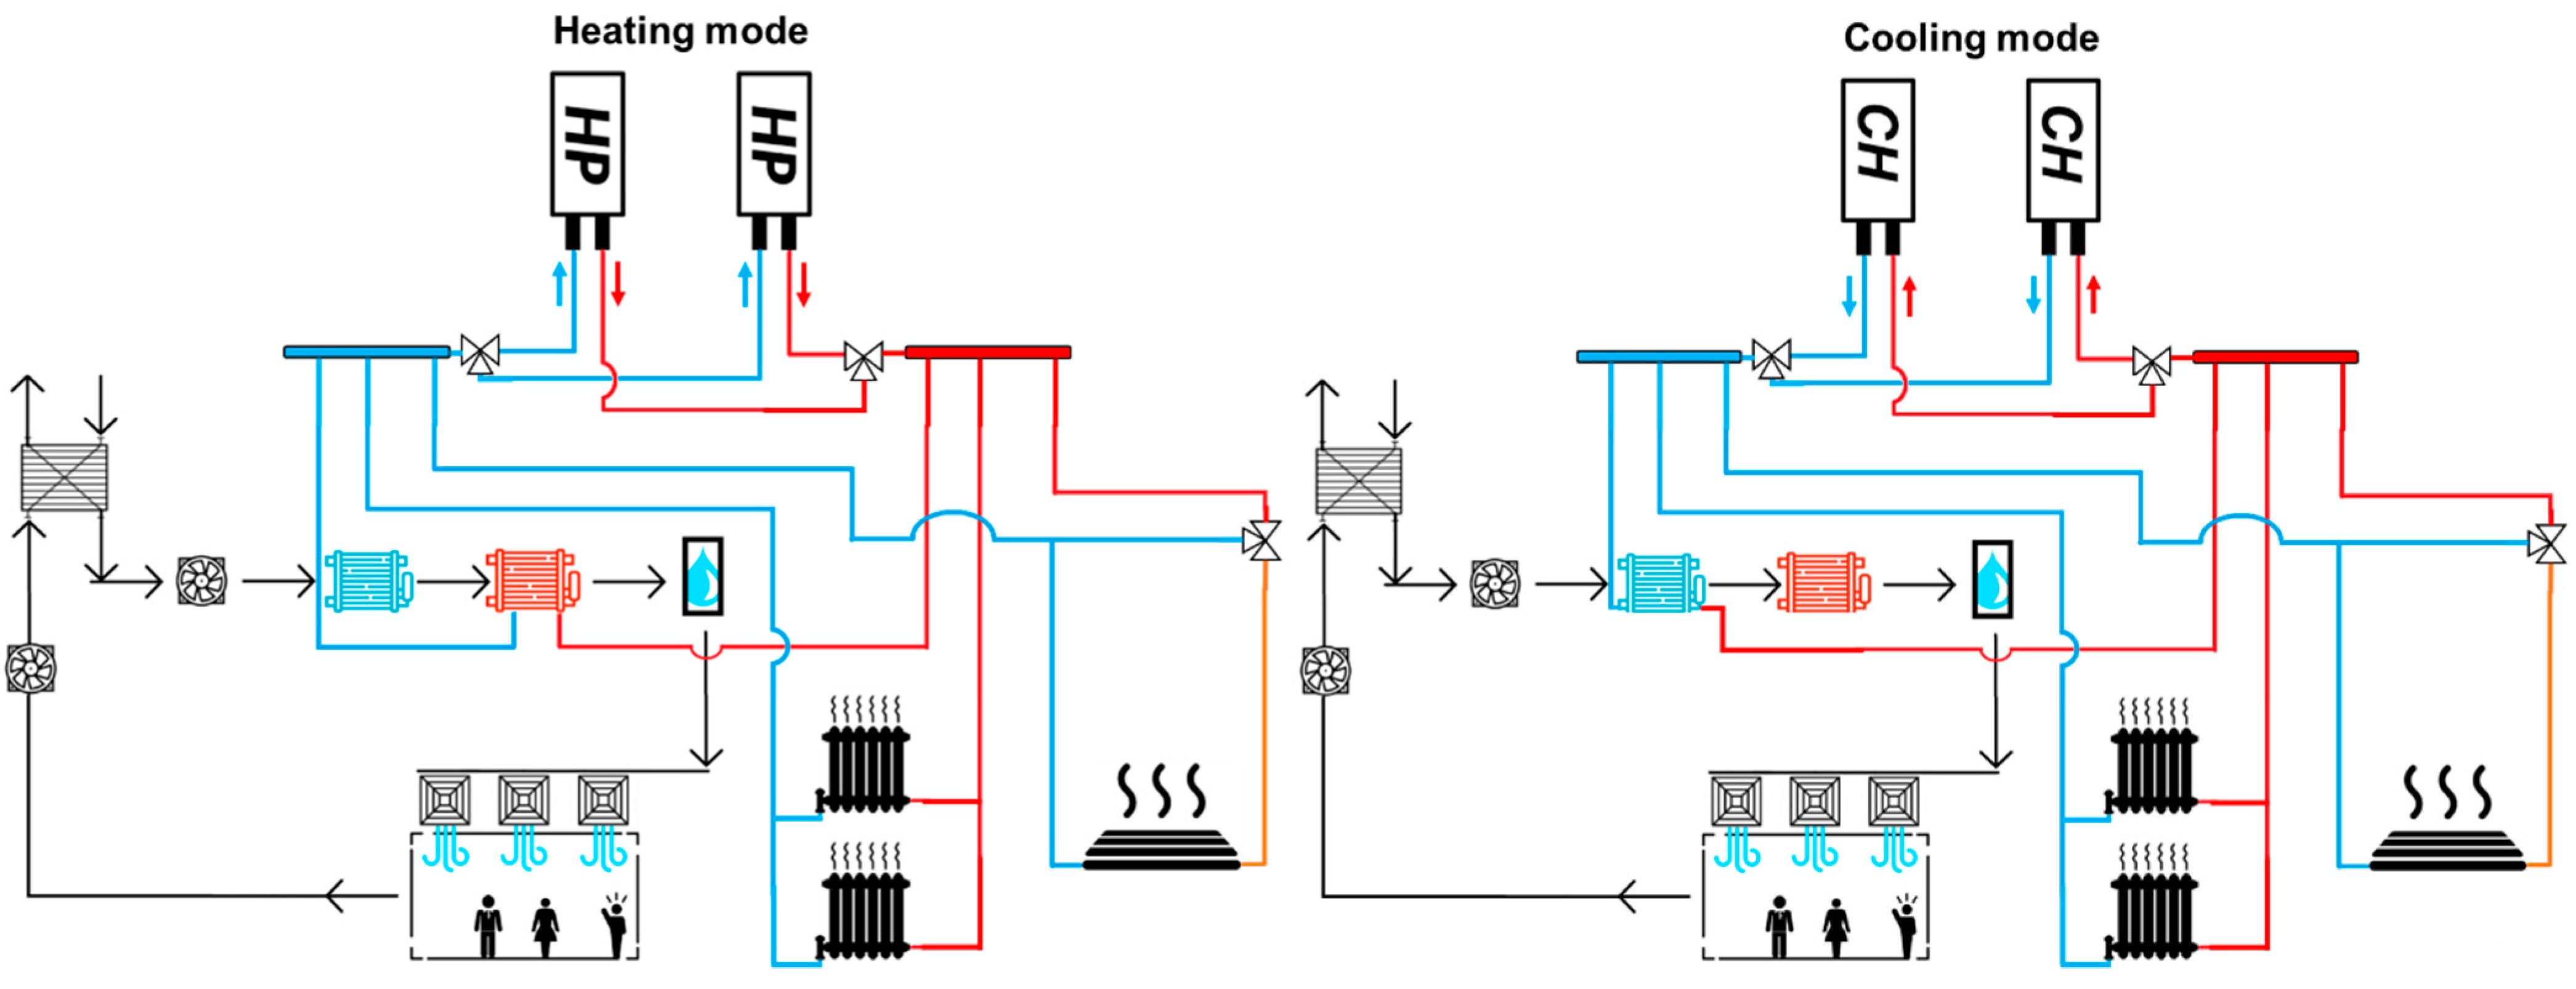
2.5.1. Proposed System 1: Water-Source Heat Pump

Water-source heat pumps (WSHP) are generally more efficient compared with equivalent air source ones (ASHP). As the analysed building is close to the sea, such a solution can reduce the electricity consumption of heating and cooling generation systems. The water-source heat pump exploiting the free thermal energy of seawater was modelled accounting for the seawater temperature variation. The water-source heat pump was selected among the products available on the market, chosen according to the system’s needs. The characteristics of the machines at nominal conditions were provided by manufacturer: cooling capacity, 140.5 kW (use side 12–7 °C—source side 30–35 °C, EER: 5.147); heating capacity, 160.4 kW (use side 40–45 °C—source side 10–6.7 °C, COP: 4.493). The extra cost of the implementation of WSHPs compared to the ASHPs is EUR 40000.
Historical data of the average temperature of the seawater of the port of Naples (shown in Figure 8) were used to evaluate the improved performance of the HVAC system [52].

2.5.2. Proposed System 2: Heat Recovery from Chiller Condenser

As during summer operation both cooling and reheat coils work at fixed temperatures, chillers work to simultaneously provide hot and cold water. The recovery of the chiller condensing heat can be used to fully or partially heat the water that feeds the reheat coils of the AHU. However, chiller heat recovery can involve a performance drop depending on condensing temperature. Thus, a parametric analysis of system operation was carried out accordingly, to identify the optimal recovery temperature providing the least final electricity consumption. Specifically, recovery temperatures ranging from 25 °C to 50 °C were simulated and three characteristic parameters were used for evaluation:
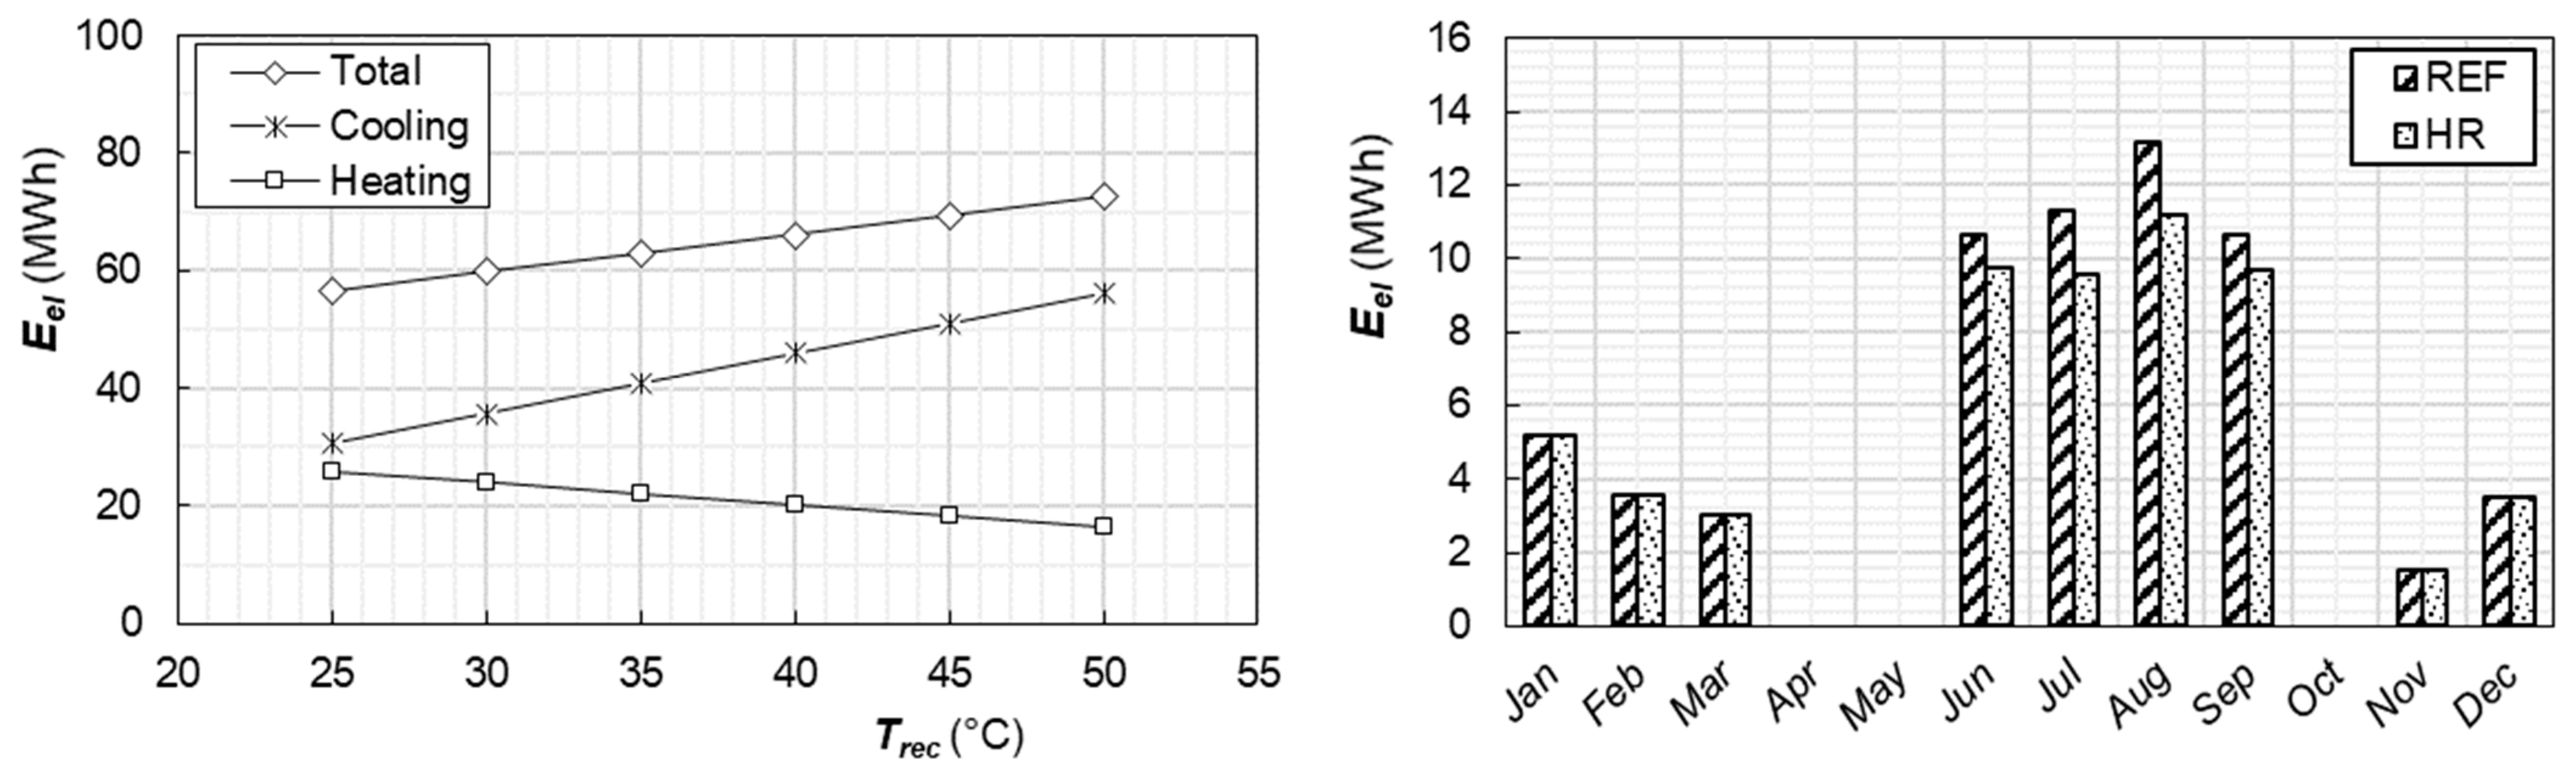
  • Electricity for heating is expected to decrease, as the higher the recovery temperature, the lower the thermal power required for reheat coil;
  • Electricity for cooling is expected to increase, as the higher the recovery temperature, thus condensing temperature, the lower is the efficiency of the machines;
  • Total electricity for heating and cooling is the total electricity required by chillers and is the parameter to optimise.
The modifications to the system to allow the condensation heat recovery have an estimated cost of around EUR 2000.

2.5.3. Proposed System 3: Replacement of Window Façade

The terminal presents a large window façade on the south-east side that can be used to produce electricity through photovoltaic technologies.
The choice of replacing the glass facades with photovoltaic glass is due to the fact that installation of a large number of photovoltaic panels on the building roof is not possible since the roof is also used for pedestrian transit. In order to not compromise the lighting conditions inside the building, the selected photovoltaic panels are made of amorphous transparent or semi-transparent silicon, in order to allow enough daylighting. However, these types of photovoltaic panels have relatively low efficiency (3–4%) and therefore in order to make the investment affordable from both an economic and an energy point of view, a multiobjective optimisation was carried out in order to evaluate the most viable solution. Several types of photovoltaic panels with different efficiencies, SHGCs, U-values, and transparency conditions were considered. The analysed glass is an amorphous silicon photovoltaic glass with two 6 mm low-emission glass and a 12 mm Argon chamber, its characteristics for three different types are shown in Table 3.
In addition, to maximise the produced electricity, the shading surfaces outside the building have been removed. The window façade was divided into 3 zones in order to select the most effective amount of photovoltaic glass. The sectors of the façade that would be replaced are shown in Figure 9. For each type of glass, the replacement of Zone C (area of 109.4 m2), Zone B+C (area of 278 m2), and Zone A + B + C (area of 414.27 m2) were respectively investigated.
The first combination involves only zone C as it is the area that receives the most incident solar radiation. Thus, the optimisation involved a total of 9 combinations. The study carried out was a multiobjective optimisation with the aim of identifying the most advantageous solution both from the energy and economic point of view. The objective functions considered for optimisation were the net present value (NPV), calculated by Equation (6), and the primary energy saving (PES), calculated by Equation (3) (see next section). These parameters also assessed the difference in heating and cooling loads due to the installation of new photovoltaic glass. Although there are interesting contributions due to electricity generation, installation of such systems may lead to an increase in thermal needs due to their different solar heat gain coefficients (SHGC) and U-values compared to the reference system. Specifically, the increase of heating loads may occur since new glasses allow lower free solar gains. Vice versa, this can lead to a decrease in cooling loads.
To assess the productivity of photovoltaic glass, the incident and diffuse solar radiation on each panel have been evaluated, accounting for any possible shadings. The considered amorphous photovoltaic glasses have capital costs in the range of 104–109 EUR/m2 depending on transparency degree, applied to conduct the economic analysis.

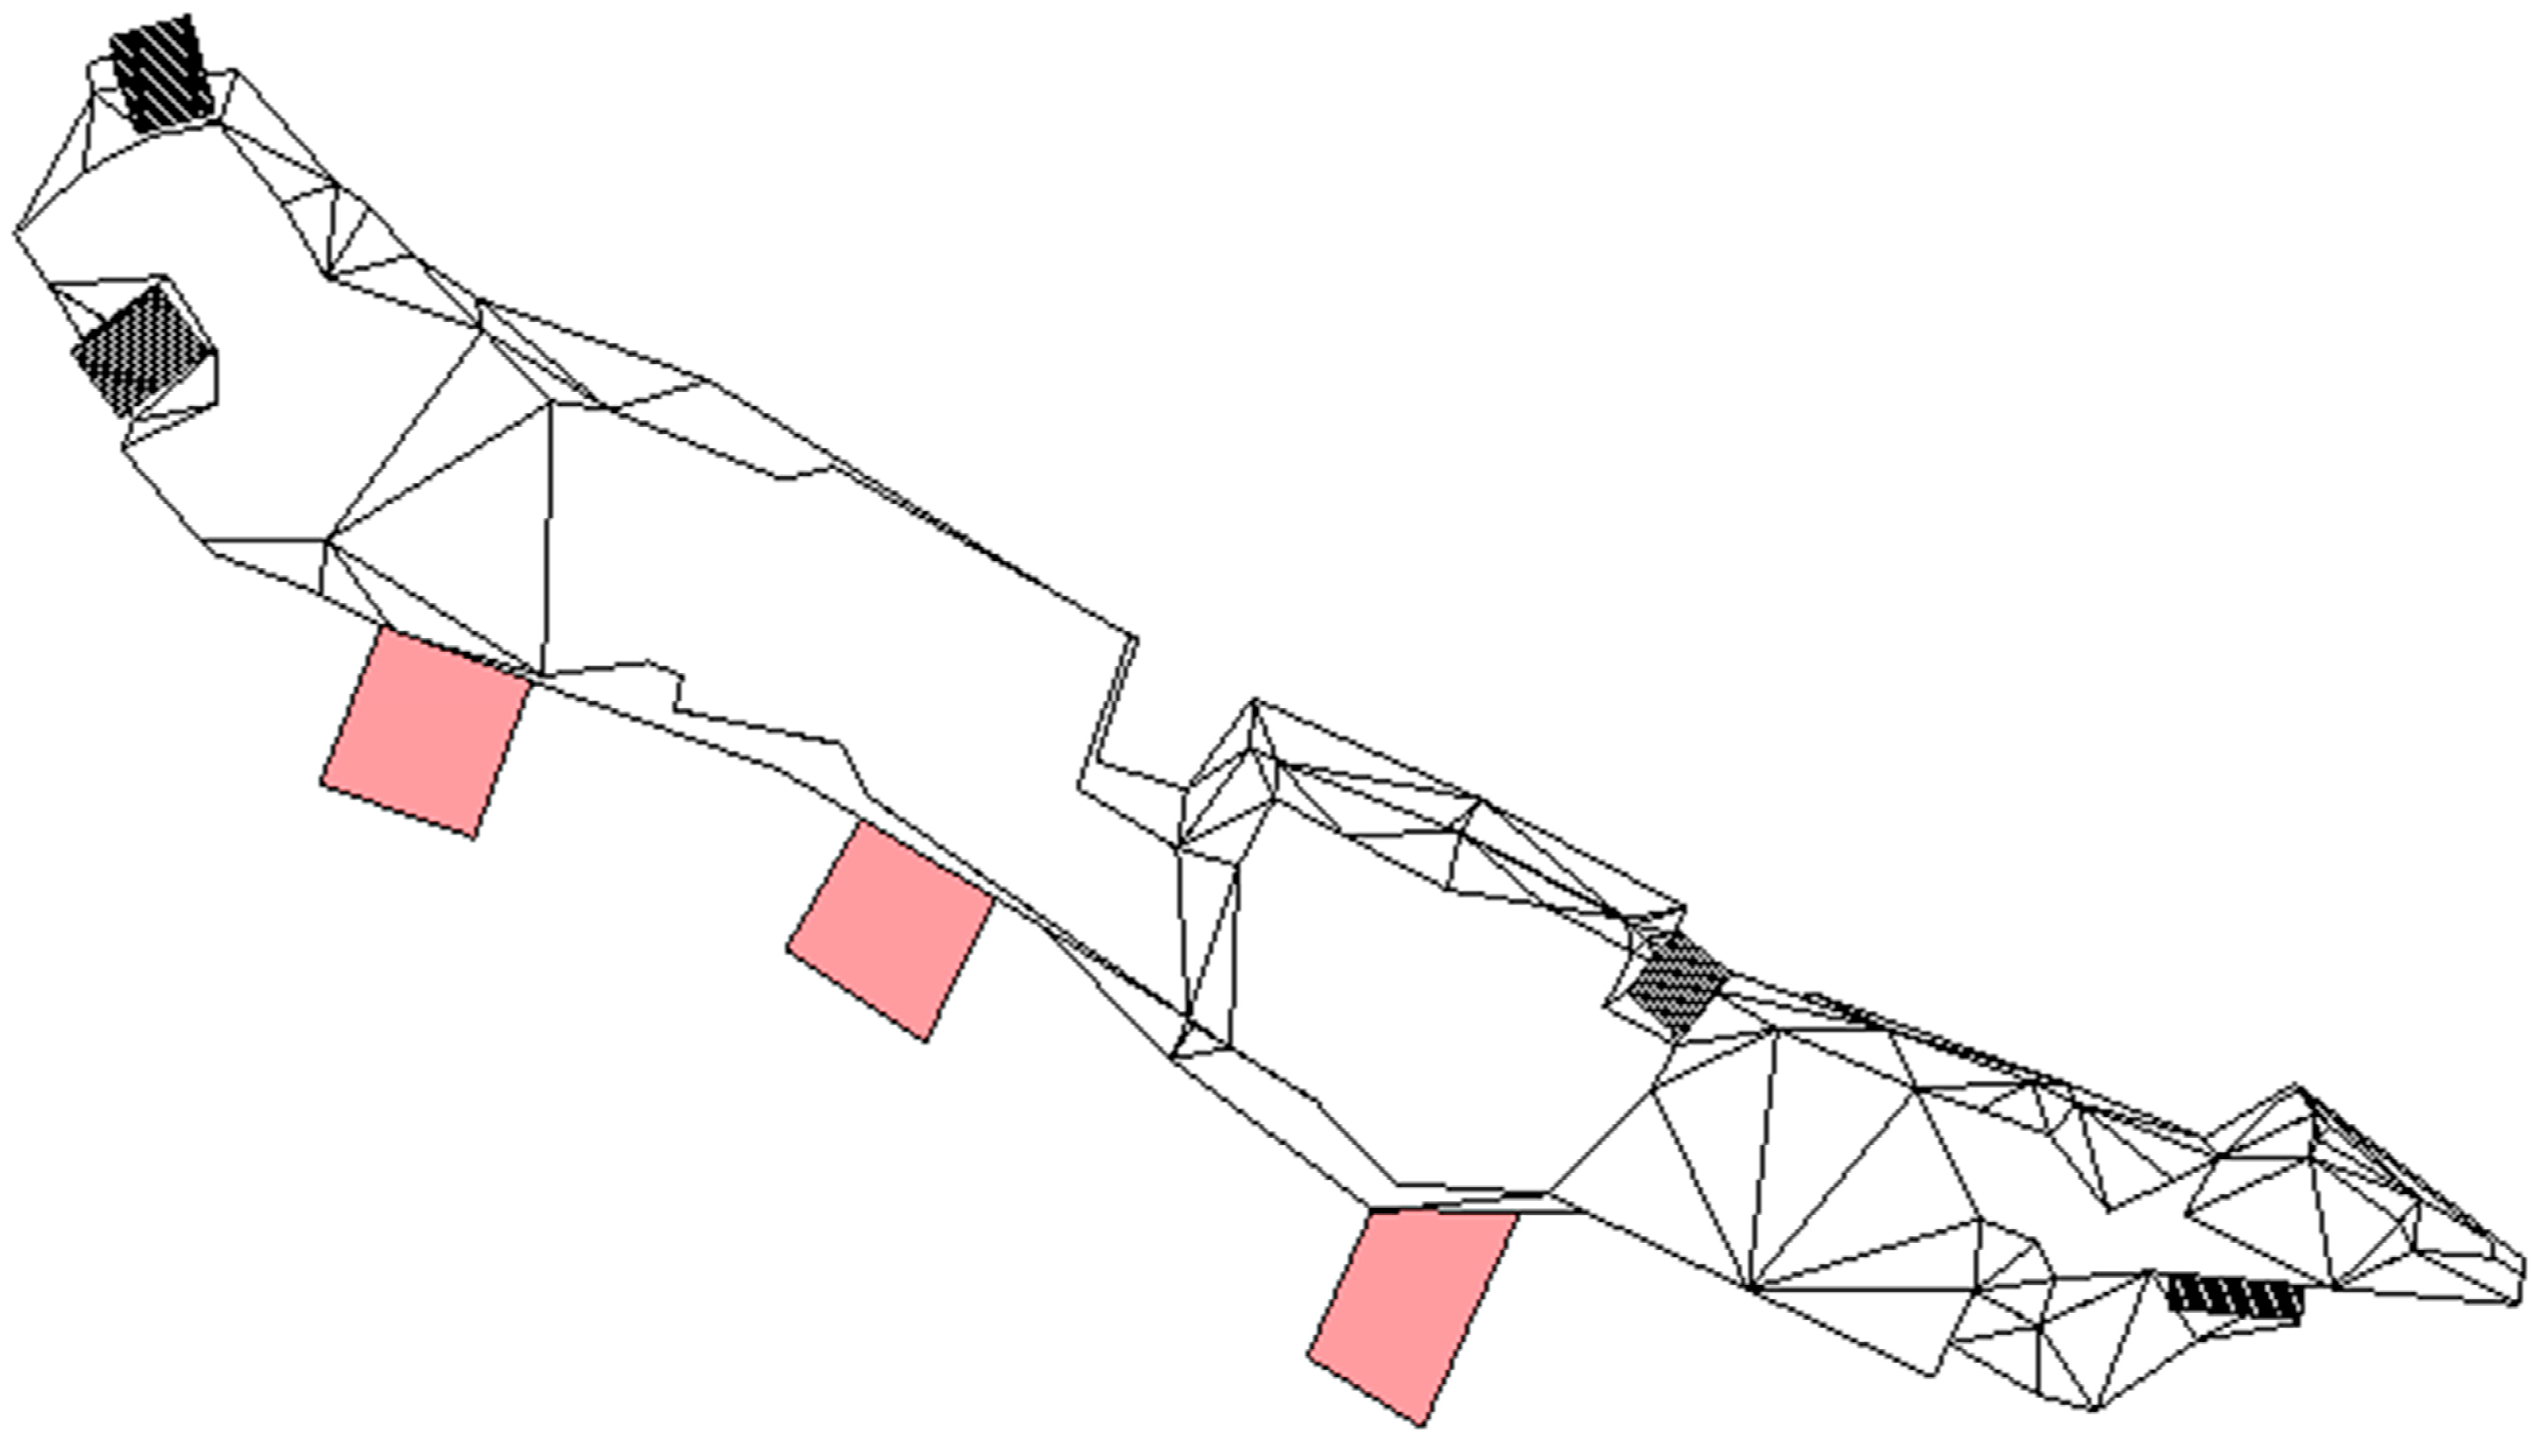
2.5.4. Proposed System 4: Photovoltaic Canopies

At the end of the study of energy efficiency solutions, the hypothesis of the installation of photovoltaic canopies was evaluated. These structures have been inserted in place of the tarpaulins outside the building so as not to vary much the structure and ensure the same solar shading, the coloured surfaces in Figure 10.
Monocrystalline silicon panels with nominal efficiency of 18.4% and a rated power of 300 W were selected. The overall extension of the canopies is 366 m2, so 230 photovoltaic modules were installed for a total rated power of 69 kW. A capital cost of ~250 EUR/m2 was considered, accounting for all the necessary technologies that comprises the plant.

2.6. Simulation and Post Processing

The simulations were carried out by means of the EnergyPlus built-in features with a timestep of 15 min, providing detailed outputs to analyse the building behaviour, as well as the performances of the systems. Variables and Meters referring to zone air conditions, thermal gains, heating and cooling systems’ capacity rates, and electricity consumptions were processed to evaluate the project from an energy and economic point of view. Each proposed strategy (prop) was compared to the baseline, also called Reference building (ref), in order to calculate the indices for decision-making that are described below.
The conversion of calculated electricity into primary energy was carried out by means of the factor ηel representing the average efficiency of the entire Italian generation system (ηel = 0.46)
E p = E e l η e l
The primary energy saved (ΔEp) and the primary energy saving (PES) related to the proposed scenarios with respect to the reference case, are calculated as:
Δ E p = E p , r e f E p , p r o p
P E S = 1 E p , p r o p E p , r e f
Similarly, the avoided carbon dioxide emissions are evaluated by Equation (4) considering the emission factor fCO2 equal to 0.2.
Δ E C O 2 = Δ E p · f C O 2
Finally, to assess the economic profitability, the simple payback period (SPB) is calculated as:
S P B = I 0 Δ C
where I0 is the investment cost and ΔC are the cost differences between reference and proposed scenarios. At last, net present value (NPV) and profit index (PI) are also evaluated as:
N P V = Δ C · { 1 p · [ 1 1 ( 1 + p ) N ] } I 0
where p is the interest rate and N is the life time span. In this study, NPV was calculated taking into account an interest rate and a useful life of 5% and 20 years, respectively.
P I = N P V I 0
The procedure adopted to account for the variability of EER in different working conditions follows the procedure suggested by the Italian standard UNI TS 11300 [53], indicated hereinafter. It is important to note that EER is calculated at each simulation timestep, indicated in the following equations by the index i. The same procedure was carried out for the COP in heating mode.
The calculation involves the normalized efficiency curves of the considered generators EERn,PLR depending on heat pump/chiller PLR and that was obtained from the real operating curve provided by manufacturers, the maximum EERmax calculated by Equation (8), and the exergetic efficiency ηex calculated by Equation (9).
E E R max = T e v , n o m Δ T e v ( T c o , n o m + Δ T c o ) ( T e v , n o m + Δ T e v )
η e x = E E R 100 % E E R max
Here, Tev,nom, and Tco,nom are the evaporator and condenser temperatures respectively, while ΔTev and ΔTco are the average heat exchanger temperature differences at the evaporator and condenser. The latter are equal to 5 or 10 °C, depending on whether the heat exchange occurs with water or air.
Therefore, the actual EER at specific outdoor conditions is defined by Equation (10).
E E R i = T e v , i Δ T e v , i ( T c o , i + Δ T c o , i ) ( T e v , i + Δ T e v , i ) · E E R n , P L R · η e x
The price of electricity used to evaluate economic savings was 0.20 EUR/kWh.

3. Results and Discussion

This section provides the simulation results of the energy-saving measures investigated to improve the efficiency of the selected building and to analyse the suitability of the BIM to BEM methodology in the maritime sector.

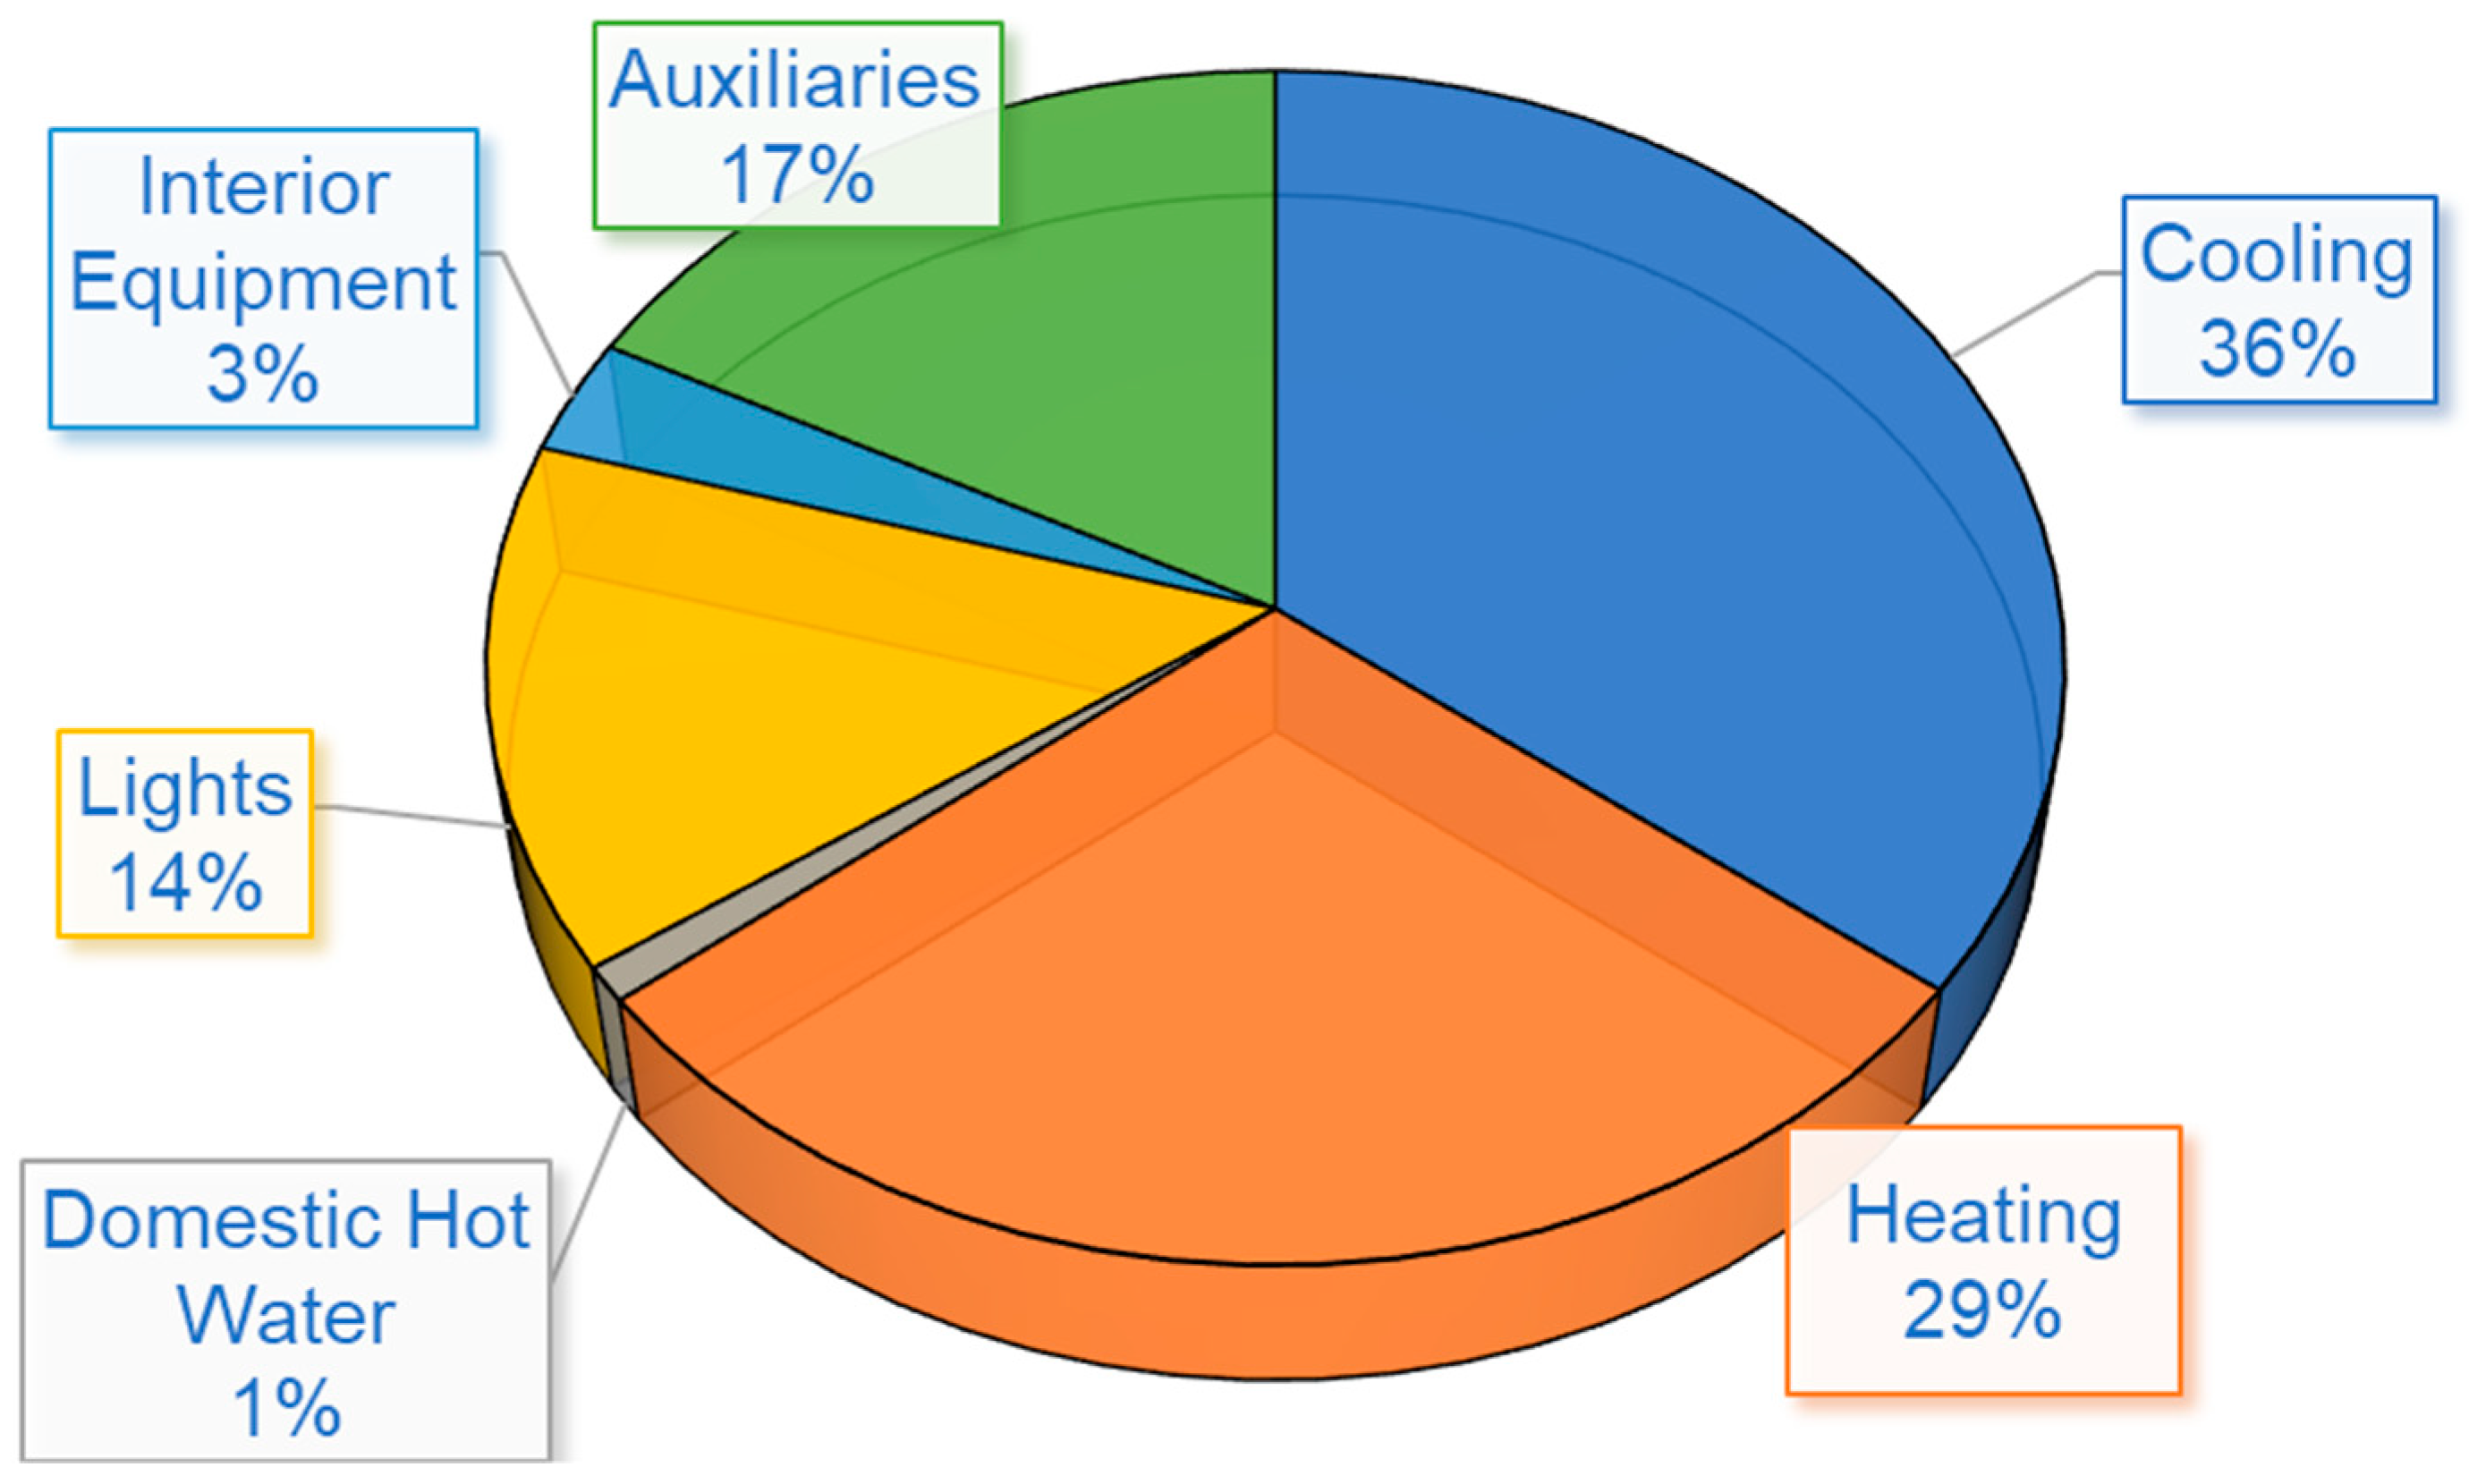
3.1. Reference Building

The building-plant system, as described in Section 2.1 and Section 2.2, has been taken as a baseline for comparison purposes. At the same time, the BEM model of the Reference Building (REF) was thoroughly revised to test the accuracy of the simulation results.
It is worth noting that an optimization of the model LOD was made during the modelling process in order to achieve a trade-off between accuracy and time for the entire simulation procedure. Although more detailed models (LOD > 300) achieve more accurate calculations, longer process times are obtained due to complex modelling problems and higher computational load (greater number of building envelope surfaces or thermal zones). Conversely, LODs that are too low (< 200) would speed up the process and lose the reliability of the simulation results. Therefore, an intermediate LOD between 200 and 300 was selected to obtain an optimal compromise to apply to the considered design procedure.
Indoor air conditions compared to outdoor temperature are depicted in Figure 11, showing the model capability to reflect the actual system operating strategies. The chart also highlights the correct operation of the system that keeps temperature and humidity within the acceptability ranges, i.e., 20–26 °C and 40–60% for indoor temperature and relative humidity respectively.
The overall energy consumption shares of the reference building were calculated and are reported in Figure 12, while baseline values such as thermal energy, electricity, and primary energy usage are summarized in Table 4. Space heating and cooling were the main facility energy needs, followed by lighting, and air conditioning auxiliary equipment. The proposed solutions, described in the next paragraphs were chosen to significantly reduce both energy demand and primary energy consumption.

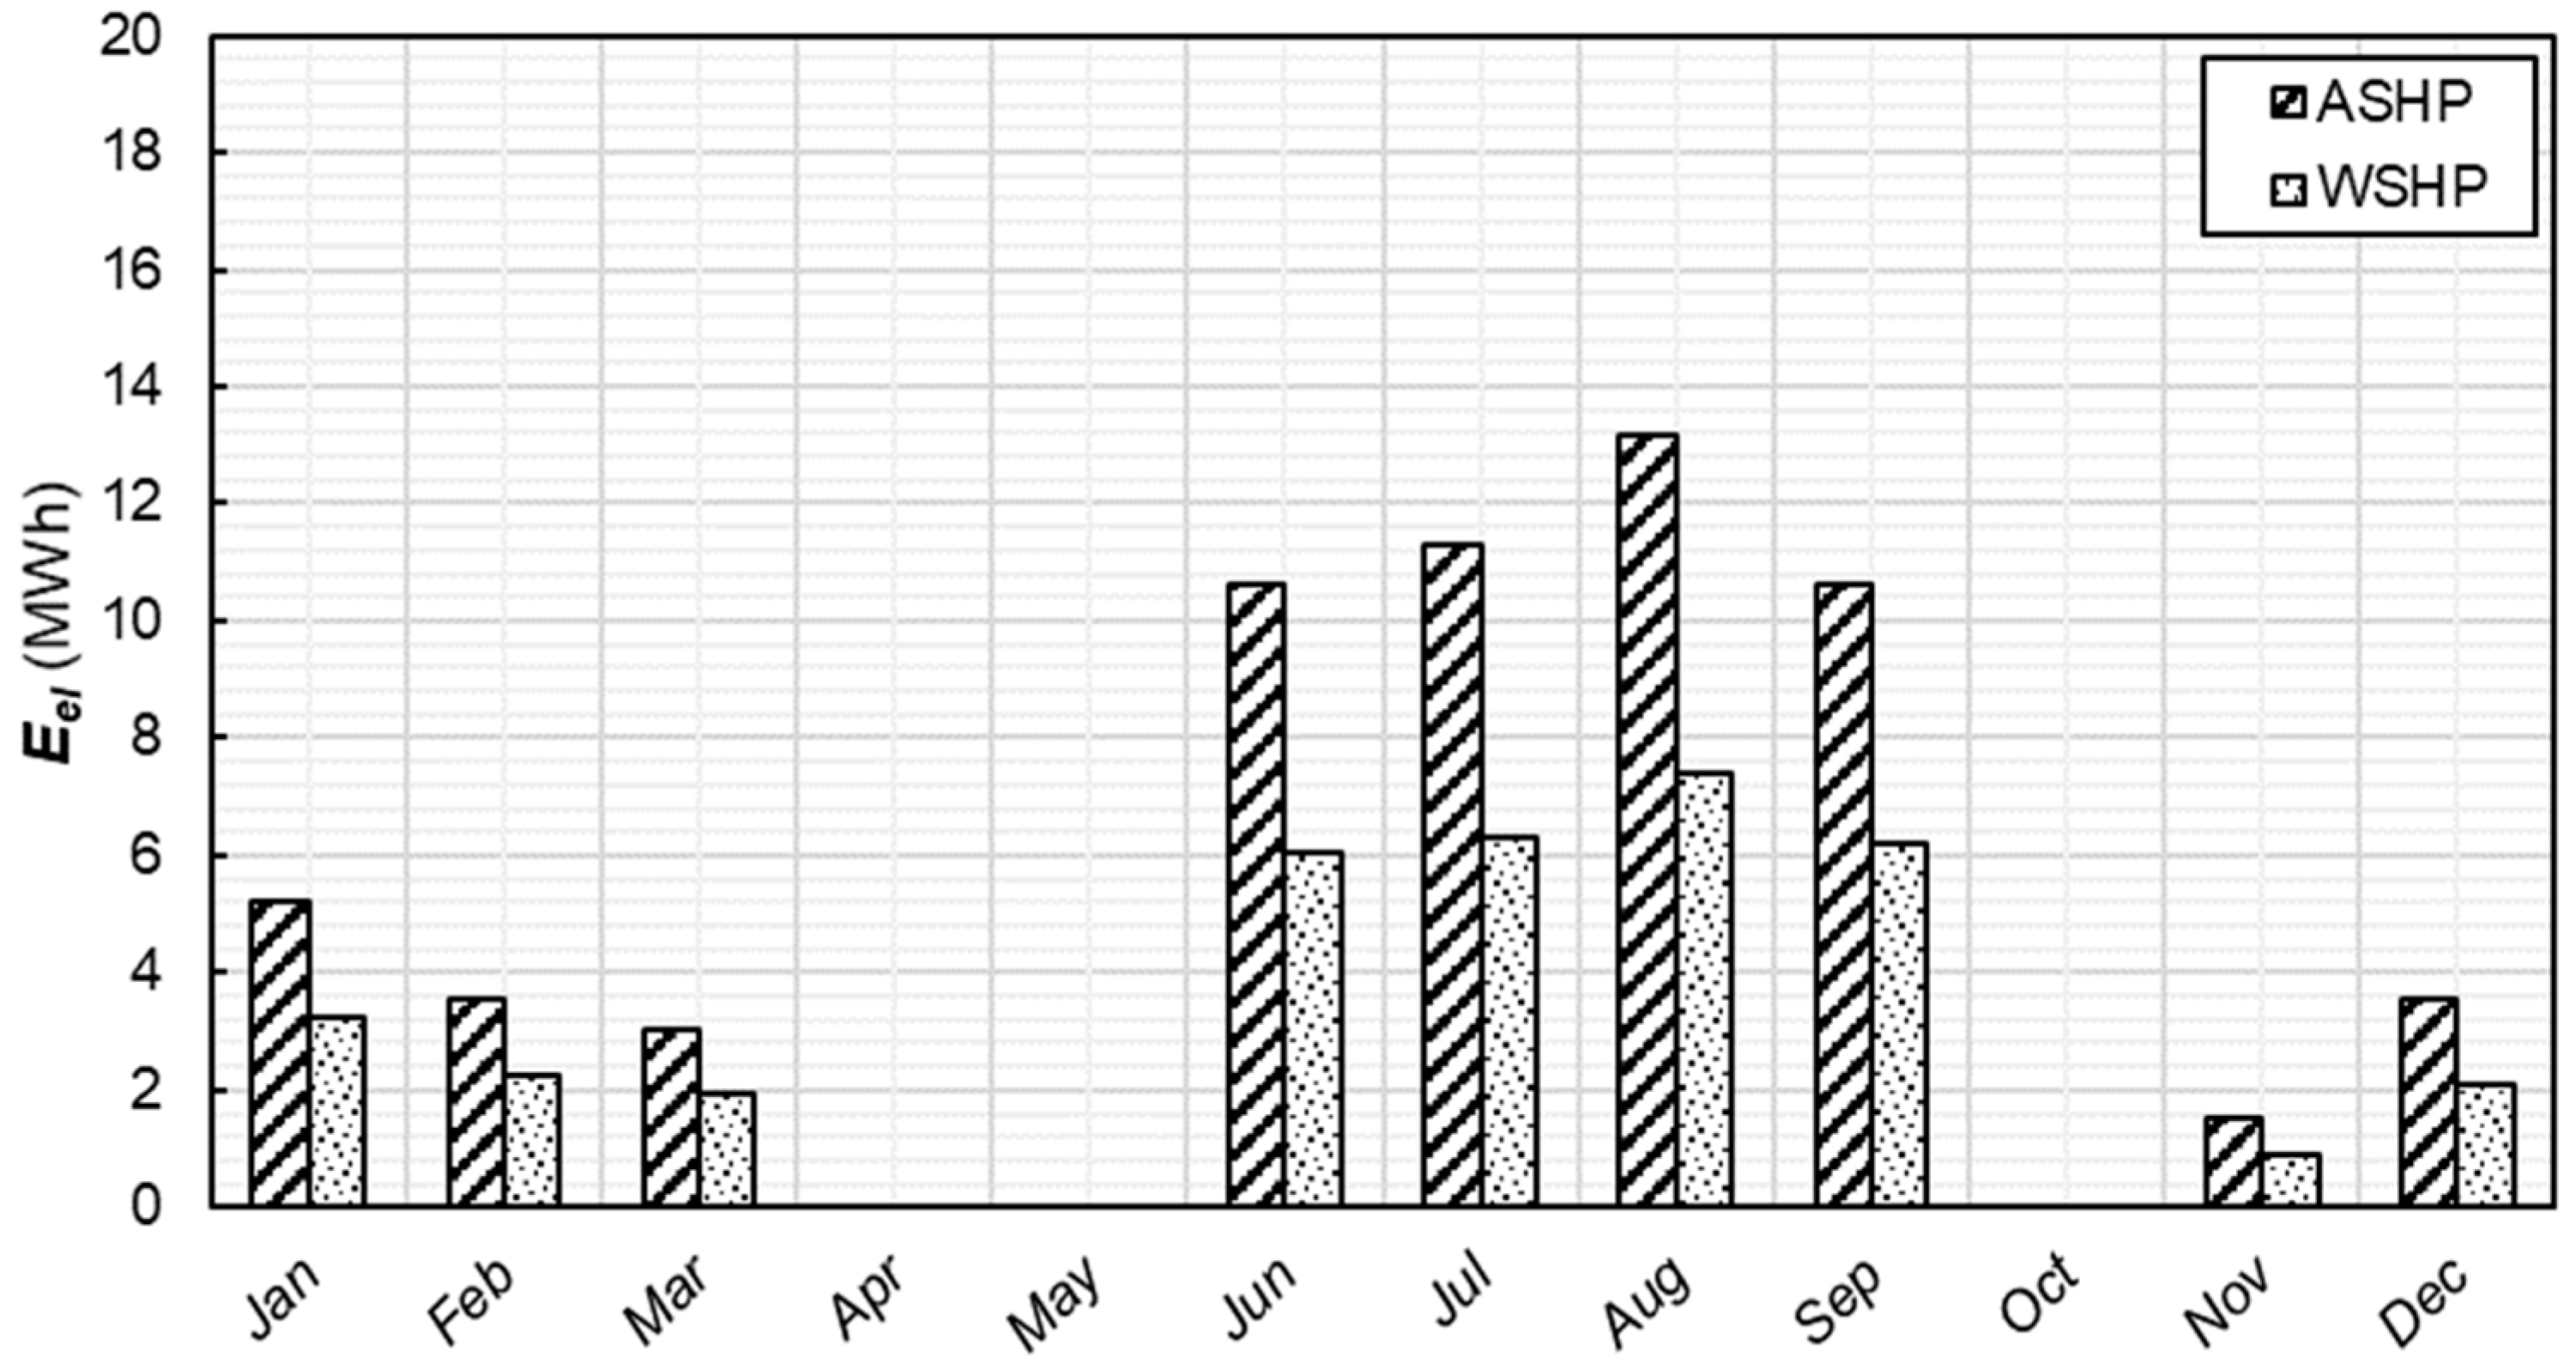
3.2. Water Source Heat Pump

A WSHP requires lower energy intensity than an ASHP to meet the thermal loads for space heating and cooling in Naples. Indeed, the seawater temperature is particularly favourable, being less variable and, on average, lower during summer and higher during winter than the ambient temperature (see Figure 8).
The highest performance is observed during the summer season, when the Coefficient of Performance (COP) is higher, and both cooling and heating services are required. The convenience of adopting WSHP instead of ASHP for the project is demonstrated in Figure 13, where the electricity demand for the reference and proposed cases are compared.
The proposal allows a saving of 42% of the total primary energy consumed by the building in one year. Further metrics related to the measure of WSHP, such as actual CO2 emissions and total primary energy consumption are summarised in Table 5.

3.3. Heat Recovery from Chiller Condenser

As expected, while heat recovery involves a lower electricity consumption for heating, cooling results in a lower performance at the higher heat recovery temperature. The increase in electricity demands for cooling prevails over the decrease in electricity demands for heating, which leads to a slight rise in the total electricity curve. The behaviour of the new plant configuration, in terms of electricity consumed to produce the required thermal energy, is shown in Figure 14.
Therefore, the result of the optimisation indicates overall energy savings at low heat recovery temperatures, the highest performance is obtained by preheating the reheat coil water at 25 °C. Furthermore, while a deterioration in the performance of chillers is registered, the performance of the second heat pump in the heating operation improved as it works at lower part-load factors with higher efficiency. The effects discussed so far make optimisation necessary as they are in contrast to each other.
Figure 14 also shows the monthly electricity consumption of the system equipped with the heat recovery (HR) at 25 °C compared to the reference one. This measure is interesting as it provides significant savings (up to 10.2%) in terms of primary energy against very low investment costs for piping works and additional heat exchangers. The annual electricity and primary energy consumption, as well as carbon dioxide emissions, are reported in Table 6.

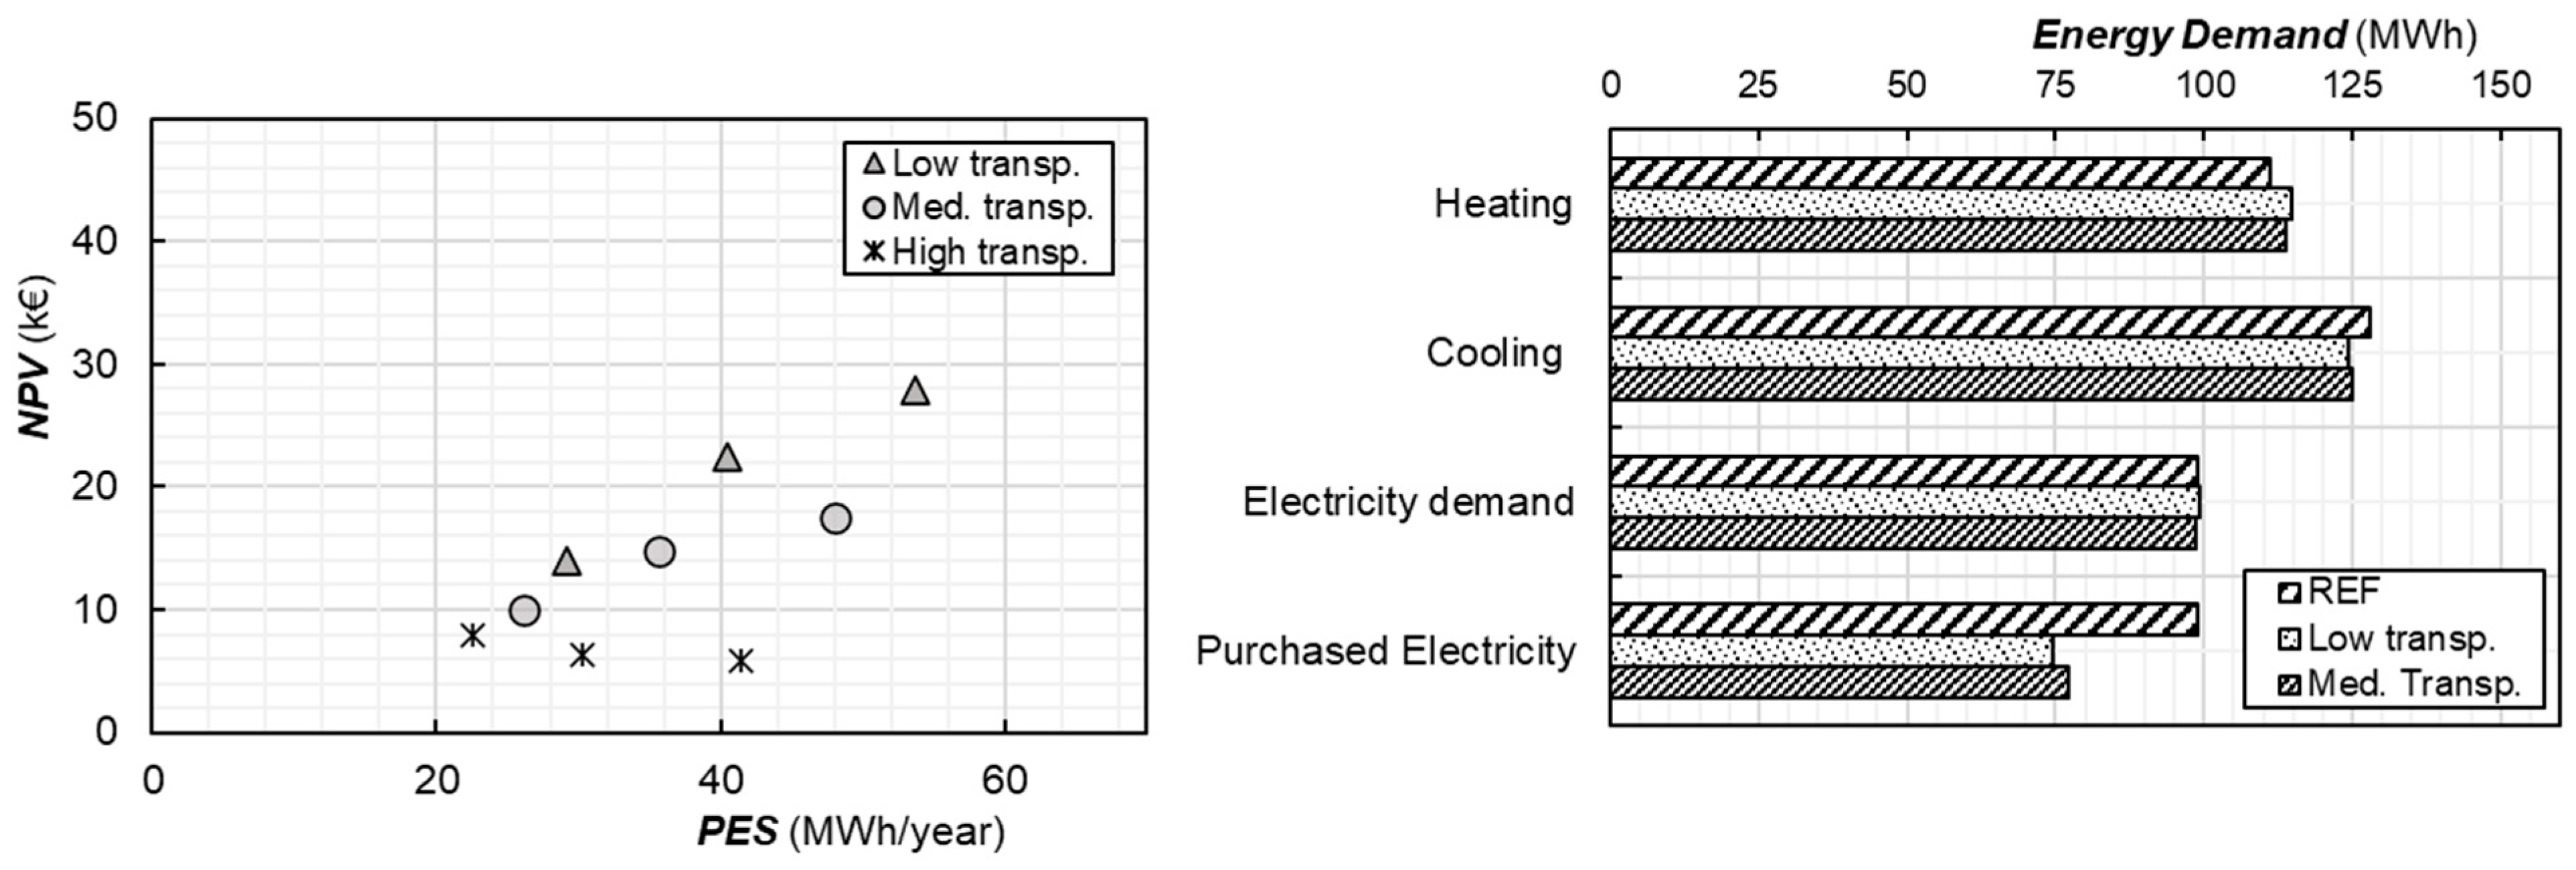
3.4. Replacement of Window Façade

Among the configurations described in the methodology section, the implementation of the low transparency glazing over the entire available surface (A + B + C) is the most profitable solution, both from an economic and energy point of view. The results of the multiobjective optimisation conducted are summarised in Figure 15. Here, it is also possible to note that the low transparency technology always provides better performance compared to medium or high transparency ones. However, low transparency glass can significantly affect daylighting and the visual comfort of occupants. Therefore, the medium transparent configuration (20% of visual transparency) on the whole façade (A + B + C) has been also considered as a valuable solution in terms of NPV and PES.
Figure 15 also shows the effects that the adoption of the two selected configurations have on the heating and cooling needs, as well as the electricity demands of the building. As the photovoltaic glass has a very low SHGC, the winter solar gains result is lower than traditional glazing systems which causes the increase of heating loads. However, summertime solar gains are lower with the consequent decrease of cooling loads. The sum of these two effects leads to a slight increase in electricity demand with low-transparent glasses (99.2 v.s. 99.1 MWh/year), in contrast, medium-transparent glass entails a slight reduction in electricity demand (99.0 v.s. 99.1 MWh/year).
Obviously, the main advantage is due to the remarkable reduction in electricity purchased from the grid which leads to ~25% of PES values. The savings of electricity, primary energy, and CO2 are presented in Table 7.

3.5. Photovoltaic Canopies

The proposal to install a photovoltaic system, such as the one described, allows a PES value of about 40%. The dynamic analysis conducted on the incoming and outgoing energy fluxes shows a substantial saving of the energy required from the grid. The monthly electricity that is effectively purchased from the power operator is reported in Figure 16.
As for previous analyses, further metrics, useful for decision-making, are provided in Table 8.

3.6. Economic Assessment of Proposed Systems

The analysed energy-saving solutions, shown in Table 9, were also assessed from the economic point of view, taking into account both the energy market prize and capital costs of the considered systems that are provided in the previous sections. All measures lead to significant savings and attractive returns on investments, among which, the HR provides the highest PI, equal to 7. Although it has the lowest NPV after 20 years, the very low capital costs and the simplicity of the technology make the HR the most profitable solution. More in detail, concerning the thermal power plant, the PS1 provides the highest rate of primary energy saving, nevertheless, such a solution requires substantial investment costs that lead to a SPB value of circa 8 years. Given the possibility of exploiting sea water, a system based on the WSHP is certainly a very efficient solution to take into consideration, despite the higher costs. Indeed, all the alternatives investigated to reduce electricity demand from the power grid are viable from the economic point of view. While both low- and medium-transparency photovoltaic glass (PS3) are less impacting and do not require dedicated supporting structures, traditional PVs (PS4) are more efficient and return major savings (8.1 k EUR/year). However, traditional PVs are more expensive returning higher SPB (~10 years) with PI equal to 0.3.

3.7. About BIM to BEM Methodology

Simulations provide useful insights and proofs for informed decisions. By means of energy consumption calculations, designers and facility managers have very useful data for value engineering and sustainable management. The adopted approach has been found to be very convenient at an early stage of the project when energy analyses can guide concept design. BIM to BEM can also be successfully implemented in renovation projects, as demonstrated in this paper by means of a comparison of different efficiency measures. Furthermore, the proposed method helps in the enhancement of the integrative design and to reduce project timing by avoiding the creation of redundant and time-consuming models, and by improving data management. However, some difficulties have been encountered during the process that are worth pointing out.
Although the effort of simplifying the BIM model, the automatic generation of BEM model geometry can often present inaccuracies such as missing surfaces or their fragmentation. Such issues can occur at the gbXML definition within the BIM environment or during information transfer. Therefore, troubleshooting requires iterative geometry generation that can be very demanding and tedious.
While geometry export by gbXML is generally complete, HVAC systems still present many limitations regarding either plant configurations or working and control parameters. Customisation of HVAC components should be carried out afterwards by means of the BEM modelling tools or by creating custom BIM parameters and suitable measures parsing the gbXML and manipulating the existing plant templates. Although the latter is a consistent, sharable, and scalable solution, it requires specific modelling and programming skills which could discourage the adoption of advanced energy modelling.

3.8. Continous Improvement in Port Building Management

The analysis carried out proves the validity of the BIM to BEM methodologies for the design of port buildings and other buildings in general. In addition, this study also shows that the methodology is suitable as a tool in facility management and continuous improvement processes.
The major quality and energy management standards such as ISO 9001 and ISO 50001 suggest and encourage the adoption of the plan-do-check-act (PDCA) cycle which is the operating principle to guarantee effective improvement. The ISO scheme is depicted in Figure 17; here, the BIM to BEM approach fits within the PDCA cycle to support decision-makers with data retrieved by the whole-building dynamic energy simulations. After the actions to reach goals of energy reduction are defined, both the BIM and BEM models should be continuously updated all over the cycle with newly added information to test the proposed energy-saving strategies and be aware of any unpredicted problems. Finally, when the cycle is abandoned because it has been successful, the new baseline is defined for future strategy planning considering the data and measurements collected during operation. In this way, the digital model accompanies the improvement process, facilitating the facility management and making the transition of the port areas toward reduction of air pollution and energy efficiency improvement easier and more effective.

4. Conclusions

This paper aims to critically analyse how BIM methodology coupled with whole-building energy modelling (BEM) and simulation can increase the effectiveness of sustainable design and management of buildings. In this framework, a novel workflow to extrapolate and convert BIM data into readable inputs for BEM has been developed and then tested via a suitable case study. The latter consists in the passenger terminal building of the maritime station of “Molo Beverello” in Naples, analysed by means of the developed methodology to identify energy efficiency strategies and reduce the overall primary energy consumption of the facility. Specifically, a detailed BIM model of the building was developed in order to automatically generate a reliable energy model exploiting the information included in the BIM database. The optimal modelling level of development (LOD) was chosen after an optimization procedure aimed at identifying the optimal trade-off between model accuracy and time costs of the whole simulation process.
Taking the current status of the project as a baseline, several energy-saving strategies were simulated by the developed workflow to evaluate their conveniences, such as: water-source heat pump, heat recovery from chiller condensers, replacement of window facade with special photovoltaic glass, and replacement of shading systems with photovoltaic canopies. The adoption of the selected measures always showed interesting outcomes from an energy, economic, and environmental points of view. Moreover, it is also interesting to notice how the approach used fits with the needs of the sustainability of buildings, both in the planning and management phases. The authors encourage other researchers to further develop this research topic with the aim of increasing interoperability between BIM and BEM software and underline the importance of energy analyses within the continuous improvement cycle that all major facilities, particularly in harbour areas, should take into consideration.

Author Contributions

Conceptualisation, G.F.G., C.F. and G.B.; methodology, G.F.G., C.F. and G.B.; software, G.F.G., C.F. and G.B.; validation, G.F.G., C.F. and G.B.; formal analysis, G.F.G., C.F. and G.B.; investigation, G.F.G., C.F. and G.B.; data curation, G.F.G., C.F. and G.B.; writing—original draft preparation, G.F.G., C.F. and G.B.; writing—review and editing, A.B. and A.P.; visualisation, G.F.G., C.F. and G.B.; supervision, A.B. and A.P. All authors have read and agreed to the published version of the manuscript.

Funding

This research received no external founds.

Institutional Review Board Statement

Not applicable.

Informed Consent Statement

Not applicable.

Data Availability Statement

The data presented in this study are available on request from the corresponding author.

Conflicts of Interest

The authors declare no conflict of interest.

Nomenclature

AECArchitecture, Engineering and Construction
AHUAir Handling Units
ASHPAir Source Heat Pump
BEMBuilding Energy Modeling
BESTBuilding Energy Software Tools
BIMBuilding Information Modeling
BPSwhole-Building Performance Simulations
CFDComputational Fluid Dynamics
DOEDepartement of Energy
ESPOEuropean Sea Ports Organisation
HVACHeating, Ventilation, and Air Conditioning
IDPIntegrated Design Process
IFCIndustry Foundation Classes
LCALife Cycle Assessment
MEPMechanical, Electrical, and Plumbing
nZEBnearly Zero Energy Building
PDCAPlan, Do, Check, Act
PERSPort Environmental Review System
PLRPart Load Ratio
PROPProposed Building
PSProposed System
REFReference Building
WSHPWater Source Heat Pump

References

  1. Darbra Roman, R.M.; Wooldridge, C.; Puig Duran, M. Available online: https://upcommons.upc.edu/handle/2117/333594?show=full (accessed on 10 June 2021).
  2. Barone, G.; Buonomano, A.; Forzano, C.; Palombo, A. Implementing the dynamic simulation approach for the design and optimization of ships energy systems: Methodology and applicability to modern cruise ships. Renew. Sustain. Energy Rev. 2021, 150, 111488. [Google Scholar] [CrossRef]
  3. Barone, G.; Buonomanoab, A.; Forzano, C. Sustainable energy design of cruise ships through dynamic simulations: Multi-objective optimization for waste heat recovery. Energy Convers. Manag. 2020, 221, 113–166. [Google Scholar] [CrossRef]
  4. Barone, G.; Buonomano, A.; Forzano, C.; Giuzio, G.F.; Palombo, A. Increasing renewable energy penetration and energy independence of island communities: A novel dynamic simulation approach for energy, economic, and environmental analysis, and optimization. J. Clean. Prod. 2021, 311, 127558. [Google Scholar] [CrossRef]
  5. Maturo, A.; Petrucci, A.; Forzano, C.; Giuzio, G.F.; Buonomano, A.; Athienitis, A. Design and environmental sustainability assessment of energy-independent communities: The case study of a livestock farm in the North of Italy. Energy Rep. 2021. [Google Scholar] [CrossRef]
  6. Barone, G.; Buonomano, A.; Forzano, C. Increasing self-consumption of renewable energy through the Building to Vehicle to Building approach applied to multiple users connected in a virtual micro-grid. Renew. Energy 2020, 159, 1165–1176. [Google Scholar] [CrossRef]
  7. Sdoukopoulos, E.; Boile, M.; Tromaras, A.; Anastasiadis, N. Energy Efficiency in European Ports: State-Of-Practice and Insights on the Way Forward. Sustainability 2019, 11, 4952. [Google Scholar] [CrossRef] [Green Version]
  8. Hippinen, I.; Federley, J. Fact-Finding Study on Opportunities to Enhance the Energy Efficiency and Environmental Impacts of Ports in the Baltic Sea Region; Study of the Baltic Sea Region Energy Cooperation (BASREC): Helsinki, Finland, 2014. [Google Scholar]
  9. Yu, S. Introduction of Water Source Heat Pump System. In Handbook of Energy Systems in Green Buildings; Wang, R., Zhai, X., Eds.; Springer: Berlin/Heidelberg, Germany, 2018; pp. 473–519. [Google Scholar] [CrossRef]
  10. Pitaccolo, M. Action Plan for a Sustainable and Low Carbon Port of Venice and Chioggia. Available online: https://supair.adrioninterreg.eu/wp-content/uploads/2020/03/SUPAIR_DT1.4.1_Action-Plan-for-a-Sustainable-and-low-carbon-port-of-Venice_dec-2019.pdf (accessed on 10 June 2021).
  11. Carou, F. Port Lands Energy Plan—Guidelines for a Net Zero District. Available online: https://portlandsto.ca/wp-content/uploads/Port+Lands+Energy+Plan_Sep+2017.pdf (accessed on 10 June 2021).
  12. Vaher, K.; Maivel, M.; Haab, P. Sustainable Energetic Solutions for Cruise Terminal Buildings. Available online: http://www.greencruiseport.eu/sustainable-energetic-solutions-for-cruise-terminal-buildings.html (accessed on 10 June 2021).
  13. EQUA. IDA Indoor Climate and Energy. Available online: https://www.equa.se/en/ida-ice (accessed on 10 June 2021).
  14. Elnabawi, M.H. Building Information Modeling-Based Building Energy Modeling: Investigation of Interoperability and Simulation Results. Front. Built Environ. 2020, 6, 193. [Google Scholar] [CrossRef]
  15. Buonomano, A.; Montanaroa, U.; Palomboa, A. Temperature and humidity adaptive control in multi-enclosed thermal zones under unexpected external disturbances. Energy Build. 2017, 135, 263–285. [Google Scholar] [CrossRef]
  16. Barone, G.; Zacharopoulos, A.; Buonomano, A.; Forzano, C.; Giuzio, G.F.; Mondol, J.; Palombo, A.; Pugsley, A.; Smyth, M. Concentrating Photovoltaic Glazing (CoPVG) system: Modelling and simulation of smart building façade. Energy 2021, in press. [Google Scholar] [CrossRef]
  17. Barone, G.; Buonomano, A.; Forzano, C.; Giuzio, G.F.; Palombo, A. Passive and active performance assessment of building integrated hybrid solar photovoltaic/thermal collector prototypes: Energy, comfort, and economic analyses. Energy 2020, 209, 118435. [Google Scholar] [CrossRef]
  18. Buonomano, A.; Palombo, A. Building energy performance analysis by an in-house developed dynamic simulation code: An investigation for different case studies. Appl. Energy 2014, 113, 788–807. [Google Scholar] [CrossRef]
  19. Barone, G.; Buonomano, A.; Forzano, C.; Palombo, A. Building Energy Performance Analysis: An Experimental Validation of an In-House Dynamic Simulation Tool through a Real Test Room. Energies 2019, 12, 4107. [Google Scholar] [CrossRef] [Green Version]
  20. Mazzarella, L.; Pasini, M. OpenBPS: A New Building Performance Simulation Tool. 2017, pp. 217–224. Available online: http://www.ibpsa.org/proceedings/BSA2017/9788860461360_27.pdf/ (accessed on 10 June 2021).
  21. Barone, G.; Buonomano, A.; Calise, F.; Forzano, C.; Palombo, A. WLHP Systems in Commercial Buildings: A Case Study Analysis Based on a Dynamic Simulation Approach. Am. J. Eng. Appl. Sci. 2016, 9, 659–668. [Google Scholar] [CrossRef] [Green Version]
  22. Barone, G.; Buonomano, A.; Calise, F.; Forzano, C.; Palombo, A. Energy recovery through natural gas turboexpander and solar collectors: Modelling and thermoeconomic optimization. Energy 2019, 183, 1211–1232. [Google Scholar] [CrossRef]
  23. Barone, G.; Buonomano, A.; Forzano, C.; Palombo, A. A novel dynamic simulation model for the thermo-economic analysis and optimisation of district heating systems. Energy Convers. Manag. 2020, 220, 113052. [Google Scholar] [CrossRef]
  24. Barone, G.; Buonomano, A.; Forzano, C.; Palombo, A. Enhancing trains envelope—Heating, ventilation, and air conditioning systems: A new dynamic simulation approach for energy, economic, environmental impact and thermal comfort analyses. Energy 2020, 204, 117833. [Google Scholar] [CrossRef]
  25. Gao, H.; Koch, C.; Wu, Y. Building information modelling based building energy modelling: A review. Appl. Energy 2019, 238, 320–343. [Google Scholar] [CrossRef]
  26. Larsson, N. The Integrated Design Process; History and Analysis. 2009. Available online: https://www.semanticscholar.org/paper/The-Integrated-Design-Process-%3B-History-and-Larsson/2b55fe3ce399e2d41659349c936b0f5245e01563 (accessed on 10 June 2021).
  27. Wen, Q.-J.; Ren, Z.-J.; Lu, H.; Wu, J.-F. The progress and trend of BIM research: A bibliometrics-based visualization analysis. Autom. Constr. 2021, 124, 103558. [Google Scholar] [CrossRef]
  28. Zhuang, D.; Zhang, X.; Lu, Y.; Wang, C.; Jin, X.; Zhou, X.; Shi, X. A performance data integrated BIM framework for building life-cycle energy efficiency and environmental optimization design. Autom. Constr. 2021, 127, 103712. [Google Scholar] [CrossRef]
  29. Bastos Porsani, G.; Del Valle de Lersundi, K.; Sánchez-Ostiz Gutiérrez, A.; Fernández Bandera, C. Interoperability between Building Information Modelling (BIM) and Building Energy Model (BEM). Appl. Sci. 2021, 11, 2167. [Google Scholar] [CrossRef]
  30. Industy Foundation Classes (IFC). Available online: https://www.buildingsmart.org/standards/bsi-standards/industry-foundation-classes/ (accessed on 10 June 2021).
  31. Studio, G.B. Green Building XML (gbXML). Available online: https://www.gbxml.org/About_GreenBuildingXML_gbXML (accessed on 10 June 2021).
  32. Pezeshki, Z.; Soleimani, A.; Darabi, A. Application of BEM and using BIM database for BEM: A review. J. Build. Eng. 2019, 23, 1–17. [Google Scholar] [CrossRef]
  33. Kamel, E.; Memari, A.M. Review of BIM’s application in energy simulation: Tools, issues, and solutions. Autom. Constr. 2019, 97, 164–180. [Google Scholar] [CrossRef]
  34. Gourlis, G.; Kovacic, I. Building Information Modelling for analysis of energy efficient industrial buildings—A case study. Renew. Sustain. Energy Rev. 2017, 68, 953–963. [Google Scholar] [CrossRef]
  35. de Lima Montenegro Duarte, J.G.C.; Ramos Zemero, B.; Dias Barreto de Souza, A.C.; de Lima Tostes, M.E.; Holanda Bezerra, U. Building Information Modeling approach to optimize energy efficiency in educational buildings. J. Build. Eng. 2021, 43, 102587. [Google Scholar] [CrossRef]
  36. Donnell, J.; Maile, T.; Rose, C.; Mrazović, N.; Morrissey, E.; Parrish, K.; Regnier, C.; Bazjanac, V. Transforming BIM to BEM: Generation of Building Geometry for the NASA Ames Sustainability Base BIM. Available online: https://www.osti.gov/servlets/purl/1168736 (accessed on 10 June 2021).
  37. El Sayary, S.; Omar, O. Designing a BIM energy-consumption template to calculate and achieve a net-zero-energy house. Sol. Energy 2021, 216, 315–320. [Google Scholar] [CrossRef]
  38. Schlueter, A.; Thesseling, F. Building information model based energy/exergy performance assessment in early design stages. Autom. Constr. 2009, 18, 153–163. [Google Scholar] [CrossRef]
  39. Tushar, Q.; Bhuiyan, M.A.; Zhang, G.; Maqsood, T. An integrated approach of BIM-enabled LCA and energy simulation: The optimized solution towards sustainable development. J. Clean. Prod. 2021, 289, 125622. [Google Scholar] [CrossRef]
  40. Bonomolo, M.; Di Lisi, S.; Leone, G. Building Information Modelling and Energy Simulation for Architecture Design. Appl. Sci. 2021, 11, 2252. [Google Scholar] [CrossRef]
  41. Bracht, M.K.; Melo, A.P.; Lamberts, R. A metamodel for building information modeling-building energy modeling integration in early design stage. Autom. Constr. 2021, 121, 103422. [Google Scholar] [CrossRef]
  42. Sušnik, M.; Tagliabue, L.C.; Cairoli, M. BIM-based energy and acoustic analysis through CVE tools. Energy Rep. 2021. In Press. [Google Scholar] [CrossRef]
  43. Abbasi, S.; Noorzai, E. The BIM-Based multi-optimization approach in order to determine the trade-off between embodied and operation energy focused on renewable energy use. J. Clean. Prod. 2021, 281, 125359. [Google Scholar] [CrossRef]
  44. Utkucu, D.; Sözer, H. Interoperability and data exchange within BIM platform to evaluate building energy performance and indoor comfort. Autom. Constr. 2020, 116, 103225. [Google Scholar] [CrossRef]
  45. Rocha, A.; Pinto, D.; Ramos, N.M.M.; Almeida, R.M.S.F.; Barreira, E.; Simões, M.L.; Martins, J.P.; Pereira, P.F.; Sanhudo, L. A case study to improve the winter thermal comfort of an existing bus station. J. Build. Eng. 2020, 29, 101123. [Google Scholar] [CrossRef]
  46. Kota, S.; Haberl, J.S.; Clayton, M.J.; Yan, W. Building Information Modeling (BIM)-based daylighting simulation and analysis. Energy Build. 2014, 81, 391–403. [Google Scholar] [CrossRef]
  47. Brancaccio Costruzioni Spa. Available online: http://www.brancacciospa.it/ (accessed on 10 June 2021).
  48. Michel, B. EBSG Architectes. Available online: http://www.ebsg.fr (accessed on 10 June 2021).
  49. Rospi, G.; Cardinale, N.; Intini, F.; Cardinale, T. Analysis of Energy Consumption of Different Typologies of School Buildings in the City of Matera (Southern Italy). Energy Procedia 2015, 82, 512–518. [Google Scholar] [CrossRef] [Green Version]
  50. Architects, A.I.o. AIA. Available online: https://www.aia.org/ (accessed on 10 June 2021).
  51. Andriamamonjy, A.; Saelens, D.; Klein, R. A combined scientometric and conventional literature review to grasp the entire BIM knowledge and its integration with energy simulation. J. Build. Eng. 2019, 22, 513–527. [Google Scholar] [CrossRef]
  52. Forzano, C.; Baggio, P.; Buonomano, A.; Palombo, A. Building integrating phase change materials: A dynamic hygrothermal simulation model for system analysis. J. Sustain. Dev. Energy Water Environ. Syst. 2019, 7, 325–342. [Google Scholar] [CrossRef]
  53. Athienitis, A.K.; Barone, G.; Buonomano, A.; Palombo, A. Assessing active and passive effects of façade building integrated photovoltaics/thermal systems: Dynamic modelling and simulation. Appl. Energy 2018, 209, 355–382. [Google Scholar] [CrossRef]
Figure 1. (a) Hammarby Sjostad, the industrial harbour of Stockholm, Sweden, redeveloped in 2004. (b) HafenCity, Industrial harbour in central Hamburg, Germany, renovated to accommodate population growth without consuming more land. (c) Dockside Green, the waterfront brownfield redevelopment in Victoria, Canada, the first LEED Platinum community in the world [11].
Energies 14 04854 g001
Figure 2. Flowchart of the adopted methodology.
Energies 14 04854 g002
Figure 3. The new “Molo Beverello” of the monumental area of the port of Naples.
Energies 14 04854 g003
Figure 4. Site 2D drawing of the project.
Energies 14 04854 g004
Figure 5. BIM model of the building.
Energies 14 04854 g005
Figure 6. BEM model of the building, analytical spaces, and surfaces.
Energies 14 04854 g006
Figure 7. Schematic diagram of heating, cooling, and air treatment systems as modelled in OpenStudio.
Energies 14 04854 g007
Figure 8. Minimum, maximum and average sea water temperature profile of the Gulf of Naples.
Energies 14 04854 g008
Figure 9. Façade sections for implementation of PV glass.
Energies 14 04854 g009
Figure 10. Site view of building station showing photovoltaic canopies.
Energies 14 04854 g010
Figure 11. Average indoor air conditions.
Energies 14 04854 g011
Figure 12. Energy consumption shares of reference building.
Energies 14 04854 g012
Figure 13. Comparison of monthly electricity usage between ASHP and WSHP.
Energies 14 04854 g013
Figure 14. Electricity consumption against HR temperature and comparison between reference and chosen systems.
Energies 14 04854 g014
Figure 15. Optimal configuration selections and effect on thermal demand of PV glass.
Energies 14 04854 g015
Figure 16. Comparison of electricity consumption between reference and proposed systems.
Energies 14 04854 g016
Figure 17. BIM to BEM within the continuous improvement (PDCA) cycle of ISO standards.
Energies 14 04854 g017
Table 1. Characteristics of the main envelope components.
Surface TypeU Value
(W/m2K)
Thermal Mass
(kJ/m2K)
SHGC
(-)
Window façade1.25-0.2
External wall0.36–0.56318–544-
Internal wall0.36–3.338–544-
Floor0.28–0.311197–1243-
Ceiling0.31877-
Table 2. Space characteristics summary.
ZoneNameType of SpaceArea (m2)Volume (m3)Number of PeopleHVAC Type
North bathroomT.33 W.C.Toilets2390.752Heating and cooling;
AHU; radiant systems
T.34 W.C.Toilets2396.122
T.34_1 W.C. serviceToilets312.421
T.35 W.C.Toilets416.171
West bathroomT.24 W.C.Toilets831.421Heating and cooling;
AHU; radiant systems
T.25 W.C.Toilets830.361
T.26 W.C.Toilets313.211
T.27 W.C.Toilets414.761
T.27_1 StorageStorage area411.291
South bathroomT.2 + T.5 W.C.Toilets56185.796Heating and cooling;
AHU; radiant systems
T.3 W.C.Toilets311.191
T.4 W.C. serviceToilets414.191
T.7 W.C.Dressing room725.331
Rad. west 1T.9 WCToilets417.231Heating and cooling;
AHU; radiant systems
Rad. west 2T.12 WCToilets416.861Heating and cooling;
AHU; radiant systems
T.14 WCToilets416.911
TerminalT.0 TerminalTickets16126252.23322Heating and cooling;
AHU;
Low temperature radiant systems
T.6 BarCommercial2278.254
T.8 StorageCommercial1875.323
T.10 StorageStorage area310.861
T.11 StoreCommercial2293.53
T.13 StorageStorage area210.611
T.15 StorageStorage area210.641
T.16 StoreCommercial2189.973
T.17 OfficeOffice1036.081
T.18 OfficeOffice931.381
T.19 OfficeOffice931.781
T.20 OfficeOffice932.361
T.21 OfficeOffice933.451
T.22 OfficeOffice933.41
T.23 MeetingMeeting room1660.538
T.28 OfficeOffice1868.261
T.30 InfirmaryInfirmary932.31
-T.0_1 TerminalEntrance178476.836AHU
-T.1.BTechnical room715.620Unconditioned
-T.1.CTechnical room1634.790Unconditioned
-T.29 RackTechnical room412.260Unconditioned
-T.31Technical room106341.933Unconditioned
-T.36Technical room11.840Unconditioned
-T.37Technical room1227.820Unconditioned
-T.38Technical room27.580Unconditioned
-T.39Technical room52171.972Unconditioned
Table 3. Summary of PV window characteristics.
SHGC (%)U-Value
(W/m2K)
Efficiency
(%)
Transparency
(%)
Cost
(EUR/m2)
Low transparency9%1.24%10%107
Medium transparency12%1.23.4%20%110
High transparency17%1.22.8%30%115
Table 4. Summary of energy consumption of reference building.
Thermal Energy
(MWh/Year)
Electricity
(MWh/Year)
Primary Energy
(MWh/Year)
Heating108.726.927.6
Cooling127.134.935.8
Domestic hot water4.10.90.9
Himidifier-3.43.5
Lights-13.413.7
Interior equipment-2.92.9
Fans-14.314.7
Pumps-2.42.5
Total239.999.1101.6
Table 5. Metrics related to the implementation of water-source heat pumps.
Electricity
(MWh/Year)
Primary Energy
(MWh/Year)
CO2 Emission
(t/Year)
PES
(%)
REF62.7136.327.2-
PS136.679.615.941.6
Table 6. Metrics related to the implementation of heat recovery.
Electricity
(MWh/Year)
Primary Energy
(MWh/Year)
CO2 Emission
(tons/Year)
PES
(%)
REF62.7136.327.2-
PS256.3122.422.510.2
Table 7. Metrics related to the implementation of PV glazing.
Electricity Demand
(MWh/Year)
Purchased Electricity
(MWh/Year)
Primary Energy
(MWh/Year)
CO2 Emission
(tons/Year)
PES
(%)
REF99.199.1215.443.1-
PS3 Low-T99.274.6162.232.424.7
PS3 Medium-T99.077.3168.133.624.3
Table 8. Metrics related to the implementation of PV canopies.
Electricity Demand
(MWh/Year)
Purchased Electricity
(MWh/Year)
Primary Energy
(MWh/Year)
CO2 Emission
(tons/Year)
PES
(%)
REF99.199.1215.443.1-
PS499.158.7127.625.540.7
Table 9. Summary of the economic value of considered energy-saving measures.
Savings
(k EUR/Year)
Eel Sold
(k EUR/Year)
SPB
(Year)
NPV
(k EUR)
PI
(-)
PS1: WSHP5.2-7.625.10.6
PS2: Heat recovery1.3-1.613.97.0
PS3: Low-T PVs4.90.87.627.90.6
PS3: Medium-T PVs4.30.7917.50.4
PS4: PV canopies8.11.39.825.00.3
Publisher’s Note: MDPI stays neutral with regard to jurisdictional claims in published maps and institutional affiliations.

