Article

Reservoir Properties of Low-Permeable Carbonate Rocks: Experimental Features

1
Center for Hydrocarbon Recovery, Skolkovo Institute of Science and Technology, Bolshoy Boulevard 30, 121205 Moscow, Russia
2
PermNIPIneft Branch, LUKOIL Engineering LLC, Soviet Army Street, 614066 Perm, Russia
*
Author to whom correspondence should be addressed.
Energies 2020, 13(9), 2233; https://doi.org/10.3390/en13092233
Submission received: 12 March 2020 / Revised: 21 April 2020 / Accepted: 28 April 2020 / Published: 3 May 2020
(This article belongs to the Special Issue Development of Unconventional Reservoirs 2020)

Abstract

:
This paper presents an integrated petrophysical characterization of a representative set of complex carbonate reservoir rock samples with a porosity of less than 3% and permeability of less than 1 mD. Laboratory methods used in this study included both bulk measurements and multiscale void space characterization. Bulk techniques included gas volumetric nuclear magnetic resonance (NMR), liquid saturation (LS), porosity, pressure-pulse decay (PDP), and pseudo-steady-state permeability (PSS). Imaging consisted of thin-section petrography, computed X-ray macro- and microtomography, and scanning electron microscopy (SEM). Mercury injection capillary pressure (MICP) porosimetry was a proxy technique between bulk measurements and imaging. The target set of rock samples included whole cores, core plugs, mini cores, rock chips, and crushed rock. The research yielded several findings for the target rock samples. NMR was the most appropriate technique for total porosity determination. MICP porosity matched both NMR and imaging results and highlighted the different effects of solvent extraction on throat size distribution. PDP core-plug gas permeability measurements were consistent but overestimated in comparison to PSS results, with the difference reaching two orders of magnitude. SEM proved to be the only feasible method for void-scale imaging with a spatial resolution up to 5 nm. The results confirmed the presence of natural voids of two major types. The first type was organic matter (OM)-hosted pores, with dimensions of less than 500 nm. The second type was sporadic voids in the mineral matrix (biogenic clasts), rarely larger than 250 nm. Comparisons between whole-core and core-plug reservoir properties showed substantial differences in both porosity (by a factor of 2) and permeability (up to 4 orders of magnitude) caused by spatial heterogeneity and scaling.

Graphical Abstract

1. Introduction

Worldwide, oil reserves estimated in traditional reservoirs are in a consistent decline, while triggering complications and enhancements of technologies of hydrocarbon exploration and characterization. One of the promising solutions to maintain production at current levels is the development of hard-to-recover reserves, including low-permeable (tight) carbonate reservoirs [1,2].
The correct determination of reservoir properties for the case remains challenging for oil and gas companies despite an increase in their interest in developing such formations and deposits [3,4,5]. Both porosity and permeability contribute significantly to resource assessment and reserves’ estimation of a target asset.
Tight carbonate rocks feature low porosity and permeability, the absence of structural, and stratigraphic control of the distribution of oil-containing intervals, which do not allow distinguishing them from well-logging data. All mentioned factors lead to a low oil recovery factor (<10–20%). Therefore, one critical task is the development of methods for estimating the reservoir properties of tight rocks.
Conventional methods for petrophysical core analysis were established during the 1970–1980s, when the development of conventional reserves had reached its peak [3]. Notably, the measured porosity varied in the range of 10–30% and permeability 10–200 mD.
The main obstacles to the proper determination of the reservoir properties (porosity and permeability) of tight reservoir rocks are their low porosity (<3–5%), and low permeability (<1 mD), as well as a high degree of heterogeneity of void space structure (VSS). However, conventional laboratory methods were developed for the characterization of conventional highly porous and permeable reservoir rocks, such as well-sorted sandstones. Complex reservoirs reside at the edge of their operating envelope in terms of porosity and permeability [6]. For example, conventional Dean–Stark extraction tends to overestimate water saturation in tight reservoirs, and reliable results require new approaches [7]. Indeed, conventional porosity techniques may overestimate and implicitly add uncertainty to the results of both geological and hydrodynamic modeling of field-scale processes [8].
In other words, the target formations fall out of the operational domain for conventional methods. Therefore, companies (operators and oilfield service divisions) tend to develop or adopt new techniques and equipment for such measurements.
At the current stage, laboratory petrophysical methods targeting tight reservoirs fall into two groups. The first group includes bulk methods, delivering a single integral property value (the result of determination) for a target rock sample. The second group improves the understanding of bulk values by direct (explicit) imaging of the void space structure, as well as mineral and organic matrix.
The petrophysical properties of the target rocks suggest a complicated inhomogeneous microstructure. The dimensions of voids fall below the micrometer scale. They require novel methods for evaluating the reservoir properties and high-resolution imaging, which obtains three-dimensional (3D) images of the void space structure with resolution up to 50 nm [9,10].
Multiple publications characterize the porosity [11,12], the porous structure, and permeability of tight sands, shales, and carbonates [13,14,15]. Based on published papers, we summarized conventional methods (basic in core analysis) and unconventional methods (widely applied for tight rock characterization) (Table 1).
Multiscale research studies on tight reservoirs suggest utilizing novel laboratory methods for characterizing the reservoir properties and the void space structure [16,17,18,19,20]. Nuclear magnetic resonance (NMR) and mercury injection capillary pressure (MICP) methods have been introduced as primary tools for defining the porosity and pore size, whereas the X-ray computed tomography (CT) and SEM (or FIB-SEM) often visualize the void space of tight sands and carbonates.
First of all, the use of NMR relaxometry in the study of low-porous sand and clay rocks falls into a separate group [21,22]. In the presence of clays or at low porosity, the most commonly used T2 cutoff values ultimately give inaccurate estimates of permeability due to reservoir heterogeneity. X-ray tomography (CT) in a modern petrophysical laboratory is becoming an increasingly popular method in the study of rocks, complementing routine, and special core analysis [23]. X-ray microtomography often joins mercury porosimetry to study shale and tight rocks [24,25]. Different industries have implemented scanning electron microscopy (SEM) for more than 55 years. One of the key aims has been to characterize various industrial materials at micro- and nanoscales [26]. Today’s increased interest from petroleum engineers to detailed characterization of tight reservoirs has raised interest in the application of SEM for shale investigations at very high magnifications [27]. Various microstructural techniques, including X-ray CT, petrographical microscopy, and SEM, identify and characterize macro- to nanoscale voids in tight carbonate rocks.
However, the application of the listed unconventional methods is complicated. Firstly, published case studies mainly cover only a few methods for characterizing the reservoir properties. The majority of publications present success stories with excellent and reliable results, even in cases of low- and ultra-low permeable reservoir rocks [8,16,17,19]. Therefore, recommended workflows often do not include failure scenarios and do not highlight the limitations of conventional methods. Secondly, all existing workflows present case studies for a particular type of reservoir (tight sands and tight shales) and rarely provide the application of the same procedure to different rock types. Therefore, it remains a challenge for us to construct an experimental workflow, which would combine the most mentioned methods in the publications and obtain real-time data for the ultra-low-permeable rock.
In this work, we applied a number of advanced laboratory methods for the characterization of an ultra-low-permeable carbonate Tlaynchy-Tamakian Formation. We employed an integrated analysis to investigate the advantages and limitations of the methods for estimating porosity and permeability. The study eventually discusses an optimal suite of methods for gathering quality datasets.

2. Materials and Methods

2.1. Materials

The study covered a representative collection of rock samples of an organic-rich carbonate Tlyanchy-Tamakian Formation of an Upper Devonian Frasnian age. The formation resides in the Volga-Ural and Timan-Pechora basins in the European part of Russia (Figure 1). Previous extensive studies characterized the formation in terms of geochemical properties, including oil generation potential [28,29,30,31]. The formation is one of the promising sources of oil in the basin [32,33]. Assessments of oil resources in the formation vary from hundreds of millions to billions of tons [30,31,34]. However, the highly heterogeneous rock texture and complex structure of voids essentially constrain the recovery of oil and gas.
The target collection of rock samples related to mostly carbonate, carbonate-siliceous thin-layered rocks with a moderate total organic carbon (TOC) content up to 10 wt.%. Carbonates were predominantly represented by organic-rich wackestones, and, in some cases, by packstones and crystalline limestones. Target rock samples came from a well located in the south of the Perm region of the Volga-Ural Province, Russian Federation (Figure 1). The entire collection of rock samples provided by the operator included 32 whole cores and more than 300 drilled core plugs corresponding to three main horizons—overlay Trudolubian (D3tr), main Tlyanchy-Tamakian (D3tch), and underlay Sargaevian (D3srg) unit (Figure 2).
Together with the core samples, the operator supplied the basic petrophysical information on the core material, so-called an a priori dataset. It included the porosity and permeability data for the entire collection of whole cores and core plugs using an automated gas permeameter Ekogeos DarcyMeter (Russia). The pressure pulse-decay or pulse-decay permeameter (PDP) technique with nitrogen provided all the measurements.
Received data showed porosity <1.6% (Figure 3) and permeability <1 mD (Figure 4). The reservoir properties ranged as follows: carbonate content 60–99%; clay content 0–10%; TOC content 0.5–10 wt.%. Figure 3 shows a clear difference in the porosity levels of the whole cores and core plugs. We see the main reason in the different volumes of investigation boosted by a high degree of heterogeneity of the target formation in a wellbore scale. Based on the porosity data for the core plugs, we selected the core plugs based on the porosity threshold of 1.2% (to the left from the histogram peak in Figure 3b).
We studied a subset of samples corresponding to the Tlyanchy-Tamakian horizon, 27 m thickness. The horizon was split into upper and lower units. The target collection of core samples included 2 whole cores and 27 core plugs with accompanying rock chips. We selected the samples based on the porosity (Figure 3) and permeability (Figure 4), and the availability of the rock chips.
The samples represented distinct lithological types and were organic-rich mixed rocks predominantly composed of carbonate and siliceous components. According to the rock texture and mineral composition, we distinguished four groups of rock types using the modified Dunham classification [36]: organic-rich wackestone, crystalline limestone with detritus, carbonaceous silicites with biogenic detritus, and grainstone.

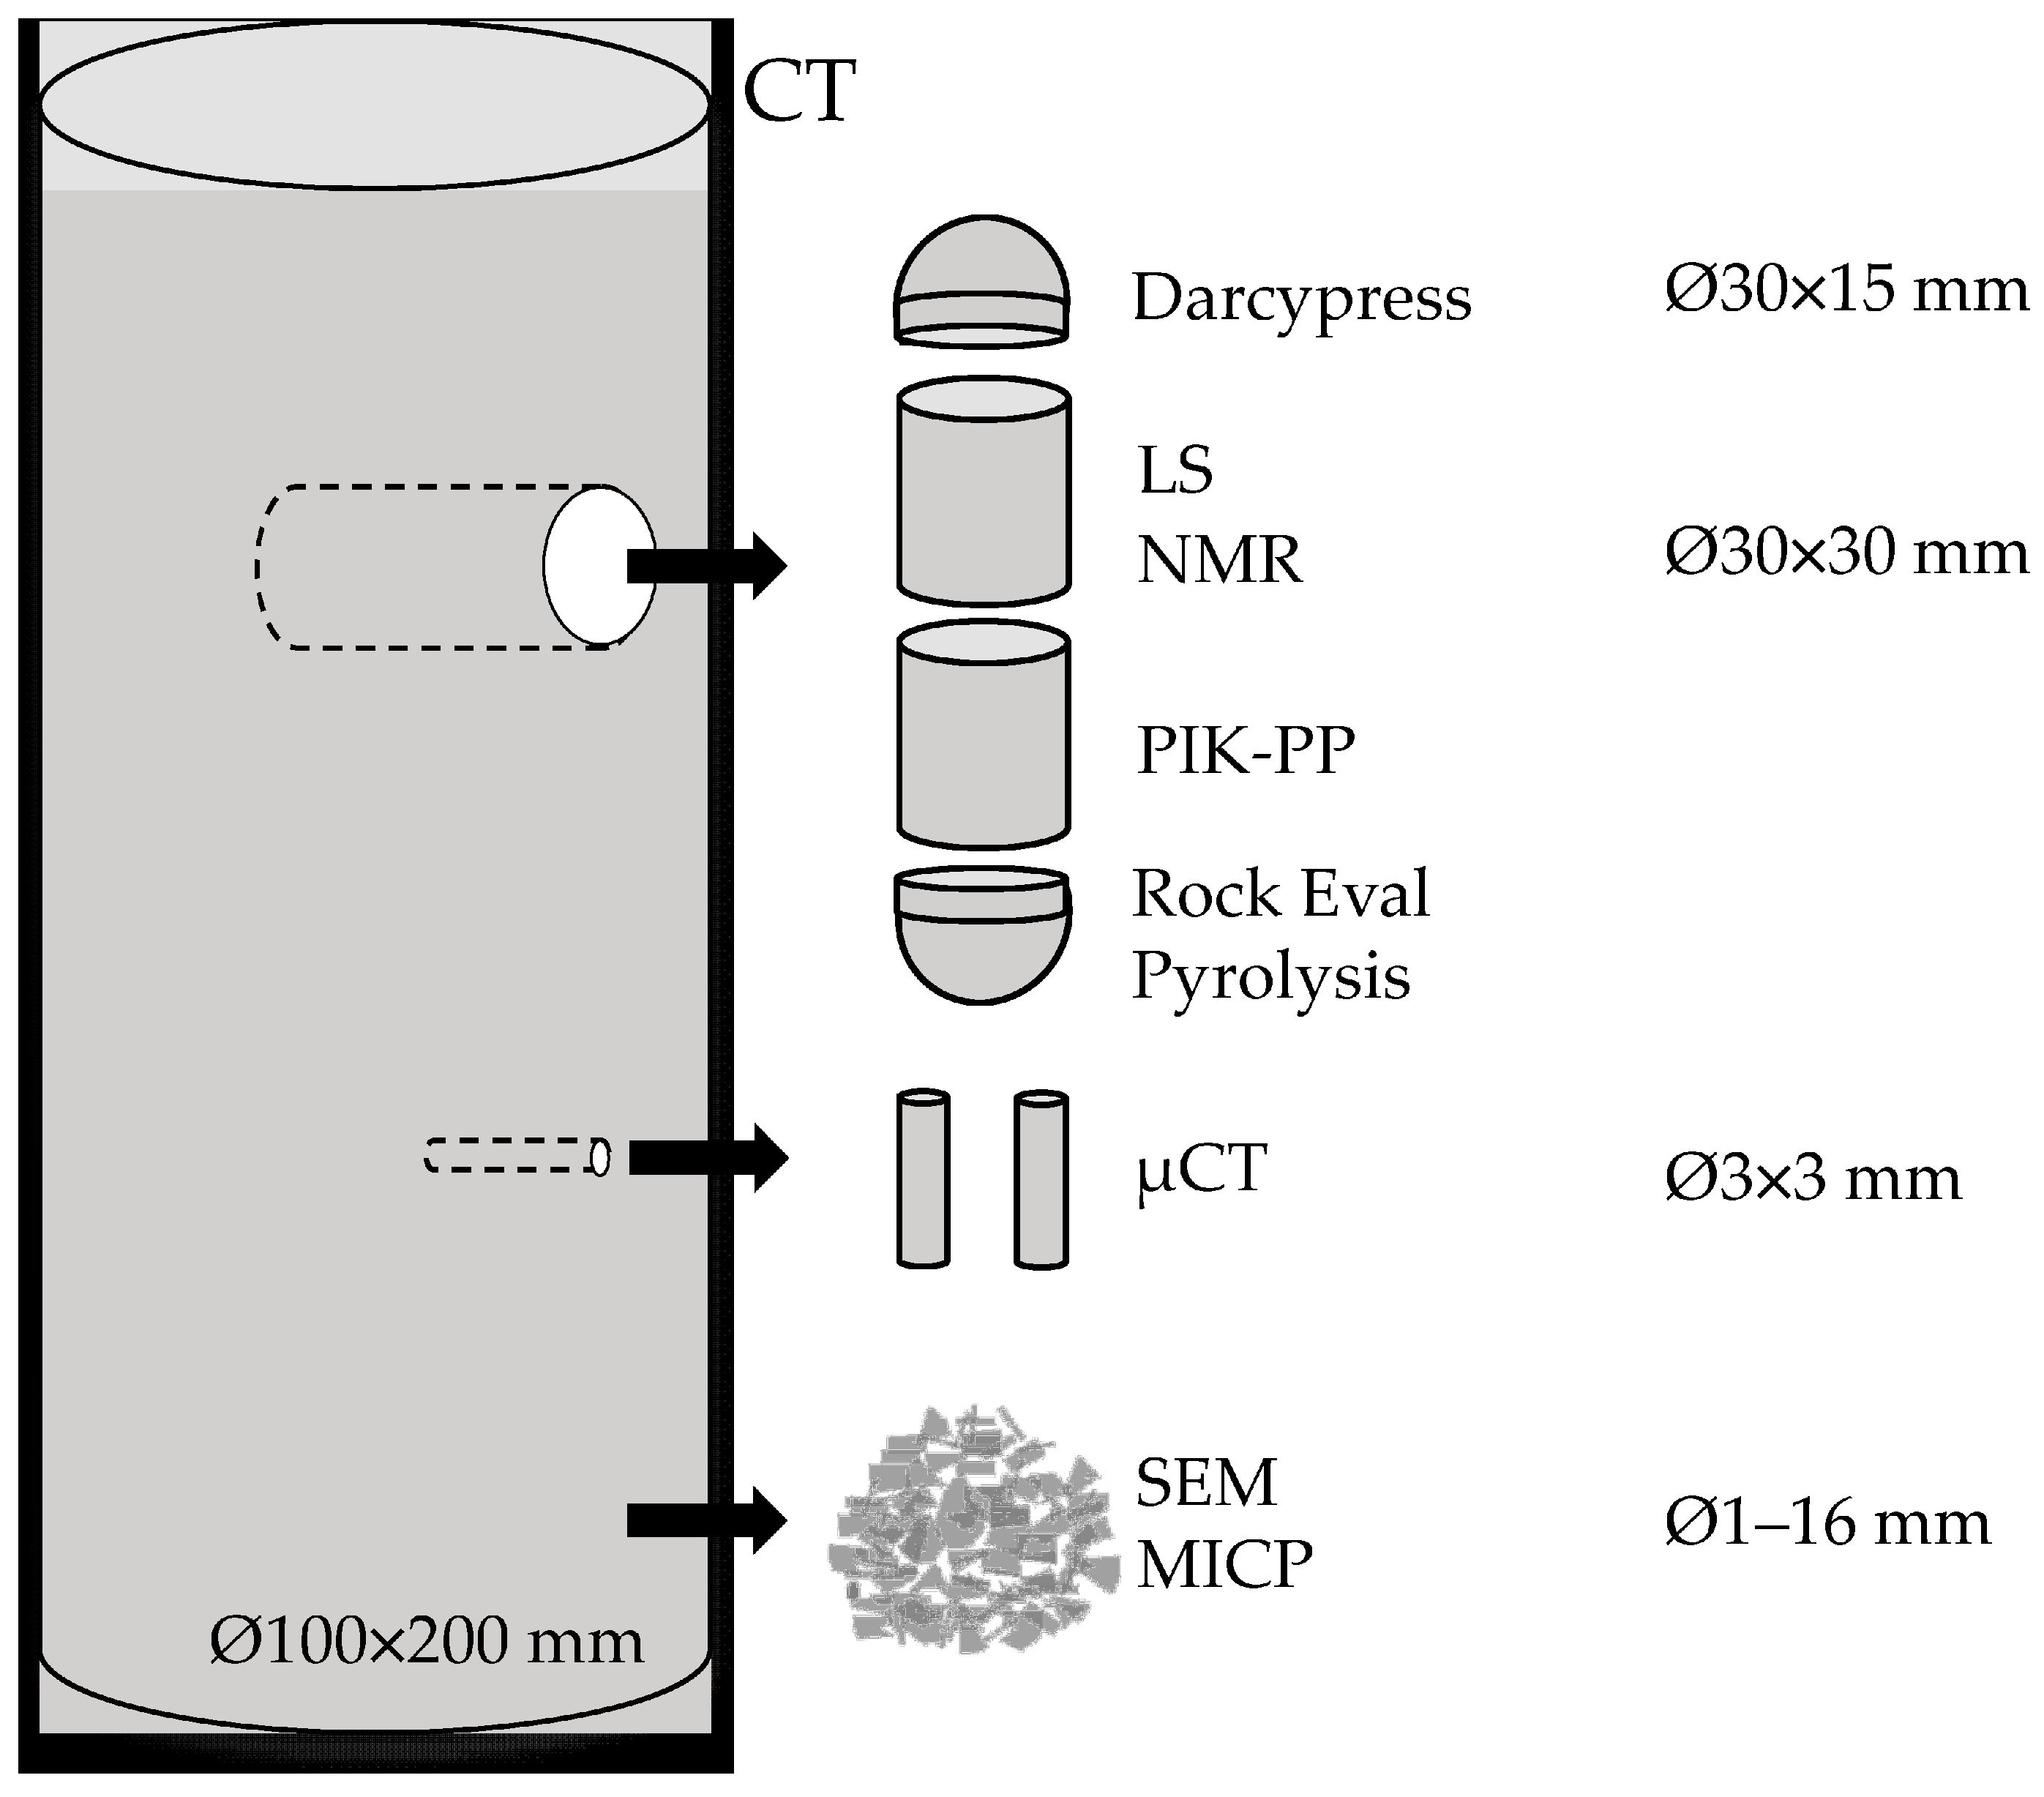
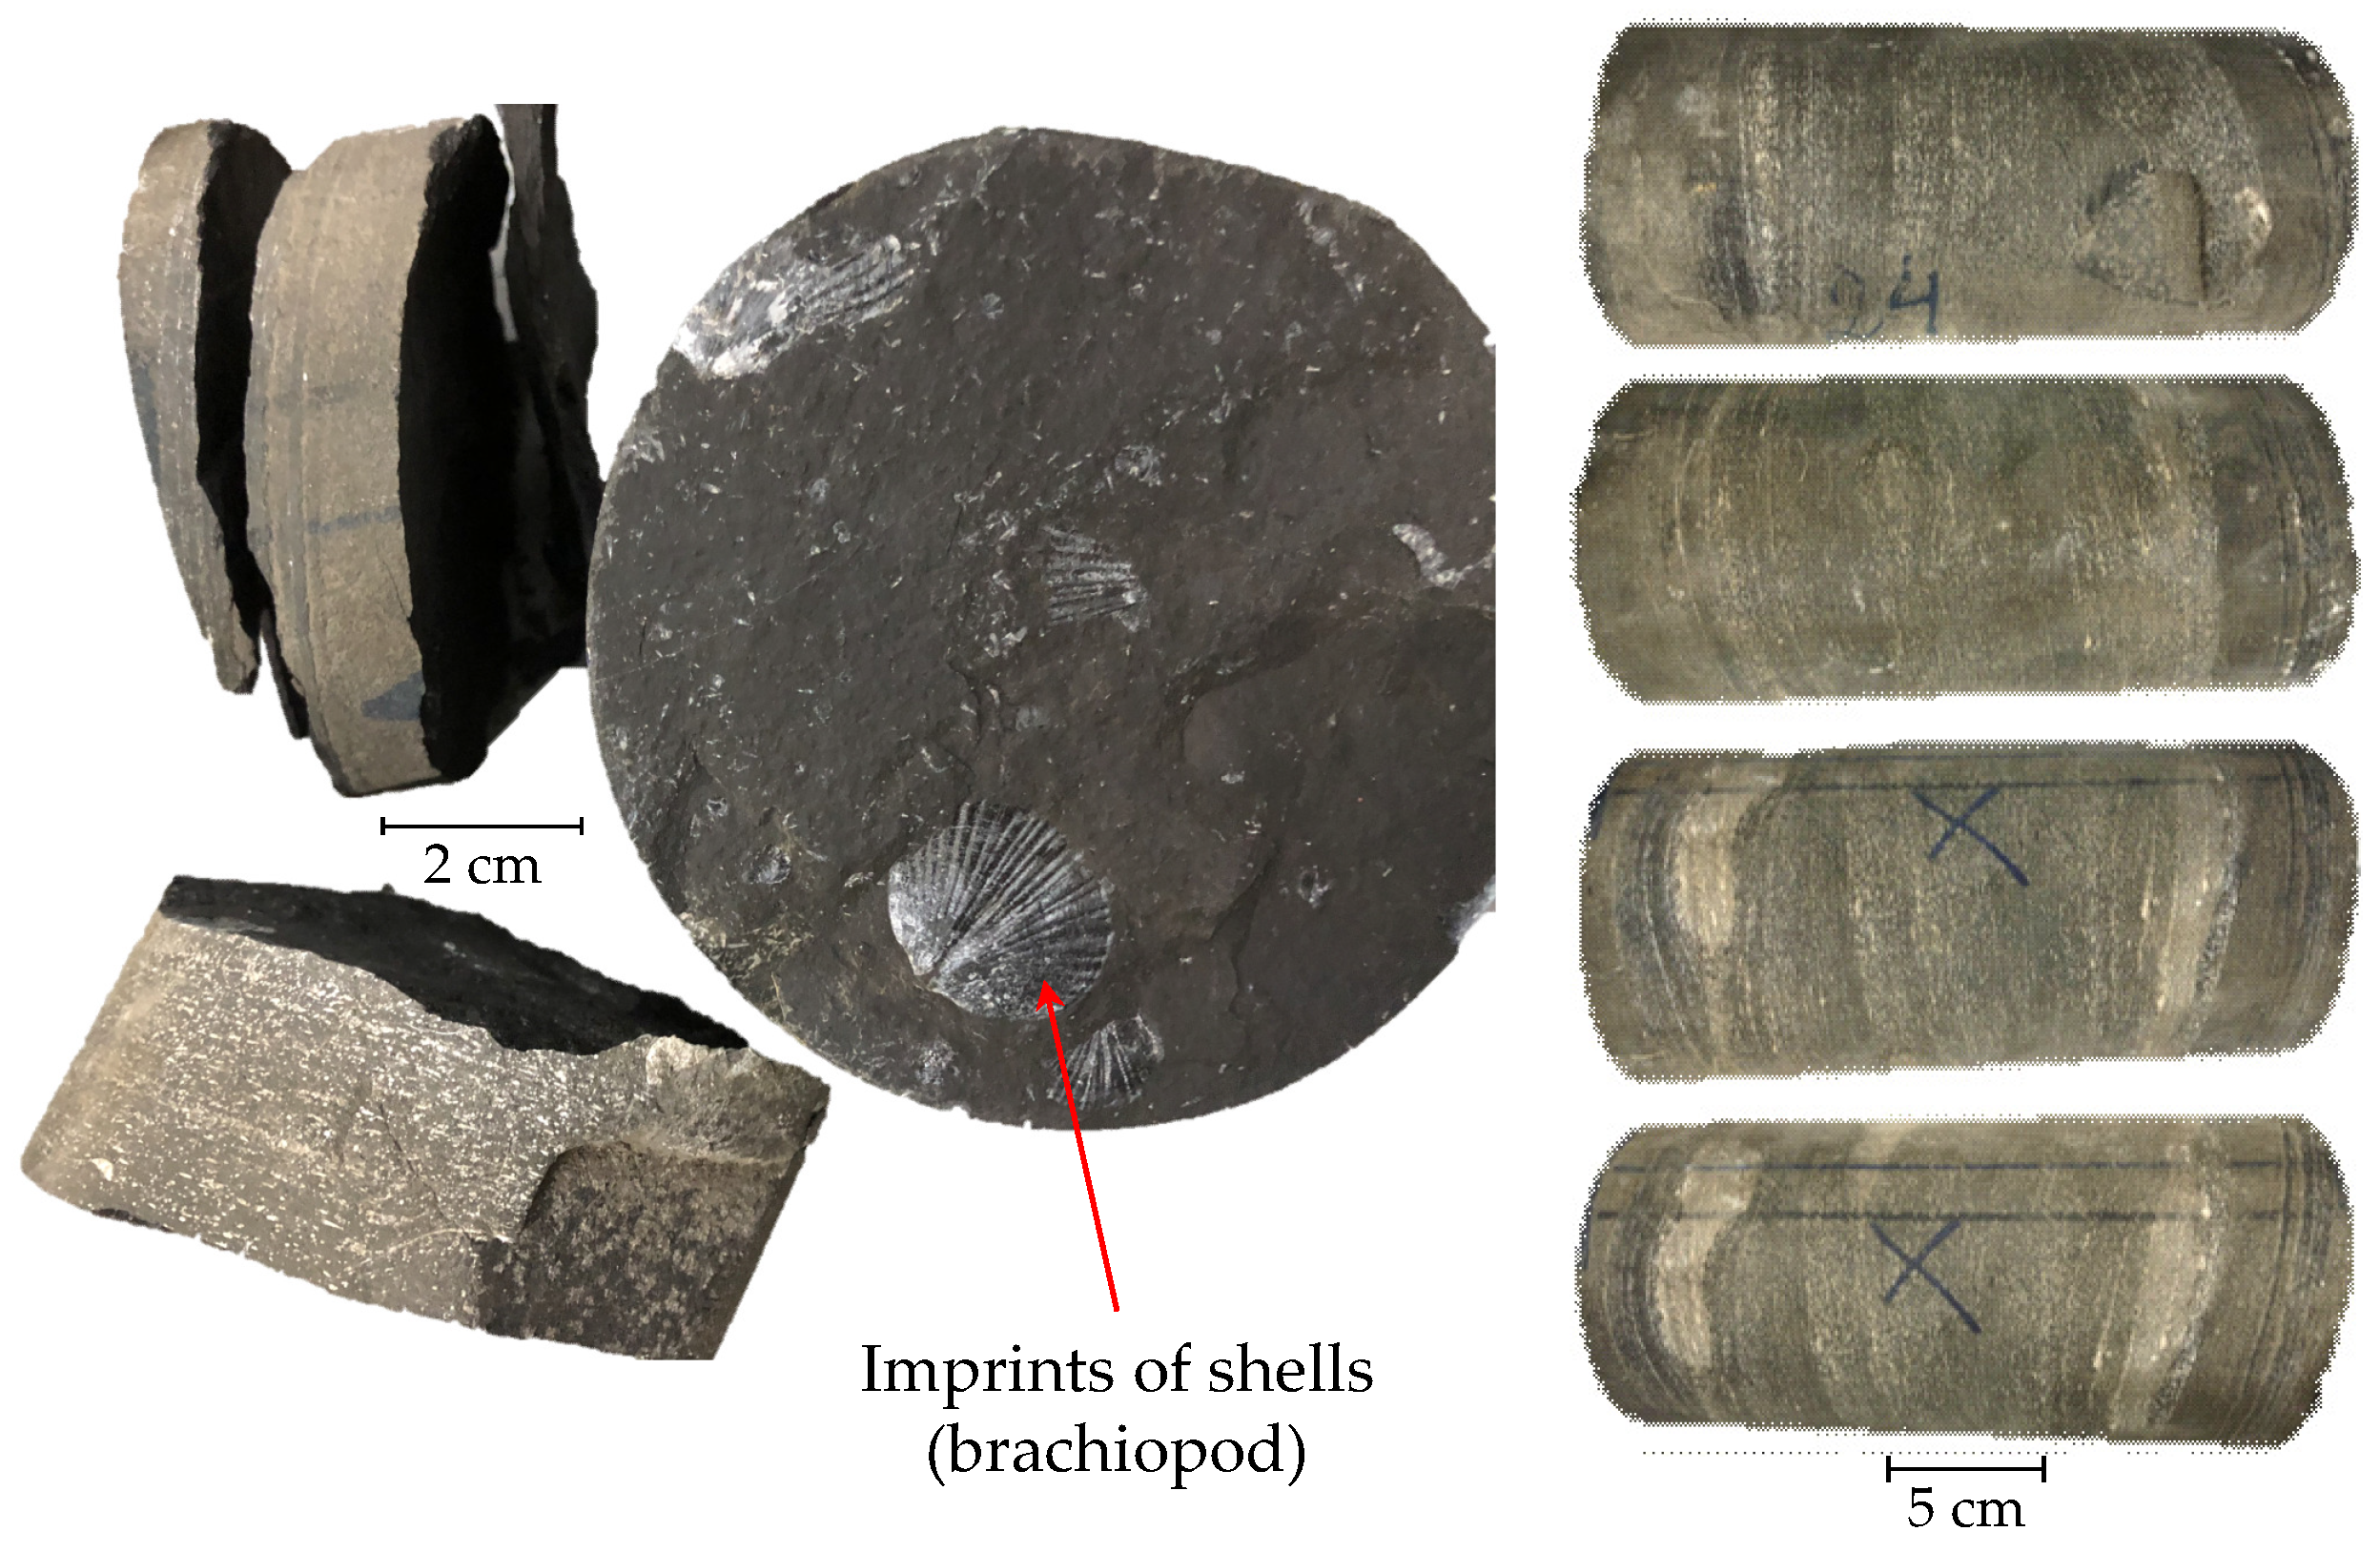
2.1.1. Whole Core Samples

The whole cores #545 and #551 represented the Upper-D3tch and Lower-D3tch rocks correspondingly. Each core had a length of 200 and a diameter of 100 mm (isolated from environmental exposure using layers of foil and paraffin [37]).
Samples showed high heterogeneity and anisotropy due to intense thin-bed layering (Appendix A, Figure A1). Various imprints of shells (presumably brachiopods) contributed to both rock heterogeneity and anisotropy.
CT on whole cores was used to locate homogeneous areas with a certain amount of organic matter and separate the parts with artificial fractures and other imperfections. Multiscale characterization of the void space structure persuaded us to separate the whole core into a set of subsamples (Figure 5).

2.1.2. Core Plugs and Mini Cores

The rock sample set included 33 samples in total: 27 core plugs (Ø30 × 30 mm) initially provided by the operator, 4 additionally drilled core plugs (Ø30 × 30 mm), and 2 mini cores (Ø3 × 3 mm) drilled out the whole cores. The collection of plugs had a high level of heterogeneity; shell inclusions (traces) made the core fragile and sensitive to destructive methods. Each core plug went through measurements by gas porosimetry, liquid saturation, NMR, and μCT (on mini-cores).

2.1.3. Rock Chips and Caps

Each core plug came with corresponding rock chips of an irregular shape with average dimensions of 20–50 mm and rock caps of Ø30 × 15 mm (received while drilling the whole core). The rock chips participated in the experiment, including Darcypress pseudo-steady-state decay, Rock-Eval pyrolysis, MICP, and SEM. Darcypress required square or round shaped fragments of the core with an approximate size of 1 cm³. SEM and MICP used rock chips of a smaller size. While SEM did not require a specific size/shape, MICP tests consisted of measurements on 4 different fractions: mesh sizes of 1–2; 2–4; 4–8; and 8–16 mm.

2.1.4. Petrographic Thin Sections

We prepared a set of 27 thin sections (20 × 20 mm) for rock typing. Initially, the thin sections had a standard thickness of 30 μm; then we thinned them to 10–20 μm to maximize of textural information output.

2.2. Methods & Techniques

We used a suite of modern methods and equipment to study the reservoir properties and microstructure of the target rock samples. Bulk methods include gas porosimetry, nuclear magnetic resonance (NMR), and Darcypress. Microstructural methods stand for visualizing techniques such as thin-section optical microscopy, CT, μCT, and SEM. A separate method is MICP, which belongs to the transition group, i.e., provides porosity measurement and describes the void space structure as well. Appendix B described common shared techniques.

2.2.1. Conventional Gas Porosity and Permeability of Plugs

Porosity and permeability measurements were conducted using an automated gas permeameter-porosimeter Geologika PIK-PP (Russia) [38]. The tests used nitrogen as a probe gas, while permeability measurements were obtained using the PDP technique. The confining pressure was 3.4 MPa. The stabilization criteria for pressure decay were 0.1%/min. Data reliability required performing the tests three times and calculating an average value. We calibrated the unit with supplied artificial samples with known parameters.

2.2.2. Nuclear Magnetic Resonance

We employed nuclear magnetic resonance relaxometry (NMR) to determine the porosity of the target rock samples. A low-field NMR unit, Oxford Instruments Geospec 2/53 (UK), estimated saturation and porosity at each step of the experimental workflow. NMR analysis involves measuring the polarization and relaxation of hydrogen atoms in a magnetic field of 0.05 T and a radiofrequency of 2.28 MHz [39,40,41]. Analysis and interpretation of the results employed principles characteristic of NMR application in petrophysics [42]. The instrument’s calibration used reference samples supplied by green imaging technologies (GIT) with known parameters, including NMR, liquid volume, length of 90 and 180 ° pulse, etc. T2-relaxation curve measurements resulted from the Carr-Purcell-Meybum-Gill (CPMG) pulse sequence with the time-echo (TE = 2τ) set to 0.1 ms. Preliminary tests justified the number of trains (accumulation) in the pulse sequence (90°–τ–180°–2τ–180°–…–180°) and estimated the highest signal-to-noise ratio (SNR), as well as the minimum number of scans—128. Data reduction, analysis, and interpretation involved using a GIT Systems Advanced 7.5.1 software.

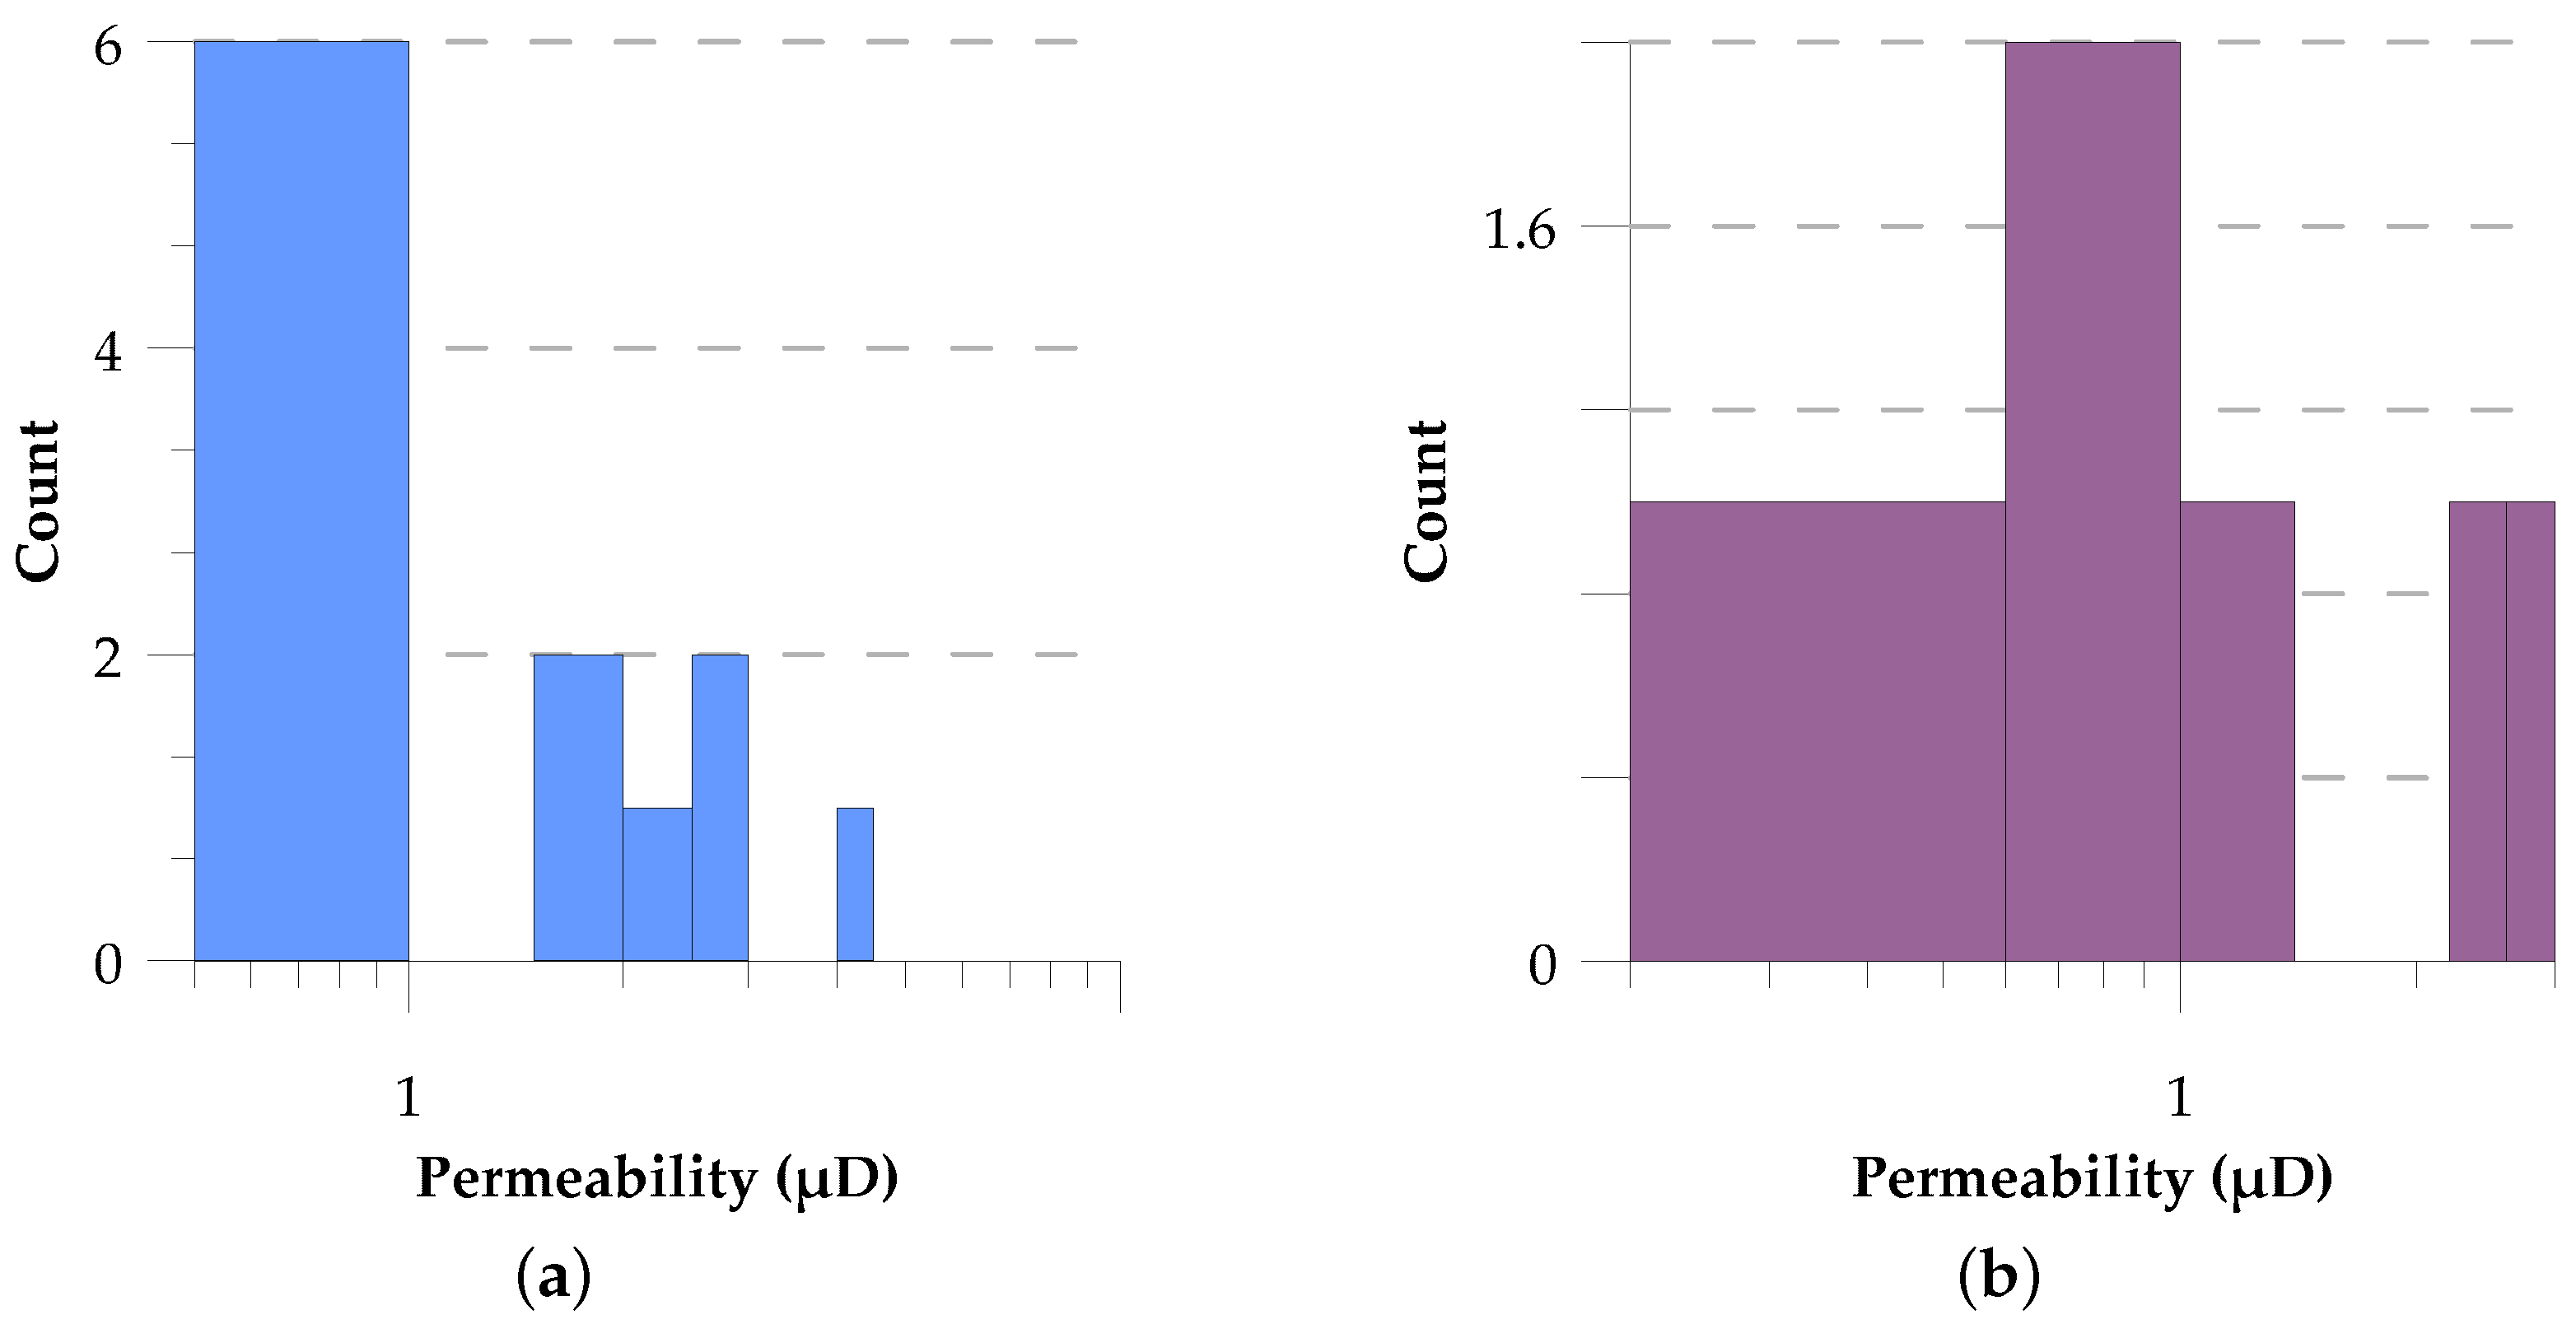
2.2.3. Darcypress Permeability

The Cydarex DarcyPress analyzer’s design allowed us to measure the permeability of shale or other rock samples in an extensive range of permeabilities from 10−6 mD to several Darcy units [43]. We ran the setup in a pseudo-steady-state (PSS) mode. Sample preparation included molding a small rock sample with a diameter of less than 1 cm into epoxy resin, and cutting a disk with a thickness of 2–5 mm. The permeability measurement procedure of the DarcyPress analyzer is similar to the standard measurement procedure for transient state measurements [44]. To characterize the target samples, we followed both single- and multi-step pseudo-steady-state procedures. The CYDAR 2017 software enabled data reduction, analysis, and interpretation.

2.2.4. Mercury Injection Porosimetry

The mercury injection capillary pressure (MICP) porosimetry characterized the void space structure and determined pore throat size distributions [45,46]. For this purpose, we measured Hg intrusion–extrusion versus pressure at 25 °C in the laboratory. Experimental activities involved Micromeritics AutoPore V 9605 and AutoPore IV 9520 instruments driven by Micromeritics MicroActive AutoPore V 9600 2.03.00 software.
Sample preparation included rock crushing in fractions of 8–16, 4–8, 2–4, and 1–2 mm fractions, followed by drying in a vacuum cabinet in a vacuum level of 1 mm Hg at a temperature of 110 °С. Before and after experiments, the rock samples resided in a desiccator to avoid capturing moisture from the environment.
Before and after each series of measurements, we ran blank (empty-penetrometer) tests. The Hg pressure table included more than 100-gauge pressure points evenly distributed in a range of 0–60 kpsi (0–414 MPa), filling voids with throats down to 3 nm. The Hg pressure equilibration time was equal to the recommended value of 10 s. We applied both blank and material compressibility corrections [47] to the raw data to achieve the highest quality of interpretation.
Experimental data reduction included Akima spline interpolation [48] of the corresponding intrusion curves, followed by the calculation of pore size distributions (PSDs) [49]. Additional outputs included total intrusion volume (TIV), median pore diameter (MPD), and volume (MPV) [45].
We validated the quality of the data using test measurements on the standard reference silica-alumina sample (part number 004-16822-00, lot A-501-52).

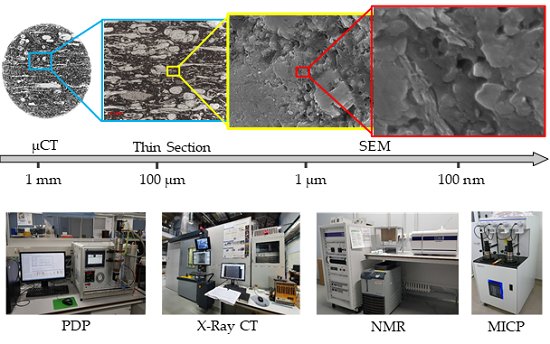
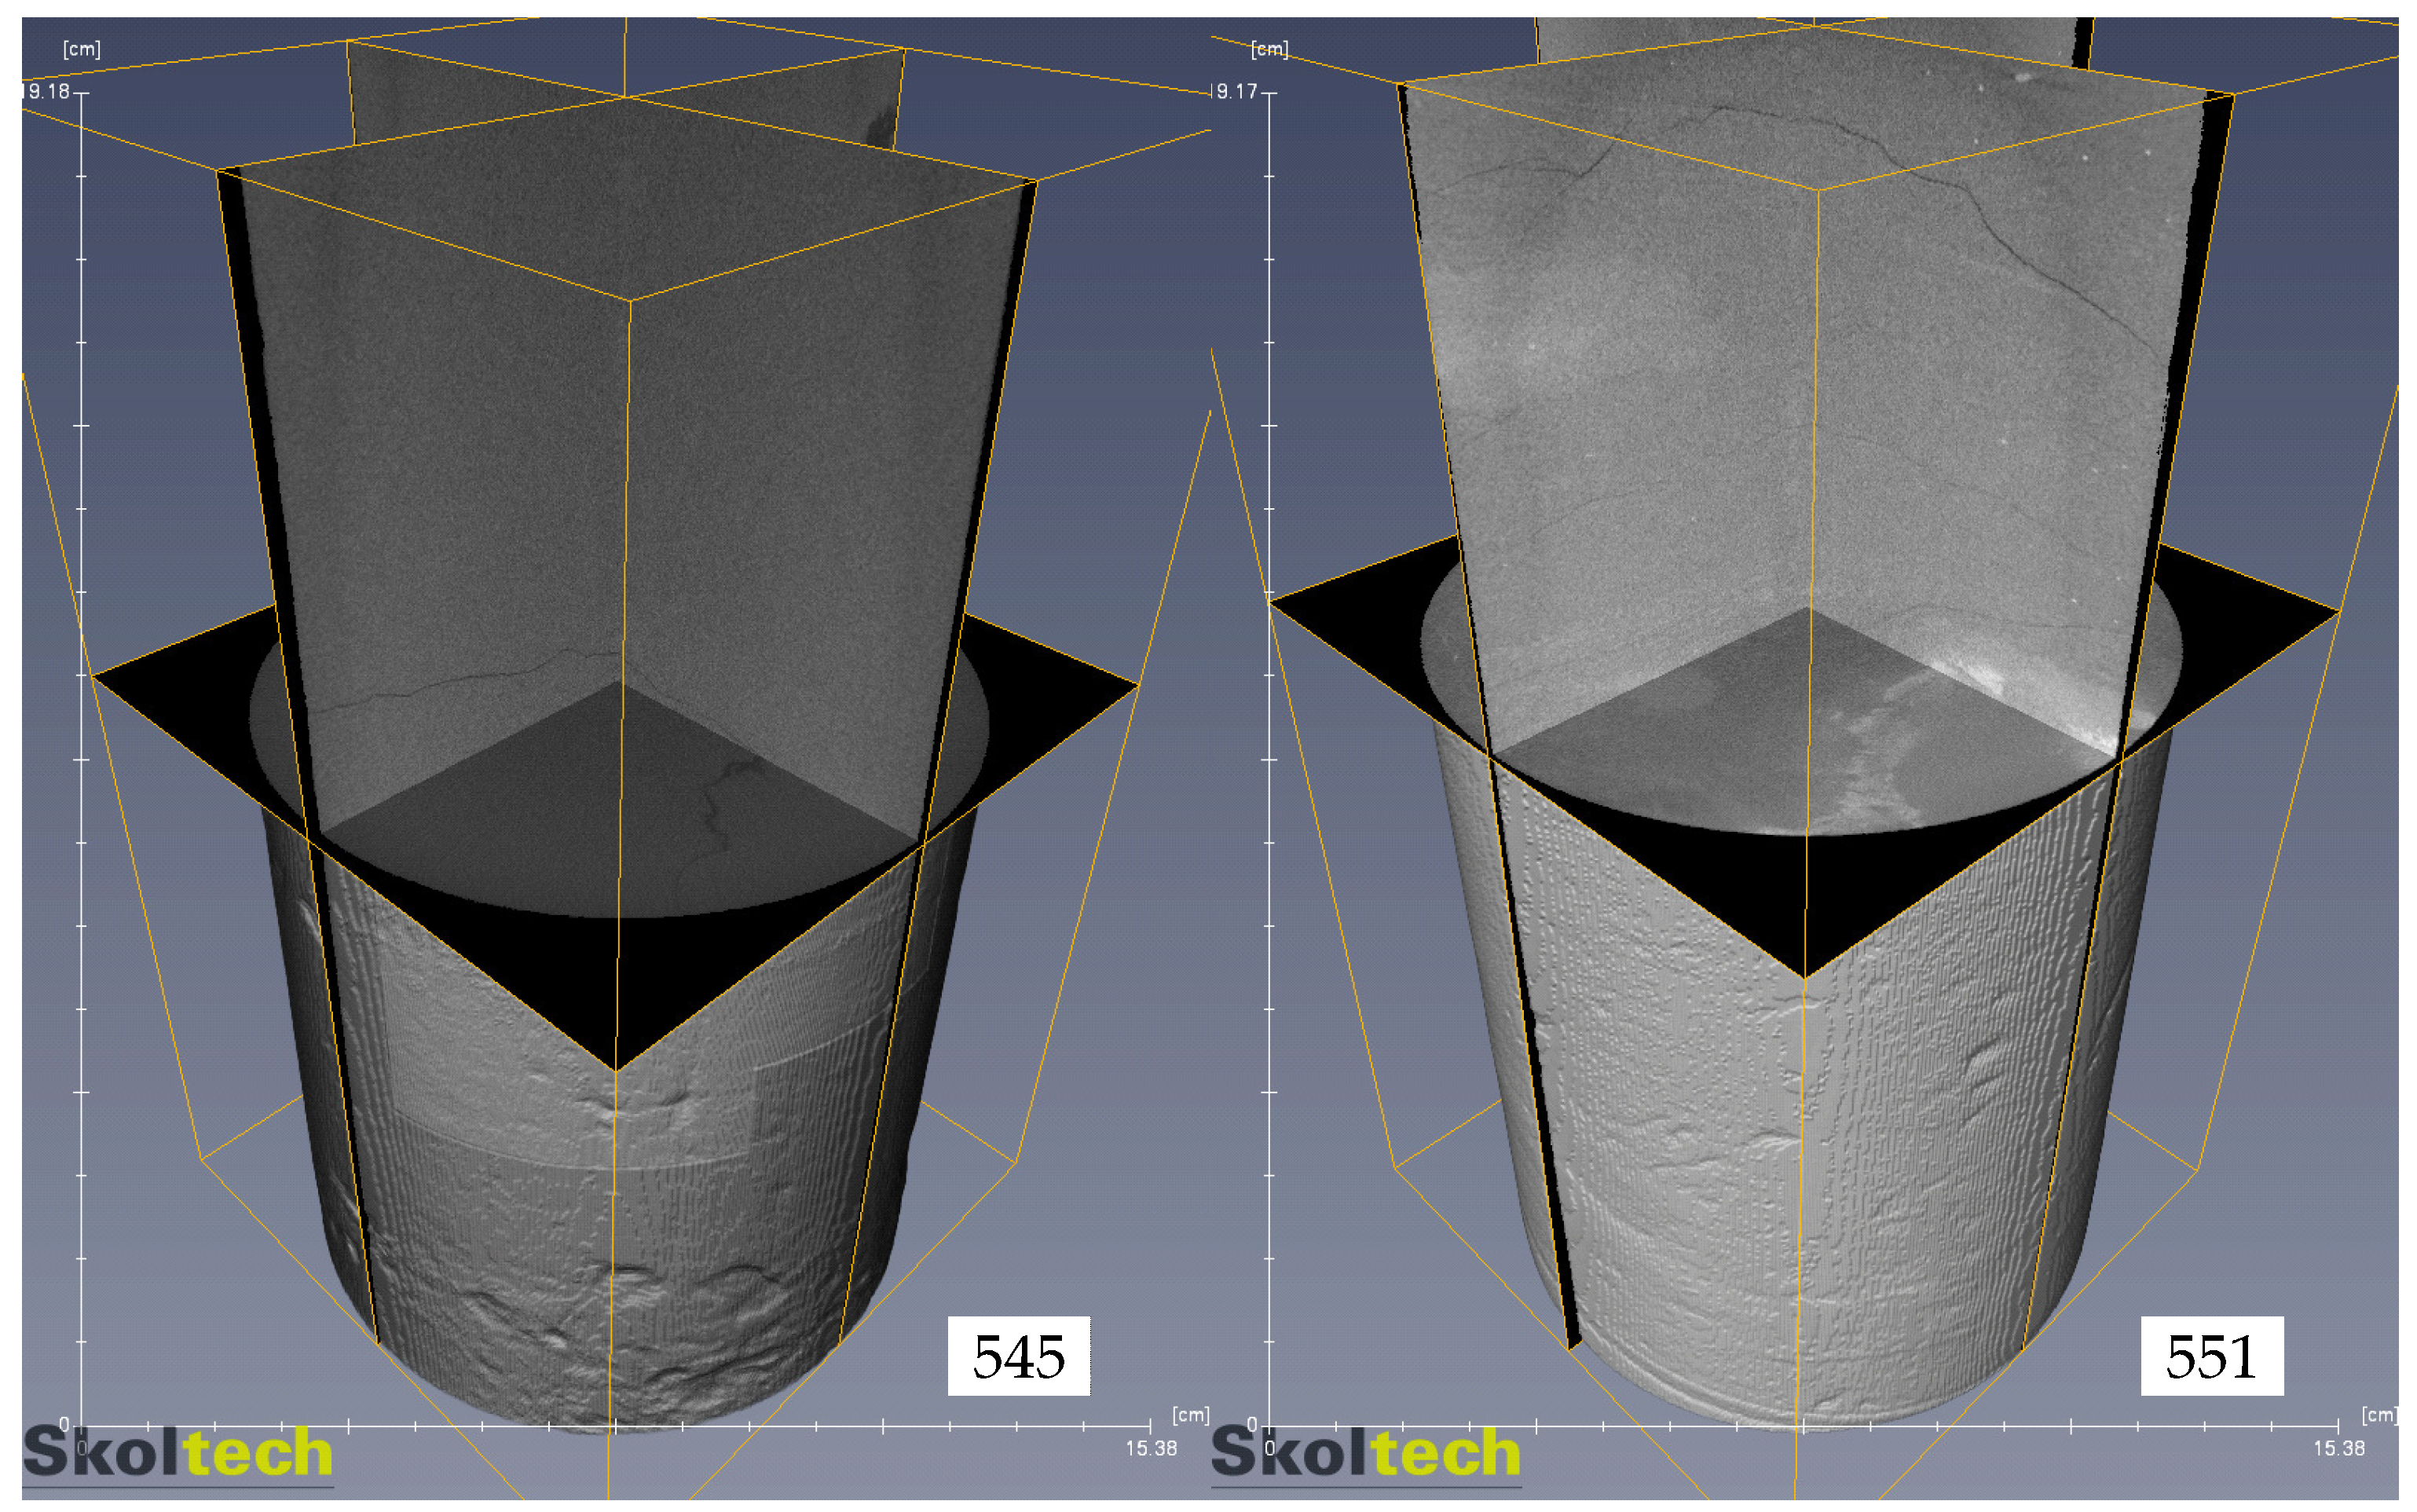
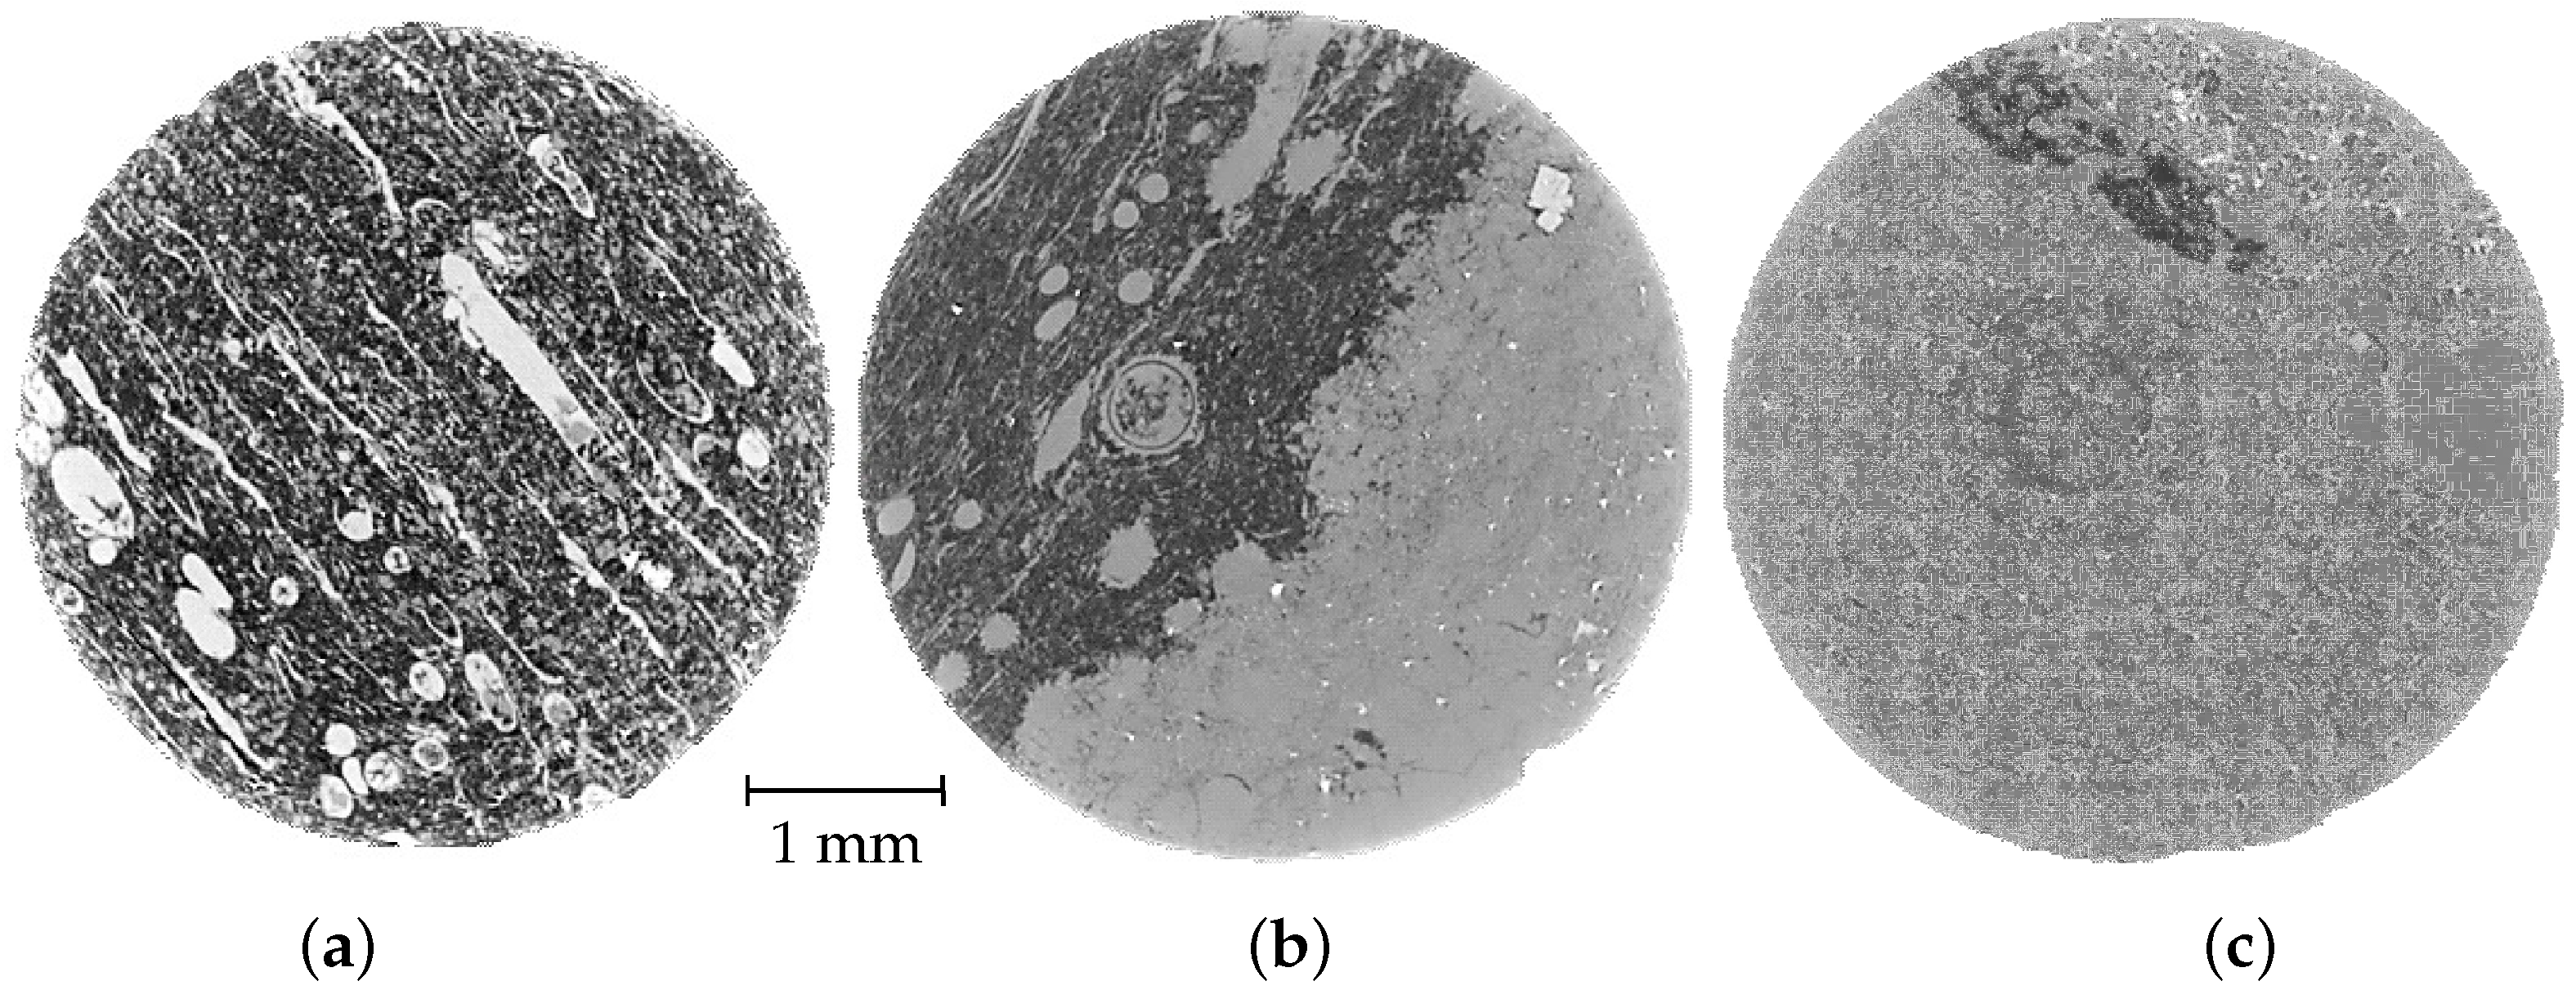
2.2.5. Computed Tomography Scan Imaging

We imaged the microstructure of the target rock samples in 3D using both computed tomography (CT) and micro-CT [50,51]. For this purpose, we used the GE phoenix v|tome|x L240, versatile high-resolution microfocus system for 2D and 3D computed tomography, and 2D non-destructive X-ray inspection.
The device includes a combination of unipolar 240 microfocus and 180 kV high-power nanofocus X-ray tubes, and handles large samples up to 500 × 1300 mm. We used an accelerating voltage of 70–200 kV and a current of 140–580 μA depending on the size of the sample, yielding a voxel size of 3–117 μm. Scanning of the whole cores required the application of a 0.5-mm-thick tin filter. A detector based on a 2024 × 2024 px photodiode array with an element size of 0.2 × 0.2 mm in combination with a CsI scintillator captured the target X-ray projections. We acquired the raw data using GE datos|x acquisition 2.6.1-RTM software. Reconstruction of a set of 1000–2400 2D radiographic projections into 3D X-ray density images involved the application of GE datos|x reconstruction 2.6.1-RTM software and processed the models using FEI PerGeos 1.5 software [52].

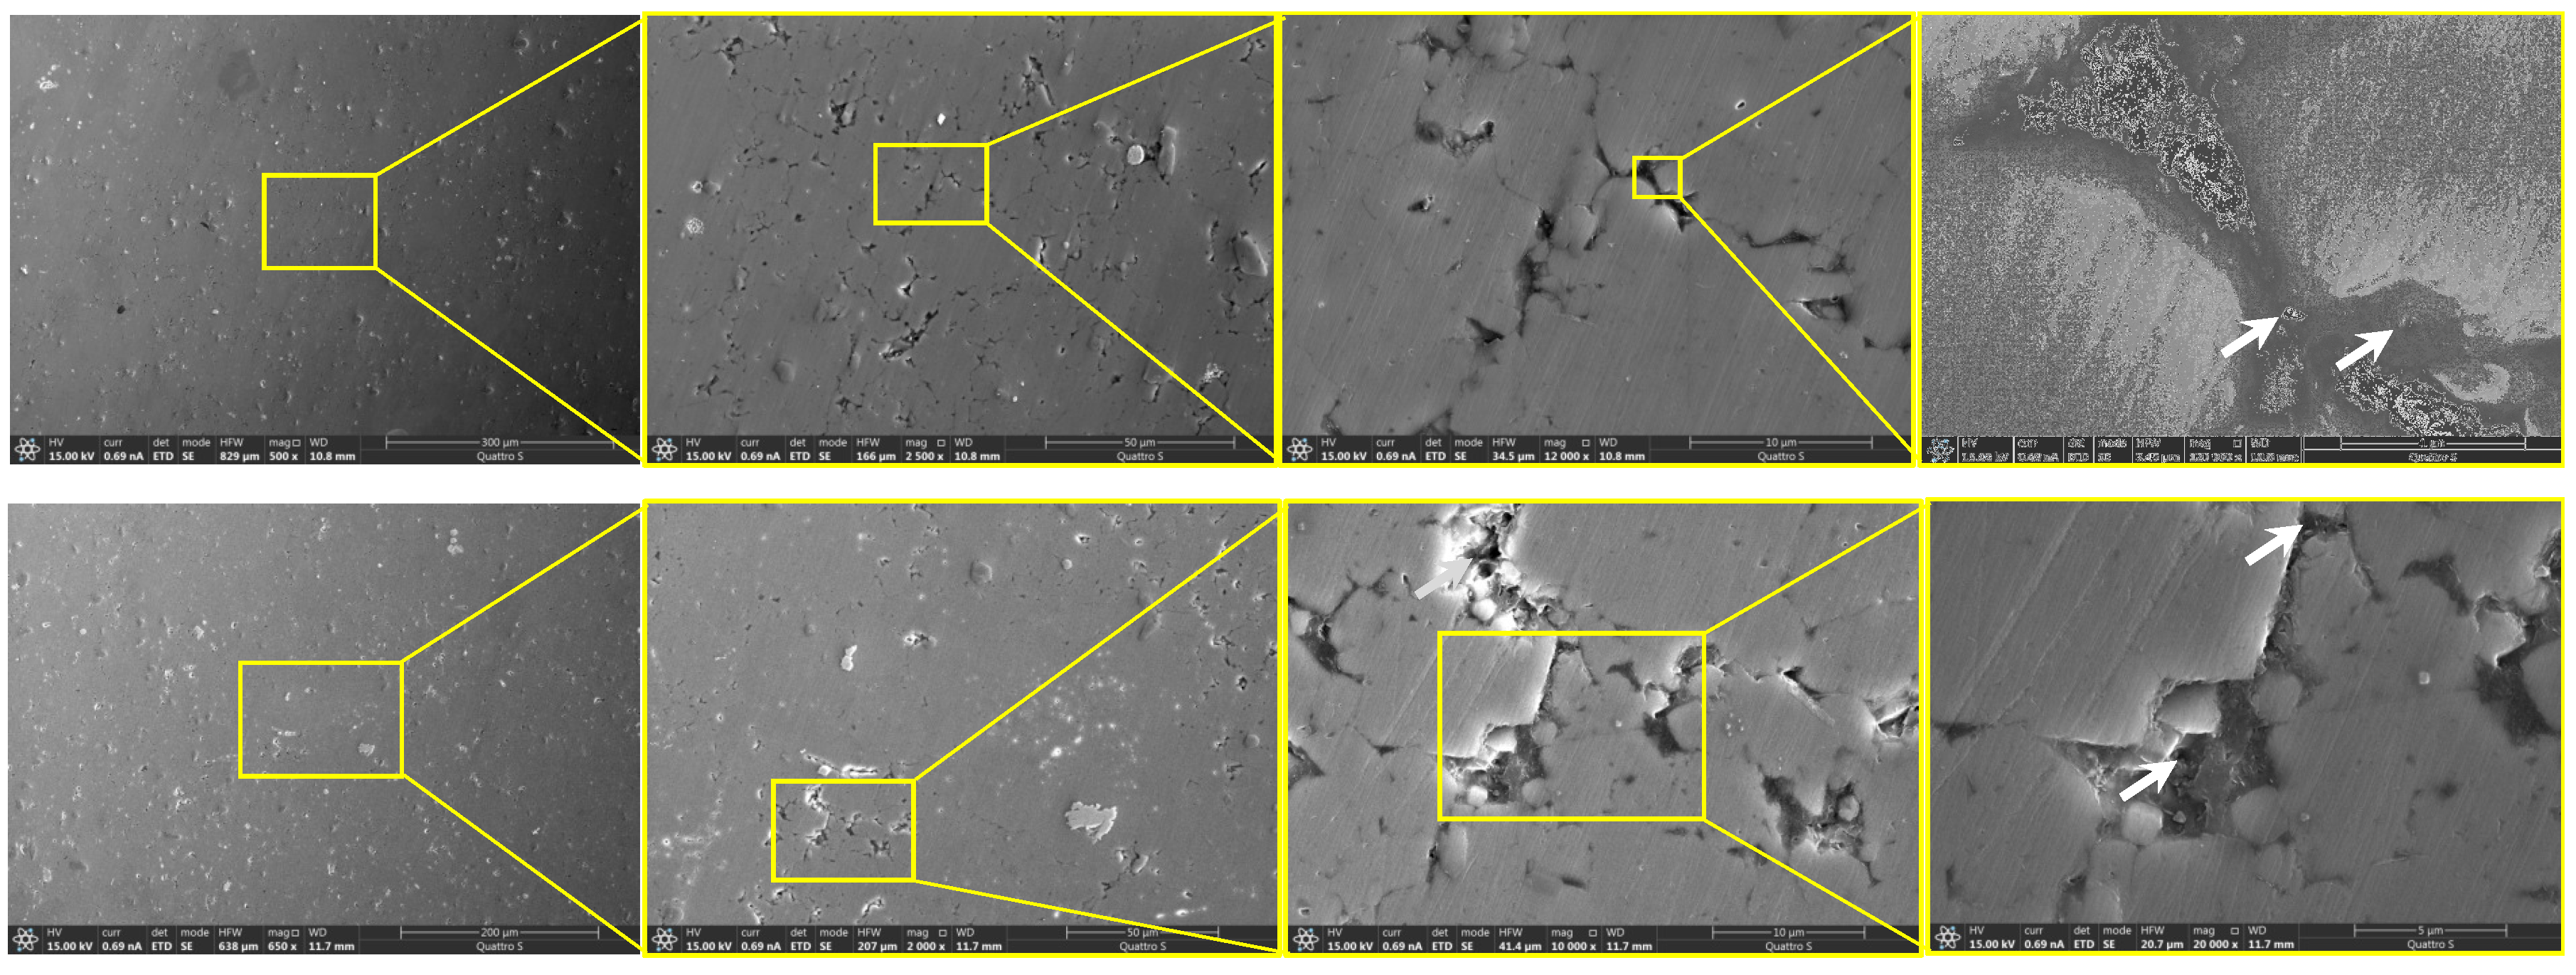
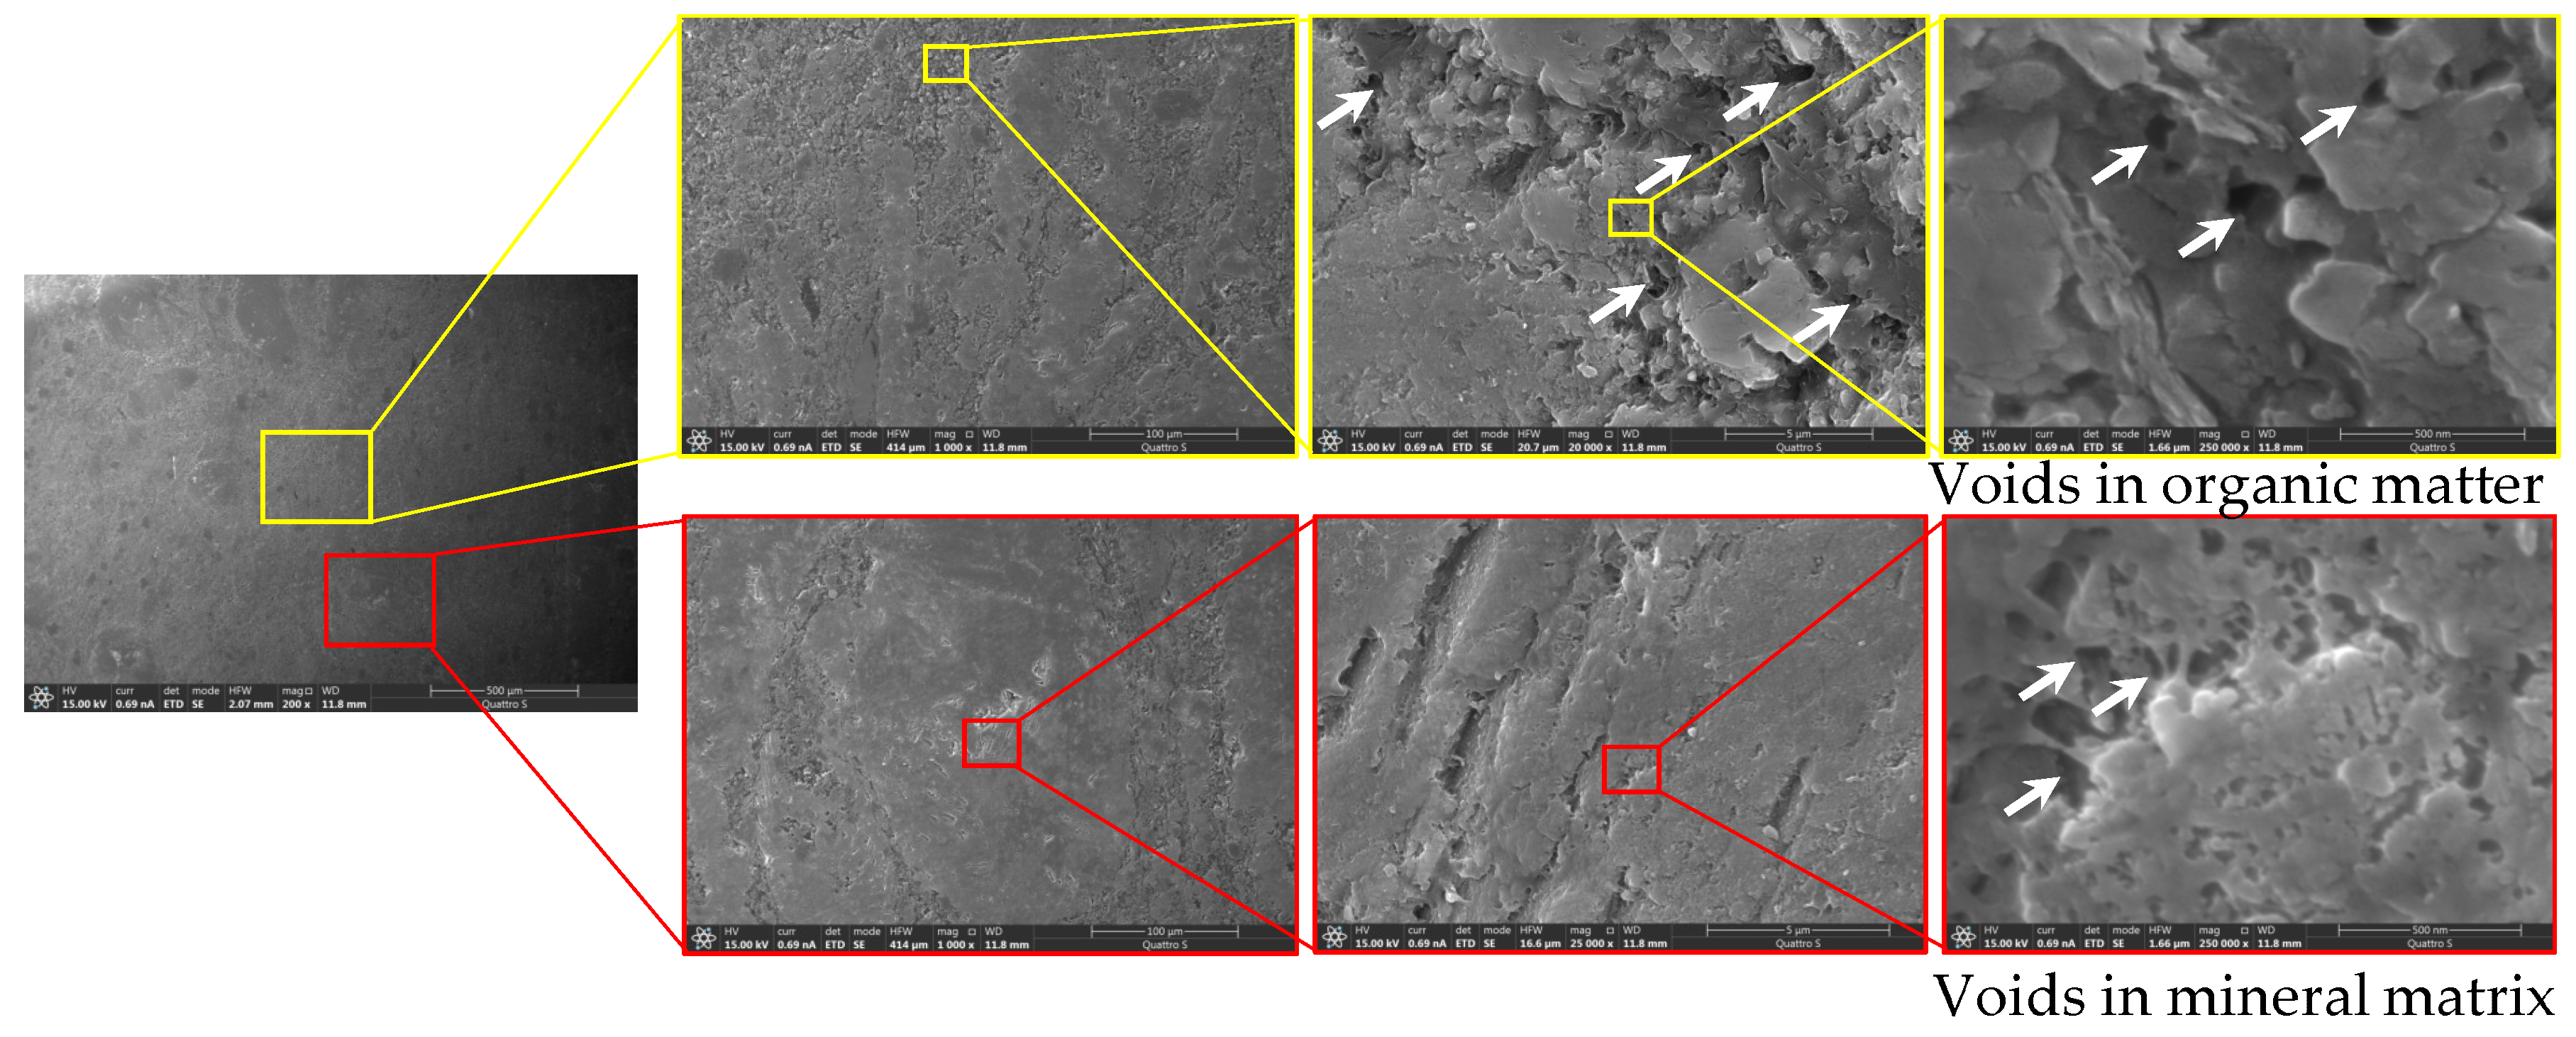
2.2.6. Scanning Electron Microscopy

For high-resolution 2D imaging and micromorphological characterization, we used scanning electron microscopy (SEM). The Thermo Fisher Scientific I Quattro S instrument analyzed small (2–5 mm) rock specimens chipped from each sample. The instrument allowed us to perform investigations with an electron beam current range from 1 pA to 200 nA with accelerating voltage 200 V to 30 kV. The minimum spatial resolution was 1 nm (at 30 kV).
Sample preparation included multi-step polishing—starting with grinding paper to polishing cloth with 1-μm diamond suspension. We then attached the polished samples to a holder with carbon tape, coated them with gold (coating thickness of less than 20 nm), and loaded these into the instrument.
Scanning involved secondary electrons (SE) and backscattered electrons (BSE), magnification ×500–250k, acceleration voltage 10–15 kV, and working distance 9–11 mm with approximately 1–2 nm maximum pixel size [53]. The resulting images had dimensions of 1536 × 1094 px.

3. Results

3.1. Porosity and Permeability

Table 2 shows the porosity data from gas porosimetry, liquid saturation, and NMR, as well as gas-injection and Darcypress permeability. Because of the limited amount of the core material, as well as the specific probe requirements for each method, we observed the gaps in the received dataset at multiple depths. It complicated the integrated analysis of reservoir properties and disabled a direct comparison of the utilized methods. Nevertheless, Table 2 describes each technique in terms of measuring range and average numbers for the target rock samples.
During the study, we faced another essential issue—the necessity for core cleaning or solvent extraction. To identify the role of extraction in the core analysis workflow, we repeated some of the tests (particularly NMR for identifying the porosity and Darcypress for permeability) before and after the extraction (Figure 6). The obtained results show the core cleaning did not adversely affect either NMR porosity or permeability. The permeability of the cleaned core radically increased for only three samples, which can be explained by the presence of artificial fractures that occurred during sample preparation (Figure 6b). TOC was around 5 wt.% and less than 10 wt.% for the target rock samples [54]. Thus, we continue the core analysis and interpretation of the results for the core in a non-extracted (non-cleaned) state.
In addition to the core plugs and chips, two whole core plugs passed through to the proposed laboratory workflow (Figure 5).

3.2. Microstructural Characterization

According to the Dunham classification of carbonate rocks [36], sample #545 was a crystalline limestone with detritus (Figure 7) because it was composed of predominantly crystalline calcite (sometimes with biogenic structure) and calcite remains of tentaculite shells. Sample #551 was an organic-rich wackestone (Figure 7) because the matrix held the immersed calcite detritus.
Our experience and observations showed that the petrographical description of the formation distinguished lithotypes, but did not provide reliable information on the void space structure [55,56]. Following down along the scale bar, we attempted to characterize the void space using whole-core CT and mini-plug micro-CT. We found that, similarly to the petrographic analysis of thin-sections, CT did not reveal natural voids and, thus, turned out to be a meaningless tool for the target rock (Figure 8).
The whole-core CT enabled the assessment of the degree of sample preservation, including the characteristics of artificial (technogenic) fractures, single large inclusions of relatively less dense organic matter, and the spatial inhomogeneity of the X-ray density. The studied rock samples featured a low contrast of the X-ray density of the rock-forming minerals. The mineral composition of the target rock samples made the three-dimensional tomographic models much less contrasting in X-ray density than they looked as real samples in daylight or petrographic thin sections.
We obtained similar results and drew the same conclusion from an analysis of mini-core micro-CT data. Micro-CT at a voxel size down to 3 μm did not fully resolve the natural-genesis void space within the density models. We separated distinct pores without revealing the connection between them (Figure 9).
The micro-CT results only complemented the description of rock heterogeneity and a spatial distribution of the potential organic matter (OM) inclusions. The analysis of mini-core micro-CT data revealed several structural and textural features at the microscale. In general, the studied rock samples represented various combinations of a relatively dense finely-crystalline mass of limestone and a relatively less dense carbonate-siliceous mass (Figure 9). However, the identified features did not pertain to the void space structure; therefore, their detailed description fell out of the paper’s scope.
The void space structure characterization at the highest resolution involved SEM imaging. Magnification of ×10k allowed us to identify pores due to its tiny size. Pores with specific dimensions of less than 1 μm, in the majority of cases, resided in the OM. In rare (individual) cases, the mineral matrix also contained voids (Figure 10 and Figure 11). SEM images for samples #545 (Figure 10) and #551 (Figure 11) illustrated the multiscale variation with the maximum magnification on the last picture in the sequence.
Sample #545 was composed of predominantly crystalline limestone with biogenic texture (Figure 7). The OM filled the space between calcite crystals with tiny rare voids less than 1 μm (Figure 10). Sample #551 encompassed a significant number of crystals immersed in a calcite matrix with OM (Figure 7). SEM images showed that there were two major types of voids (Figure 11). The first type had specific dimensions of less than 500 nm and resided in the OM. The second type was sporadic voids in the mineral matrix (biogenic clasts), with the size rarely larger than 250 nm.

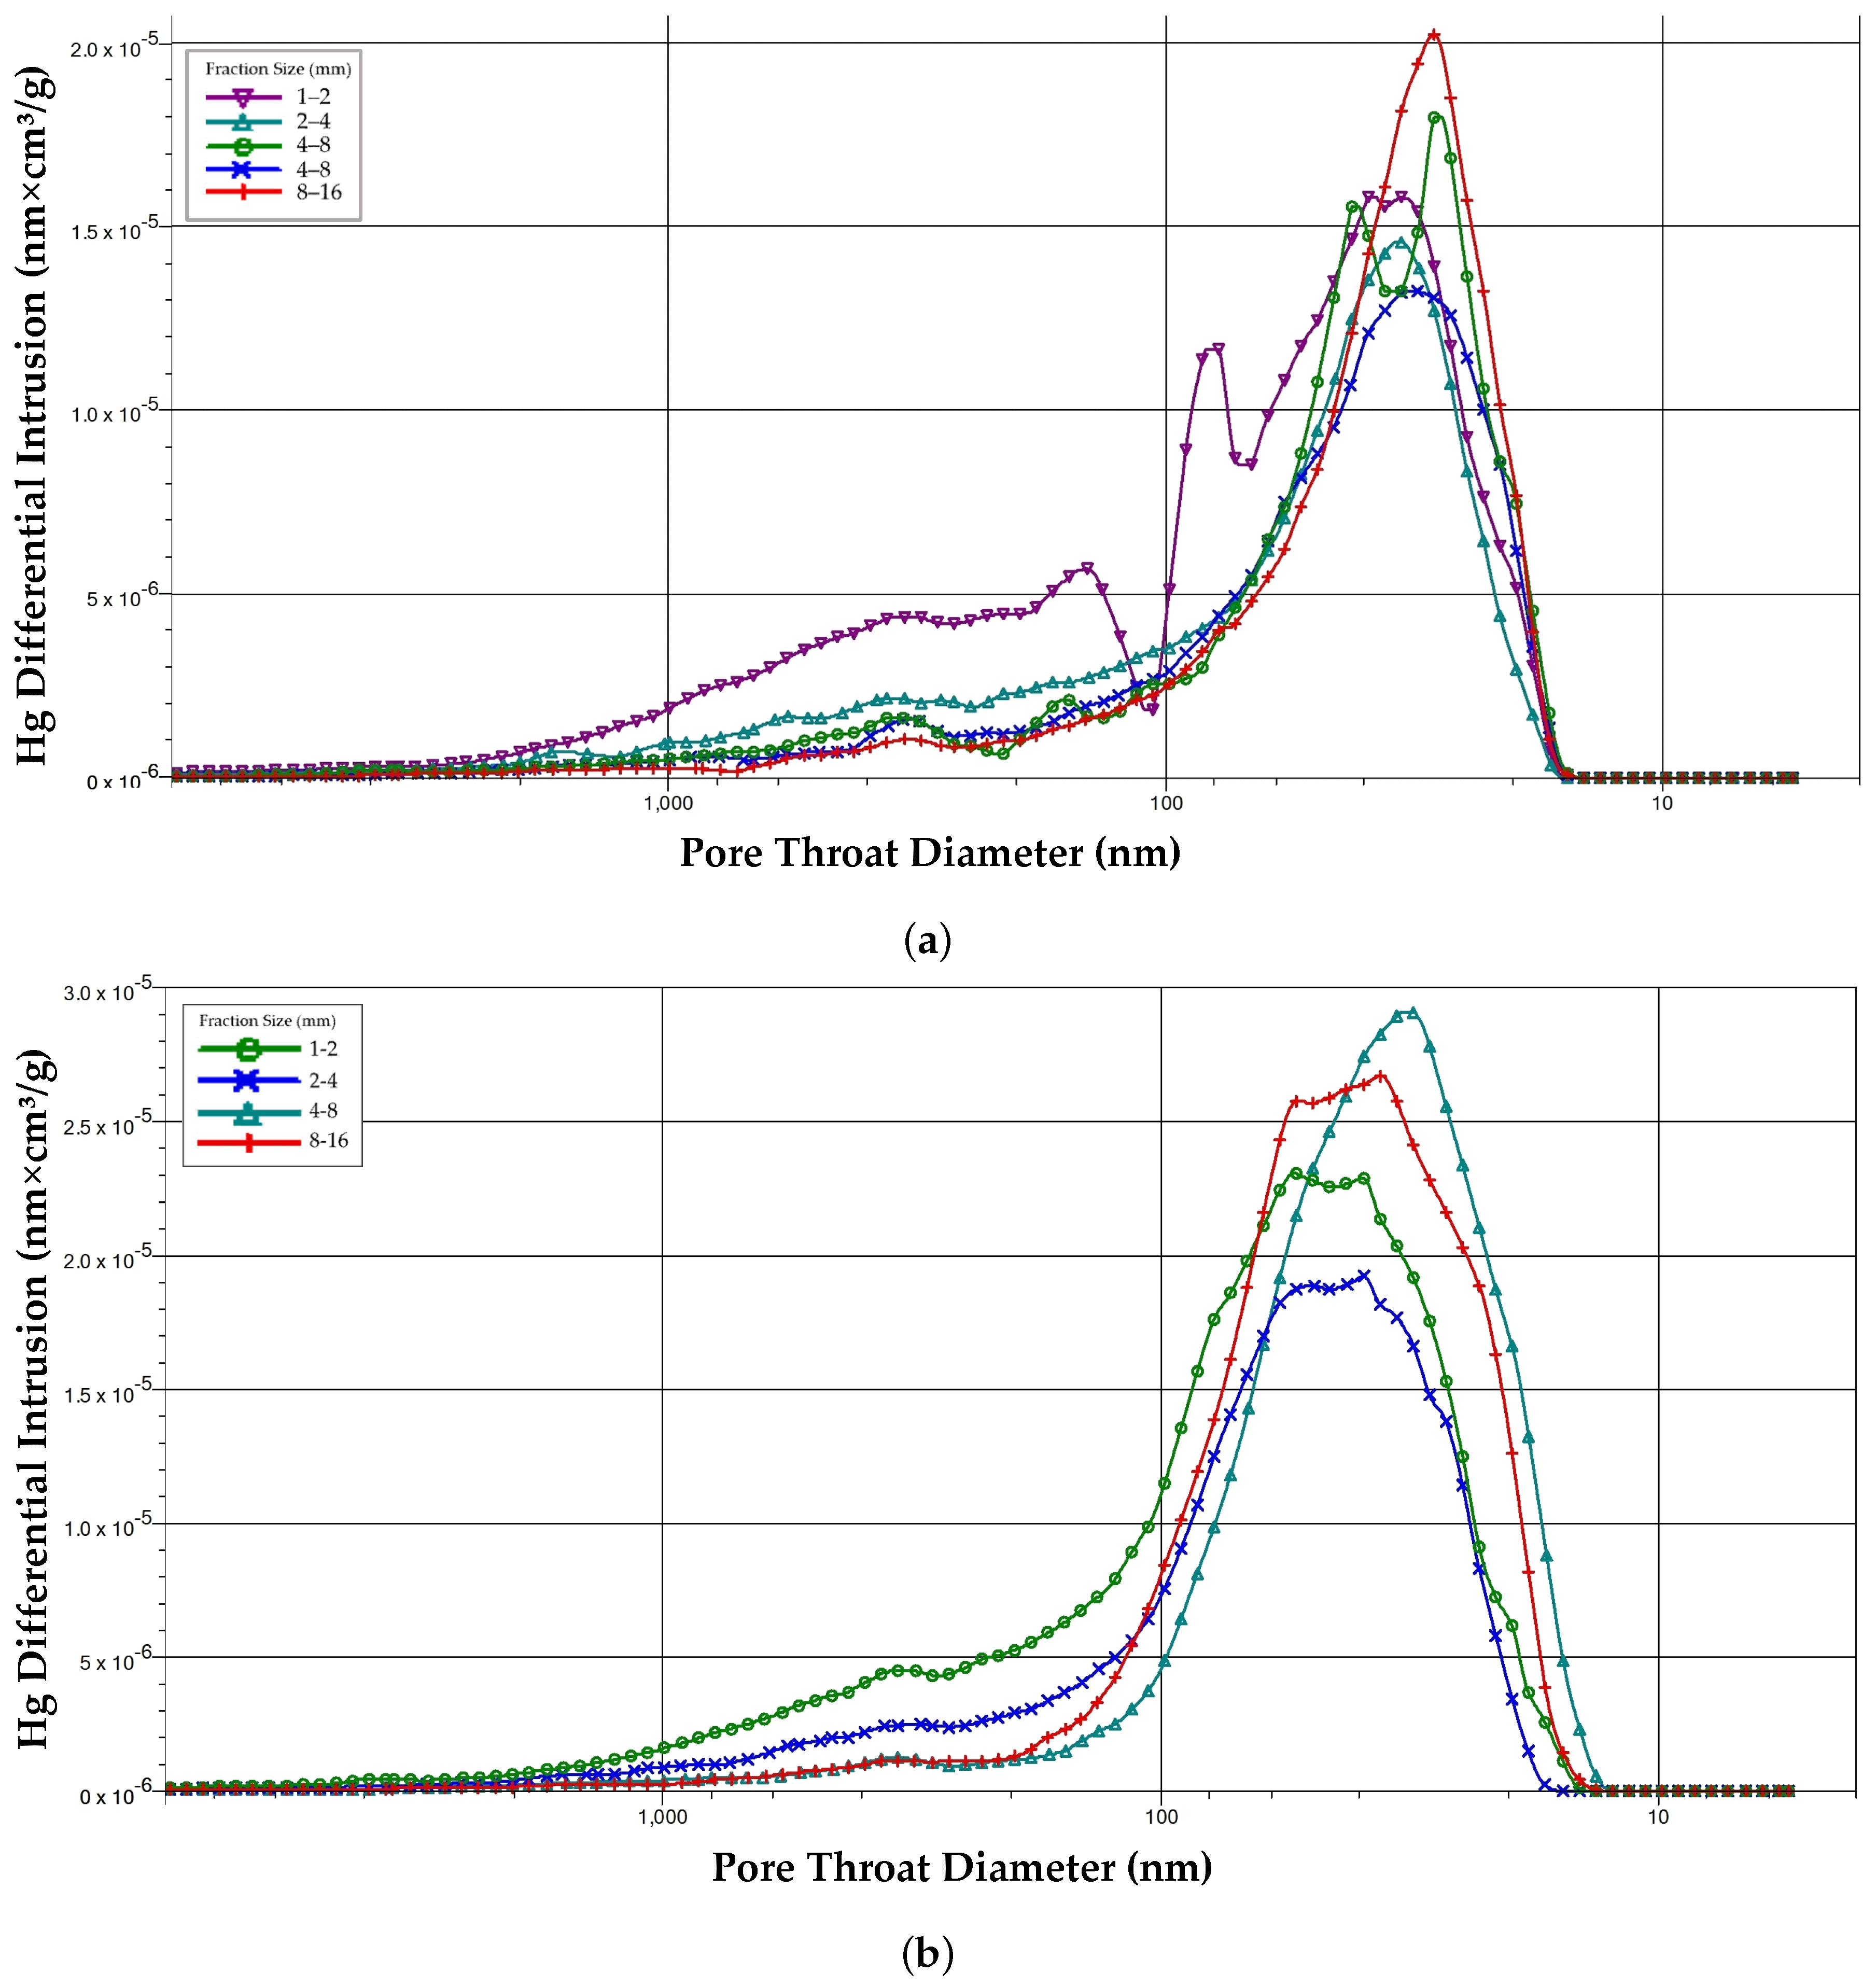
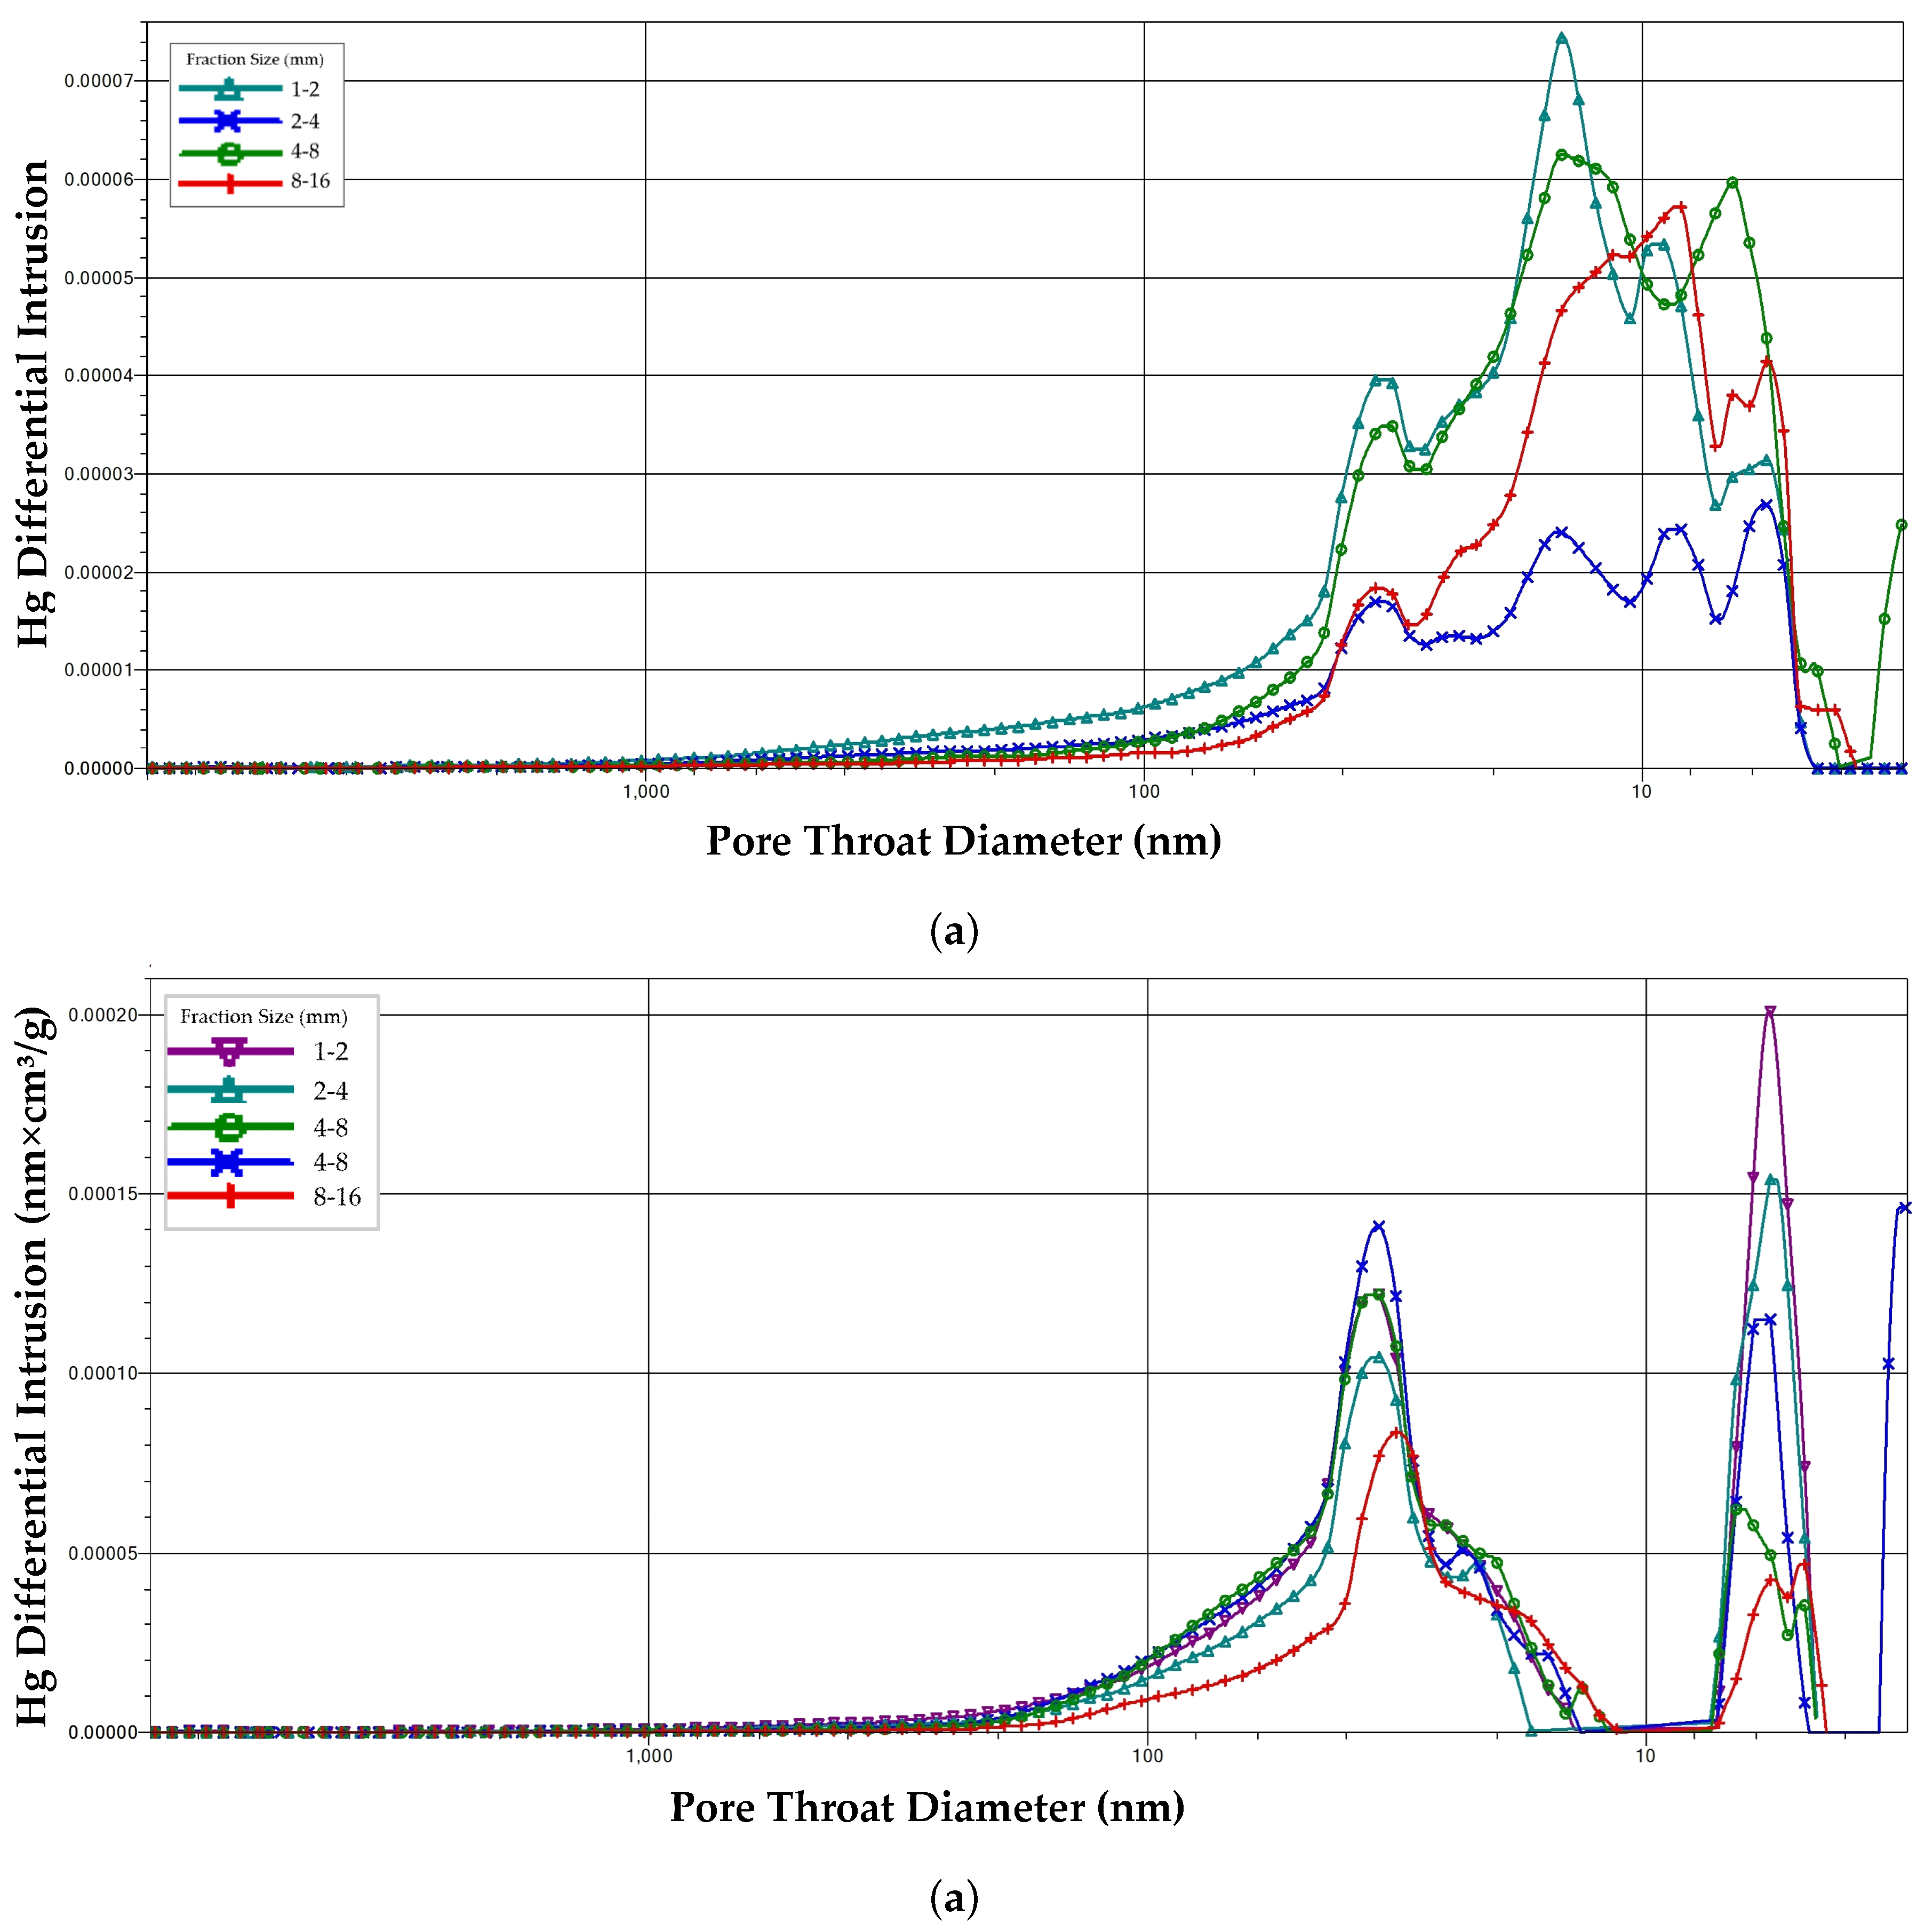
3.3. Pore Size Distributions

PSDs derived from MICP data reduction for both whole cores showed the actual independence of the differential properties of the void space structure on the rock fraction size (Figure 12 and Figure 13). Sample #545 (taken from the upper formation interval) showed almost identical PSDs before and after extraction, while sample #551 (taken from the lower BF interval) demonstrated the substantial difference in void space structure while maintaining the size range.
For both samples, the pore throat size spanned in the range of 10–100 nm. The whole core #545 (from the upper formation interval) showed a unimodal distribution with a median of around 50 nm. In comparison, the sample #551 from the lower formation unit showed a bimodal distribution with modes at approximately 50 and 8 nm correspondingly.

4. Discussion

The study included a full-featured characterization of the tight carbonate reservoir rock with a complex void space structure. The laboratory workflow included state-of-the-art techniques for unconventional core analysis. However, our experience showed that given a limited amount of core material, the solution was non-trivial, and the results required careful analysis and understanding of data quality.
Here we discuss the obtained results in the form of a connected story ending with definite scientific conclusions. We start from the quality of porosity and permeability data. Notably, we go through the relationships between porosity and/or permeability obtained using different methods. Eventually, we come up with a suite of laboratory methods required to understand the reservoir properties of the target rock.

4.1. Limitations of Pressure Pulse-Decay Technique to Measure Core-Plug Gas Porosity and Permeability

At the initial stage, we compared the gas porosity (Figure 3) and permeability (Figure 4) between the obtained data and the (a priori) dataset provided by the operator. The comparison (Figure 14) revealed two features. Firstly, PIK-PP gas porosity weakly correlated with a priori data (r2 = 0.54). Generally, a priori values were 2–3 times higher than those in the obtained laboratory results. Secondly, the comparison of permeability demonstrated a particular correlation. Nevertheless, the PIK-PP setup underestimated both gas porosity and permeability in comparison to the a priori dataset.
Both comparisons showed that the PIK-PP device (and potentially, its analogs) was not applicable for investigating the target rock samples. The most probable reason for this was the technical limitations of the method in terms of measuring porosity and permeability. The minimum limit of permeability for the PIK-PP device was 0.1 mD [38]. Therefore, the range of the observed values suggested that the porosity of the samples fell close to a lower detection limit of the device—0.6% for porosity. The mismatch in permeability (r2 = 0.94 in log-log scale) was much lower than that in porosity (Figure 14b). The behavior was related to the physical process of permeability measurement, that is, pressure drop versus time observation. Unlike porosity, permeability resulted from the reduction of a pressure decline curve. Thus, determining permeability was much more robust in terms of stabilization time since it did not require pressure monitoring until the end of gas propagation.
The observed results did not confirm the applicability of the PDP technique, implemented in both PIK-PP and DarcyMeter instruments for the target rock samples. Nevertheless, the quality determination of permeability required a set of certified low-permeable samples for calibration. To date, a technology for the manufacturing of calibration samples is in a development stage with no commercial offerings [57].
The lack of applicable routine core analysis methods required the application of advanced petrophysical techniques for characterizing porosity and permeability. Techniques describing the void space structure complemented the bulk methods and included μCT and SEM, NMR, and MICP.

4.2. NMR Delivers the Highest Porosity

The advanced part of the presented petrophysical research included liquid-saturation NMR for getting core-plug porosity, as well as Darcypress for defining the permeability of rock samples embedded in epoxy resin disks. Cross plots between NMR, LS, and a priori gas porosity demonstrated several features (Figure 15).
Firstly, we considered LS porosity and a priori gas porosity to be the same within the uncertainty of the method. The LS, also referred to as the gravimetric method, provided reliable results for rocks with a distinct number of open pores. In our case, the pore space mainly consisted of hard-to-saturate tiny pores. Thus, the amount of liquid remaining on the rock surface had a significant impact on the weighing results and led to an overestimation of the total porosity.
Secondly, a comparison of NMR vs. a priori showed no clear correlation between NMR and a priori (gas porosity). We explained the behavior by low reliability of the a priori gas porosity.
In summary, we considered that PIK-PP (and its analogs based on the standard PDP techniques) provided uncertain gas porosity. The NMR delivered the highest porosity values.
Fourthly, LS results were similar to the ones by gas porosity. A potential explanation of such behavior was the initially low open porosity, which complicated the porosity characterization for both of these methods. Due to the limited data on LS and the invasiveness of the technique, we considered its results as complementary information.
Thirdly, NMR delivered the highest porosity values (Figure 16). We explained this observation by the technical ability of NMR to detect a wide range of pores—from nano-sized pores filled with high-viscous components to large voids occupied by mobile (free) fluids. Voids captured by low-field NMR typically had dimensions in the range of 10 nm–10 μm [58,59]. Moreover, unlike gas and liquid-station techniques, NMR delivered total porosity, including isolated hydrocarbon-filled voids and organic-hosted pores.

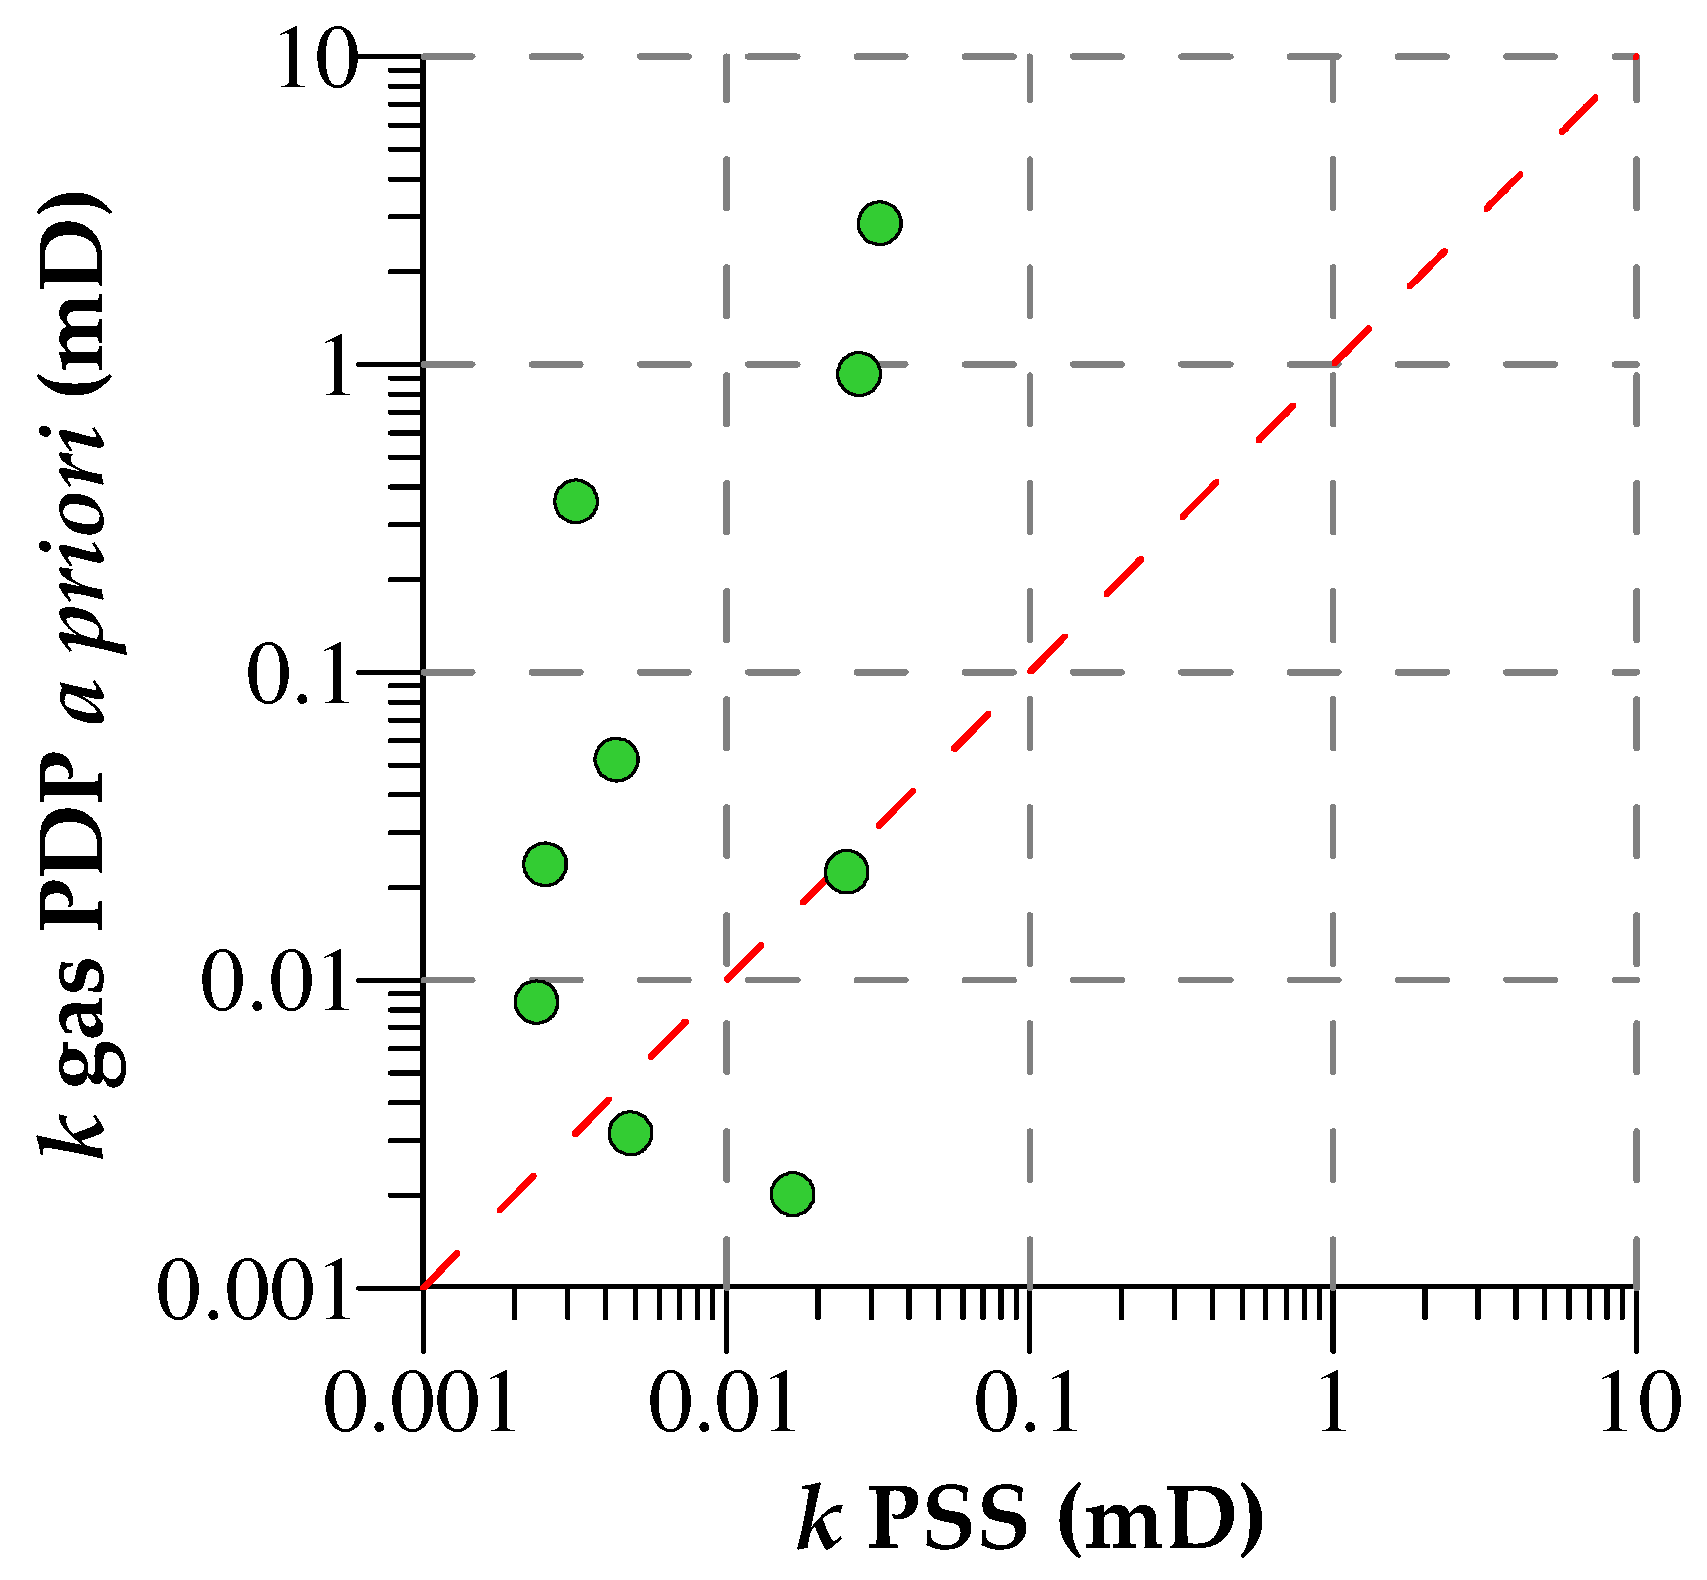
4.3. Pseudo-Steady-State Technique Delivers the Lowest Permeability

To understand which laboratory method provided reliable permeability data, we compared the Darcypress results for non-extracted samples and a priori gas permeability (Figure 17). The cross plot showed the difference in permeability ranges in which the maximum value reached by Darcypress did not exceed 0.1 mD. Previously, the Darcypress instrument proved to provide reliable permeability data in the range from 1 nD to several Darcies [43]. The observed difference in permeability by two orders of magnitude suggested that at least a priori gas permeability data was unreliable for target rock samples. The same fact also implied the low quality of data provided by the PIK-PP unit.
In this case, core-plug dimensions were nearly 3 times larger than those for rock chips for Darcypress analysis. This fact may explain the difference in results. The difference in specimen preparation could also impact the quality of permeability measurements. A high number of artificial fractures (cracks) induced by core plugging may have led to an overestimation of rock permeability.
General recommendations for the characterization of tight-rock permeability included the method developed by the Gas Research Institute (GRI) [60]. Previously, we attempted to measure the matrix permeability of the target rock samples using a commercially available Core Lab SMP-200 instrument. However, our experience showed that matrix permeability varied in the range from nano- to pico-Darcy [54] and did not explain the reservoir properties observed by the bulk methods.
In summary, the PSS technique implemented in the Darcypress instrument seemed to deliver the most reliable and precise permeability data. Further research on low permeability determination requires the application of reference samples possessing nano- and micro-Darcy range permeability [57].

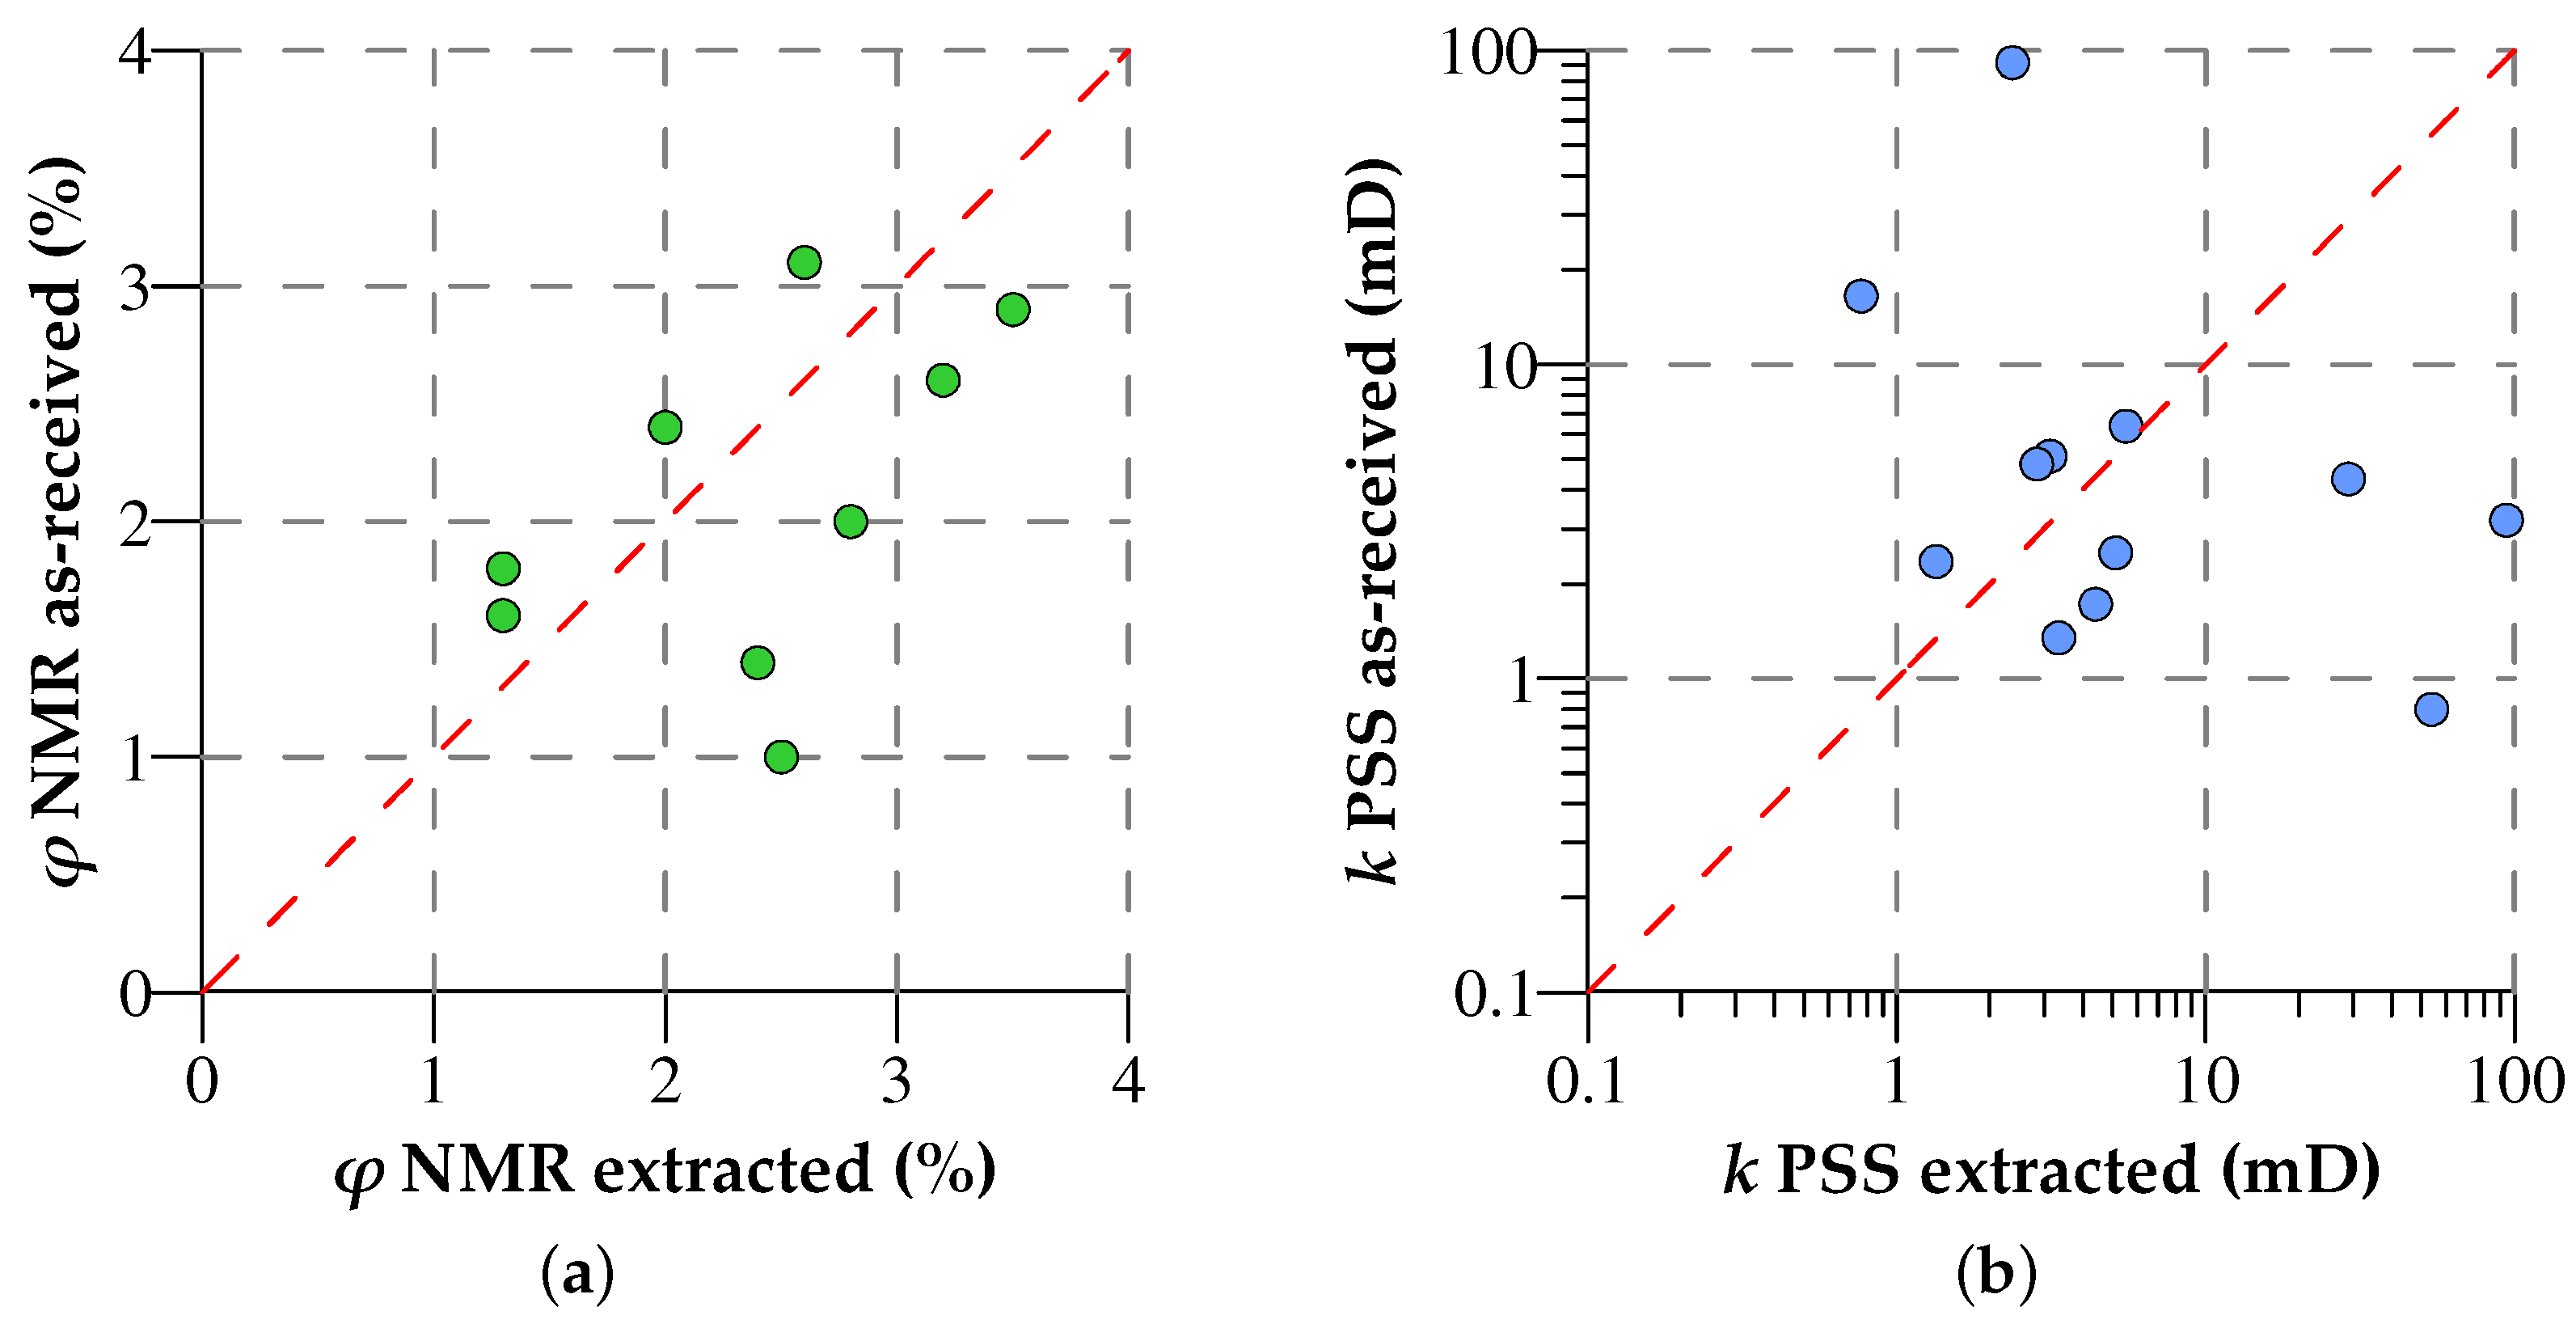
4.4. Standard Solvent-Cleaning Protocols Adversely Affect Reservoir Properties

A principal question for petrophysical laboratory core analysis is the requirement of core extraction or solvent cleaning. Generally, the core of conventional reservoirs rock should be extracted before reservoir properties’ determination [6]. In the case of complex tight reservoirs, that requirement is often questionable for several reasons. One of the reasons is the excessively long time required to extract rock samples fully. Here we try to understand the effect of core solvent cleaning on the target rock samples.
We observed non-essential changes in reservoir properties after the core extraction (Figure 6). Firstly, NMR porosity before extraction corresponded to that after extraction within the range of 1–2%, with 50% of data pointing to evidence of a porosity increase, and the remaining 50% telling the opposite. The growth of porosity was mainly driven by the removal of OM from the void space with micro- and nanometer-size pores.
Secondly, the Darcypress permeability remained the same (before and after extraction) for 50% of the tested samples. Core extraction also led to core disintegration and the development of artificial fractures due to core fragility and thin-layered structure. The artificial fractures (Appendix A, Figure A2) boosted permeability.
Thirdly, we observed that the extraction tended to decrease the porosity and permeability for selected rock samples (highlighted points in Figure 6), which was an unexpected behavior. Our literature research delivered few results on this topic, but we may consider several options. The first is the precipitation of organic solvents and components in voids during the extraction [61]. The second is an alteration of the void space structure due to its exposure to the solvent and corresponding physical–chemical interactions between the mineral–organic matrix and the solvent or damage to the minerals [62]. Removal of solid-phase OM led to creating empty pores and overestimating the total porosity [63]. A complete understanding of this behavior requires further research efforts involving Rock-Eval pyrolysis on core samples before and after extraction. For this reason, in this study, we tended to skip core cleaning and remove this step from the applied core analysis workflow.

4.5. Void Space Structure Characterization Explains Low Reservoir Properties

To understand the quality of the obtained reservoir properties, we characterized a void space structure using three levels of visualization—2D petrography for thin-sections, whole-core 3D CT, mini-core 3D μCT, and 2D SEM of core chips with maximal spatial resolution.
Optical microscopy was appropriate only for typing but did not provide essential information on the void space structure for two reasons. The first reason was the nanoscale size of voids limited their visibility (half of the light wavelength). The second reason was the thin-section manufacturing procedure. Moreover, thin-section preparation became complicated when injecting epoxy into nano- and micropores [64]. SEM allowed us to overcome these restrictions during studying micro- and nanoscale voids in tight rocks.
The low X-ray density contrast of both CT and μCT data suggested that one can achieve the complete resolution of individual minerals and their associations using a dual-energy CT [65,66]. A voxel size of 116–122 μm did not provide a proper spatial resolution to visualize VSS elements for the target whole cores. Moreover, reliable detection of a void object in a digital rock model required it to have a Feret diameter of at least 2–3 vx corresponding (at the obtained voxel size) to 232–366 μm, or about a third of a millimeter. However, with an open porosity of the samples of 1–2% (Table 2), we could not justify the presence of such large voids distributed uniformly throughout the volume of the sample.
Generally, the voxel size around 2–3 μm did not allow to resolve spatially and, therefore, visualize and quantify the elements of the void space structure for the studied rock samples. The reason was that a correct segmentation of a void object in a digital model requires at least 2–3 vx in each Ferret dimension that, at the obtained voxel size, corresponds to a characteristic void size of 8–12 μm. Moreover, the MICP results for samples #545 and #551 showed that the pore throats had typical dimensions of less than the first hundreds of nanometers. Thus, micro-CT, even with a voxel size of 0.5 μm corresponding to the spatial resolution of 1.5–2 μm, would not be able to image the void space structure of the target rock samples (Figure 9).
Images obtained with SEM demonstrated that mainly sporadic small (<3 μm) pores in organic matter and mineral matrix were present in the investigated samples (Figure 10 and Figure 11). Recent studies on the application of nanoscale-resolution 3D imaging show that a relatively small number of connected pores with pore diameter greater than 150 nm sustain most of the hydrocarbon production [8]. Thus, SEM enabled quality 2D imaging of micro- and nanoscale voids in the target rock samples. In summary, our results showed that SEM was the only reliable method among all tested that resolved micro- and nanovoids in the studied rocks samples.
MICP data highlighted the different effects of solvent extraction on pore size distributions (PSDs). The observed difference in the PSD reaction to solvent extraction between the lower and upper formation depth intervals implied heterogeneity in the void space structure. For sample #545 (upper interval), we saw an extension of PSDs in a pore-throat range of less than 100 nm (Figure 12). For sample #551, the extraction led to a radical change of the void space structure (Figure 13). Extraction vanished pore throats with sizes in the range 9–50 nm, and the liberated void volume redistributed into two ranges: 3–8 and 50–200 nm. We explained this by a relatively high content of solid OM in the lower interval. We assumed that OM blocked the void space and thereby led to an underestimation of the effective pore-throat size in the mineral matrix. The solvent extraction at least partially removed OM from the voids in the mineral matrix and thereby boosted their effective size and volume. In summary, we established that the sample cleaning alters the void space structure differently for different depth intervals. This effect was essential for understanding the measured porosity and permeability properties of tight carbonates similar to the target formation and should be accounted for during planning petrophysical core analysis.
In summary, the results of the VSS study showed that SEM was one of the few laboratory methods capable of imaging voids in the target rock samples. Sporadic micrometer-to-nanometer pores imaged in 2D by SEM explained the low porosity range. The narrow pore-throat distributions by MICP with peaks at around 70 nm justified the low permeability range. MICP also revealed a complex rock response to solvent cleaning, in which distinct rock units may exhibit a different change in pore space structure.

4.6. Reservoir Properties of Whole Cores

We summarized both the a priori and obtained porosity and permeability data collected for the target whole cores (Table 3). The a priori dataset included both gas porosity and permeability measured on whole cores (Section 2.1), while our results related to core plugs and rock chips. Nevertheless, we attempted to integrate both datasets. Initially, we managed to drill 2 core plugs from each whole core. One core plug was characterized in terms of gas porosity and permeability, and another core plug was saturated with kerosene and characterized in terms of NMR and liquid saturation techniques. The remaining parts of the whole cores were distributed in accordance with the sample preparation scheme (Figure 5).
Both NMR and MICP delivered the highest porosity values among all methods. In the case of sample #545, MICP porosity was larger (1.6%) than that by NMR (1.2%). For sample #551, the trend was opposite—1.8% by MICP versus 2.3% by NMR. We explained the behavior by a high percentage of nanopores (Figure 12). At the same time, NMR was not able to resolve voids with specific dimensions of less than 10 nm [59]. We explained the increased NMR porosity for sample #551 by the presence of viscous hydrocarbon components and OM-hosted pores captured by low-field NMR. In contrast to NMR, MICP relied on Hg intrusion into pores via throats. In our case, Hg could not penetrate a part of the void space due to potential pore-throat blockage by the viscous components.
Pulse-decay based instruments tended to underestimate the gas porosity for both whole cores. Particularly, the comparison showed a substantial difference between the obtained gas porosity (0.84%) and the corresponding a priori data (1.31%) for sample #551 (Table 3). We explained the difference due to several reasons. Firstly, a priori data resulted from whole-core measurements (Section 2.1), while the obtained results related to the core plug. However, [67] suggested a large variability in properties in the length-scale between ones and tens of centimeters. Secondly, a priori whole-core measurements may have been affected by the presence of larger pores and vugs, which could be physically destroyed during plugging. Therefore, the porosity difference of 0.47% presumably illustrated the effects of heterogeneity and scaling.
The gas permeability of both whole cores ranged as follows: whole cores yielded the highest values, while rock chips—the lowest values. The highest permeability difference reached 4 orders of magnitude. We assumed that the discrepancy of 1–2 orders of magnitude between PDP results was probably caused by the effects of scaling and rock heterogeneity. Section 4.3 explained the difference between the PDP and PSS results.

5. Conclusions

In the presented study, we implemented an integrated approach to characterize the ultralow-permeable carbonate reservoir rocks of the Tlyanchy-Tamakian Formation, Volga-Ural oil-gas province in Russia.
The suite of laboratory methods included both bulk measurements and multiscale void space characterization. Bulk techniques included gas volumetric, NMR, LS porosity and PDP, and PSS permeability, while imaging consisted of thin-section petrography, CT and μCT, and SEM. MICP was a proxy technique between bulk measurements and imaging. The target set of rock samples included whole cores, core plugs, mini cores, rock chips, and crushed rock.
The study resulted in the following significant findings for the target rock samples:
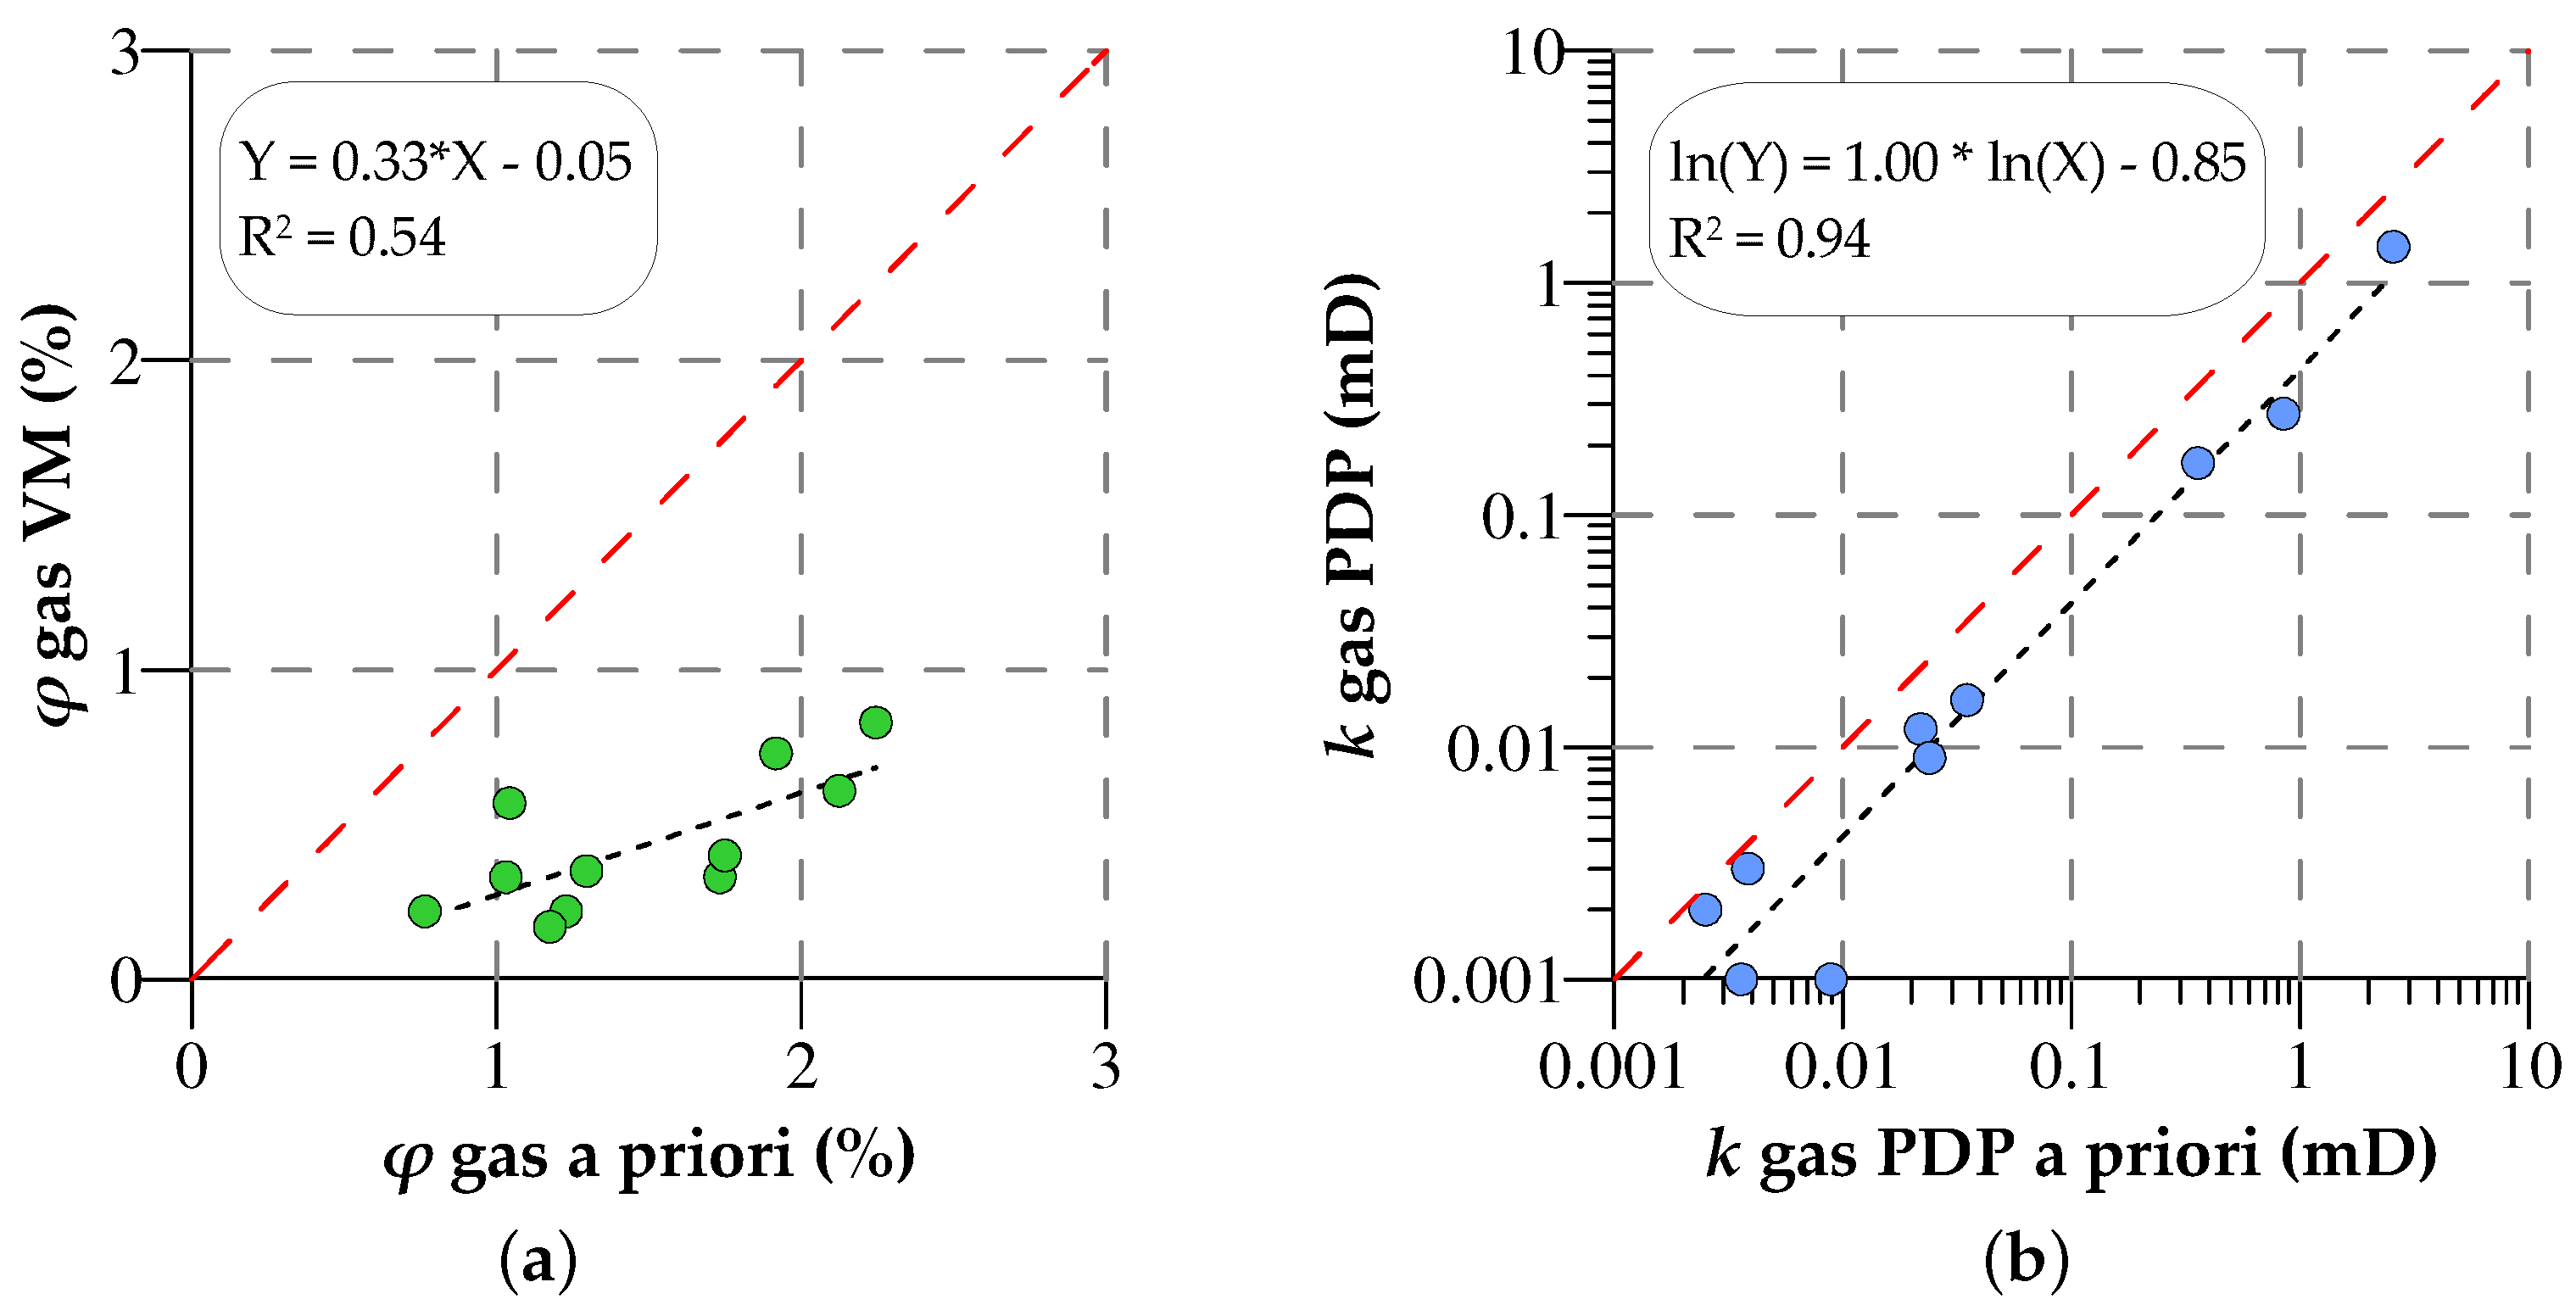
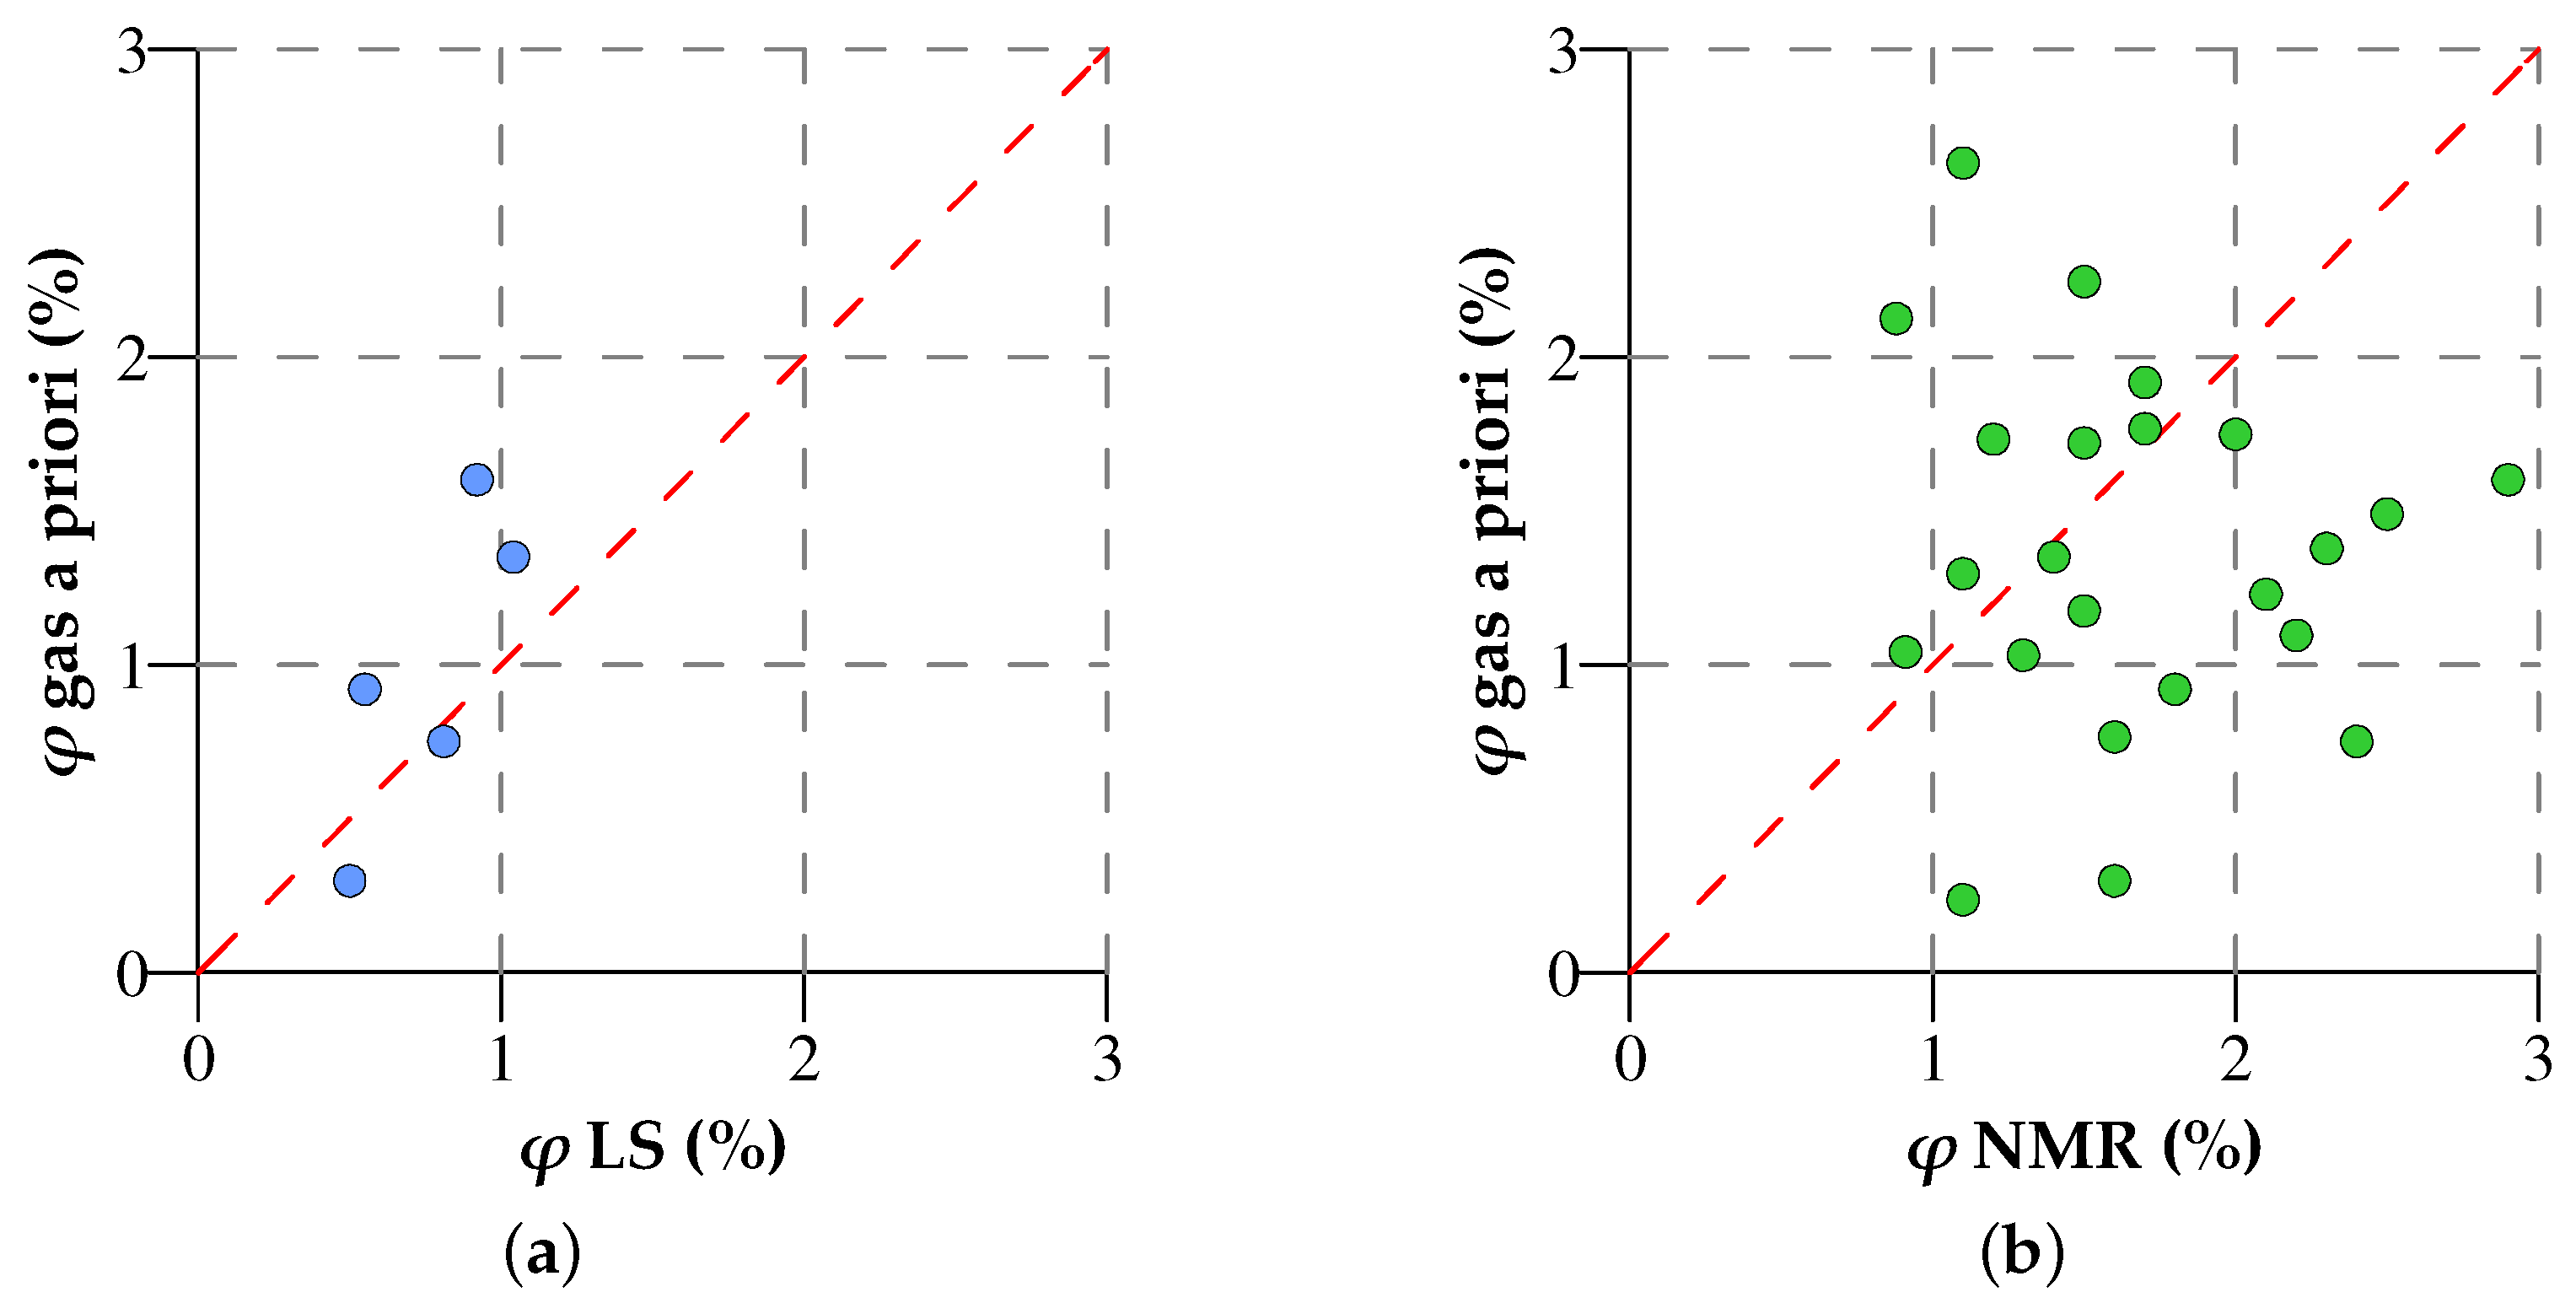
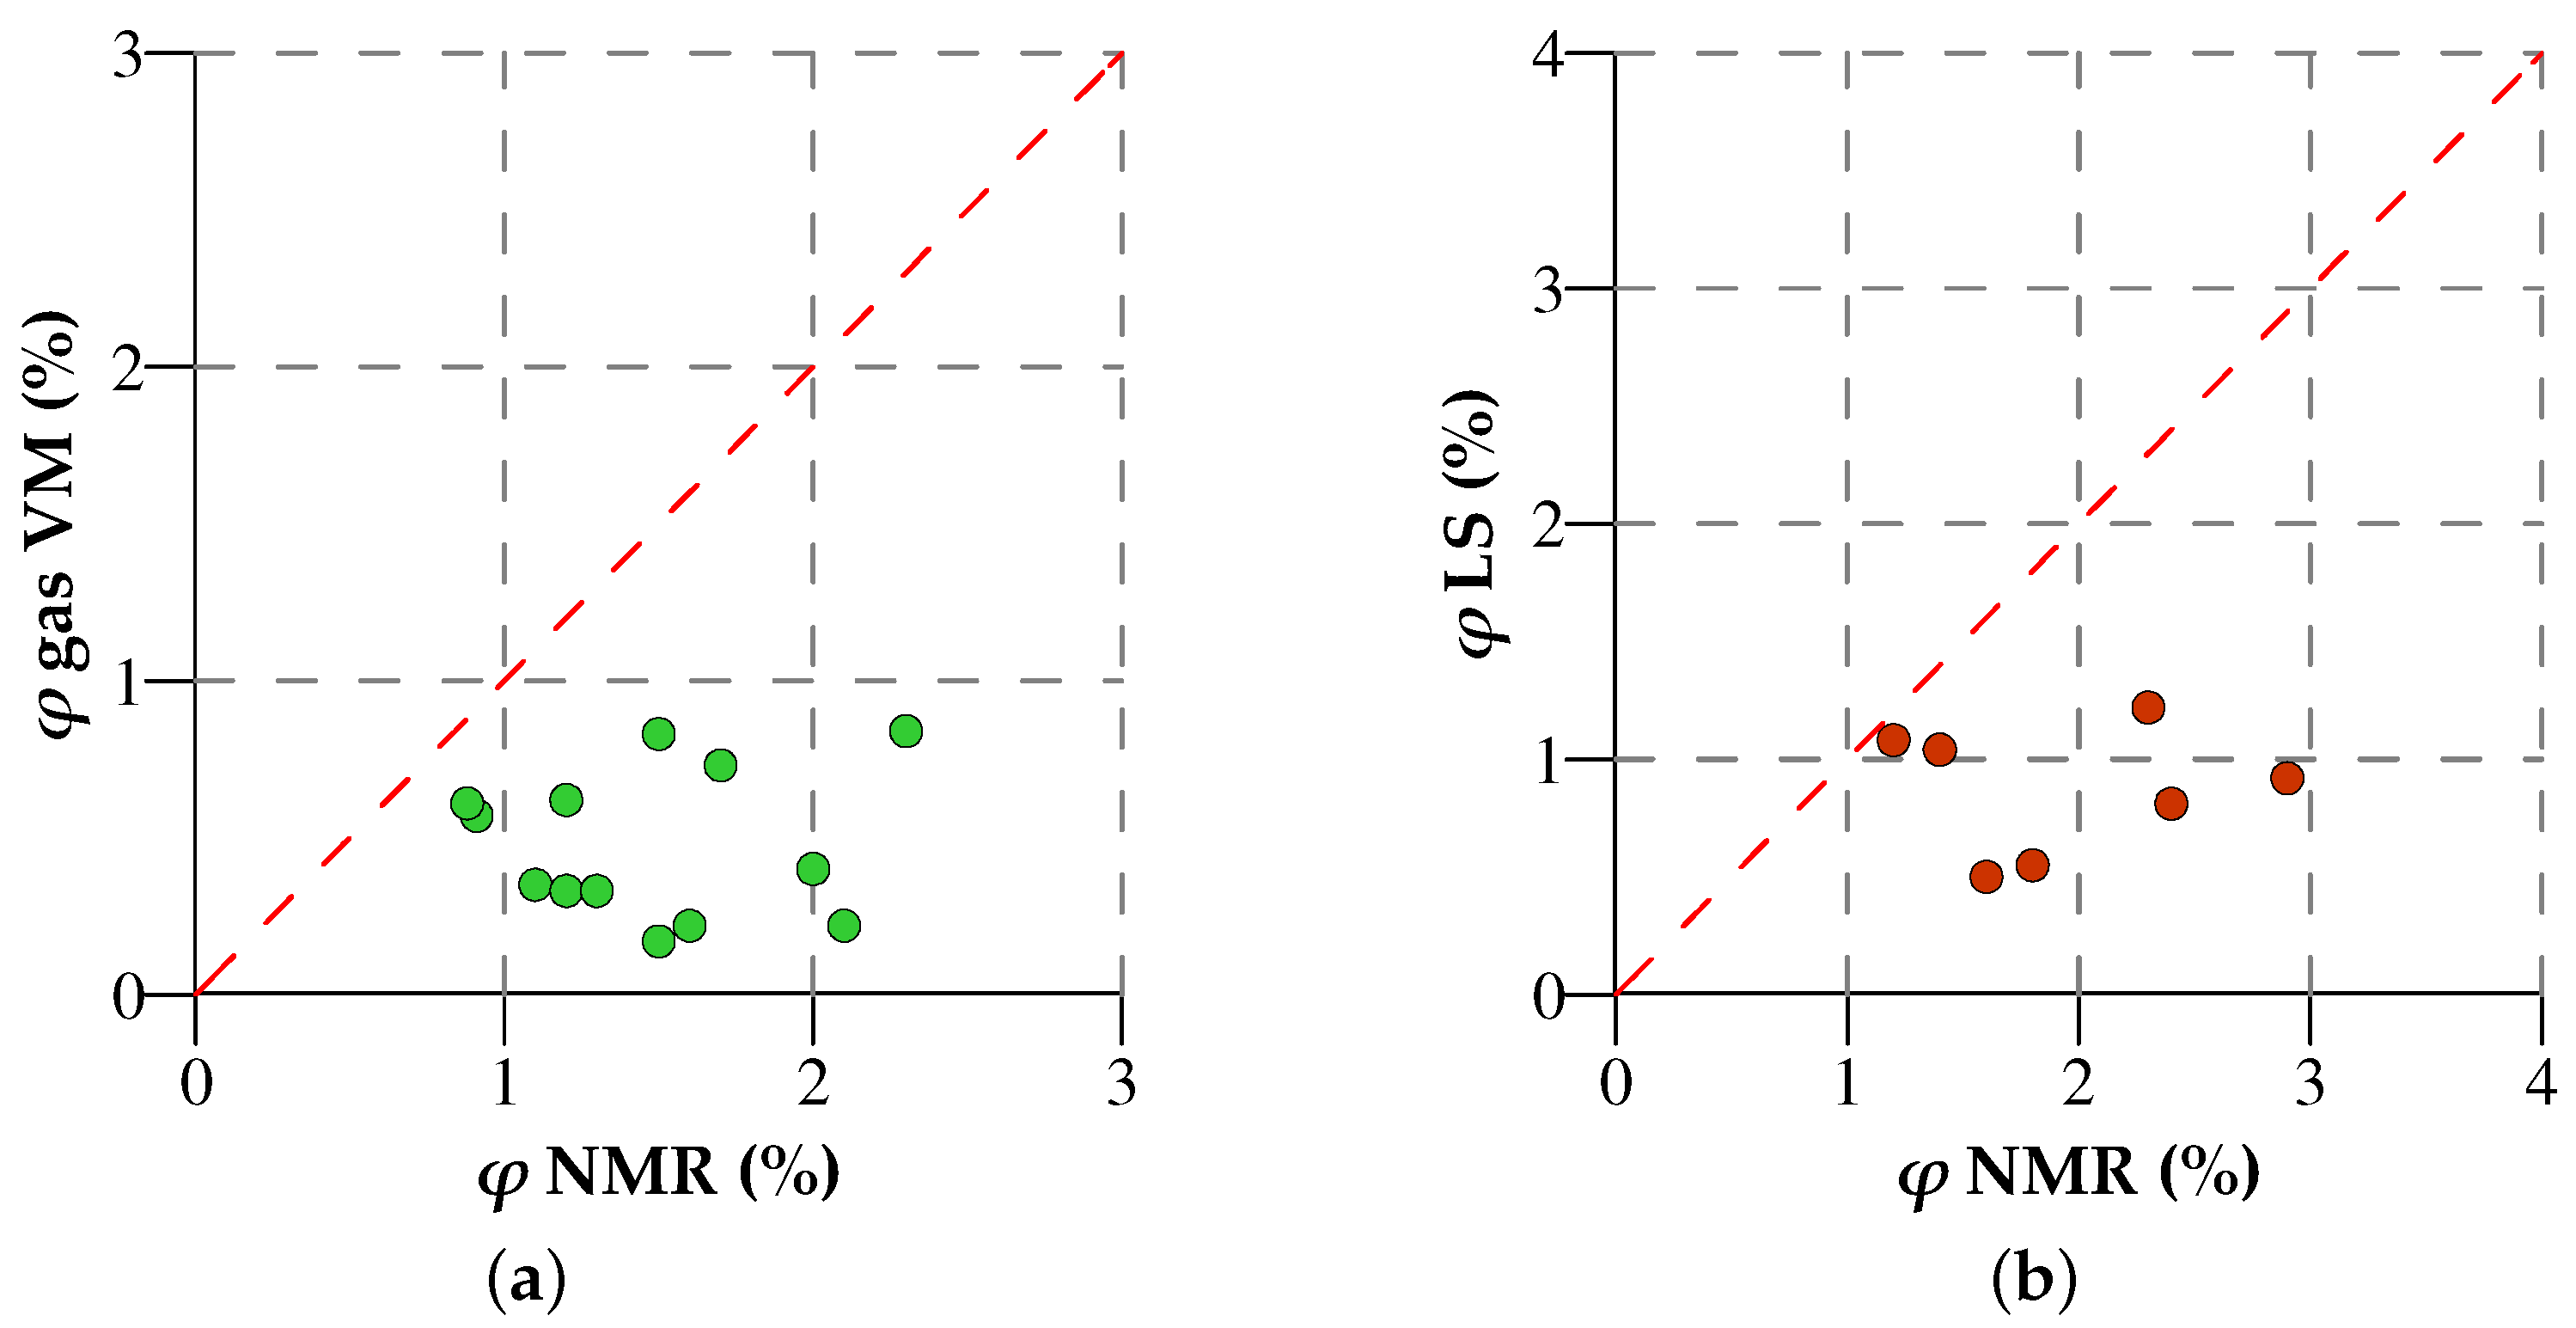
  • The gas volumetric core-plug gas-porosity results did not confirm the applicability of the PDP technique for the target rock samples. NMR delivered the highest porosity values due to its physical principle of non-invasive sensing. NMR–LS, NMR–gas porosity comparisons showed that NMR was the most appropriate technique for total porosity determination;
  • MICP porosity matched both NMR and imaging results and highlighted the different effects of solvent extraction on the throat size distribution of the target rock samples. The first was vanishing pore throats with sizes in the range 9–50 nm, followed by a redistribution of the liberated void volume into two ranges: 3–8 and 50–200 nm. The second was a partial removal of OM from voids in the mineral matrix, thereby boosting their effective size and volume;
  • PDP core-plug gas permeability measurements were consistent but overestimated in comparison to PSS results. We observed the difference reaching two orders of magnitude;
  • petrographic thin-section analysis, as well as CT and μCT, did not resolve the void space structure of the target rock samples. SEM proved to be the only feasible method for void-scale imaging with a spatial resolution up to 5 nm. The results confirmed the presence of natural voids of two major types. The first type was OM-hosted pores, with dimensions of less than 500 nm. The second type was sporadic voids in the mineral matrix (biogenic clasts), rarely larger than 250 nm;
  • comparisons between whole-core and core-plug reservoir properties showed substantial differences in both porosity (by a factor of 2) and permeability (up to 4 orders of magnitude) caused by spatial heterogeneity and scaling.
The observed experimental features are essential for understanding the measured porosity and permeability properties of tight carbonates similar to the target formation and are critical during the planning of petrophysical core analysis.

Author Contributions

Conceptualization, A.M., A.K., and A.C.; methodology, A.M., A.K., N.B., A.C., and M.S.; investigation, A.M., A.K., and T.K.; supervision, N.B., S.M., M.S., and A.C.; formal analysis, A.M. and A.K.; resources, N.B., A.C., M.S., and S.M.; data curation, A.M., A.K., T.K., and A.C.; writing and editing, A.M., A.K., T.K, and A.C. All authors have read and agreed to the published version of the manuscript.

Funding

This research received funding within the framework of an industrial project with LUKOIL Engineering LLC.

Acknowledgments

The authors would like to express gratitude to the PermNIPIneft branch of LUKOIL-Engineering LLC for providing the core material for testing. The authors thank their colleagues from Skoltech’s Center for Hydrocarbon Recovery: Mikhail Yu. Spasennykh for the opportunity to conduct the research; Victor Nachev, Evgeny Shilov, Philipp Denisenko, and Denis Orlov for help in conducting experiments and discussions. We appreciate the major contribution of Maxim S. Mel’gunov (Boreskov Institute of Catalysis SB RAS), as well as Ivan V. Myakshin (LUKOIL-Engineering PermNIPIneft) with planning and conducting mercury injection porosimetry experiments. Finally, the authors owe to anonymous peer reviewers for their time and effort to make this paper even better.

Conflicts of Interest

The authors declare no conflict of interest.

Appendix A. Supplementary Figures

Figure A1. 3D view photo of the whole core #545.
Energies 13 02233 g0a1
Figure A2. Fractures occurred after extraction on an example of the Darcypress probes.
Energies 13 02233 g0a2

Appendix B. Common Shared Techniques

The core analysis workflows employed the main recommendations for rock analysis [6].
We determined the open porosity of the target rock samples using the standard liquid saturation or gravimetric method. The technique consisted of saturating a rock sample with a liquid (usually kerosene or water) and determining its volume by immersion in the saturating fluid utilizing precise laboratory scales A&D GH-202GH with an AD1653 gravimetric console.
The core saturation procedure consisted of vacuuming the samples, capillary imbibition, and injection of a saturating fluid under a pressure of 15 MPa using an automatic saturating unit Geologika PIK-SK.
Core crushing and probe preparation employed the crushing machine ASCS Scientific Jaw Crusher JC-300-ST-Q. We separated the core fractions by mesh size using the vibratory sieve shaker RETSCH AS 450 control.
Core cleaning (extraction) included cleaning the rock samples (core plugs and core chips) with chloroform in a Soxhlet apparatus. We controlled the extraction quality by both visual inspection with a UV lamp and by measuring the TOC content on rock specimens every 24 h. The time of extraction averaged 150 h.
After extraction, we dried the rock samples at a temperature of 70 °C in the laboratory heating oven Memmert VO400 until attaining a constant weight.
The Wildcat Technology HAWK RW instrument provided Rock-Eval pyrolysis measurements for source rock geochemical analysis and data interpretation [68].
Optical microscopy is the most common and universal method for studying mineral composition and textural features of sedimentary rocks. We imaged a set of thin sections (10–20 μm) using the Carl Zeiss Imager A2m polarizing microscope with transmitted light (12 V halogen lamp, 100 W). The resulting spatial resolution depended on many factors related to sample preparation. However, we managed to achieve the image pixel size of about 10 μm.

References

  1. Zhang, K.; Sebakhy, K.; Wu, K.; Jing, G.; Chen, N.; Chen, Z.; Hong, A.; Torsæter, O. Future Trends for Tight Oil Exploitation. In Proceedings of the SPE North Africa Technical Conference and Exhibition, Cairo, Egypt, 14 September 2015; p. 14. [Google Scholar]
  2. Sheng, J.J. Critical Review of Field EOR Projects in Shale and Tight Reservoirs. J. Pet. Sci. Eng. 2017, 159, 654–665. [Google Scholar] [CrossRef]
  3. Carbonate Petroleum Reservoirs; Roehl, P.O.; Choquette, P.W. (Eds.) Springer: New York, NY, USA, 1985; p. 622. [Google Scholar]
  4. Ahr, W.M. Geology of Carbonate Reservoirs: The Identification, Description, and Characterization of Hydrocarbon Reservoirs in Carbonate Rocks; Wiley: Hoboken, NJ, USA, 2008; p. xvi, 277. [Google Scholar]
  5. Burchette, T. Carbonate Rocks and Petroleum Reservoirs: A Geological Perspective From the Industry. Geol. Soc. London Spec. Publ. 2012, 370, 17–37. [Google Scholar] [CrossRef]
  6. Recommended Practices for Core Analysis. Recommended Practice 40, 2nd ed.; American Petroleum Institute (API): Washington, DC, USA, 1998; p. 220.
  7. Kazak, E.S.; Kazak, A.V. A Novel Laboratory Method for Reliable Water Content Determination of Shale Reservoir Rocks. J. Pet. Sci. Eng. 2019, 183, 106301. [Google Scholar] [CrossRef]
  8. Goral, J.; Walton, I.; Andrew, M.; Deo, M. Pore System Characterization of Organic-Rich Shales using Nanoscale-Resolution 3D Imaging. Fuel 2019, 258, 116049. [Google Scholar] [CrossRef]
  9. Nelson, P.H. Pore-Throat Sizes in Sandstones, Tight Sandstones, and Shales. Geologic Note. AAPG Bull. 2009, 93, 329–340. [Google Scholar] [CrossRef]
  10. Kazak, A.; Chugunov, S.; Chashkov, A. Integration of Large-Area Scanning-Electron-Microscopy Imaging and Automated Mineralogy/Petrography Data for Selection of Nanoscale Pore-Space Characterization Sites. SPE-191369-PA 2018, 21, 821–836. [Google Scholar] [CrossRef]
  11. Saidian, M.; Kuila, U.; Godinez, L.; Rivera, S.; Prasad, M. A comparative study of porosity measurement in mudrocks. SEG Tech. Program Expand. Abstr. 2014, 2433–2438. [Google Scholar] [CrossRef]
  12. Labani, M.; Rezae, R. Petrophysical Evaluation of Gas Shale Reservoirs. In Fundamentals of Gas Shale Reservoirs; Wiley & Sons: Hoboken, NJ, USA, 2015; pp. 117–137. [Google Scholar] [CrossRef]
  13. Moghadam, A.A.; Chalaturnyk, R. Laboratory Investigation of Shale Permeability. In Proceedings of the SPE/CSUR Unconventional Resources Conference, Calgary, AB, Canada, 20 October 2015; p. 27. [Google Scholar]
  14. Profice, S.; Hamon, G.; Nicot, B. Low-Permeability Measurements: Insights. Petrophysics 2016, 57, 30–40. [Google Scholar]
  15. Sander, R.; Pan, Z.; Connell, L.D. Laboratory Measurement of Low Permeability Unconventional Gas Reservoir Rocks: A Review of Experimental Methods. J. Nat. Gas Sci. Eng. 2017, 37, 248–279. [Google Scholar] [CrossRef]
  16. Jiang, Z.; Mao, Z.; Shi, Y.; Wang, D. Multifractal Characteristics and Classification of Tight Sandstone Reservoirs: A Case Study from the Triassic Yanchang Formation, Ordos Basin, China. Energies 2018, 11, 2242. [Google Scholar] [CrossRef] [Green Version]
  17. Krakowska, P.; Puskarczyk, E.; Jędrychowski, M.; Habrat, M.; Madejski, P.; Dohnalik, M. Innovative Characterization of Tight Sandstones From Paleozoic Basins in Poland Using X-ray Computed Tomography Supported by Nuclear Magnetic Resonance and Mercury Porosimetry. J. Pet. Sci. Eng. 2018, 166, 389–405. [Google Scholar] [CrossRef]
  18. Adebayo, A.R.; Babalola, L.; Hussaini, S.R.; Alqubalee, A.; Babu, R.S. Insight into the Pore Characteristics of a Saudi Arabian Tight Gas Sand Reservoir. Energies 2019, 12, 4302. [Google Scholar] [CrossRef] [Green Version]
  19. Smodej, J.; Lemmens, L.; Reuning, L.; Hiller, T.; Klitzsch, N.; Claes, S.; Kukla, P.A. Nano- to Millimeter Scale Morphology of Connected and Isolated Porosity in the Permo-Triassic Khuff Formation of Oman. Geosciences 2019, 10, 7. [Google Scholar] [CrossRef] [Green Version]
  20. Yuan, Y.; Rezaee, R. Comparative Porosity and Pore Structure Assessment in Shales: Measurement Techniques, Influencing Factors and Implications for Reservoir Characterization. Energies 2019, 12, 2094. [Google Scholar] [CrossRef] [Green Version]
  21. Jiang, T.; Rylander, E.; Singer, P.M.; Lewis, R.E.; Sinclair, S.M. Integrated Petrophysical Interpretation of Eagle Ford Shale with 1-D and 2-D Nuclear Magnetic Resonance (NMR). In Proceedings of the SPWLA 54th Annual Logging Symposium, New Orleans, LA, USA, 22–26 June 2013. [Google Scholar]
  22. Gao, H.; Li, H. Determination of Movable Fluid Percentage and Movable Fluid Porosity in Ultra-Low Permeability Sandstone Using Nuclear Magnetic Resonance (NMR) Technique. J. Pet. Sci. Eng. 2015, 133, 258–267. [Google Scholar] [CrossRef]
  23. Schmitt, M.; Halisch, M.; Fernandes, C.P.; Santos, V.S.S.d.; Weller, A. Fractal Dimension: An Indicator to Characterize the Microstructure of Shale and Tight Gas Sands Considering Distinct Techniques and Phenomena. In Proceedings of the International Symposium of the Society of Core Analysts, Snowmass, CO, USA, 21–26 August 2016; p. 6. [Google Scholar]
  24. Comisky, J.T.; Santiago, M.; McCollom, B.; Buddhala, A.; Newsham, K.E. Sample Size Effects on the Application of Mercury Injection Capillary Pressure for Determining the Storage Capacity of Tight Gas and Oil Shales. In Proceedings of the Canadian Unconventional Resources Conference, Calgary, AB, Canada, 15–17 November 2011. [Google Scholar]
  25. Hu, Q.; Gao, X.; Gao, Z.; Ewing, R.; Dultz, S.; Kaufmann, J. Pore Accessibility and Connectivity of Mineral and Kerogen Phases in Shales. In Proceedings of the SPE/AAPG/SEG Unconventional Resources Technology Conference, Denver, CO, USA, 25–27 August 2014. [Google Scholar]
  26. Goldstein, J.; Newbury, D.; Joy, D. Scanning Electron Microscopy and X-ray Microanalysis, 3rd ed.; Kluwer Academic, Plenum Publishers: New York, NY, USA, 2003. [Google Scholar]
  27. Camp, W.K. Electron Microscopy of Shale Hydrocarbon Reservoirs. In AAPG Memoir 102; American Association of Petroleum Geologists: Tulsa, OK, USA, 2013. [Google Scholar]
  28. Gabnasyrov, A.V.; Lyadova, N.A.; Putilov, I.S.; Solovyev, S.I. Domanik Shale Oil: Unlocking Potential. In Proceedings of the SPE Russian Petroleum Technology Conference and Exhibition, Moscow, Russia, 24–26 October 2016. [Google Scholar]
  29. Bushnev, D.A.; Burdel’naya, N.S. Modeling of Oil Generation by Domanik Carbonaceous Shale. Pet. Chem. 2013, 53, 145–151. [Google Scholar] [CrossRef]
  30. Fadeeva, N.P.; Kozlova, E.V.; Poludetkina, E.N.; Shardanova, T.A.; Pronina, N.V.; Stupakova, A.V.; Kalmykov, G.A.; Khomyak, A.N. The Hydrocarbon-Generation Potential of the Domanik Rocks in the Volga–Ural Petroliferous Basin. Mosc. Univ. Geol. Bull. 2016, 71, 41–49. [Google Scholar] [CrossRef]
  31. Stupakova, A.V.; Kalmikov, G.A.; Korobova, N.I.; Fadeeva, N.P.; Gotovskiy, Y.A. The Domanic Formation of the Volga-Ural Basin—Types of the Section, Formation Conditions and Hydrocarbon Potential. Georesursy 2017, 1, 112–124. [Google Scholar] [CrossRef]
  32. Requejo, A.G.; Sassen, R.; Kennicutt, M.C.; Kvedchuk, I.; McDonald, T.; Denoux, G.; Comet, P.; Brooks, J.M. Geochemistry of Oils from The Northern Timan-Pechora Basin, Russia. Org. Geochem. 1995, 23, 205–222. [Google Scholar] [CrossRef]
  33. Abrams, M.A.; Apanel, A.M.; Timoshenko, O.M.; Kosenkova, N.N. Oil Families and Their Potential Sources in the Northeastern Timan Pechora Basin, Russia. AAPG Bull. 1999, 83, 553–577. [Google Scholar]
  34. Prishchepa, O.M.; Averianova, O.Y.; Ilyinskiy, A.A.; Morariu, D. Tight Oil and Gas Formations—Russia’s Hydrocarbons Future Resources; VNIGRI: Saint-Petersburg, Russia, 2014. [Google Scholar]
  35. Kadyrov, R.; Galiullin, B.; Statsenko, E. The Porous Space Structure of Domanik Shales in the East of Russian Plate. In Proceedings of the International Multidisciplinary Scientific GeoConference-SGEM, Albena, Bulgaria, 2–8 July 2018. 2018; pp. 907–914. [Google Scholar]
  36. Dunham, R.J.; Ham, W.E. Classification of Carbonate Rocks According to Depositional Texture. In Classification of Carbonate Rocks—A Symposium; American Association of Petroleum Geologists: Tulsa, OK, USA, 1962; Volume 1, pp. 108–121. [Google Scholar]
  37. McPhee, C.; Reed, J.; Zubizarreta, I. Core Analysis: A Best Practice Guide, 1st ed.; Elsevier: Amsterdam, The Netherlands, 2015. [Google Scholar]
  38. Geologika Manual. PIK-PP Automated Unit for Measurung Porosity and Permeability of Rock Samples:User Manual; Geologika Internal Publishing: Novosibirsk, Russia, 2016. [Google Scholar]
  39. Abragam, A. The Principles of Nuclear Magnetism; Clarendon Press: Oxford, UK, 1961; p. 599. [Google Scholar]
  40. Callaghan, P. Principles of Nuclear Magnetic Resonance Microscopy; Clarendon Press: Oxford, UK, 1991. [Google Scholar]
  41. Bloembergen, N.; Purcell, E.M.; Pound, R.V. Relaxation Effects in Nuclear Magnetic Resonance Absorption. Phys. Rev. 1948, 73, 679–712. [Google Scholar] [CrossRef]
  42. Straley, C.; Rossini, D.; Vinegar, H.J.; Tutunjan, P.; Morriss, C.E. Core Analysis by Low-Field NMR. Log Anal. 1997, 38, 84–94. [Google Scholar]
  43. Lenormand, R.; Bauget, F.; Ringot, G. Permeability Measurement on Small Rock Samples. In Proceedings of the International Symposium of the Society of Core Analysts, Halifax, Canada, 4–7 October 2010. [Google Scholar]
  44. Cydarex. DarcyPress User Manual; Cydarex Internal Publishing: Paris, France, 2017. [Google Scholar]
  45. Webb, P.A. An Introduction to the Physical Characterization of Materials by Mercury Intrusion Porosimetry with Emphasis on Reduction and Presentation of Experimental Data; Micromeritics Instrument Corp.: Norcross, GA, USA, 2001; p. 23. [Google Scholar]
  46. Wong, P.-Z. Methods in the Physics of Porous Media; Wong, P.-Z., Ed.; Academic Press: Cambridge, MA, USA, 1999; Volume 35, p. 485. [Google Scholar]
  47. Micromeritics. AutoPore V Series Operator Manual Nov 2017 (Rev D); Micromeritics Instrument Corporation: Norcross, GA, USA, 2017. [Google Scholar]
  48. Peters, E.J. Advanced Petrophysics—Volume 2: Dispersion, Interfacial Phenomena/Wettability, Capillarity/Capillary Pressure, Relative Permeability, 1st ed.; Live Oak Book Company: Austin, TX, USA, 2012; Volume 2, p. 276. [Google Scholar]
  49. Akima, H. A New Method of Interpolation and Smooth Curve Fitting Based on Local Procedures. J. Assoc. Comput. Mach. 1970, 17, 589–602. [Google Scholar] [CrossRef]
  50. Cnudde, V.; Boone, M.N. High-Resolution X-ray Computed Tomography in Geosciences: A Review of the Current Technology and Applications. Earth-Sci. Rev. 2013, 123, 1–17. [Google Scholar] [CrossRef] [Green Version]
  51. Remeysen, K.; Swennen, R. Application of Microfocus Computed Tomography in Carbonate Reservoir Characterization: Possibilities and Limitations. Mar. Pet. Geol. 2008, 25, 486–499. [Google Scholar] [CrossRef]
  52. Thermo Fisher Scientific. PerGeos Software Instructions. 2018. Available online: https://www.thermofisher.com/ru/ru/home/industrial/electron-microscopy/electron-microscopy-instruments-workflow-solutions/3d-visualization-analysis-software/pergeos-digital-rock-analysis.html (accessed on 15 June 2018).
  53. Erdman, N.; Drenzek, N. Integrated Preparation and Imaging Techniques for the Microstructural and Geochemical Characterization of Shale by Scanning Electron Microscopy. In AAPG Memoir. Electron Microscopy of Shale Hydrocarbon Reservoirs; Camp, W., Diaz, E., Wawak, B., Eds.; AAPG: Tulsa, OK, USA, 2013; Volume 102, pp. 7–14. [Google Scholar]
  54. Mukhametdinova, A.; Shilov, E.; Nachev, V.; Bogdanovich, N.; Cheremisin, A. A Complex of Laboratory Studies of Reservoir Properties of Domanik Formation Rocks. In Proceedings of the Carbonate Reservoirs, Moscow, Russia, 16–18 October 2018. [Google Scholar]
  55. Karamov, T.; Mukhametdinova, A.; Bogdanovich, N.; Plotnikov, V.; Khakimova, Z. Pore Structure Investigation of Upper Devonian Organic-Rich Shales within the Verkhnekamsk Depression. In Proceedings of the International Multidisciplinary Scientific GeoConference-SGEM, Albena, Bulgaria, 28 June–7 July 2019; pp. 1045–1052. [Google Scholar]
  56. Mukhametdinova, A.; Karamov, T.; Bogdanovich, N.; Cheremisin, A.; Plotnikov, V. Complex Characterization of Organic-Rich Carbonate Shales Saturation. Int. Multidiscip. Sci. GeoConference-SGEM 2019, 19, 719–726. [Google Scholar] [CrossRef]
  57. Chugunov, S.; Kazak, A.; Amro, M.; Freese, C.; Akhatov, I. Towards Creation of Ceramic-Based Low Permeability Reference Standards. Materials 2019, 12, 3886. [Google Scholar] [CrossRef] [Green Version]
  58. Yao, Y.; Liu, D. Comparison of Low-Field NMR and Mercury Intrusion Porosimetry in Characterizing Pore Size Distributions of Coals. Fuel 2012, 95, 152–158. [Google Scholar] [CrossRef]
  59. Lyu, C.; Ning, Z.; Wang, Q.; Chen, M. Application of NMR T2 to Pore Size Distribution and Movable Fluid Distribution in Tight Sandstones. Energy Fuels 2018, 32, 1395–1405. [Google Scholar] [CrossRef]
  60. Guidry, K.; Luffel, D.; Curtis, J. Development of Laboratory and Petrophysical Techniques for Evaluating Shale Reservoirs; Gas Technology Institite: Des Plaines, IL, USA, 1996; p. 304. [Google Scholar]
  61. Simpson, G.A.; Fishman, N.S. Unconventional Tight Oil Reservoirs: A Call For New Standardized Core Analysis Workflows And Research. In Proceedings of the International Symposium of the Society of Core Analysts, St. John’s, NL, Canada, 16–21 August 2015. [Google Scholar]
  62. Byrne, M.; Patey, I. Core Sample Preparation—An Insight to New Procedures. In Proceedings of the International Symposium of the Society of Core Analysts, Abu Dhabi, UAE, 5–9 October 2004. [Google Scholar]
  63. Burger, J.; McCarty, D.; Peacher, R.; Fischer, T. Sample Preparation for Unconventional Analysis: A Case Against Solvent Extraction. In Proceedings of the International Symposium of the Society of Core Analysts, Avignon, France, 8–11 September 2014. [Google Scholar]
  64. Lazar, O.R.; Bohacs, K.M.; Schieber, J.; Macquaker, J.H.; Demko, T.M. Mudstone Primer: Lithofacies Variations, Diagnostic Criteria, and Sedimentologic-Stratigraphic Implications at Lamina to Bedset Scales; SEPM (Society for Sedimentary Geology): Tulsa, OK, USA, 2015. [Google Scholar]
  65. Teles, A.P.; Lima, I.; Topes, R.T. Rock Porosity Quantification by Dual-Energy X-ray Computed Microtomography. Micron 2016, 83, 72–78. [Google Scholar] [CrossRef]
  66. Tsuchiyama, A.; Nakano, T.; Uesugi, K.; Uesugi, M.; Takeuchi, A.; Suzuki, Y.; Noguchi, R.; Matsumoto, T.; Matsuno, J.; Nagano, T.; et al. Analytical Dual-Energy Microtomography: A New Method for Obtaining Three-Dimensional Mineral Phase Images and Its Application to Hayabusa Samples. Geochim. Cosmochim. Acta 2013, 116, 5–16. [Google Scholar] [CrossRef]
  67. Ringrose, P.S.; Martinius, A.W.; Alvestad, J. Multiscale Geological Reservoir Modelling in Practice. Geol. Soc. London Spec. Publ. 2008, 309, 123–134. [Google Scholar] [CrossRef]
  68. Peters, K.E. Guidelines for Evaluating Petroleum Source Rock Using Programmed Pyrolysis. Am. Assoc. Pet. Geol. Bull. 1986, 70, 318–329. [Google Scholar]
Figure 1. The geographic location of the target formation (modified after [35]).
Energies 13 02233 g001
Figure 2. Tlyanchy-Tamakian Formation in the regional stratigraphic chart.
Energies 13 02233 g002
Figure 3. The porosity of received collection: (a) Ø100 × 200 mm whole cores; (b) Ø30 × 30 mm core plugs (courtesy of LUKOIL LLC, a priori data).
Energies 13 02233 g003
Figure 4. Permeability of received collection: (a) Ø100 × 200 mm whole cores; (b) Ø30 × 30 mm core plugs (courtesy of LUKOIL LLC, a priori data).
Energies 13 02233 g004
Figure 5. Schematic diagram of the whole-core breakdown into subsamples.
Energies 13 02233 g005
Figure 6. NMR porosity (a) and pseudo-steady-state permeability (PSS) (Darcypress) permeability (b) for the as-received versus extracted samples.
Energies 13 02233 g006
Figure 7. Petrographical analysis of thin-sections located at the closest depth to samples #545 and #551.
Energies 13 02233 g007
Figure 8. Visualization of 3D X-ray density models resulting from whole-core CT of the target rock samples.
Energies 13 02233 g008
Figure 9. Representative micro-CT slices of mini-cores taken from the whole core #551: (a) detritus (tentaculites) in calcite matrix with organic matter—organic-rich wackestone; (b) contact of organic-rich wackestone (dark) and crystalline limestone (light); (c) crystalline limestone.
Energies 13 02233 g009
Figure 10. SEM images for samples #545-1 and #545-2 (white arrows indicate voids).
Energies 13 02233 g010
Figure 11. SEM images for sample #551-1 (white arrows indicate voids).
Energies 13 02233 g011
Figure 12. Mercury injection capillary pressure (MICP) pore size distributions (PSDs) for the whole core #545 depend on the rock fraction size (a) before and (b) after extraction.
Energies 13 02233 g012
Figure 13. MICP PSDs for the whole core #551 depend on the rock fraction size before and after extraction.
Energies 13 02233 g013
Figure 14. Gas volumetric (VM) porosity (a) and gas permeability (b) cross plots for core plugs show a comparison between the obtained data and the legacy dataset.
Energies 13 02233 g014
Figure 15. Liquid saturation (LS) (a) and NMR porosity (b) cross plots showing comparison with a priori data for core plugs.
Energies 13 02233 g015
Figure 16. Comparison of NMR vs. pulse-pressure decay (PDP)-gas volumetric porosity (a) and LS results (b) on core plugs.
Energies 13 02233 g016
Figure 17. A cross plot of gas permeability by Darcypress versus a priori data.
Energies 13 02233 g017
Table 1. Methods applied for reservoir properties’ laboratory assessment.
Measured ParameterConventional MethodUnconventional Method
PorosityGravimetric or Liquid Saturation (LS)
Pulse-Decay (PDP)
Nuclear Magnetic Resonance (NMR)
Mercury Injection Capillary Pressure (MICP)
Gas adsorption
PermeabilitySteady-State
Pulse-Decay (PDP)
Pulse-Decay Permeametry (PDP)
Pseudo-Steady-State (PSS)
Oscillating Pulse Technique (OPT)
Gas Research Institute (GRI)
Void Space StructureThin-sectionsMercury Injection Capillary Pressure (MICP)
X-ray Computed Tomography (CT)
Scanning Electron Microscopy (SEM)
Table 2. Porosity and permeability of the core plugs (including a priori Darcymeter data) and core chips.
Sample IDDarcyMeter Porosity (%)PIK-PP Porosity (%)NMR Porosity (%)Liquid Porosity (%)DarcyMeter Permeability (mD)PIK-PP Permeability (mD)Darcypress Permeability (mD)
5450.740.621.201.089.02 × 1016.20 × 1029.07 × 104
5511.310.842.301.222.301.13 × 1024.00 × 104
6961.230.222.10 3.85 × 1033.00×103
6971.170.171.50 2.51 × 1032.00 × 103
7002.240.831.50 7.18
7011.77 1.70 5.35 × 10²
7030.92 1.800.838.48 × 103 2.36 × 10³
7051.300.351.10 3.61 × 1031.00 × 103
7072.63 1.10 1.97 × 10²
7081.72 1.50 2.24 × 10² 2.49 × 10²
7090.74 9.30 × 101 2.74 × 10²
7100.24 1.10 1.05
7111.35 1.401.045.19 × 102 4.32 × 10³
7121.040.570.91 2.19 × 1021.20 × 102
7141.920.731.70 8.48 × 1012.73 × 101
7171.38 2.30 7.56 × 10³
7192.120.610.88 2.551.43
7210.75 2.401.193.17 × 103 4.82 × 10³
7280.770.221.60 3.58 × 1011.68 × 1013.19 × 103
7400.30 1.600.812.01 × 103 1.65 × 10²
7471.730.331.20 2.40 × 1029.00 × 103
7481.60 2.901.292.38 × 102 2.52 × 10³
7521.31 2.87 3.20 × 10²
7531.750.402.00 3.49 × 1021.60 × 102
7551.030.331.30 8.86 × 1031.00 × 103
7621.49 2.50 9.15 × 10²
7632.61 3.21 × 10³
7661.10 2.20 8.46 × 10²
7681.43 3.85 × 10³ 1.56 × 10²
Min.0.240.170.880.812.01 × 1031.00 × 1034.00 × 104
Avg.1.370.491.671.064.69 × 1017.06 × 1011.74 × 102
Max.2.630.842.901.292.877.189.15 × 102
Table 3. Porosity and permeability of the whole core samples.
Fluid, Technique, Sample Form-Factor & PropertyWhole Core
#545#551
Gas Whole-Core Porosity (a priori) (%)0.741.31
Kerosene NMR Core-Plug Porosity (%)1.202.30
Hg MICP Crushed-Rock Porosity (%)1.601.80
Gas Volumetric Core-Plug Porosity (%)0.620.84
Kerosene Liquid-Staturation Core-Plug Porosity (%)1.081.22
Gas PDP Whole-Core Permeability (a priori) (mD)9.02 × 1012.30
Gas PDP Core-Plug Permeability (mD)6.20 × 1021.13 × 102
Gas PSS Rock-Chip Permeability (mD)9.07 × 1044.00 × 104

