Abstract
This paper presents the laboratory test stand that is used for experimental validation of underground power cable system models. Determination of temperature distribution in the vicinity of the cable is the main goal of the study. The paper considers a system of three power cables, situated in the in-line arrangement, and buried in sand. Three electrical heaters of special construction are used in order to simulate the heat flux that is generated in the power cables during their operation. The test stand is designed to be placed in a thermoclimatic chamber, which allows testing the system in various thermal conditions when the ambient temperature changes by 20 °C to 30 °C. Numerical computations of the steady-state temperature fields are performed using the finite element method.
1. Introduction
Recently, with growing energy production from renewable energy sources as well as continuous modernization of the electrical transmission grid, the design and operation improvement of underground power cable systems (UPCS) has attracted widespread scientific attention. In most cases, the underground electricity transmission lines operate at the maximum possible transmitted electric current. The electricity transmission losses, in the form of generated heat, depend on the cable core electric resistance and transmitted electrical current [1,2]. Accurate analysis of heat dissipation from the underground power cables to the surrounding soil plays a crucial role in designing the electricity transmission lines for modern power systems [3,4,5].
The underground transmission line performance relies mainly on the thermal properties of the surroundings and the cable itself. Cable insulation dissipates heat generated by the current flow to the surrounding soil. The UPCS arrangement in the ground is associated with a considerable and unpredictable variability of environmental parameters, determined by the thermal conductivity of the surrounding soil. Thus, when designing high voltage and extra high voltage UPCSs, laying the cable lines directly in the ground has been practically abandoned. To enhance heat dissipation from the cable core, by ensuring moisture retention in the vicinity of the cable line, a specially designed thermal backfill is used. The thermal backfill needs to provide stable thermal conditions for the cable line operation regardless of the type of surrounding soil.
The experimental and numerical research carried out so far indicates clearly that the thermal properties of both soil and backfill materials are strongly influenced by water content [6,7,8]. With the increasing water content in the porous media structure, a significant growth in both the soil and backfill thermal conductivity value may be observed. When completely dry, the thermal conductivity of soil or backfill can go down by as much as five times [9].
In the engineering practice, values of cable current-carrying capacity are provided by cable manufacturers for strict assumed environmental conditions. By assuming the power cable operational parameters, it is possible to compare similar cables performance and to select a specific cable model for a given investment case-study. It is a common engineering practice to determine the current ratings based on IEC 60287 using the CYMCAP software [10,11]. The current ratings are established for the following UPCS working conditions:
- ▪
- ambient ground temperature equal to 15 °C;
- ▪
- cable line burial depth equal to 2.0 m;
- ▪
- thermal conductivity of the surrounding soil equal to 1.0 W/(mK);
- ▪
- ambient air temperature equal to 30 °C.
During real UPCS operation, it is not easy to maintain standard operating conditions. The transmission line working conditions are continually changing, also affecting the transmission line performance. The main goal of the study is the experimental validation of the numerical procedures developed and described in detail in [12,13,14]. Numerical procedures are used along with an advanced optimization algorithm for supporting the UPCS design, presented in [15,16].
Due to the variability and complexity of the real UPCS, experimental tests are carried out mostly on the laboratory scale. A few tests stands are being built these days in order to investigate coupled heat and mass transfer phenomenon within the functioning transmission line.
One of the most complex UPCS test stands was built by the Sapienza University of Rome team and presented in a paper by Vollaro et al. [17] and [18]. The test stand was designed to analyze the thermal field in the soil around the buried cables and to study the thermal and hydraulic properties of different backfilling materials. Three electrical heaters were placed in the soil to simulate underground transmission line operation. The tests were carried out at room temperature. The Sapienza University team has performed several studies regarding soil thermal resistance determination during underground electricity transmission lines design [8,19,20].
In the study of Ahmad et al. [21] a single electrical heater was used to examine dry soil and the designed backfill performance. Several cycles of 12 h heating and cooling were performed in order to investigate the nature and characteristics of the proposed backfill. The test stand presented in [21] was a modification of the experimental setup proposed by Moya et al. [22].
This paper presents an experimental validation of the numerical model of heat transfer in an underground power cable system. Determining the temperature distribution in the vicinity of the cable is the main goal of the study. The paper considers a system of three power cables situated in an in-line arrangement buried in the sand. Three electrical heaters of special construction are used in order to simulate the heat flux that is generated in the power cables during their operation. The test stand is placed in a thermoclimatic chamber, which allows testing the system under various thermal conditions, where the ambient temperature changes by 20 °C to 30 °C. The numerical computations of the steady-state temperature fields are performed using the finite element method.
2. Experimental Setup
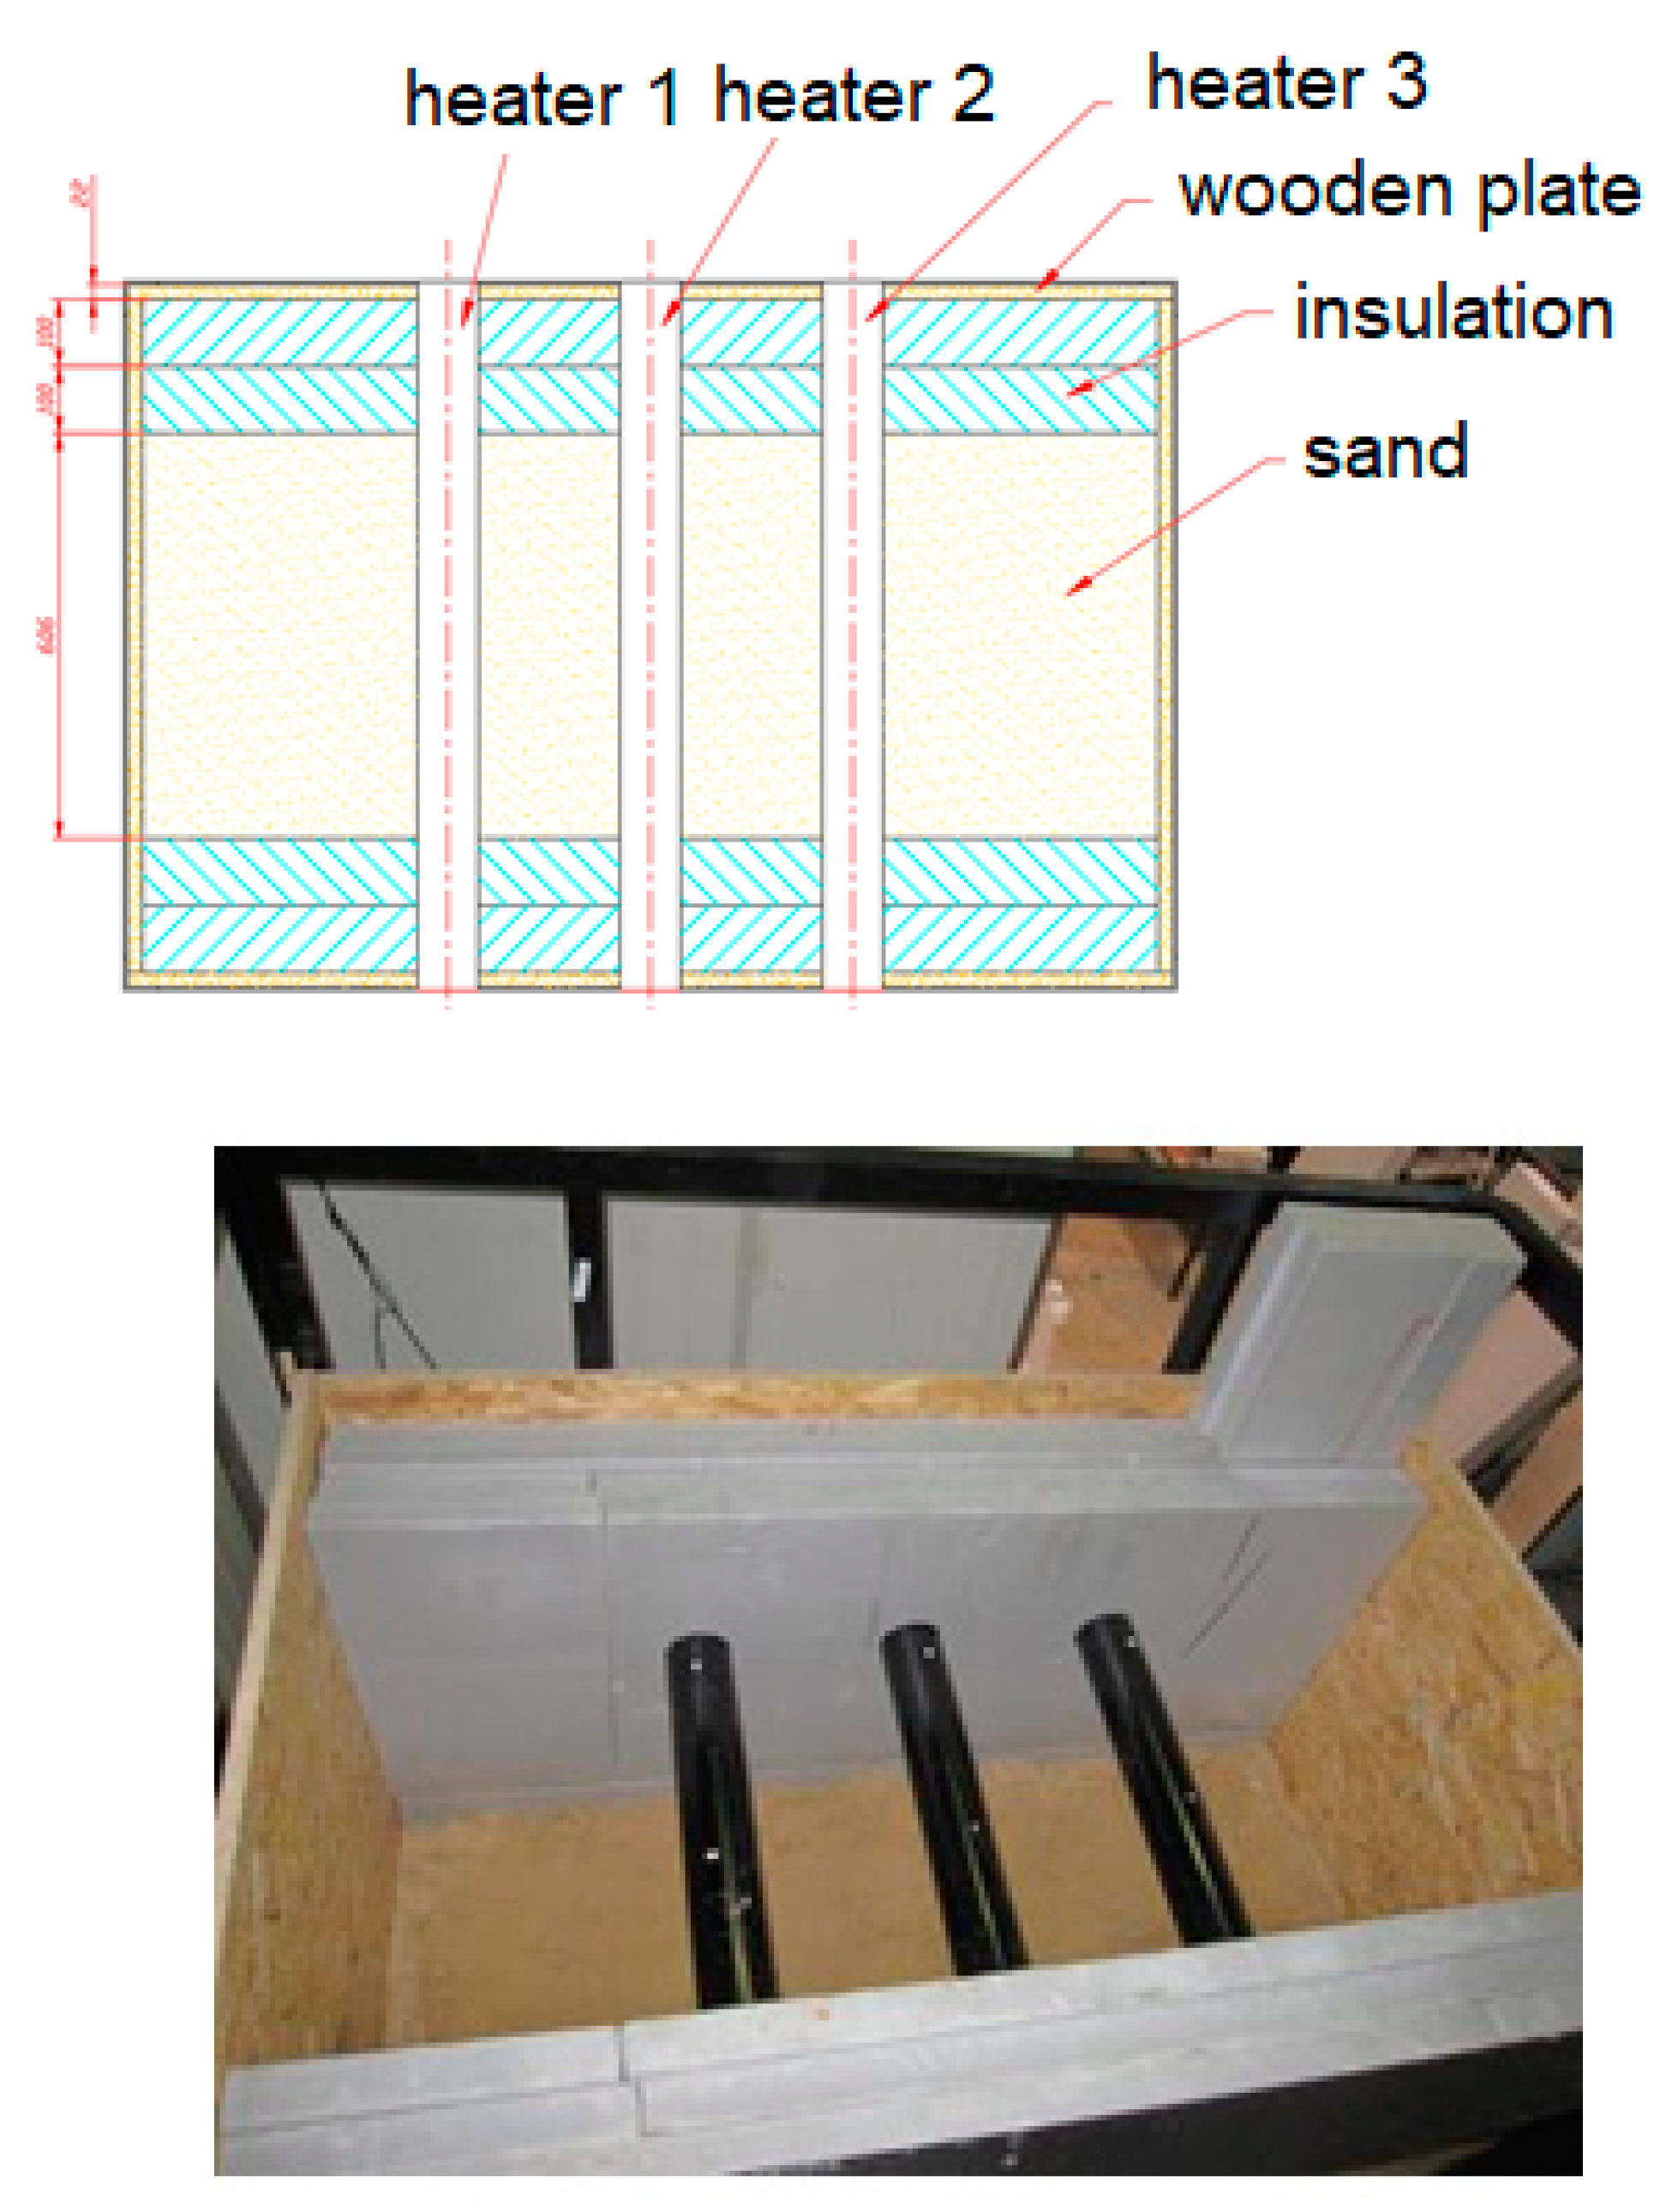
The test stand consists of a box filled with sand, that simulates the ground, and three heaters that simulate the behavior of power cables. The box is made of metal profiles and covered with chipboard on the inside and on the longer sides with two layers of insulating material. The dimensions of the box are 1.5 m high, 1.56 m long and 1.06 m wide. The volume of the box is 2.46 m3. The box is filled with 1.38 m3 of sand. The dimensions of the box are shown in Figure 1, and the arrangement of insulating elements and heaters in Figure 2. When the box was filled with sand, heaters, as well as temperature and humidity sensors were installed.
Figure 1.
Scheme of the experimental setup.

Figure 2.
Placement of power cables in the sand.
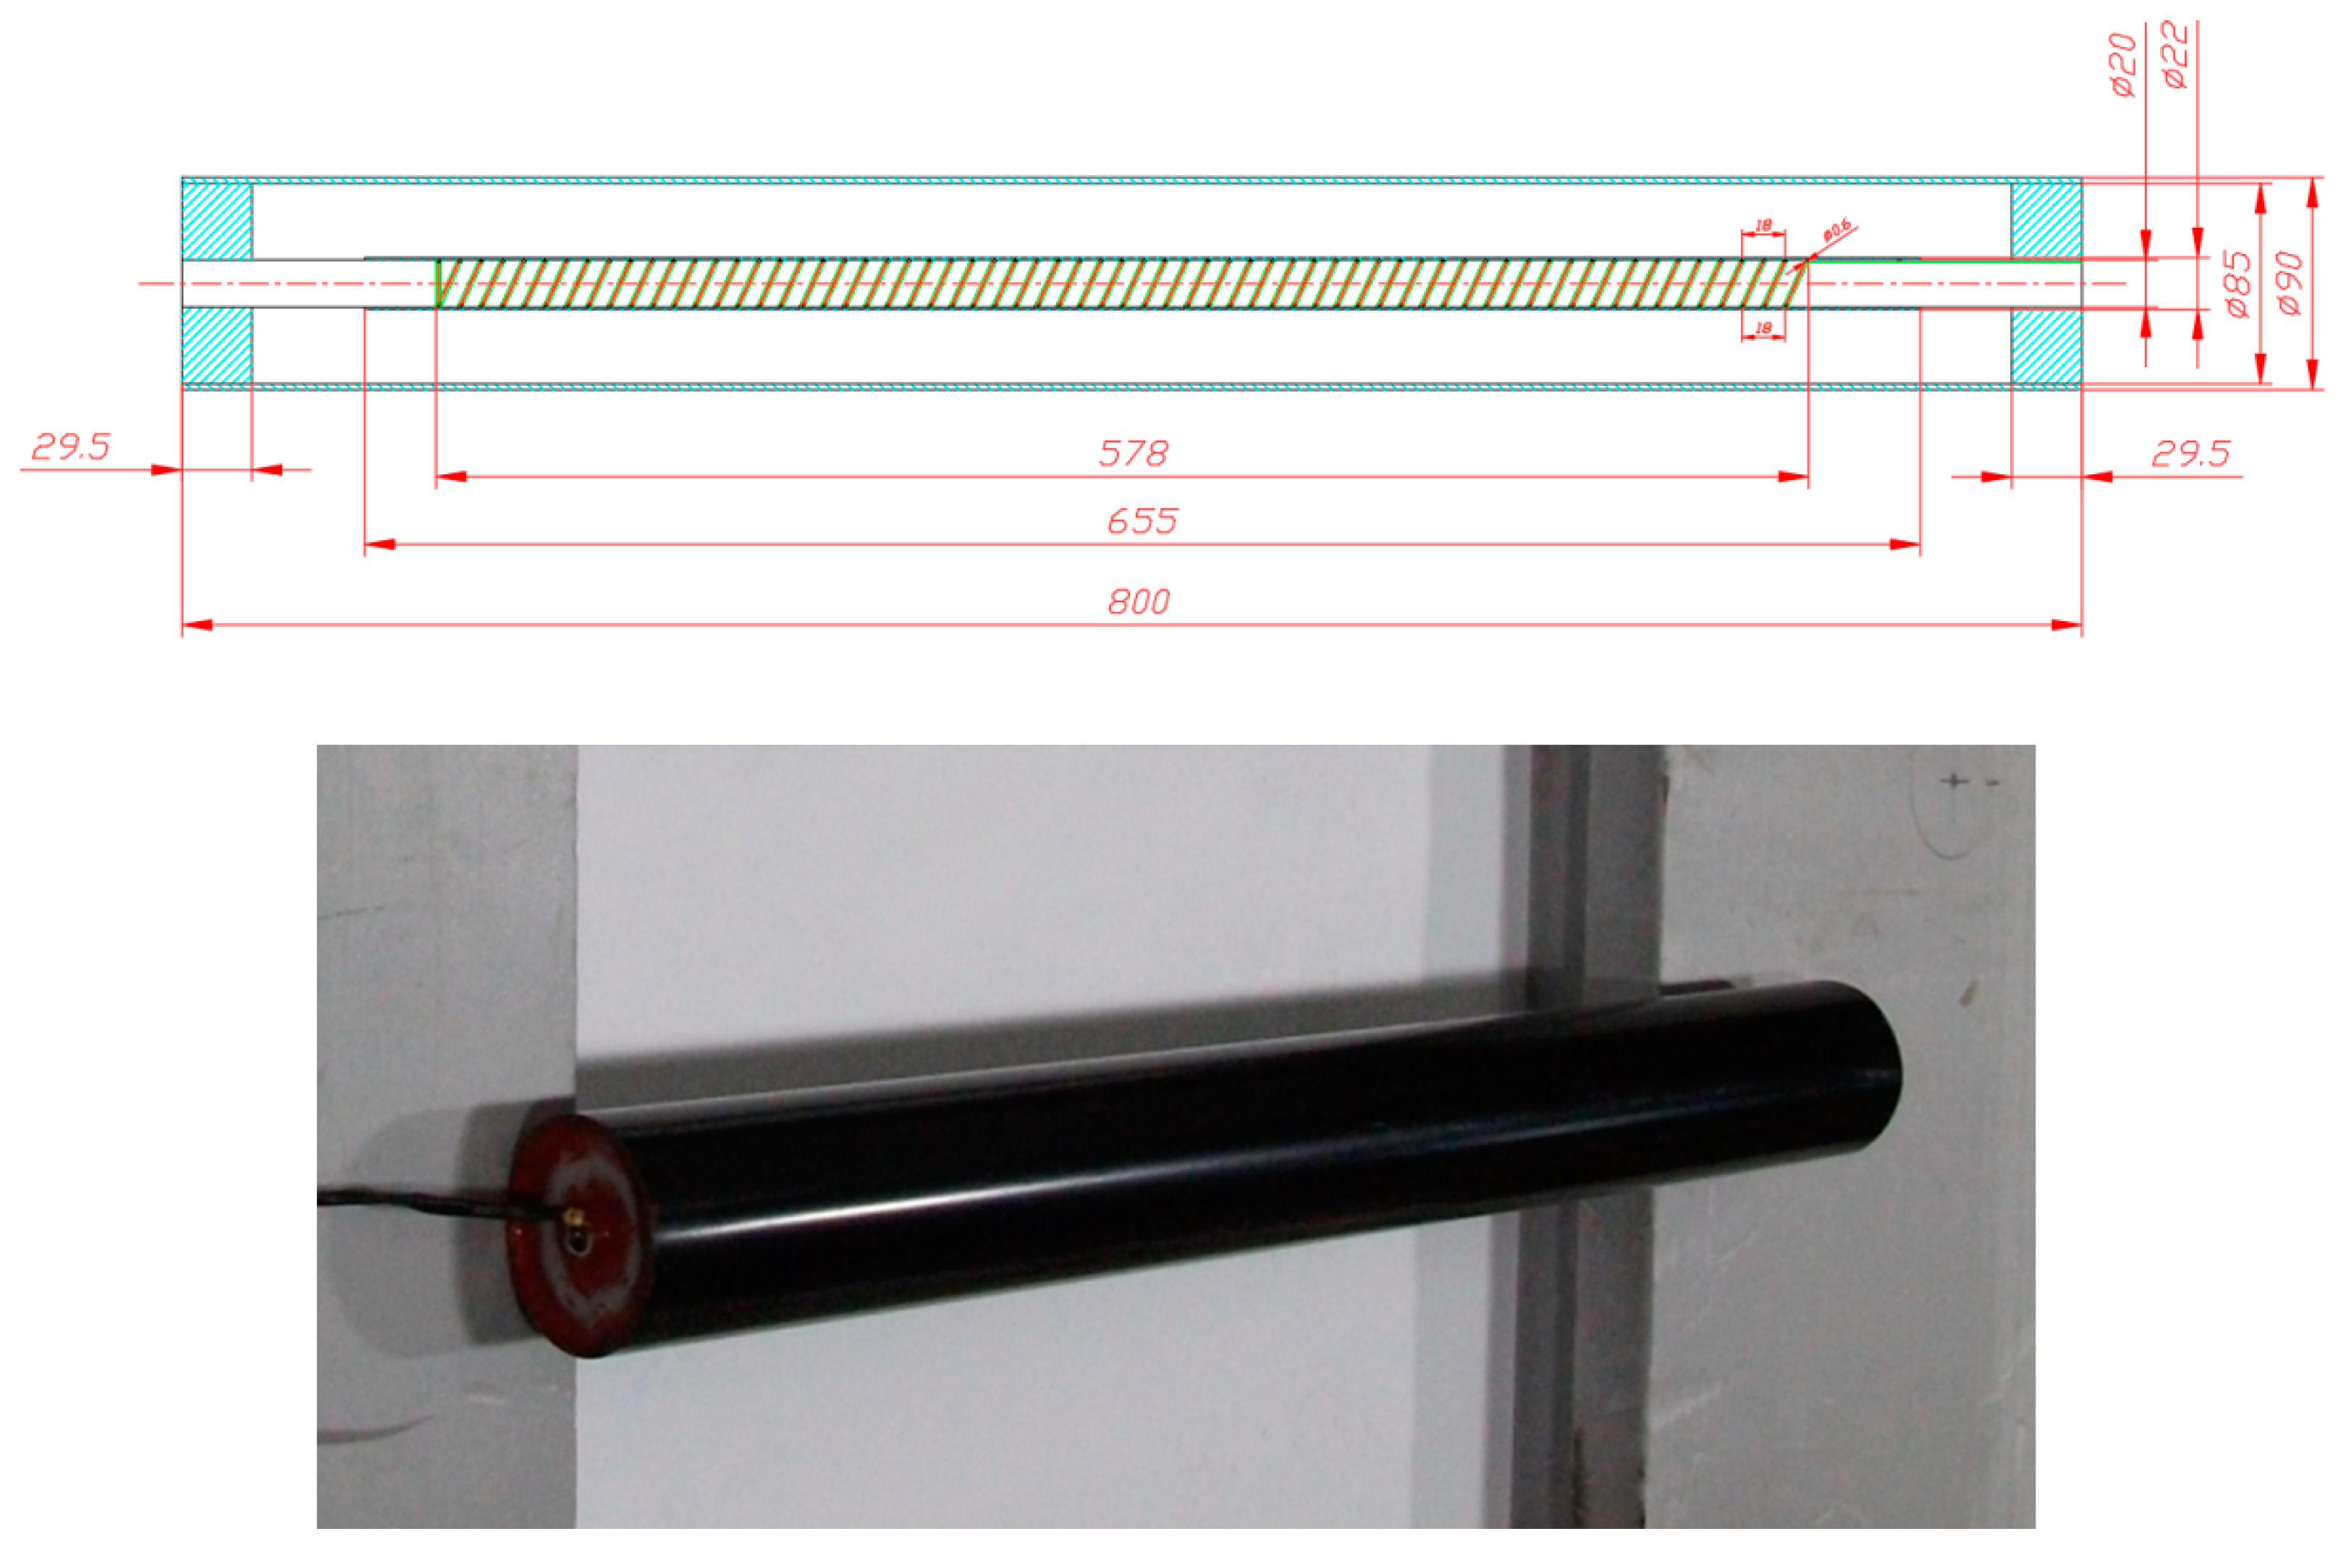
During the power outage, electric cables increase their temperature considerably. In order to simulate this process, instead of high voltage cables, three specially manufactured heaters were used. The dimensions of the heater as well as its external design and elements are shown in Figure 3.

Figure 3.
A view of the electric heater.
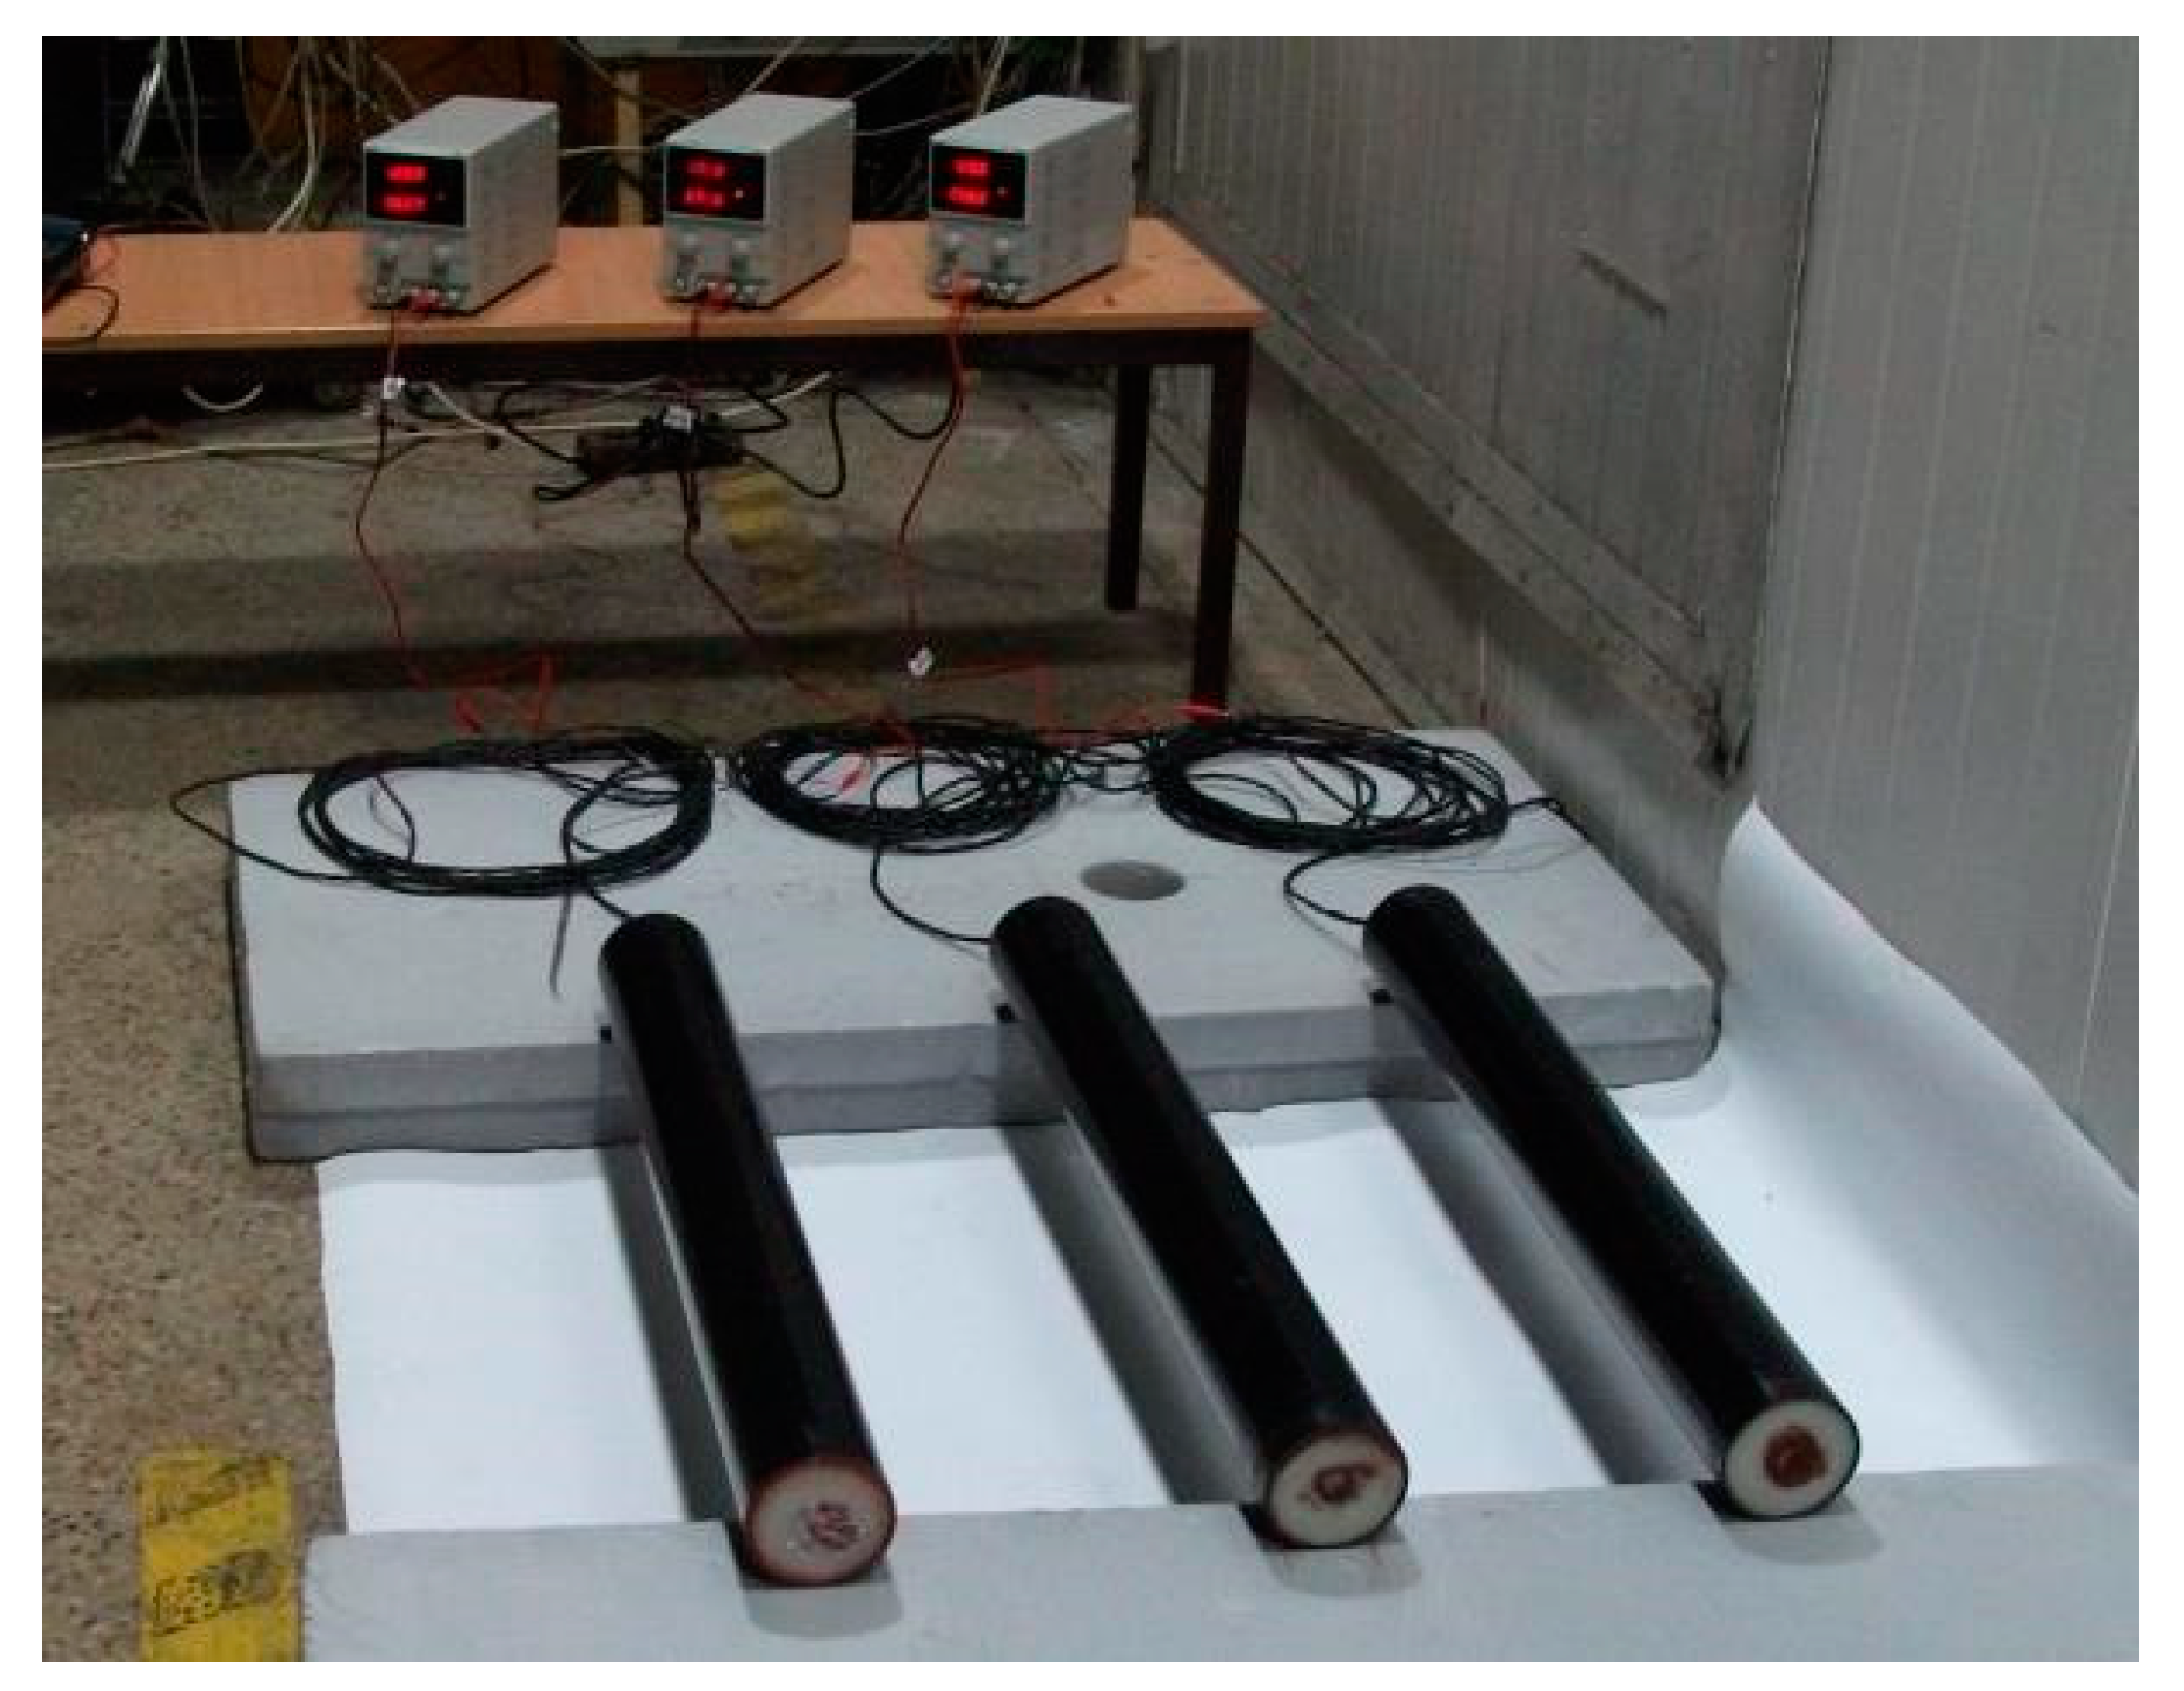
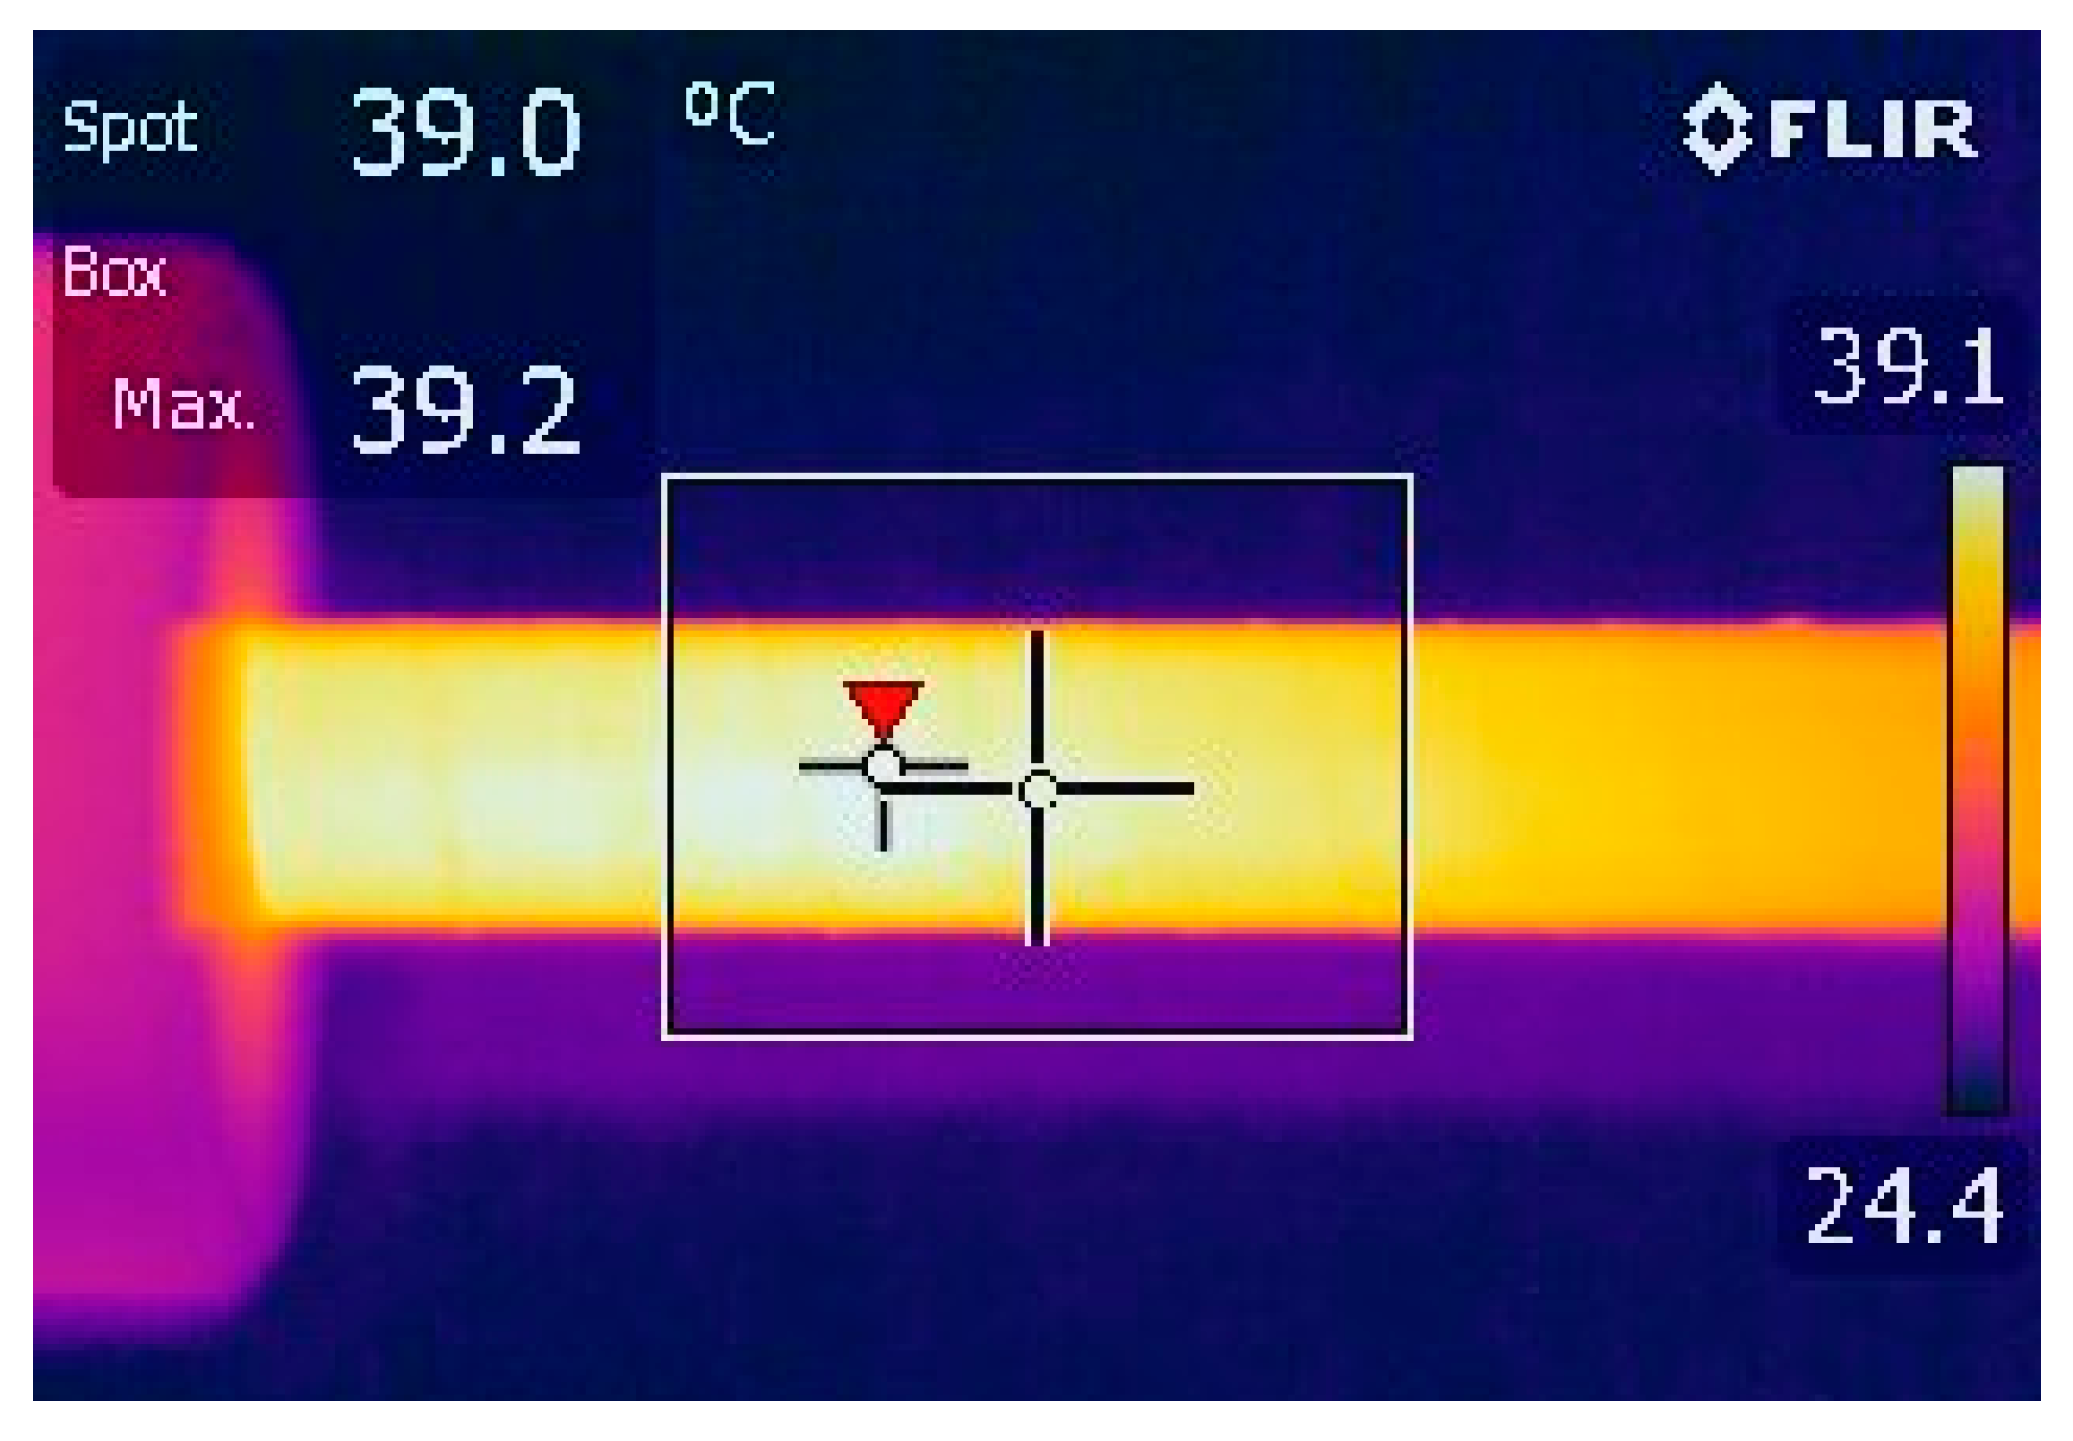
A series of tests were conducted prior to the study to verify the effectiveness of the heaters. They were connected to the electrical power supply and a thermal imaging camera checked the temperature to which they were heated. After passing the tests, the heaters were assembled in a box. Figure 4 shows the heaters during the tests and Figure 5 shows an example of a picture taken with a thermal imaging camera during operation.

Figure 4.
Electric heater during the tests.

Figure 5.
A sample temperature distribution in the heater.
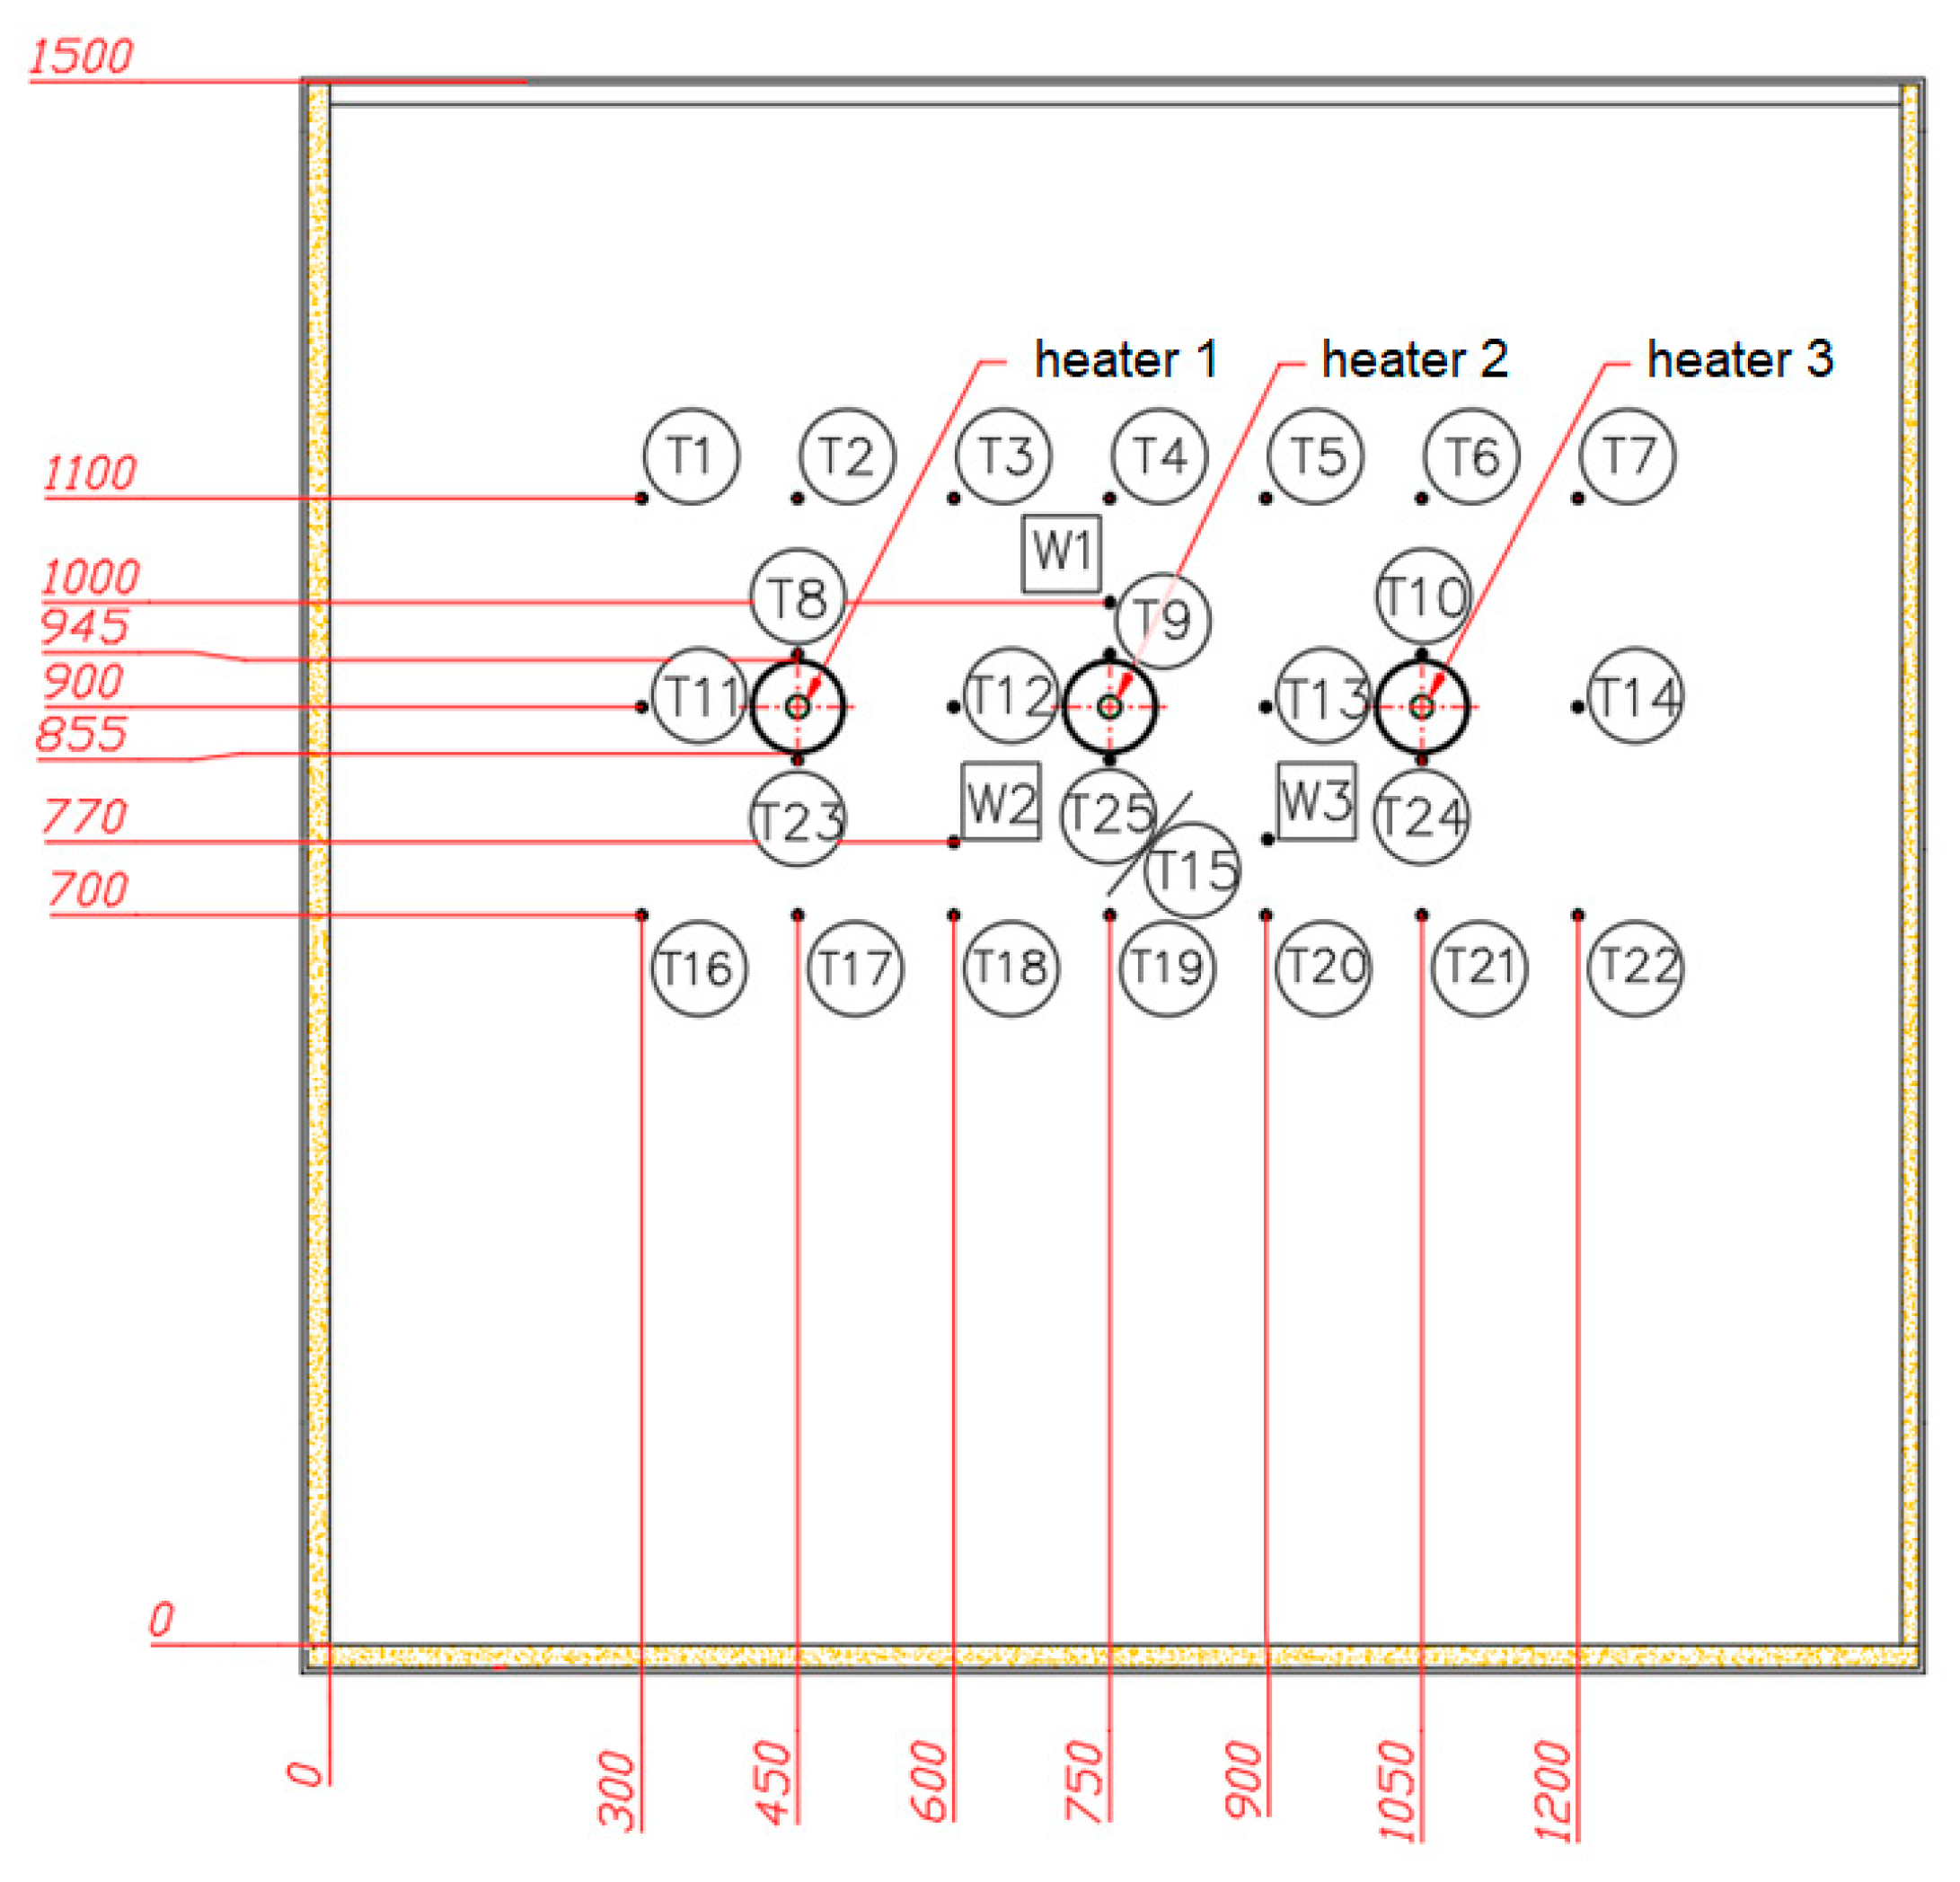
The thermocouples location is shown in Figure 6.

Figure 6.
The location of thermocouples at the experimental stand.
From Figure 6 it is possible to observe that the thermocouples T1–T7 are located 200 mm above the axis of the central heater, while thermocouples T16–T22 are located 200 mm below the axis of the central heater. Thermocouples T11, T12, T13, and T14 are located at the same level as the central cable conductor axis. Thermocouples T8–T10 are situated at the top of each heater insulation, while T23–T25 at the bottom. The temperature measurement error is assumed to be equal to ± 0.5 °C. TOPE-361-3-50-0,15-A-L3p-TT temperature sensors of Pt100 (ACSE, Kraków, Poland) with three wire compensation lines were used. The thermocouple positioning error is assumed to be equal ±1 mm. The power provided to heaters is regulated by autotransformer at each of three heaters applied by changing the voltage, with measurement error assumed to be equal ± 0.5 W.
The experimental test is performed in the Laboratory of Techno-Climatic Research and Heavy Duty Machines of the Cracow University of Technology for a range of ambient air temperatures between 40 °C and 3.9 °C and air heat transfer coefficient determined as 10 W/(m2·K). The ambient temperatures 40 °C and 3.9 °C are selected to simulate cable line at high (summertime) and low (wintertime) temperature condition. The thermoclimatic chamber used for the tests is described in Kucybała et al. [23]. The experimental procedure consists of:
- (a)
- Temperature measurements at the locations of (200 mm above the heaters): T1–T7 and around heater 1 (T8, T11, T23), heater 2 (T9, T12, T15), heater 3 (T10, T13, T24).
- (b)
- Measurements are performed for two different air temperatures Tair = 3.9 oC and Tair = 40 oC to simulate the temperature distribution in power cable system for various external temperatures (a dedicated climatic chamber was used for this purposes)
- (c)
- The heater power output was maintained constant and equal to P = 20 W at each heater (regulated by auto-transformers)
3. Mathematical Modeling
A steady-state, two-dimensional heat conduction equation is solved numerically to determine the temperature distribution within the system. The following assumptions are made when performing numerical modeling:
- (a)
- Sand is considered as a homogenous material with thermal conductivity equal to 0.3 W/(m K).
- (b)
- Thermal insulation made of granular glass is considered as homogenous material with thermal conductivity of 0.17 W/(m K).
- (c)
- Cable core made of aluminum is considered as a homogenous material with thermal conductivity equal to 200 W/(m K).
- (d)
- At the ground level surface, the convective boundary condition is applied. The heat transfer coefficient of external air is equal to α = 10 W/(m2K), while the ambient air temperature is taken from the measurements.
The two-dimensional heat conduction equation is used to calculate the temperature distribution within the underground power cable system:
where:
x, y—are Cartesian coordinates of the specified point that belongs to heat transfer domain,
qv—is a heat source density, W/m2.
k—is a thermal conductivity specified for the different computational domains, i.e.,:
- for the cable conductor kc = 200 W/(m K),
- for the cable insulation kins = 0.17W/(m K),
- for the sand ks = 0.3 W/(m K),
The following boundary conditions are applied:
The coordinate system is located collinearly with the axis of the central cable. In Equation (2) W denotes the domain width, i.e., 1.53 m. Symbol h denotes the heater burial depth equal to 0.6 m. The domain height H is equal to 1.56 m (Figure 1).
The heat losses in cable conductor qv,c, are determined from Equation (3):
where P is the heater power recorded during the measurements, and Ac = 3.8·10−4 m2 is the cross-sectional area of the cable conductor.
Equation (1) is discretized using code developed in-house in MATLAB. The finite element procedures were applied to form the local element matrices, and then assemble them into the global forms. After the FEM discretization of Equation (1) the linear system of equations is solved, and the temperature distribution in a steady state is obtained. Using the finite element method code it is possible to calculate the two-dimmensional temperature distribution within the entire heat transfer domain including heaters (cables) and soil. The model is compared with experimental measurements to validate its accurancy.
The input parameters are: power delivered at heaters (P = 20 W) and ambient air temperature (Tair = 40 °C, and 3.9 °C), as the output parameters the temperature distribution within the underground power cable system is determined using the proposed FEM model.
4. Results and Discussion
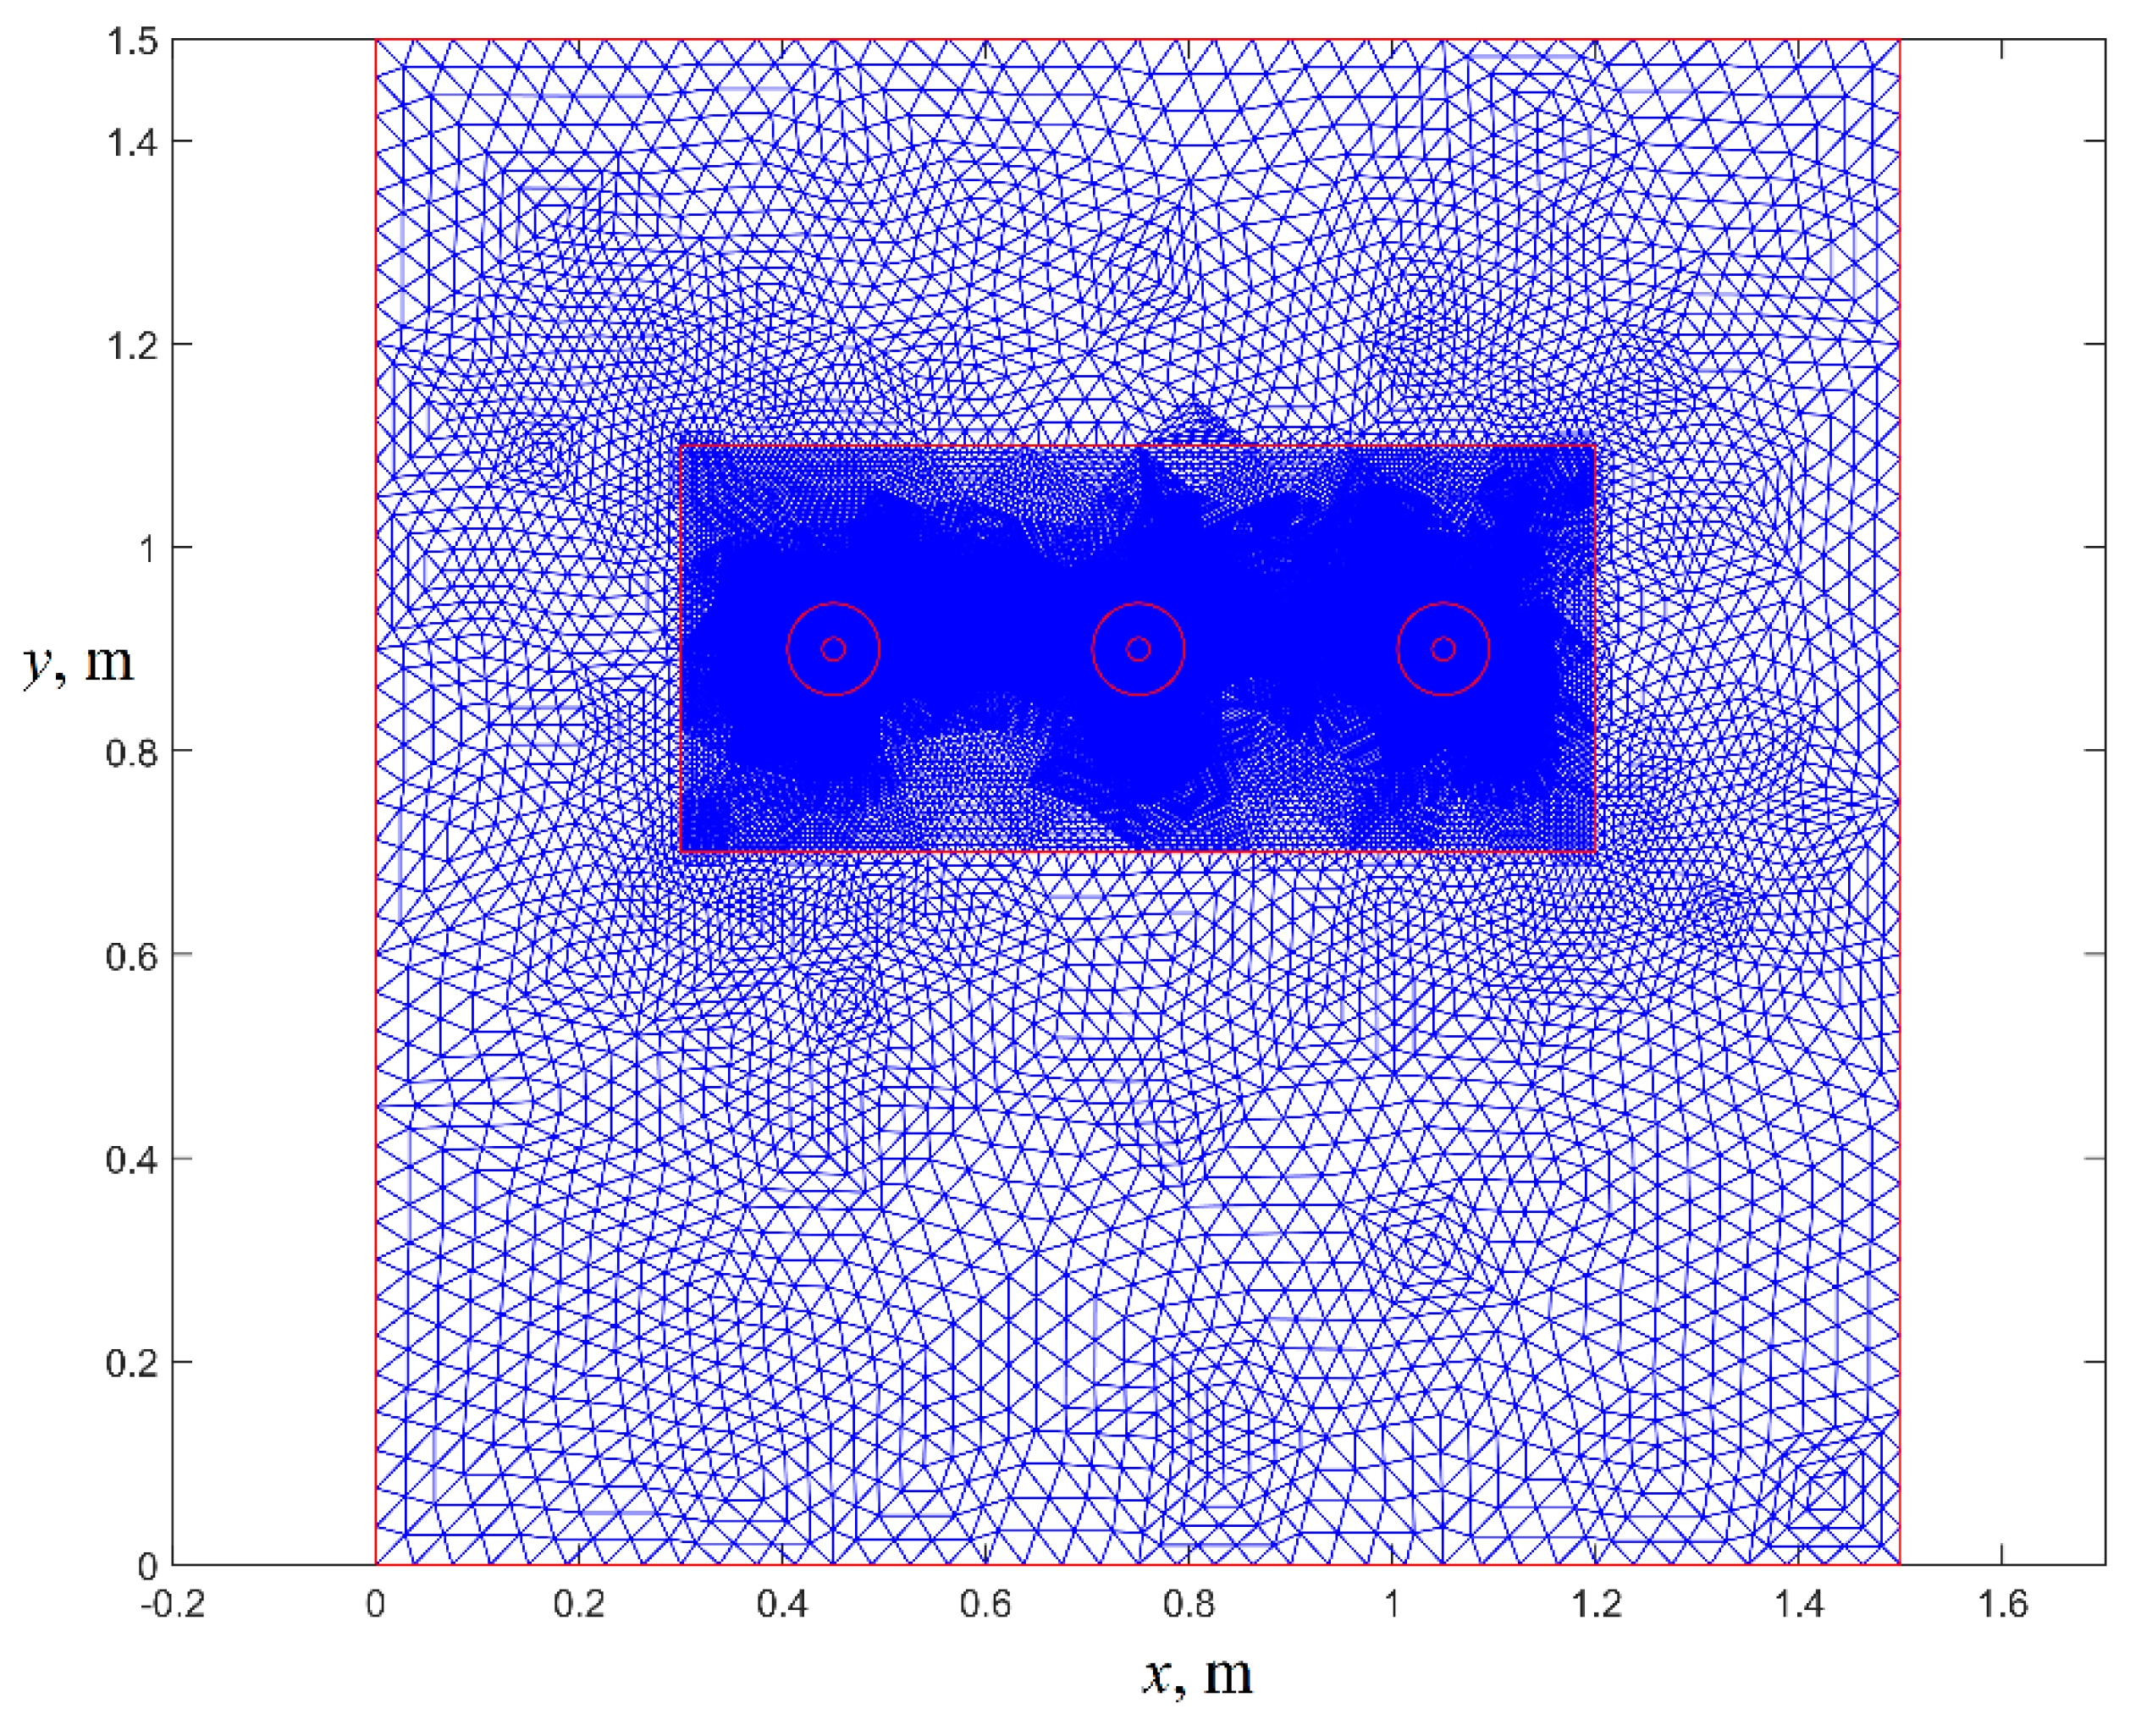
Figure 7 presents the numerical grid used in the computation. It is possible to observe, that the mesh is highly refined in the region, where the thermocouples are installed.
Figure 7.
A numerical grid used in the computations.
The simulation is performed for P = 20 W and Tair = 40 °C and P = 20 W and Tair = 3.9 °C. The results of the simulation are compared with the experimental measurements and provided in Table 1, Table 2 and Table 3.

Table 1.
Temperature values obtained from tests and simulations at a level of 200 mm above the heaters.
Table 2.
Temperature values obtained from tests and simulations (temperature values around heaters 1 and 2).
Table 3.
Temperature values obtained from tests and simulations (temperature values around heater 3).
From Table 1, Table 2 and Table 3 it is possible to observe that the simulation results are in very good agreement with the experimental data. The maximum error is not higher than 5%, which shows that the model predicts very well the temperature distribution around the underground power cable system. The error is calculated as:
where Tmodel is a temperature determined from the FEM model at a specified location, and Texper is a measured temperature at a specified location. The final temperature distribution obtained from the FEM simulation is shown in Figure 8.
Figure 8.
Temperature distribution around the heaters for Tair = 40 oC and P = 20 W (a), and Tair = 3.7 oC and P = 20 W.
From the analysis of Figure 8 is possible to observe that the central heater temperature is the highest, while the temperature of the side heaters is slightly lower. The same is confirmed by the experimental tests.
5. Conclusions
In this paper, an experimental setup is created to determine the temperature distribution around specially designed heaters that simulate an underground power cable system. Three heaters of uniform power P = 20 W arranged in a flat formation are considered. The experiments were performed in the Climatic Chamber Laboratory of the Cracow University of Technology for the ambient air temperature range between 40°C amd 3.9 °C and an air heat transfer coefficient equal to 10 W/(m2K). The experimental results were compared with those of a program developed by the authors, which is used to calculate the temperature distribution. The agreement between the measurements and simulation results is satisfactory. The difference does not exceed 5%.
Author Contributions
P.O.: writing—original draft preparation, simulation; J.P. and P.W.: development of experimental stand and experimental investigation, description of measurement procedure; P.C.: thermal conductivity measurements; A.V.: supervision. All authors have read and agreed to the published version of the manuscript.
Funding
TRL+ Competition implemented under the “Innovation Incubator+” programme of Cracow University of Technology, agreement no. PK1686 entitled “System for identifying the thermal conditions of high-voltage cable lines under varying climatic conditions”.
Conflicts of Interest
The authors declare no conflict of interest.
References
- Lobão, J.A.; Devezas, T.; Catalão, J.P.S. Influence of cable losses on the economic analysis of efficient and sustainable electrical equipment. Energy 2014, 65, 145–151. [Google Scholar] [CrossRef]
- Shabani, H.; Vahidi, B. A probabilistic approach for optimal power cable ampacity computation by considering uncertainty of parameters and economic constraints. Int. J. Electr. Power Energy Syst. 2019, 106, 432–443. [Google Scholar] [CrossRef]
- Quan, L.; Fu, C.; Si, W.; Yang, J.; Wang, Q. Numerical study of heat transfer in underground power cable system. Energy Procedia 2019, 158, 5317–5322. [Google Scholar] [CrossRef]
- Bustamante, S.; Mínguez, R.; Arroyo, A.; Manana, M.; Laso, A.; Castro, P.; Martinez, R. Thermal behaviour of medium-voltage underground cables under high-load operating conditions. Appl. Therm. Eng. 2019, 156, 444–452. [Google Scholar] [CrossRef]
- Cichy, A.; Sakowicz, B.; Kaminski, M. Economic optimization of an underground power cable installation. IEEE Trans. Power Deliv. 2018, 33, 1124–1133. [Google Scholar] [CrossRef]
- Hruška, M.; Clauser, C.; De Doncker, R.W. Influence of dry ambient conditions on performance of underground medium-voltage DC cables. Appl. Therm. Eng. 2019, 149, 1419–1426. [Google Scholar] [CrossRef]
- Kroener, E.; Vallati, A.; Bittelli, M. Numerical simulation of coupled heat, liquid water and water vapor in soils for heat dissipation of underground electrical power cables. Appl. Therm. Eng. 2014, 70, 510–523. [Google Scholar] [CrossRef]
- Galli, G.; Vallati, A. Equilibrium heat and moisture transfer in soils with heat sources. Int. J. Heat Technol. 2011, 29, 33–38. [Google Scholar]
- Radhakrishna, H.S. Fluidized cable thermal backfill. In Underground Cable Thermal Backfill; Pergamon Press: Oxford, UK, 1982; pp. 34–53. [Google Scholar]
- IEC 60287-1-1:2006/AMD1:2014 Standard. Electric Cables–Calculation of Current Rating–Part 1: Current Rating Equations (100% Load Factor) and Calculation of Losses–Section 1: General; Publication IEC-60287-1-1: Geneva, Switzerland, 2014. [Google Scholar]
- CYME, CYMCAP—Power Cable Ampacity Rating. Available online: http://www.cyme.com/software/cymcap/ (accessed on 10 March 2020).
- Ocłoń, P.; Cisek, P.; Pilarczyk, M.; Taler, D. Numerical simulation of heat dissipation processes in underground power cable system situated in thermal backfill and buried in a multilayered soil. Energy Convers. Manag. 2015, 95, 352–370. [Google Scholar] [CrossRef]
- Ocłoń, P.; Taler, D.; Cisek, P.; Pilarczyk, M. Fem-based thermal analysis of underground power cables located in backfills made of different materials. Strength Mater. 2015, 47, 770–780. [Google Scholar]
- Ocłoń, P.; Bittelli, M.; Cisek, P.; Kroener, E.; Pilarczyk, M.; Taler, D.; Venkata Rao, R.; Vallati, A. The performance analysis of a new thermal backfill material for underground power cable system. Appl. Therm. Eng. 2016, 108, 233–250. [Google Scholar] [CrossRef]
- Ocłoń, P.; Cisek, P.; Taler, D.; Pilarczyk, M.; Szwarc, T. Optimizing of the underground power cable bedding using momentum-type particle swarm optimization method. Energy 2015, 92, 230–239. [Google Scholar] [CrossRef]
- Ocłoń, P.; Cisek, P.; Rerak, M.; Taler, D.; Venkata Rao, R.; Vallati, A.; Pilarczyk, M. Thermal performance optimization of the underground power cable system by using a modified Jaya algorithm. Int. J. Therm. Sci. 2018, 123, 162–180. [Google Scholar] [CrossRef]
- De Lieto Vollaro, R.; Fontana, L.; Vallati, A. Thermal analysis of underground electrical power cables buried in non-homogeneous soils. Appl. Therm. Eng. 2011, 31, 772–778. [Google Scholar] [CrossRef]
- De Lieto Vollaro, R.; Fontana, L.; Vallati, A. Experimental study of thermal field deriving from an underground electrical power cable buried in non-homogenous soil. Appl. Therm. Eng. 2014, 62, 390–397. [Google Scholar] [CrossRef]
- De Lieto Vollaro, R.; Vallati, A. Study of a model for the evaluation of the heat losses from electric cables buried according to the norm standard. Adv. Mater. Res. 2013, 650, 437–442. [Google Scholar] [CrossRef]
- De Lieto Vollaro, R.; Fontana, L.; Quintino, A.; Vallati, A. Improving evaluation of the heat losses from arrays of pipes or electric cables buried in homogeneous soil. Appl. Therm. Eng. 2011, 31, 3768–3773. [Google Scholar] [CrossRef]
- Ahmad, S.; Rizvi, Z.; Khan, M.A.; Ahmad, J.; Wuttke, F. Experimental study of thermal performance of the backfill material around underground power cable under steady and cyclic thermal loading. Mater. Today: Proc. 2019, 17, 85–95. [Google Scholar] [CrossRef]
- Moya, R.E.S.; Prata, A.T.; Cunha Neto, J.A.B. Experimental analysis of unsteady heat and moisture transfer around a heated cylinder buried into a porous medium. Int. J. Heat Mass Transf. 1999, 42, 2187–2198. [Google Scholar] [CrossRef]
- Kucybała, P.; Gawlik, A.; Pobędza, J.; Walczak, P. The usage of a thermoclimatic chamber for technoclimatic tests of special vehicles and mobile machines. J. Kones Powertrain Transp. 2018, 25, 199–206. [Google Scholar]

© 2020 by the authors. Licensee MDPI, Basel, Switzerland. This article is an open access article distributed under the terms and conditions of the Creative Commons Attribution (CC BY) license (http://creativecommons.org/licenses/by/4.0/).