Abstract
In this paper, distribution-level peer-to-peer energy exchange is proposed that allows increased matching between load and generation nodes. Contributions of the proposed improved matching system between the local load and generation nodes aim at making efficient use of unused power generation, reducing the cost of electrical energy for consumers, and assisting utility companies by reducing transmission line congestion. The proposed system for matching the load and generation nodes consists of a financial layer and technical layer. In the financial layer, nodes with an excess of energy provide a price to sell energy, while the nodes needing energy bid on a price to purchase energy. A market-clearing mechanism using pool clearing is applied to determine a final price for peer-to-peer exchange. The technical layer determines the connection of energy transfer between the generation and load nodes while considering the distance, power flow constraints, and specified time windows. The proposed approach is verified in a five-node system and the results are discussed.
1. Introduction
In this paper, a method for peer-to-peer energy exchange in a distribution grid that allows matching between the load and generation at a distribution level to be increased is proposed. Achieving improved matching between the local load and generation can help households to better exploit local generation and can contribute to relieving the congestion on transmission lines and reducing the overall cost of electricity. The proposed method for matching the load and generation consists of a financial layer and technical layer. In the financial layer, the nodes with an excess of energy provide a price to sell energy, while the nodes needing energy bid on a price to purchase energy. A market-clearing mechanism using pool clearing is applied to determine a final price for peer-to-peer exchange. The generator nodes then find the nearest load nodes and transfer their excess energy within a specified time window whilst also considering power flow constraints. The proposed approach is verified in a five-node system and the obtained results are discussed.
2. Literature Review
2.1. Load Balancing
Extensive research has been devoted to methods suggesting microgrids to improve the framework of power systems. In [1] and [2], it is shown that microgrids offer an effective way of managing uncertainty of the generation and demand balance. Matching the load to generation at the local level is an ideal method for precisely maintaining the balance and minimizing losses associated with transmission lines. Consumer-level market control of energy sharing in microgrids creates flexibility in the power distribution and increases the efficient allocation of renewable energy generation. Battery Energy Storage Systems (BESS) can enhance the effectiveness of the microgrid by counteracting problems such as intermittency and variability. A study in [3] shows that the forecasting of load data allows the optimal use of BESS for preventing spikes in peak load periods of a distribution grid. The method of peak-shaving and smoothing is successful in smoothing load curves and creating more predictable power sources. An alternate method of relieving grid stress and maintaining balance is discussed in [4], which employs a demand-side demand response strategy to provide ancillary services for contingency resources. A market is proposed for the open trading of ancillary services and determines the prioritization of resources available for the demand response. A study in [5] combines forecasting with Vehicle-to-Grid and Grid-to-Vehicle to alleviate utility line congestion. A market model with aggregator participation is proposed, which accommodates electric vehicle aggregators to balance the market while meeting the network constraints. Distribution grid line congestion and voltage violation problems are reduced while providing a new revenue stream for prosumers. In [6], a transactive energy framework with a Comprehensive Energy Management System (CEMS) for distribution systems with multiple microgrids is proposed to simplify the complex nature of sharing power, while increasing load balancing on a slightly larger scale. The CEMS operates in two phases. The first phase manages load imbalance by implementing a demand response and BESS availability. The second phase manages excess supply or residual demand by utilizing other microgrids or the utility. The CEMS simulation on a test feeder shows increased load balancing while reducing the aggregation complexity.
2.2. Economic Framework
Improvement of the economical aspect of our current energy infrastructure through peer-to-peer (P2P) energy sharing is another popular area of research and the topic heavily relies on microgrid technology. Microgrid infrastructure lays the foundation for transactive-based markets, where energy is exchanged between internal nodes. In [7], a transactive energy market which enables energy sharing between villages is proposed. It is shown that the total cost of energy is marginally reduced when compared to an identical scenario that uses distributed energy resources without energy sharing between villages. The small amount of overall effectiveness resulted from a few villages having negative cost savings. Power consumption savings of several villages were sacrificed for the benefit of the entire group’s savings, which suggests that there is room for improvement to better allocate the energy resources. A well-documented study in [8] thoroughly explores the P2P phenomenon and how consumers become prosumers with production and storage capabilities. The study stresses the fact that P2P markets must learn to coexist with current retail power markets in order to realize their own transition. A so-called hybrid power system of P2P and retail markets is the ideal model in terms of scalability and reducing the costs of power consumption. A recent study in [9] shows that integrating local energy markets with wholesale markets reduced the expected energy costs by 75%. In [10], an overview of game-theoretic approaches in P2P networks is provided, including the different forms of user contributions in energy trading. The objective function for a P2P energy exchange can range from maximizing social welfare to the profit of a single user. Users also have the ability to form coalitions to optimize their objective function as a group. In [11], an energy trading platform is developed and demonstrates the benefits of P2P trading within current retail markets. It is shown that load balancing is improved and transactions between the microgrid and utility are reduced. Current retail power markets offer little incentive to go beyond a net zero consumption, and excess power generated is compensated at a fraction of the cost it is sold for. The promising future of the prosumer encourages incentive; however, reform of current policies must happen before the true potential of the P2P network is realized. A hierarchical transactive energy management framework for a residential microgrid is proposed in [12]. The microgrid consists of houses without Renewable Energy Source (RES), with RES, and with RES plus BESS. The houses first meet their own demand locally, and then excess is available to purchase houses without RES or BESS at a price that is lower than utility pricing, but higher than feed-in tariffs. The microgrid market structure accurately sets pricing to provide an incentive for excess generation and a lower cost to consumers in the microgrid. The results of the study showed that during days of peak solar production, the microgrid is able to meet all local demands and minimize the amount of feed-in power going back to the grid. The cost benefit market framework also increased the rate of return by 49% AUD. A study in [13] introduces the concept of energy classes that value energy based on what consumers and prosumers are willing to pay, depending on the source. Energy classes remove the homogeneous pricing structure from traditional power grid schemes and could potentially be a basis for a new market pricing structure. An example of peer-to-peer energy exchange with an auction-controlled market scheme is presented in [14]. Residential units and shared facility controllers contribute to a joint energy storage device within a microgrid. An auctioneer controls the bidding process and handles the transactions. The study fails to supervise the finalization of power delivery to ensure that the purchased energy is delivered. Since the energy is all stored in a single device, the process of ensuring responsible behavior becomes vague. The problem of supervision is solved in [15], where a central supervisory node oversees negotiations among an energy collective. The energy collective is a community-based market structure that allows prosumers to actively optimize their assets. The non-profit supervisory virtual node optimizes energy dispatch and ensures that revenues and payments are aligned with prosumer preferences. The partially decentralized framework may struggle with scalability, and there is no mention of how trust is developed between the prosumer and the community supervisor. Methods other than auctions are also discussed to formulate price models. Factors such as willingness for load shifting [16] and the minimization of microgrid operational costs are used in iterative algorithms to solve price modeling problems due to supply and demand.
2.3. Security
P2P energy sharing markets may generate questions about security, and since the topic of P2P energy markets involves partial decentralization, a need arises for a distributed security platform on which to validate market transactions. One of the applications of a blockchain is peer-to-peer data exchange, which assures a high security and reliability of information exchanged. A blockchain can be used to exchange the load and power information in a distribution system. It consists of time-stamped records that are linked together in succession and managed by a large cluster of computers. Each new entry must be validated by the cluster, and all transactions are transparent to the users. A blockchain is used in [17] to create Distributed Ledger Technology that secures contracts between prosumers. The technology is also used in [18] to create coalition formation algorithms. In the above-mentioned article, it is noted that blockchain transparency may pose a privacy issue if energy consumption patterns are revealed. A private blockchain solution is suggested, in which the utility can be a cryptocurrency miner if they make the initial investment in the distribution network. Proof of concept is established in [19], demonstrating that the blockchain protocol is capable of sustaining a microgrid energy market by creating the first ever blockchain-based energy transactions. Three separate neighboring microgrids were created in Brooklyn, NY, to serve as a case study for a P2P energy trading market inside of a struggling centralized power grid. The system is composed of a physical microgrid and virtual community energy market platform. TransActive Grid© smart meters that operate on private blockchain protocol are installed to record and implement energy transactions. Trading is done automatically once a prosumer sets preferences on price limits and sources of energy. Buy and sell orders are handled by an Energy Management Trading System and become realized. The hybrid microgrid structure has the capability to isolate the utility in emergencies and handles load matching locally. The author argues in favor of new regulation to support hybrid microgrid structures with P2P energy trading markets and calls for more research on socio-economic preferences and price mechanisms. In addition to security, a blockchain is also used in [20] to maintain energy transfer within physical network constraints inside of a P2P low-voltage network.
2.4. Other Benefits
Other benefits of P2P energy markets include flexibility, self-sufficiency, and philanthropic programs. In [21], the benefits of P2P energy exchange for users in a grid with battery storage are presented. An optimization model is given for the peer-to-peer interactions with BESS for a small community in London, the United Kingdom. The paper concludes that the combined features of trade and flexibility from storage produce savings of up to 31% for the end-users, where half of the savings come from cooperation and trading in the community and the remainder are due to the battery’s flexibility in balancing supply-demand operations. A fully decentralized control system for microgrids using the information and communications technology concept of network overlays and peer-to-peer networks is presented in [22]. A pure P2P network overlay is applied to a microgrid control structure and a complete control system that allows autonomous power exchange in the form of dc is explained. Data analyses show improved self-sufficiency and resilience against utility blackouts. A federated power plant is proposed in [23]. Prosumers are organized into coalitions to provide grid services as a virtual power plant (VPP). The paper claims that the bottom-up organization of the VPP addresses social, institutional, and economic issues associated with top-down strategies. The main incentives are philanthropic and aim at reducing the carbon footprint or supplying subsidized power to low-income houses.
3. Contribution
In regards to the literature reviewed, it is evident that an enhanced and sustainable distribution-level power system is feasible, and necessary for securing a future that minimizes the impact of greenhouse gases and climate change. In order to initiate reform in favor of such systems, the proper implementation of robust security features, consumer choice, flexibility, and competition must be achieved. It is with this in mind that the innovative contributions of the proposed method are listed as follows:
- A new framework is proposed that considers energy sharing and allows a potential electrical energy buyer to minimize the energy-related costs by exchanging energy with peer neighbors or with the local utility,
- A new method is proposed that models the competition among energy sellers with the aim of maximizing their profit. The competition is modeled as a non-cooperative game where the parties do not collude or cooperate with each other.
To elaborate on the proposal, some key characteristics are listed:
- The sellers set their own cost curves, depending on their preferences or energy availability. The buyer can then collect the electrical energy from a variety of suppliers, as well as from the utility, in order to achieve the lowest possible cost;
- Energy procurement is modeled so that it can be carried out at any interval, such as 15 minutes or 5 minutes, in which real-time energy prices are posted in the energy market;
- The energy sellers compete with each other to maximize their profit, at prices below those of the retail market;
- The competition is modeled as a non-cooperative game where the parties do not collude or cooperate with each other;
- Each player maximizes their profit by algorithms that analyze scenarios of power transfer to each load node;
- The revenue comes from selling power and the profit is the difference between the revenue and the cost;
- Power output can originate from battery storage, or solar or wind generation;
- The power generation cost also depends on the way that power is generated. For example, if the power is generated from battery storage, the cost also reflects the age of the battery;
- If the user only has solar generation and controllable loads, the user’s discomfort cost is the only consideration;
- The outcome of market settlement is subject to the power flow constraints between nodes.
The proposed approach can be implemented on a higher time resolution timescale and with higher nodes. This optimization requires fast algorithms that can solve the problems in a short amount of time. Since the optimization is performed in a part of the distribution system down the transformer, the proposed approach can be easily extended to a large distribution system. The optimization can also consider the effect of reactive power and line inductance. In this prospective study, the interaction of power transfer between clusters of the distribution system will be studied in more detail.
4. Cost Minimization
In the first analysis of this paper, matching of the load and generation is modeled with an optimization problem, in which the objective function is to minimize the power flowing from the distribution transformer. This minimum power flow is accomplished by matching the nodes which have excess power with the nodes needing power. At each time step, which can be as short as five minutes, any node can take the role of a producer or consumer. The time resolution is the shortest time in which the power prices are updated in the real-time power market. The pairs of power-generating and power-consuming nodes are matched together at each time step to minimize the power flow from the distribution transformer. Minimizing the power flow from the distribution transformer minimizes the power loss along transmission and distribution lines, while realizing a more independent grid from central generating stations. The operation of independent microgrids within the main grid relieves the transmission lines and generating stations from having to provide reserve power used for maintaining stability. One of the main reasons for increasing renewable energy generation is the ability to provide a tremendous amount of backup power. A large backup power capacity increases the stability of the power grid in case of abrupt changes in the generation of renewable sources. Battery storage is one of the main tools for creating backup power to deal with the variability of RES. When dispersed geographically, batteries can absorb or discharge power to a nearby load node to deal with the fluctuations of electrical power. Each node is equipped with battery storage which can discharge to provide the load demand to the neighboring nodes. The best path of energy transfer is determined via an optimization problem that minimizes the losses of power transfer from the source to destination node. The generating node has a profit function to determine the money it requests from the load nodes. The load nodes fulfill their load demand from the generating nodes with the cheapest price, be it from the local generation source or the utility transformer. A profit function is defined for each prosumer which is equipped with battery storage. The profit function is the difference between the revenue of the prosumer and the cost associated with the battery operation. The revenue of the prosumer comes from selling the energy stored in the battery storage or the excess power from rooftop solar panel power generation. The amount of solar generation is intermittent and can only be curtailed. Therefore, in order to control the flow of power and minimize waste, the solar energy is combined with battery storage. The cost function consists of two components: line losses and battery wear and tear. The line loss component determines how economical the distance of transfer is. The cost component, expressed in c/kWh, determines the ownership costs associated with wear and tear. It is nonlinear and fitted with a quadratic function as follows:
where γ is given by the following relation:
Equation (1) is solved for , which is shown in Equation (2). represents the coefficient of cost function and can be tuned by the user. For example, suppose the cost of electricity is 20 cents per kWh at a given time and the generation node has a battery with 10 kW of nominal power which lasts for a given period of time, say 1 hour. This means that the battery has 10 kWh of energy stored. The γ coefficient is calculated as 0.2 and the profit function for the battery storage is given as
Each generation node can sell the excess power to the load nodes that need to absorb some energy. The load nodes can meet their load demand either from the generation nodes or via the local utility company through the distribution transformer. The overall cost of procuring power for load nodes is equal to the sum of purchasing power from generation nodes and the utility node:
where
In the above relations,i is the set of supply nodes including the transformer node t and j is the set of load nodes. Parameters γ and ζ represent the coefficient costs for battery and utility power, respectively. Node t represents the transformer node whose price is determined as the locational marginal price and is available from local power market price reports. is the load demand at the terminal of load nodes. is the power draw from the distribution transformer and represents the resistance between the corresponding generation and load nodes i,j. Since the distribution lines between nodes in a microgrid are mostly resistive, the reactance of lines in the distribution system is ignored. Relation (4) minimizes the overall cost of procuring energy for load demands at each timestep. The nodes will purchase power from the nodes that offer power at a lower cost. In other words, the suppliers who offer a quadratic cost curve with a lower value of γ sell more energy to the load nodes. If the supply nodes offer high prices or do not have energy stored in their batteries, the load nodes purchase power from the utility through the distribution transformer. The power of the supplier is the sum of the power needed by the load nodes and the losses along the lines. Therefore, optimization takes the line losses into account when power sharing is optimized among the load and generator nodes. Constraints imposed on the output of battery inverters are also considered. One power constraint is the nominal power output of the inverter and the other one is the amount of energy stored in the battery. The inverter power output is limited by the nominal power of the inverter and the amount of energy stored in the battery. This constraint is described as follows:
where
Equation (6) basically ensures that the power output of the inverter does not exceed the nominal power rating of the inverter and the power limited by the energy stored in the battery. In the above relation, is the nominal power output of the inverter and is the available energy stored in the battery or the amount of energy available to offer. The power outputs are also subject to line and transformer power flow constraints:
The objective function is constrained by the load and generation limits. The load constraint states that the load must be met from supply nodes and the distribution transformer:
The generation constraint states that supply nodes have to account for the load and the loss along the lines:
where is given in relation (6). In Equation (10), the first term represents the power delivery of receiving nodes and the second term shows the power loss along the lines from node , which is the power sender to the receiving nodes. DC power flow constraints are used, rather than AC constraints, to simplify the calculations. The optimization problem minimizes the cost of the load plus the loss of power. When the load node demand surpasses the generation provided by the generator nodes, the load nodes get the difference in power from the distribution transformer.
5. Market Structure
In this category, the sellers compete with each other to maximize their profit and settle in Nash equilibrium. The players are not willing to change their operation point in the Nash equilibrium. Mathematically speaking, an N-tuple of strategies with is said to constitute a non-cooperative Nash equilibrium solution for an N-person nonzero-sum finite game in an extensive form, if the N inequalities are satisfied for all [24]:
In the above equations, the player optimal strategy is found by minimizing the cost function against all available strategies. In other words, the optimal strategy considers the other players’ best responses, which means that other players will not deviate from their optimal strategies. The optimal power of the profit function is assumed to be quadratic. The optimal output of each player is obtained by differentiating the profit function with respect to each party’s control variable. The market demand curve is assumed to be linear. A linear function is assumed for the market demand curve, shown below:
In the above relation, stands for the real time price of power offered by the utility and is the quantity to be produced by each player. As the power providers offer more power to the market, the price of power will decline linearly with a given slope . The profit function of each supplier is determined by subtracting the revenue from the selling power and the cost associated with power losses along the lines and the cost of battery aging. The profit function of supplier is given below:
The first term in the summation describes the revenue obtained from selling power to the peer loads. The revenue can also come from ancillary services, such as reactive power and ramp up power. The second term in the summation is the cost of battery aging and the last term represents the cost of line losses from the sender to the receiver(s) of the power. In order to find each player’s optimal output, the profit function is differentiated with respect to its control variables:
The obtained equations are constrained by each party’s power flow constraints, as well as the constraints imposed by the power flow equations expressed in (6)–(10).
6. Simulation
The proposed approach was applied to a five-node system, as shown in Figure 1.
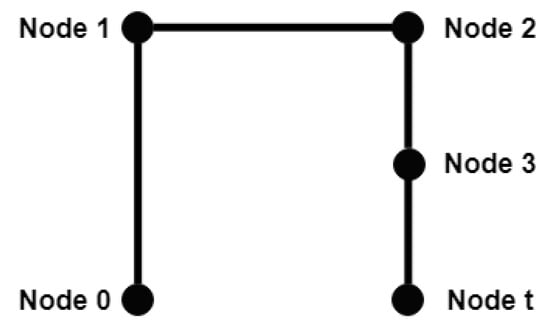
Figure 1.
Five-node system in a distribution grid.
The nodes and formulas were implemented in MATLAB to obtain power flow characteristics over time, and the data was discussed. Nodes 0 and 1 are the generator nodes, 2 and 3 are the load nodes, and node is the transformer node. The time step discussed here is one hour, though it can have a higher resolution. The supply function for nodes 0 and 1 were considered to be and respectively. For simplicity, it was assumed that the voltage magnitude of the nodes was 1 p.u. and the line resistance between nodes was 0.1 ohm. Therefore, the resistance between nodes 0 and 3 was 0.3 ohms. The objective function for the two-load and three-supplier test case can be given as follows:
In the above relation, the first line is the cost of purchasing power from supplier 0. The first term describes the power needed at the terminal of load 2 or and the second term accounts for the line loss along the way, from the terminal of supplier 0 to load 2, which is . The third line shows the cost of purchased power from the utility via the distribution transformer. Suppose nodes 0 and 1 have 6 and 7 kW available power and nodes 2 and 3 need 5 and 3 kW power. The load node demand constraint is then given as follows:
The supply node constraint is given as follows:
The supply constraints state that the inverter output power must be lower than or equal to the power required by the load nodes, plus the losses along the line. We wanted to determine how much power from each generating node reaches the load nodes and how much power comes from the distribution transformer to the load nodes.
6.1. Power Purchaser Cost Minimization
Several scenarios have been defined to show the applicability of the proposed approach. In the first scenario, the load demands of nodes 2 and 3 are 5 kW and the power output limits of generating nodes 0 and 1 are 6 and 3 kW, respectively. The generating nodes do not have enough power to meet the load demand and part of the load must be met from utility power. The power from generating node 0 to load node 2 is shown in Figure 2. As shown in the figure, when the price of electricity reaches its valley at 11:00, the generating node holds the power and all the load power is met by the utility. This is also shown in Figure 3, which displays the power flow from generating node 1 to load node 2. It can be seen from the figures that is higher than since the power from node 1 has to travel a shorter distance than that from node 0. In order to clarify the distance as a decision parameter, the power from utility to load nodes 2 and 3 and their difference are depicted in Figure 4.
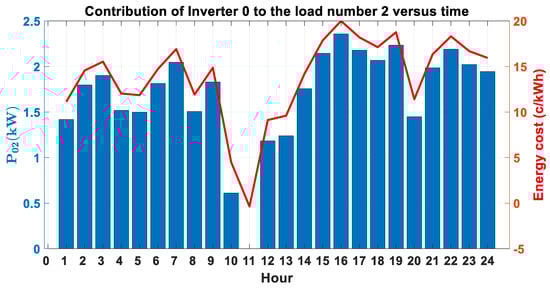
Figure 2.
Contribution of inverter 0 to load 2 along with the electricity price.
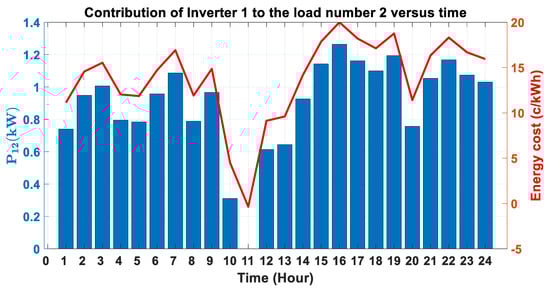
Figure 3.
Contribution of inverter 1 to load 2 along with the electricity price.
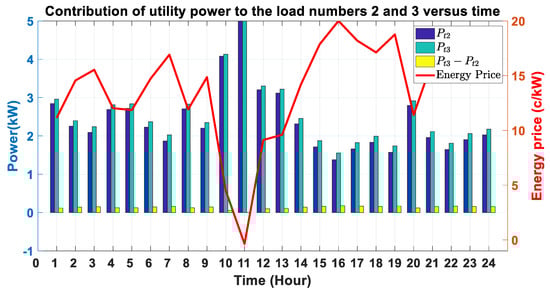
Figure 4.
Contribution of utility power to load 2 and 3.
In the next scenario, the coefficients of supplier 0 and 1 are swapped, meaning their real-time power prices are interchanged and their power outputs are compared. Figure 5 shows that, as the supplier 0 has decreased its value from 8 to 4, the amount of sold power has increased accordingly. In other words, supplier 0 has sold more power by reducing the overall value of its available power, which makes it more competitive. This amount must be greater than the marginal cost of storage in order to make a net profit. The marginal cost of storage is a time-dependent value and depends on aging of the battery.
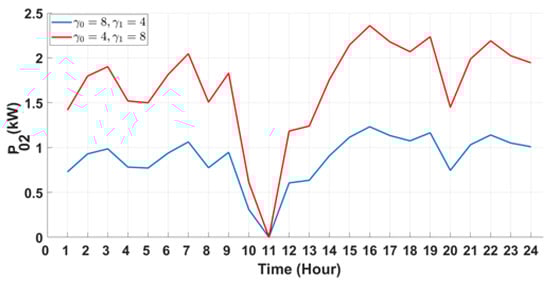
Figure 5.
with different values of .
6.2. Competitive Market
The players in the distribution grid compete with others to sell their extra power. Each player attempts to maximize the profit by increasing the difference between the income and cost. Several components comprise the cost of each player: the wear and tear cost, the discomfort cost of not having battery backup in case of outage, and the cost associated with power losses along the lines. In order to illustrate the players’ actions, the two nodes 0 and 1 compete with each other to sell their power to nodes 2 and 3. The profit functions of players 0 and 1 are given as follows:
where
In the above relations, the first term stands for the profit for seller 0. The revenue is determined by multiplying the price of electricity by the amount of power sold. The electricity price starts with the real-time price of electricity offered and declines as more power is offered by other providers. In this example, two providers, seller 0 and 1, offer power, and node 2 and 3 purchase power, as shown in Figure 1. In order to find each seller’s power output, the profit function of each supplier is optimized for the power transfer to the loads. The set of obtained equations are solved considering the power flow constraints:
The above equations are constrained to equations (6)–(10).
6.3. Sensitivity Analysis
In the first set of analyses, the power contribution of seller 0 to loads 2 and 3 is investigated. As shown in Figure 6, the distance between the seller and the consumer affects the power output according to the quadratic function shown in (18).
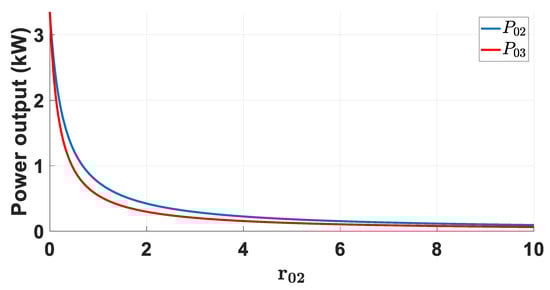
Figure 6.
Sensitivity of and to .
There is a sharp drop in the produced power from as the distance between node 0 and 2 grows. The line and producer constraints are relaxed to show that the resistance between the seller and the consumer affects the power production. also follows the same trend and resides below since it is located at a distance farther from node 0. In short, distance plays a key role in determining how much power will be sent to the consumer node, and the consumer nodes which are closer to the seller node will get a higher portion of the produced power. Figure 7 presents the sensitivity of generator nodes 0 and 1 to changes in the cost coefficient k.
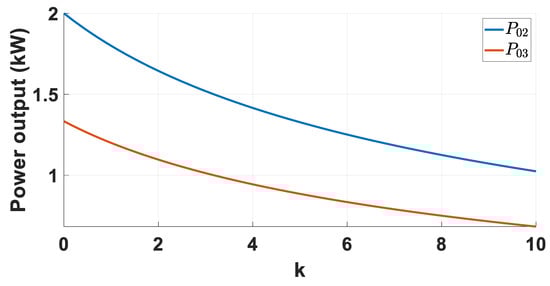
Figure 7.
Sensitivity of and to k.
This coefficient determines the impact of line loss on the overall profit of a seller. This value can also reflect the costs associated with battery operation and initial capital, plus other interest rates, depending on the type of purchase. As shown in the figure, as the value of k increases, the amount of power produced approaches zero. The low values of k can be justified by the savings made from avoiding the demand charge. The power component of resides above due to the proximity of the seller and buyer. In Figure 8 and Figure 9, the sensitivity of the seller power output with respect to parameters and is presented respectively. The value of represents the amount of profit for each seller when the sellers produce no power.
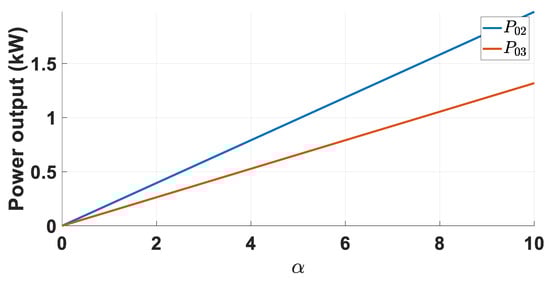
Figure 8.
Sensitivity of and to α.
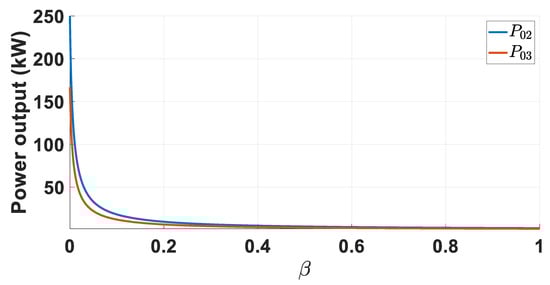
Figure 9.
Sensitivity of and to β.
This parameter shows the nodal price of electricity at the distribution transformer. When the producers start to output power, the price declines with the slope of as shown in (12). As the initial price of electricity increases, the revenue of sellers increases accordingly and as a result, they are incentivized to produce more power. The produced power is limited by the amount of power available from the sellers. has a lower value compared to because it is located farther from producer 0. Figure 9 shows the sensitivity of sellers to the slope of electricity price. With very low values of , the power output of producers is maximized and limited to their nominal available power.
In the next analysis, the sensitivity of power transfer with respect to voltage is analyzed. As shown in Figure 10, the voltage supplied to the receiving node has a significant impact on the power transfer.
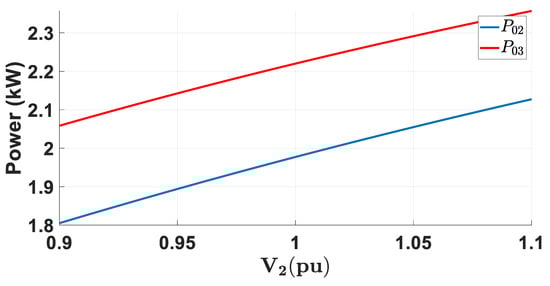
Figure 10.
Sensitivity of and to .
As the voltage grows to unity and above in each unit, the power transfer increases accordingly. The reason for this is that with the increased line voltage, the line loss between the seller and the load node decreases and more power can thus be transferred to the load node. The nodes which are at the end of a radial distribution system usually get a lower node voltage since there is a higher voltage drop along the lines. Therefore, it is less economic for the seller close to the distribution transformer to sell power to these end nodes and it is thus more optimal for these nodes to purchase power from the adjacent neighbors. In this figure, since supplier 1 is closer to load 2, it sends more power to this load.
7. Conclusions
In this paper, P2P energy exchange between nodes in a distribution grid is discussed. The problem is analyzed from two perspectives: first, from the consumer’s perspective, minimizing the cost of purchased electricity, and second, from a market. In the first approach, the power consumer minimizes the cost of power purchased from the distribution nodes and the utility. The optimization problem is formulated along with constraints of power producers and the network flow. A four-node model with two producers and two consumers is presented and the optimization problem is simulated for the test case. In the second approach, P2P energy exchange is discussed in a competitive market environment. The sellers compete with each other to sell their power to the consumers. The sellers’ profit functions are defined as quadratic functions and the market price is assumed to be linear. The sellers’ power output is presented, which is the result of optimizing their profit. Several sensitivity analyses have been performed for the derived optimization solutions and the obtained results have been discussed.
Author Contributions
All authors worked on this manuscript together. All authors read and approved the final manuscript.
Funding
This work was supported by the Provost’s Scholars Award at California State University, Bakersfield.
Conflicts of Interest
The authors declare no conflict of interest.
References
- Nazari-Heris, M.; Mohammadi-Ivatloo, B.; Gharehpetian, G.B.; Shahidehpour, M. Robust short-term scheduling of integrated heat and power microgrids. IEEE Syst. J. 2019, 13, 3295–3303. [Google Scholar] [CrossRef]
- Shayeghi, H.; Shahryari, E.; Moradzadeh, M.; Siano, P. A survey on microgrid energy management considering flexible energy sources. Energies 2019, 12, 2156. Available online: https://www.mdpi.com/1996-1073/12/11/2156 (accessed on 12 September 2019). [CrossRef]
- Reihani, E.; Motalleb, M.; Ghorbani, R.; Saoud, L.S. Load peak shaving and power smoothing of a distribution grid with high renewable energy penetration. Renew. Energy 2016, 86, 1372–1379. [Google Scholar] [CrossRef]
- Motalleb, M.; Thornton, M.; Reihani, E.; Ghorbani, R. A nascent market for contingency reserve services using demand response. Appl. Energy 2016, 179, 985–995. [Google Scholar] [CrossRef]
- Hu, J.; Yang, G.; Ziras, C.; Kok, K. Aggregator operation in the balancing market through network-constrained transactive energy. IEEE Trans. Power Syst. 2019, 34, 4071–4080. [Google Scholar] [CrossRef]
- Nunna, H.S.V.S.K.; Srinivasan, D. Multiagent-based transactive energy framework for distribution systems with smart microgrids. IEEE Trans. Ind. Inform. 2017, 13, 2241–2250. [Google Scholar] [CrossRef]
- Daneshvar, M.; Pesaran, M.; Mohammadi-ivatloo, B. Transactive energy integration in future smart rural network electrification. J. Clean. Prod. 2018, 190, 645–654. [Google Scholar] [CrossRef]
- Sousa, T.; Soares, T.; Pinson, P.; Moret, F.; Baroche, T.; Sorin, E. Peer-to-peer and community-based markets: A comprehensive review. Renew. Sustain. Energy Rev. 2019, 104, 367–378. Available online: http://www.sciencedirect.com/science/article/pii/S1364032119300462 (accessed on 17 September 2019). [CrossRef]
- Lezama, F.; Soares, J.; Hernandez-Leal, P.; Kaisers, M.; Pinto, T.; Vale, Z. Local energy markets: Paving the path towards fully transactive energy systems. IEEE Trans. Power Syst. 2018, 34, 4081–4088. [Google Scholar] [CrossRef]
- Tushar, W.; Yuen, C.; Mohsenian-Rad, H.; Saha, T.; Poor, H.V.; Wood, K.L. Transforming energy networks via peer to peer energy trading: Potential of game theoretic approaches. IEEE Signal Process. Mag. 2018, 35, 90–111. [Google Scholar] [CrossRef]
- Zhang, C.; Wu, J.; Zhou, Y.; Cheng, M.; Long, C. Peer-to-peer energy trading in a microgrid. Appl. Energy 2018, 220, 1–12. [Google Scholar] [CrossRef]
- Akter, M.N.; Mahmud, M.A.; Oo, A.M.T. A hierarchical transactive energy management system for microgrids. In Proceedings of the 2016 IEEE Power and Energy Society General Meeting (PESGM), Boston, MA, USA, 17–21 July 2016; pp. 1–5. [Google Scholar]
- Morstyn, T.; McCulloch, M.D. Multiclass energy management for peer-to-peer energy trading driven by prosumer preferences. IEEE Trans. Power Syst. 2019, 34, 4005–4014. [Google Scholar] [CrossRef]
- Tushar, W.; Chai, B.; Yuen, C.; Huang, S.; Smith, D.B.; Poor, H.V.; Yang, Z. Energy storage sharing in smart grid: A modified auction-based approach. IEEE Trans. Smart Grid 2016, 7, 1462–1475. [Google Scholar] [CrossRef]
- Moret, F.; Pinson, P. Energy collectives: A community and fairness based approach to future electricity markets. IEEE Trans. Power Syst. 2019, 34, 3994–4004. [Google Scholar] [CrossRef]
- Liu, N.; Yu, X.; Wang, C.; Li, C.; Ma, L.; Lei, J. Energy-Sharing Model with Price-Based Demand Response for Microgrids of Peer-to-Peer Prosumers. IEEE Trans. Power Syst. 2017, 32, 3569–3583. [Google Scholar] [CrossRef]
- Thakur1, S.; Breslin1, J.G. Peer to peer energy trade among microgrids using blockchain based distributed coalition formation method. Technol. Econ. Smart Grids Sustain. Energy 2018, 3, 5. [Google Scholar] [CrossRef]
- Siano, P.; de Marco, G.; Rolan, A.; Loia, V. A survey and evaluation of the potentials of distributed ledger technology for peer-to-peer transactive energy exchanges in local energy markets. IEEE Syst. J. 2019, 13, 3454–3466. [Google Scholar] [CrossRef]
- Mengelkamp, E.; Garttner, J.; Rock, K.; Kessler, S.; Orsini, L.; Weinhardt, C. Designing microgrid energy markets: A case study: The Brooklyn microgrid. Appl. Energy 2018, 210, 870–880. Available online: http://www.sciencedirect.com/science/article/pii/S030626191730805X (accessed on 25 October 2019). [CrossRef]
- Guerrero, J.; Chapman, A.C.; Verbic, G. Decentralized p2p energy trading under network constraints in a low-voltage network. IEEE Trans. Smart Grid 2019, 10, 5163–5173. [Google Scholar] [CrossRef]
- Luth, A.; Zepter, J.M.; delGranado, P.C.; Egging, R. Local electricity market designs for peer-to-peer trading: The role of battery flexibility. Appl. Energy 2018, 229, 1233–1243. Available online: http://www.sciencedirect.com/science/article/pii/S0306261918311590 (accessed on 23 September 2019). [CrossRef]
- Werth, A.; Andre, A.; Kawamoto, D.; Morita, T.; Tajima, S.; Tokoro, M.; Yanagidaira, D.; Tanaka, K. Peer-to-peer control system for dc microgrids. IEEE Trans. Smart Grid 2018, 9, 3667–3675. [Google Scholar] [CrossRef]
- Morstyn, T.; Farrell, N.; Darby, S.; McCulloch, M. Using peer-to-peer energy-trading platforms to incentivize prosumers to form federated power plants. Nature Energy 2018, 3, 94–101. [Google Scholar] [CrossRef]
- Basar, T.; Olsder, G. Dynamic Noncooperative Game Theory, 2nd ed.; Society for Industrial and Applied Mathematics: Philadelphia, PA, USA, 1998; Available online: https://epubs.siam.org/doi/abs/10.1137/1.9781611971132 (accessed on 25 October 2019).


© 2020 by the authors. Licensee MDPI, Basel, Switzerland. This article is an open access article distributed under the terms and conditions of the Creative Commons Attribution (CC BY) license (http://creativecommons.org/licenses/by/4.0/).