Abstract
Future carbon management during energy production will rely on carbon capture and sequestration technology and carbon sequestration methods for offsetting non-capturable losses. The present study quantifies carbon sequestration via reforestation using measurements and modeling for recent and legacy surface coal mining grasslands that are re-restored through tree planting. This paper focuses on a case study of legacy coal mining sites in the southern Appalachia the United States. This five million-hectare region has a surface mining footprint of approximately 12% of the land area, and the reclamation method was primarily grassland. The results of the soil carbon sequestration rates for restored forest soils approach 2.0 MgC ha−1 y−1 initially and average 1.0 MgC ha−1 y−1 for the first fifty years after reclamation. Plant, coarse root and litter carbon sequestration rates were 2.8 MgC ha−1 y−1 with plant carbon estimated to equilibrate to 110 MgC ha−1 after forty years. Plant, root and litter carbon stocks are projected to equilibrate at an order of magnitude greater carbon storage than the existing conditions, highlighting the net carbon gain. Reforestation of legacy mine sites shows carbon sequestration potential several orders of magnitude greater than typical land sequestration strategies for carbon offsets. Projections of future scenarios provide results that show the study region could be carbon neutral or a small sink if widespread reforesting during reclamation was implemented, which is contrary to the business-as-usual projections that result in a large amount of carbon being released to the atmosphere in this region.
1. Introduction
Future carbon management during energy production will rely on carbon capture and sequestration (CCS) technology and carbon sequestration methods for offsetting non-capturable losses. The present study quantifies carbon sequestration via reforestation on recent and legacy surface coal mining grasslands that are re-restored through tree planting. Surface coal mining sites are often restored to maintain landscape stability through the use of compacted grasslands. In turn, the restored sites are well below their potential in terms of plant and soil carbon stocks [1,2]. The historical plant and soil carbon depletions can become a large part of the carbon footprint for energy extraction. Therefore, these carbon depletions on legacy surface mine sites offer potential for carbon sequestration through re-restoration methods.
Despite a decline in coal production reaching a local minimum in 2016, the global coal production in 2019 approached the previous high from 2013 with global demand forecasts to 2024 exceeding previous all-time highs [3,4]. Half of the worldwide CCS power plants being developed will burn coal, which places further emphasis on carbon sequestration strategies to be used in concert with CCS. Legacy mining sites can cover huge regions offering carbon sequestration potential by re-restoring the sites via reforestation.
This paper focuses on carbon sequestration via reforestation in legacy mining sites through a case study of coal mining in the Southern Appalachian Forests Region (SAFR) of the United States (see Figure 1). Although the focus is on carbon sequestration, reforestation projects can have both carbon and biodiversity benefits [5], which may be particularly important given that the SAFR is a biodiversity hotspot (Figure 2). This SAFR is an over five million-hectare region that has undergone extensive surface mining termed mountaintop coal mining (MCM) methods [6]. The methods currently replace pre-mined deciduous forests with post-mining compacted and restored grasslands—a result of litigation over forty years ago enacted to stop landslides from mining in the region [7]. The result is that the plant carbon and soil carbon of these compacted grasslands holds only 14% of the carbon of pre-mined forests [8]. This carbon deficiency coupled with the mining footprint of approximately 12% of the SAFR (590,000 ha) [9] offers high potential for carbon sequestration. Grassroots efforts in the region to promote re-restoration of legacy minelands have grown into a collaborative initiative with the coal industry to widely implement the strategy with over 110,000 ha reforested [10,11,12]. However, the carbon sequestration rates and future potential have not been measured and modeled, to the best of our knowledge, in this context of carbon management and CCS. For this reason, new carbon data results from multi-year re-restored mining sites and modeling of carbon sequestration are presented in this study.
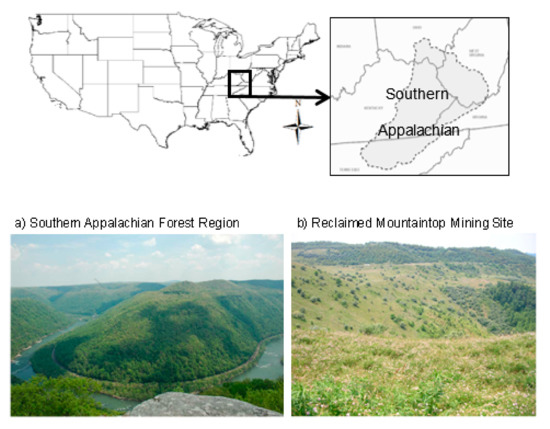
Figure 1.
(a) Undisturbed forests and (b) grassland remaining after reclamation. The surface mining occurring in the Southern Appalachian Forests Region (SAFR) was most recently estimated as removing 590,000 ha of the land surface [9]. Of this, almost all of the land after SMCRA (1977) was reclaimed as grassland. The number of grassland-reclaimed mines that are converted to forests has increased substantially in the past decade. Wickham et al. [2] reported that only 370 ha of the region was re-reclaimed as forests in 2011. Since that time, the Appalachian Regional Reforestation Initiative has reportedly planted 187 million trees over 110,000 ha in the region [12]. Currently, 304,000 ha of grassland-reclaimed mine sites are post-bond released and unused, and could be available for reforestation (Appalachian Regional Reforestation Initiative, ARRI) [11].
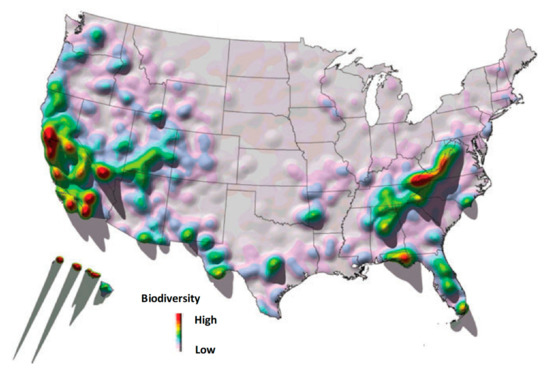
Figure 2.
Carbon sequestration potential of the region. Areas of biological diversity in the continental United States identify the Southern Application Forest Region as a critical zone (Source: The Nature Conservancy, Arlington, VA, USA).
2. Methods
Carbon budgets for mountaintop coal mining (MCM) disturbances must account for losses during land stripping, carbon in reestablished vegetation, and surface and subsurface sequestration of soil carbon after reclamation. The sampling and modeling methods used to quantify these carbon fluxes for reforested MCM sites are described below. This study compares the soil and non-soil carbon for reforestation reclamation, grassland reclamation, and non-mined sites. The soil carbon for reforestation reclamation is based on new field measurements (Section 2.1) and modeling (Section 2.2) reported in this study. The non-soil carbon for reforestation [13] and the soil and non-soil carbon for grassland reclamation [1] are based on previous publications for sites that are representative of the climate and land cover in the SAFR. The carbon data for non-mined forests is extracted from a United States Department of Agriculture, USDA (United States Department of Agriculture), county-level carbon database. We briefly summarize the methods that were used in these previous studies (Section 2.3). Methods for the analysis of regional carbon sequestration using alternative reclamation scenarios are also provided (Section 2.4).
2.1. Soil Carbon Measurements on Reforestation Sites
We studied a chronosequence of four MCM sites in southeastern Kentucky that were reclaimed using the forest reclamation approach as specified by the Appalachian Regional Reforestation Initiative (ARRI) [10]. The sampled sites were at 2, 5, 13 and 14 years since reclamation. The 2- and 5-year sites (Figure 3a,b) were both located at the Bent Mountain Mine near the community of Meta in Pike County, Kentucky (Latitude N 37°35′49″, Longitude W 82°24′19″) [14,15]. These sites were established as a set of research plots by the University of Kentucky’s Appalachian Fuel active mountaintop mining operation (Angel et al. 2009). The 13- and 14-year sites (Figure 3c) are located at Starfire Mine in eastern Perry County and western Knott County, Kentucky (37°24″ N, 83°08′ W) [16]. These sites were established as research plots by the University of Kentucky to quantify the impact of various reclamation techniques on reforestation success [16]. We chose these sites because all sites were established as research plots by the University of Kentucky, we were confident that ARRI was properly carried out on all sites, it was known that disturbance since reclamation could be minimized or documented, and the sites were similar in size and relief and measured approximately 1.6 ha in area. Overburden at the 2- and 5-year sites was placed in an “end-dump” method, where loose overburden material is simply arranged in piles 1 to 2 m deep over traditional, heavily compacted overburden. A similar method was used for the 13- and 14-year sites; however, one to two passes with a grader created a smooth and navigable land surface that was not compacted. Trees were planted in loosened overburden material that was arranged in piles 1 to 2 m deep over the heavily compacted overburden.
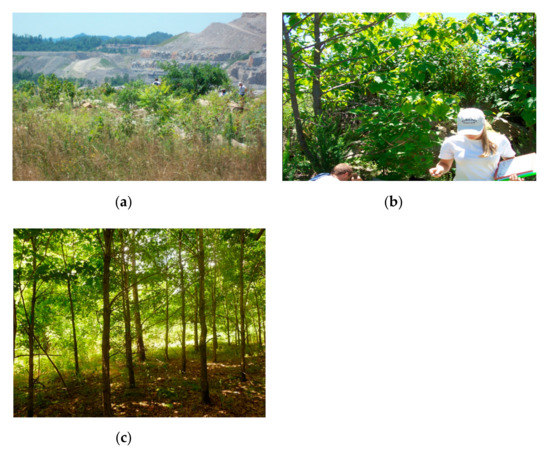
Figure 3.
Field views of chronosequence of reclaimed mineland sites at 2 years (a), 5 years (b), and 13 years (c) after reforestation.
Vegetation at the 2-year site consisted of seedlings less than 2 feet tall with intermittent weeds, while trees at the 5-year site were considerably taller. In addition, there was a dense vegetative cover of Miscanthus and other grasses at both the 2- and 5-year sites. This understory cover, however, was not present at the 13- and 14-year sites because the well-developed, closed canopy of the forest prohibited most sunlight from penetrating to the forest floor. Tree heights at these sites were 10 to 15 m, depending on species.
The sampling, laboratory measurements, and analysis are summarized in Figure 4. We collected soil and litter samples from 0–5, 5–10, 10–25, and 25–50 cm depth increments. At each site, approximately eight soil pits were excavated. Soil samples were analyzed for elemental carbon mass, carbon isotope ratios (δ13C), bulk density, and particle size distribution. Analysis was conducted with a Costech 4010 elemental analyzer interfaced with a Thermo Finnigan Conflo III device to a Thermo Finnigan Delta Plus XP isotope ratio mass spectrometer (IRMS). Carbon isotope measurements allowed the partitioning of soil carbon and geogenic carbon fractions, the latter being associated with coal fragments.
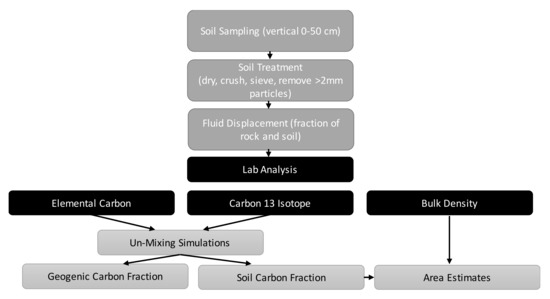
Figure 4.
Overview of sampling and analytical measurements. Soil pits were excavated to reveal the soil profile at each of the eight replicates at each site. Litter samples were collected and soil samples were collected from 0–5, 5–10, 10–25, and 25–50 cm depth increments. Processed soil samples were analyzed for elemental and δ13C signatures and mass balance un-mixing simulations were used to separate the geogenic and soil C fractions, in which the carbon isotope was used as the tracer. Bulk density and rock fragment estimates from field samples assisted with areal estimates of soil carbon.
Bulk density measurements were obtained from 0–10 and 10–50 cm depth increments. A method was derived to quantify bulk density for the 10–50 cm depth interval since the significant presence of large rock fragments impeded the traditional approach of driving in soil cores. Rectangular soil pits were excavated beyond 10 cm depths and the spoil was preserved for mass determination in the laboratory. The volume of spoil was determined through careful measurement of the resulting dimensions.
Reclaimed surface mine soils in the SAFR contain a significant volume of overburden rock and geogenic organic carbon (GOC, coal fragments). In order to correct carbon density measurements for rock content, two five-gallon buckets of soil collected from 0 to 50 cm were collected from the study sites. The total in situ volume of the soil collected was determined through measurement of the resulting dimensions. The soil in each bucket was dried, crushed and sieved using the same process by which isotopic and elemental soil samples were prepared. Particles greater than 2 mm were collected and the total volume was determined through fluid displacement to calculate the volumetric fraction of soil and rock to be applied toward the calculation of carbon stocks. This measurement was further refined to account for non-soil particles less than 2 mm in size. Rock particles smaller than 2 mm were removed by hand from each soil sample that was processed. In order to correct the carbon density measurements for GOC, we made isotope measurements and ran an un-mixing model. Processed samples were analyzed for elemental and isotopic (δ13C) carbon properties and mass balance un-mixing as outlined in Acton [17]. Mass-balance un-mixing was performed to separate soil organic carbon (SOC) from coal carbon, termed GOC, using measured litter and coal δ13C values as end members.
We compared soil carbon data sets using statistical significance t-tests. The significance level (α) of 0.05 is used as a threshold for comparisons of soil carbon data from different sites.
2.2. Soil Carbon Modeling on ARRI Reforestation Sites
We conducted kinematic modeling on the chronosequence of ARRI soils to assess the temporal changes in soil organic carbon (SOC) content with an emphasis on the time to reach equilibrium SOC content. We followed the exponential model of Knops and Tilman [18] to simulate SOC on the ARRI sites, and the grassland soil carbon results were used directly from the kinematic model of Acton et al. [1]. For the ARRI SOC projection, we applied the kinematic model as
where SOC(t) is the soil carbon density in time, SOCe is the equilibrium carbon density, and SOCi is the initial carbon density. The kinematic constant, k, was solved by differentiating both sides with respect to time and substituting a calculated average initial uptake rate into the variable dSOC(t)/dt. The initial carbon density was set to zero, and the reasoning for this is discussed further in the Results section. The carbon density obtained at equilibrium needs to be representative of a value that is actually achievable within the soils. Since this equilibrium result is uncertain, in the current study, the model was applied twice to the dataset while changing the equilibrium carbon density. A low and high value of 70 and 90 MgC ha−1, respectively, were used to generate the two bounds. The higher bound was generated with regard to the undisturbed soil carbon density, representative of the SAFR [19], while the lower bound represents a lower bound relative to SOC sequestration potential from a previous study. Due to the asymptotic nature of the kinematic function, a consistent method for determining the timeframe of equilibrium needed to be established. For this study, a soil was considered “stable” when 95% of SOC equilibrium was reached. Thereafter, the kinematic constant and time to 95% of SOC equilibrium were adjusted to reach minimum least squared error between the modeling results and the SOC data results from the ARRI chronosequence. The results reported for the ARRI SOC kinematic modeling reflect the average of the two bounded models for equilibrium carbon density.
2.3. Soil and Non-Soil Carbon Estimates from Previous Publications
In order to compare the soil and non-soil carbon for reforestation reclamation, grassland reclamation, and undisturbed sites, we obtained literature estimates of reforestation reclamation non-soil carbon (Section 2.3.1), grassland reclamation soil and non-soil carbon (Section 2.3.2), and non-mined site soil and non-soil carbon (Section 2.3.3).
2.3.1. Non-Soil Carbon on Reforestation Sites from Previous Publications
Non-soil carbon sequestered on the former minelands that were reforested sites was estimated based on the measurements in Amichev et al. [13] in which data are provided for vegetation, coarse root and litter carbon pools in reclaimed forest sites. The Amichev et al. [13] sites were surface-mined lands reclaimed prior to the passage of the Surface Mine Control and Reclamation Act of 1977 and heavy compaction of overburden material was not performed as it is on MCM sites. Thus, re-growth of trees for the reclamation provided justifiable estimates of above-ground carbon stocks for non-compacted, reforestation reclamation. Pine, hardwood and mixed tree stands reported in Amichev et al. [13] were used, which together agreed with the species used in the ARRI reclamation study plots. While our study does differentiate carbon by species group, previous work has found that the variation among species groups is less than 40 Mg ha−1 [13], which is much less than the variation between forest and grassland carbon reported here. The growth rates of trees in loosely compacted substrate without shading effects have been documented to be much higher than those reported under natural forest conditions and equilibrium plant carbon was estimated to occur at 60 years. For this analysis, equilibrium tree carbon stock density was 103 Mg C ha−1 and equilibrium litter carbon was 5 Mg C ha−1. We found that these non-soil estimates were in good agreement with the USDA estimates from the Carbon Online Estimator (COLE) database, highlighting the aboveground plant carbon sequestration potential of reforestation.
2.3.2. Soil and Non-Soil Carbon on Grassland Reclamation Sites from Previous Publications
Soil carbon on reclaimed grasslands was reported in Acton et al. [1]. This study applied kinematic modeling as described above to project measurements from a chronosequence of grassland MCM sites.
Non-soil carbon on grassland reclamation sites was estimated using biogeochemical modeling via the Century 4.5 model. Although Century is described for this application in Acton [17] and Campbell et al. [20], we describe the model and its use in brief for the reader.
The Century model, developed by the Natural Resource Ecology Laboratory (NREL) at Colorado State University in Fort Collins, CO, was designed to understand a wide range of issues with the objective being to perform system analyses of land management and global change on the sustainability of agroecosystems [21,22,23]. Century is an ecosystem model, meaning it quantifies and simulates all aspects of the plant-soil environment. Plant production is a simulated variable and is calculated as a result of environmental conditions and genetic potential. Century simulates the long-term dynamics of carbon (C) and nitrogen (N), with an option to simulate both sulfur (S) and phosphorus (P). Major input variables for the model include climate data, lignin content of plant material, elemental plant content (N, P, S), soil texture, atmospheric and terrestrial N inputs and initial soil C, N, P and S levels. There are many output variables that can be viewed, and the focus for this application was viewing net primary productivity and carbon accrual due to plant growth.
Century models the development of plant carbon and soil organic matter over long time scales using input from 12 separate data files that characterize crop/grass growth, cultivation, fertilization, fire, grazing, harvesting, irrigation, organic matter additions, tree growth, tree removal, organic matter decomposition, and site-specific conditions. All of these files are combined with a scheduling utility that governs the timing and schedule of when events occur. Century allows for plant-soil modeling under numerous soil condition and plant scenarios that can then be used to create effective land management plans and optimize the use of the soil. The Century environment couples various submodels (e.g., plant production, grass, forest, soil, water budget, nitrogen) under a scheduling utility to create scenarios that can mimic existing conditions for model validation, or to explore future land management plans and their effect on plant-soil dynamics.
Simulating the primary succession of vegetation in Century was performed in this study, generally following the approach of Raich et al. [24], but made more specific for the case study of grassland reclamation on mining soils without topsoil amendment. The researchers worked directly with NREL associates to parameter Century 4.5 for the conditions of grassland mining. In general, mining soils in the present study contain very little initial organic material, and these conditions were mimicked in input files; and temperate grassland model parameters were unchanged from default Century values for these parameters. Specifically, the crop selected for this study, Konza tallgrass prairies (KNZ) was chosen based on correspondence with NREL and simulates a tall (approximately 1 m) grass. The modeled crop was slightly modified to reflect symbiotic nitrogen fixation from leguminous species planted during reclamation. A multiplier to calibrate net primary production was modified to obtain an equilibrium net primary productivity (NPP) of 500 and 700 g m−2y−1. These two scenarios represent high and low productivities. Observations and field measurements of soil organic carbon indicated that, initially, a negligible amount of SOC exists in the soil. Therefore, a spin-up model run was not performed, and SOC within the pools were set to near zero for model stability. The mining soils are heavily compacted, and particle size distributions showed that the returned overburden (i.e., crushed sandstone and shale) is well-graded. This results in a material that compacts very well with minimal void space. While measurements to quantify field infiltration or hydraulic conductivity of the soil were not taken, visual observation and personal correspondence with other researchers suggest these soils are poorly drained. Therefore, surface runoff from these soils is quite high, and this was reflected by adjusting soil hydraulic parameters to simulate soil conditions with very low permeability. Monthly averages of maximum and minimum temperatures were obtained from the National Oceanic and Atmospheric Administration. Average monthly precipitation and associated standard deviations were obtained from the same source, and precipitation values were stochastically generated from a normal distribution for each month. Soil texture data was obtained by performing a hydrometer analysis on 12 year old grassland mine clay particles were taken to be less than 0.002 mm in diameter, sand particles greater than 0.063 mm and silt particles were in between. Six subsamples were analyzed independently, but were taken from the same pooled mass of soil. Percentages of clay, silt and sand were 24, 57 and 19%, respectively. Furthermore, these values, alongside bulk density, were used to calculate field capacity and wiling point of each soil layer using equations from Gupta and Larson [25]. The acid-insoluble lignin content of plant material is a major input parameter and was measured for the 12-year site.
The parameterization of the scheduling utility was relatively simple for this analysis since no physical alterations to the grass is performed after reclamation. The month of March was selected as the first month for plant growth, and plant senescence occurred in October. These months were approximated, given that their sensitivity to overall SOC was insignificant. Simulations of up to 1000 years were performed with monthly outputs. Model calibration was performed by assessing SOC sequestration over the first 14 years, and maintaining a consistent NPP afterward. Annual plant production reached equilibrium after 150 to 200 years and ranged from 500 to 570 g m−2. Above ground live plant carbon just before plant senescence stabilized at 210 gC m−2, while below ground root carbon contained 540 gC m−2. Above and belowground litter material also comprised a significant portion of the total carbon budget, containing between 1330 to 1410 gC m−2. In modeling, initial primary productivity was very high, and resulted from the oxidization of ammonium (NH4+) into easily accessible, yet highly mobile nitrate (NO3−). The remaining dissolved nitrogen that could not be used was leached from the system, and this phenomenon has been documented in other mining soils [26]. However, the nutrient process had little long-term effect on soil processes since production stabilized at approximately 150 years.
2.3.3. Soil Non-Soil Carbon on Non-Mined Sites
Un-mined scenarios were generated to estimate the fully forested scenario for the SAFR as well as to project the undisturbed forest pool. The USDA COLE database was used to estimate non-soil carbon, including live tree, dead tree, under story, downed dead wood, and forest floor carbon pools, for each county in the SAFR. The results were aggregated for the SAFR region.
Soil carbon stocks on sites that were not mined followed the same methods as those applied for SOC sampling on reforestation sites and were located in close proximity, and thus allowed for direct comparison (see published dataset for un-mined sites in Acton et al. [1]). The soil sequestration from secondary forest regrowth was accounted for by using the USDA COLE computer model of carbon stocks by age class and an estimated mean current age class of 50 years [27,28]. These COLE data are spatially and temporally explicit, allowing our analysis to extract a subset of the data that is a representative estimate of the SAFR region.
2.4. Reclamation Scenarios for Regional Analysis
Historic areas of MCM disturbances for the past 50 years were calculated using published coal extraction records. Spatially explicit coal production data were available for the years after 1994 from the United States Energy Information Administration. Mining records older than 1994 did not disaggregate in space or by mining practices. For these earlier years, we used highly detailed coal production data from Eastern Kentucky (Kentucky Office of Energy Policy, 2008) to estimate the MCM fraction of all mining practices. Extrapolation of the Kentucky percentages to the region was justifiable given that the actual mountaintop mining occurring is in a highly focused portion of Appalachia where the four states meet and mining methods have advanced together in this region [6], and Eastern Kentucky accounts for approximately half of the coal produced via surface mining in the SAFR.
The business-as-usual deforestation rate assumed and projected forward in our analyses was 12,153 ha y−1. This rate assumes the area of the land destroyed annually by mining. This rate falls in the mid-point of the mining rate data reported since 2000 in Pericak et al. [9], and corresponds to the 2010 rate in the above mentioned historic analyses. Our projected rate was less than the previously published rate of 15,190 ha y−1 used in forecasting analyses [6,20,29]. We qualify that the projected business-as-usual rate is uncertain. For example, active mining in the SAFR has decreased by about 15% the past decade; however, the ratio of disturbance area to coal produced has increased by about 300% the past decade in Appalachia [9]. Projections of current mining rates may be overestimated if environmental regulations and competition with natural gas and other energy sources lead to a reduction in coal mining. Alternatively, the projection of the current mining rate may be an underestimate given the reality that coal seams are becoming thinner and harder to reach. The recent analyses by Pericak et al. [9] support both of these concepts.
We consider future scenarios of regional MCM activity in our projections up to the year 2100. Alongside the present and future demand for low-sulfur coal [4], the region contains ample coal reserves to continue mining at current rates throughout the twenty-first century. We consider the business-as-usual scenario at present deforestation rates with the conventional practice of grassland reclamation. Furthermore, we consider the phase-out of MCM activities as scenarios, and we include 100% and 50% phase-out scenarios. Mining phase-out reflects the increased environmental regulations placed on MCM operators due to mining impacts on streams, CO2 environmental regulations, and competition with natural gas and other energy sources, which could all lead to a reduction in coal demand. We also consider hypothetical scenarios for the comparison of immediate ceasing of all extraction in the region and for comparison to the carbon stocks estimated with COLE (see Section 2.2) for the condition of mining never occurring in the region. We project the base conditions forward as a scenario. An alternative scenario included growth in MCM mining rates fostered by the increased coal energy needed for power plants with carbon capture and sequestration (CCS) technology and increased energy exports from the region. The latter idea is fostered by the potential for U.S. environmental regulations requiring CCS to put pressure on increased bulk coal production rates in the Southern Appalachian forests in order to offset the energy requirements of CCS plants.
3. Results
3.1. Soil Carbon
Elemental and isotopic properties for soils are shown in Table 1. A particle size distribution (Figure 5) of the Bent Mountain Mine (5 y) and Starfire Mine (14 y) sites indicate the similarity of the soils and the coarse texture of the soil, while the clay contents for the sites were 17% and 14%, respectively. SOC measurements from the 13- and 14-year sites showed a much more developed top layer than the younger sites (see Figure 6). The 2-year site showed very little SOC distributed throughout the soil column, although the 0–5 cm depth interval does demonstrate the presence of new SOC. The 5-year site is characterized by a much stronger presence of SOC as compared to the 2-year site. SOC content in the top depth interval of the 13- and 14-year sites is within the range of values reported for undisturbed forests in the region. Visual field observations indicated the presence of a well-defined developing surface layer (A horizons) for these older sites. However, only a very small increase was found at the bottom three depth intervals, and SOC levels across the sites were not statistically different (α = 0.05) in the three lower measurement locations (Figure 6).

Table 1.
Results of ARRI soil carbon analysis. Parentheses indicate ±1 SE.
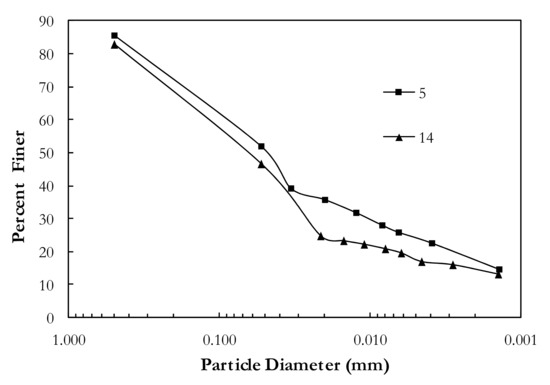
Figure 5.
Particle size distribution of ARRI soils. Results from the Bent Mountain Mine (5 y) and Starfire Mine (14 y) sites.
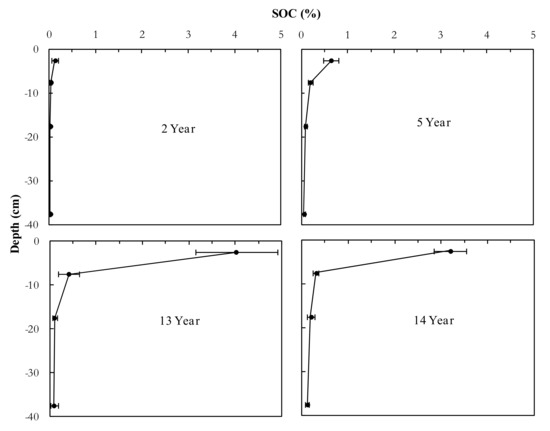
Figure 6.
ARRI soil organic carbon (SOC) profiles. Uncertainty reflects ±1 standard error, SE.
Trends of δ13C at each site tend to follow a similar, but opposite, pattern to depth (Figure 7). New organic matter δ13C values are relatively depleted as compared to GOC material. The 2-year site shows little deviation in δ13C with depth, with the exception of the top depth interval, where contributions from new SOC impact the bulk δ13C measurement. The 5-year site shows a much stronger shift in δ13C at the top three depths toward SOC inputs. This is evidence of new SOC cycling with depth, which corroborates the findings in the SOC profile for this site. The 13- and 14-year sites show a shift in δ13C at the top depth interval toward a range that is typical of undisturbed forests; however, no significant difference was found for depth as compared to the 5-year site.
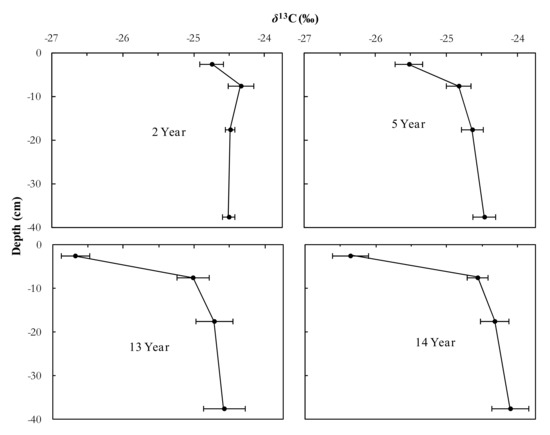
Figure 7.
ARRI δ13C vertical profiles. Uncertainty reflects ±1 SE.
Carbon stocks and carbon sequestration rates of reclaimed forest soils were upscaled in order to quantify changes in SOC storage across the chronosequence of sites. Over a period of 14 years, SOC stocks increased from 1.6 ± 0.4 MgC ha−1 to 22.5 ± 3.2 MgC ha−1 (Table 2). SOC stocks in the oldest reclaimed forest sites are approximately 17% of undisturbed forest SOC stocks in the region, highlighting the potential of re-restored forests to sequester additional carbon.
Table 2.
Measured SOC Stocks Under ARRI Reclamation. Uncertainty reflects ±1 SE.
To assess the rate of soil carbon sequestration in comparison to grassland reclamation, SOC stocks were modeled alongside measured grassland SOC stocks (Figure 8). Similarities between the 2-year afforestation and grassland sites demonstrate that the initial soil carbon was very low as expected because both afforestation reclamation and grassland reclamation practices use predominantly overburden and do not apply soil amendments. The overburden material is crushed rock without soil carbon. The grassland site had an initial condition of approximately 1 MgC ha−1, which is reasonable because the seed mixture with grass and legume mixture that is spread across the mining sites and the cover to assist with stabilization does have some small amount of carbon. The data and best fit line for the grassland soil (see Figure 8) support this contention. For the ARRI site, we do not have “zero year” data, which is a limitation. However, the earliest year 2-year site shows SOC of near zero carbon, and the specific estimated soil carbon stock using the data is just 1.66 MgC ha−1. This result agrees with the very small soil profile development in the SOC data for the 2-year site (see Figure 6) as well as our visual observations of plants and soil on the site. Trees were planted in the overburden. After two years, the SOC stock is still almost zero because the trees are so small initially that fell leaf material from the small trees does not get incorporated into the soil column. There are some small weeds and grasses that grow around the trees, but these also do not have much carbon associated with them after just two years. There was no visible darker coloration due to SOC accrual in the surface soils. Based on these observations, we assume zero carbon (0 MgC ha−1) as the initial condition for time zero on the ARRI sites. A very strong (R2 = 0.99) linear trend in the ARRI data was found, yielding an SOC sequestration rate from data alone of 1.7 MgC ha−1 y−1.
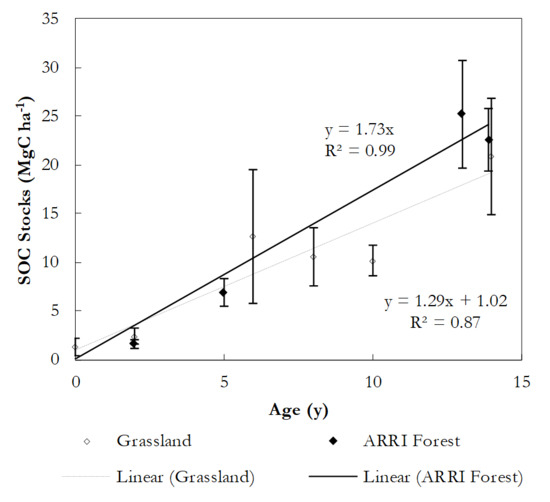
Figure 8.
Measured SOC stocks the ARRI reforestation experiment reported in this study (squares). For comparison, previously published data from a grassland experiment of Acton et al. [1] are also plotted (diamonds).
Kinematic modeling results for SOC sequestration on ARRI sites are compared against previously published kinematic modeling for SOC sequestration on grassland sites (see Figure 9). Modeled ARRI site projected SOC sequestration rates were 1.0 MgC ha−1 y−1 for the first fifty years after reclamation (Figure 9), and then were projected towards equilibrium with another 44% increase in SOC over the last seventy-five years. The ARRI SOC model results slightly exceed the sequestration results for the SOC sequestration on the grassland soils, which agree with the results in Figure 8. To reach these results for the ARRI sites, as mentioned in the methods, a low and high value of 70 and 90 MgC ha−1, respectively, were used to generate the two bounds for the ARRI future SOC sequestration and the results reflect the average condition for the bounds. For both lower and upper bounds, the kinematic constant and time to reach the 95% percent equilibrium condition were similar in magnitude. The lower, 70 MgC ha−1 bound, corresponded to k = 0.0275 y−1 and 95% equilibrium at 109 years, and the upper, 90 MgC ha−1 bound, corresponded to k = 0.0215 y−1 and 95% percent equilibrium at 139 years. For comparison, the lower and upper bounds for the grassland SOC sequestration model reached 95% equilibrium at 112 and 205 years for 50 and 90 MgC ha−1 equilibrium concentrations and k equal to 0.027 and 0.0145 y−1, respectively. On average, the results suggest the potential for equilibrium carbon content to be reached more quickly with the ARRI method.
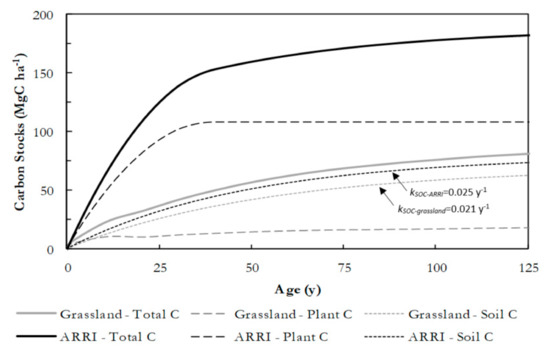
Figure 9.
Simulated carbon storage on reclaimed mountaintop mining land as a function of time since reclamation for grassland reclamation (grey lines) and ARRI reforestation reclamation (black lines). Soil C estimates from ARRI and grassland field measurements are projected in time using kinematic modeling. Plant C is estimated using the Century model for grasslands and using a chronosequence of field measurements for ARRI sites. Kinematic rates shown on the graph reflect the average rates after considering upper and lower bounds in Equation (1) for ARRI sites in this study and grassland sites described in Acton et al. [1].
3.2. Plant Carbon and Total Forest Carbon
Non-soil, or plant, carbon included vegetation, coarse roots and litter carbon. Plant carbon stocks and their carbon sequestration rates were found to be substantially greater on the re-restored tree sites compared to their grassland comparison. Plant carbon is estimated to equilibrate to 110 MgC ha−1 after forty years, which is an order of magnitude greater than the 13 MgC ha−1 estimate of plant carbon for the grasslands for the same time period (Figure 9). The plant carbon sequestration rates of re-restored forests were 2.8 MgC ha−1 y−1.
The total forest carbon sequestration rate for the re-restored forests was 3.8 MgC ha−1 y−1. We found that reclamation by reforestation results in net carbon sequestration that is three times the total terrestrial carbon sequestered using the grassland reclamation technique 50 years after mine reclamation and 2.2 times the grassland sequestration after 100 years (Figure 9). The major difference in total carbon sequestration between these two reclamation types is reflected in the non-soil carbon stocks associated with live and dead aboveground biomass, the understory, downed dead wood, and litter with a reforested non-soil carbon pool approximately one order of magnitude greater than the non-soil pool on grasslands 100 years after mine reclamation.
3.3. Projection of Scenarios
Next, we considered a range of future MCM mining scenarios with the current conventional practice, which is grassland reclamation (Figure 10), and the proposed method for improved carbon sequestration, which is reforestation reclamation (Figure 11). The resulting impacts on regional SAFR carbon storage with grassland reclamation are projected up to the year 2100 (Figure 10). For reference, we show two hypothetical scenarios, including a scenario with no historical MCM and a scenario in which MCM ceased in 2010. Both hypothetical scenarios highlight the carbon sequestration capacity of the region as a net CO2 sink due to secondary forest regrowth on lands that were never mined. Fully phasing out MCM methods by the end of the twenty-first century is projected to result in the Southern Appalachian forests becoming carbon neutral by 2100 as the deforestation emissions from mining over the simulated period equal the regrowth sequestration on lands that were never mined over the same period. A scenario with a 50% increase by 2100 in the annual area of MCM disturbance would result in an additional 0.2 Pg CO2 y−1 emitted beyond that of current annual MCM rates. The projections in Figure 10 are conservative because the net losses of soil and non-soil carbon per unit of coal produced were based on the existing mountaintop mines and it is realized that future MCM sites in Appalachia could become more land use intensive as coal seams become thinner, deeper and harder to reach, resulting in larger areas of disturbance per unit of coal produced.
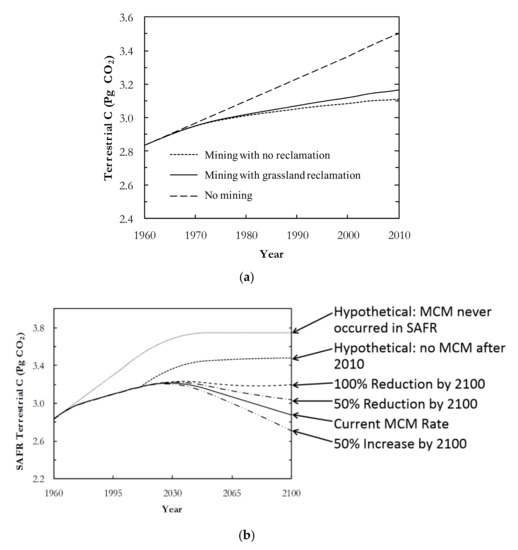
Figure 10.
(a) Historical forest carbon stocks (soil and vegetation) for the Southern Appalachian Forest Region (SAFR) for three alternative scenarios: (1) mining with no reclamation (small dashes); (2) mining with grassland reclamation (solid line); (3) no mining (large dashes). (b) Terrestrial carbon projections in the Southern Appalachian forests with sequestration from forest regrowth occurring on all Southern Appalachian forests lands and grassland reclamation on MCM lands. Hypothetical scenarios are shown to reference the carbon sequestration potential from secondary forest growth. Alternative mining rate scenarios are the annual area of deforestation at the current annual rate (0% reduction) and linear changes in annual rates by the year 2100 (100% reduction, 50% reduction, 50% increase).
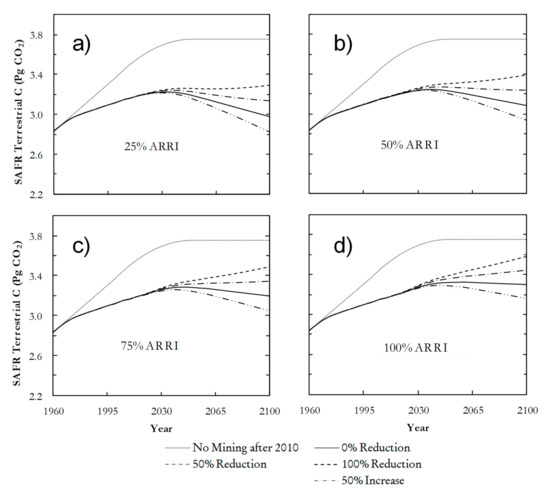
Figure 11.
Terrestrial carbon disturbance under a range of reclamation practices and mining rates. The 0% reduction in the plots reflects a business-as-usual mining disturbance equal to 12,153 ha y−1. Mining disturbance rates are reduced (50% and 100%) or increased (50%) relative to the business-as-usual rate, considering the potential for reduced mining from decreased demand, but also the potential for increased land disturbance as seams are thinner and harder to reach (e.g., data results show potential for both trends in Pericak et al. [9]). Projection is carried to 2100 because there is ample coal supply in the region to mine at the current rate throughout the 21st century ([20], and data from references therein). The different plots represent different mixtures of reforestation and grassland reclamation on future sites, assuming that either method could be chosen. Currently, grassland reclamation is the de facto approach. Plots show reclamation mixtures including (a) 75% grassland and 25% reforestation (ARRI) reclamation, (b) 50% grassland and 50% reforestation reclamation, (c) 25% grassland and 75% reforestation reclamation, and (d) 100% reforestation reclamation.
Finally, we consider the regional carbon budget for a range of reforestation reclamation scenarios up to the year 2100 (Figure 11). Most scenarios with reforestation result in the Southern Appalachian forest region remaining a net CO2 source despite significant sequestration of non-mined lands that are second-growth forests with regrowth. However, the scenario in which future mining uses reforestation reclamation (as opposed to the grassland reclamation used currently) and MCM is phased out by 2100 results in the region acting as a net atmospheric CO2 sink (reforestation sequestration across the region on mining and non-mining lands outweighs the deforestation emissions from MCM) (Figure 11d). The net carbon sequestration potential via new mining and reclamation strategies in Appalachia shows savings of 0.7 Pg CO2 y−1. Furthermore, this scenario has a regional storage that is only 0.2 Pg CO2 lower (5%) than the scenario with no historical mining by the year 2100. With reforestation reclamation and current MCM mining rates continuing, the Southern Appalachian forests become a net source because the emissions from mining disturbance are even larger than the widespread regional sequestration from secondary forest regrowth.
4. Discussion
As a CO2 equivalent, reforestation of mining sites has a carbon sequestration potential rate of 13.9 Mg CO2 ha−1 y−1. This carbon sequestration method is several orders of magnitude larger than other land use management strategies aimed at carbon sequestration (e.g., no-till farming) [30]. The increased carbon sequestration potential via forest planting relative to legacy grassland sites is pronounced and offers an approach for carbon management, especially when considering the often large spatial area covered by surface mining methods [9].
Some increased carbon sequestration may be possible beyond the estimates in this paper by adding soil amendments to re-restored sites, and future research might investigate this potential. The equilibrium soil carbon stocks for the re-restored tree planting sites (Figure 9) show agreement with reclaimed grassland carbon stocks at equilibrium [1,31] but fall short of equilibrium stocks reached by reforested mine sites when soil organic matter amendments are added [32]. The equilibrium forest soil carbon stocks at 125 years in Figure 9 reach 80% and 90% of un-disturbed forest soils for first and second growth, respectively, as reported in Acton et al. [1]. The results in Figure 9 for soil carbon are corroborated by Amichev et al. [13]. That study analyzed reforested sites with loose, un-compacted soils on mining sites with ages ranging from 19 to 50 years since reclamation and found that soil carbon stocks contain only, on average, 15% to 25% of the carbon in un-mined, adjacent forest soils. The additional C sequestration potential might be considered against costs associated with soil amendments. Food and agricultural waste offer potential for inexpensive amendments, but must be weighed against CO2 emissions and the financial costs of transportation.
The carbon stocks projected here may be further influenced by climate change. Altered temperatures and precipitation, as well as increased atmospheric CO2, will affect both plant growth and soil respiration. The net effect of these change on terrestrial carbon stocks is generally dominated by increased sequestration due to the atmospheric CO2 effects on productivity in global earth systems models [33]. However, significant regional variation is possible and the net effects of climate change on carbon sequestration in the SAFR are not well understood.
Despite potential future work to optimize soil carbon sequestration, the results highlight the carbon sequestration potential for re-restoring surface mining sites. We point out that this work has emphasized carbon; however, other attractive ecosystem benefits are reported to occur [2,11,34,35]. The reforestation approach includes the planting of trees in loosened overburden material. This may help restore the hydrological function of the land surface by allowing greater rates of infiltration, and increased root action to support the biological function of the soil column.
Regarding the specific region of the SAFR, projected scenarios suggest the potential to turn the region into a net terrestrial carbon sink. Previous research showed that the continuation of current mining rates and grassland reclamation practices will turn the southern mining region of Appalachia into a large carbon source to the atmosphere in this century [20]. The projected results show that a gradual reduction in surface mining rates and increases in reforestation may cause the region to become carbon neutral or a small sink.
Author Contributions
Conceptualization, methodology, formal analysis, investigation, writing—original draft preparation, writing—review and editing, visualization, J.F.F., J.E.C., P.M.A.; data curation, P.M.A.; resources, supervision, project administration, funding acquisition, J.F.F. All authors have read and agreed to the published version of the manuscript.
Funding
This project was funded by the National Science Foundation Awards 0754888 and 1632888.
Acknowledgments
We thank Chris Barton for the site access and information regarding the replanted sites. We thank Alice Jones and acknowledge her discussions with Patrick Angel, Cindy Keough and William Parton, who provided their logistical assistance, participated in technical discussions, and helped with numerical modeling. We thank the student participants of the Research Experience for undergraduates hosted by the University of Kentucky and Eastern Kentucky University for their help with the forest soil pit excavation. We acknowledge the efforts of three anonymous reviewers and the editorial board for providing comments that helped us improve the quality of this paper.
Conflicts of Interest
The authors declare no conflict of interest.
References
- Acton, P.M.; Fox, J.F.; Campbell, J.E.; Jones, A.L.; Rowe, H.; Martin, D.; Bryson, S. Role of soil health in maintaining environmental sustainability of surface coal mining. Environ. Sci. Technol. 2011, 45, 10265–10272. [Google Scholar] [CrossRef] [PubMed]
- Wickham, J.; Wood, P.B.; Nicholson, M.C.; Jenkins, W.; Druckenbrod, D.; Suter, G.W.; Strager, M.P.; Mazzarella, C.; Galloway, W.; Amos, J. The overlooked terrestrial impacts of mountaintop mining. BioScience 2013, 63, 335–348. [Google Scholar] [CrossRef]
- IEA. Coal 2019; IEA: Paris, France, 2019; Available online: https://www.iea.org/reports/coal-2019 (accessed on 10 October 2020).
- IEA. Coal Information: Overview; IEA: Paris, France, 2020; Available online: https://www.iea.org/reports/coal-information-overview (accessed on 10 October 2020).
- Díaz, S.; Hector, A.; Wardle, D.A. Biodiversity in forest carbon sequestration initiatives: Not just a side benefit. Curr. Opin. Environ. Sustain. 2009, 1, 55–60. [Google Scholar] [CrossRef]
- Wickham, J.D.; Riitters, K.H.; Wade, T.G.; Coan, M.; Homer, C. The effect of Appalachian mountaintop mining on interior forest. Landsc. Ecol. 2007, 22, 179–187. [Google Scholar] [CrossRef]
- United States Congress. The Surface Mining Control and Reclamation Act (SMCRA) of 1977; U.S. Public Law 1977; United States Congress: Washington, DC, USA, 1977; pp. 95–187.
- Fox, J.F.; Acton, P.; Campbell, J.E. Carbon and Mountaintop Mining. BioScience 2014. [Google Scholar] [CrossRef]
- Pericak, A.A.; Thomas, C.J.; Kroodsma, D.A.; Wasson, M.F.; Ross, M.R.; Clinton, N.E.; Campagna, D.J.; Franklin, Y.; Bernhardt, E.S.; Amos, J.F. Mapping the yearly extent of surface coal mining in Central Appalachia using Landsat and Google Earth Engine. PLoS ONE 2018, 13, e0197758. [Google Scholar] [CrossRef]
- Angel, P.; Davis, V.; Burger, J.; Graves, D.; Zipper, C. The Appalachian Regional Reforestation Initiative. In The Forestry Reclamation Approach: Guide to Successful Reforestation of Mined Lands; US Department of Agriculture, Forest Service, Northern Research Station: Newtown Square, PA, USA, 2017. [Google Scholar]
- ARRI. Appalachian Regional Reforestation Initiative. 2020. Available online: https://arri.osmre.gov (accessed on 8 September 2020).
- Popkin, G. The Green Miles. In The Washington Post Magazine; Fred Ryan: Washington, DC, USA, 2020. [Google Scholar]
- Amichev, B.Y.; Burger, J.A.; Rodrigue, J.A. Carbon sequestration by forests and soils on mined land in the Midwestern and Appalachian coalfields of the US. For. Ecol. Manag. 2008, 256, 1949–1959. [Google Scholar] [CrossRef]
- Angel, P.N. Forest Establishment and Water Quality Characteristics as Influenced by Spoil Type on a Loose Graded Surface Mine in Eastern Kentucky. Ph.D. Thesis, University of Kentucky, Lexington, KY, USA, 2008. [Google Scholar]
- Angel, P.N. The Forestry Reclamation Approach and the Measure of Its Success in Appalachia. In Proceedings of the 2009 National Meeting of the American Society of Mining and Reclamation, Billings, MT, USA, 30 May–5 June 2009; Barnhisel, R.I., Ed.; ASMR: Lexington, KY, USA, 2009. [Google Scholar]
- Angel, P.N. Surface Mine Restoration Research: Evaluation of Tree Response to Low Compaction Reclamation Techniques. In Proceedings of the 7th International Conference on Acid Rock Drainage (ICARD), St. Louis, MO, USA, 26–30 March 2006; Barnhisel, R.I., Ed.; American Society of Mining and Reclamation (ASMR): Champaign, IL, USA, 2006. [Google Scholar]
- Acton, P.M. Study of Terrestrial Carbon in Forests and Mined Lands in the Southern Appalachian Forest Region. Master’s Thesis, University of Kentucky, Lexington, KY, USA, 2012. [Google Scholar]
- Knops, J.; Tilman, D. Dynamics of soil nitrogen and carbon accumulation for 61 years after agricultural abandonment. Ecology 2000, 81, 88–98. [Google Scholar] [CrossRef]
- United States Department of Agriculture. Natural Resource Conservation Service, Soil Survey Division, World Soil Resources, Soil Organic Carbon Map; Natural Resources Conservation Service. Available online: https://www.nrcs.usda.gov/wps/portal/nrcs/detail/soils/use/?cid=nrcs142p2_054018 (accessed on 2 February 2017).
- Campbell, J.E.; Fox, J.F.; Acton, P.M. Terrestrial carbon losses from mountaintop coal mining offset regional forest carbon sequestration in the 21st century. Environ. Res. Lett. 2012, 7, 045701. [Google Scholar] [CrossRef]
- Parton, W.; Schimel, D.; Cole, C.; Ojima, D. Analysis of factors controlling soil organic matter levels in Great Plains grasslands. Soil Sci. Soc. Am. 1987, 51, 1173–1179. [Google Scholar] [CrossRef]
- Sanford, R., Jr.; Parton, W.; Ojima, D.; Lodge, D. Hurricane effects on soil organic matter dynamics and forest production in the Luqillo experimental forest, Puerto Rico: Results of simulation modeling. Biotropica 1991, 23, 364–372. [Google Scholar] [CrossRef]
- Metherell, A.K.; Harding, L.A.; Cole, C.V.; Parton, W.J. CENTURY: Soil Organic Matter Model Environment; Technical Documentation, Agroecosystem Version 4.0, GPSR Technical Report 4; USDA Agricultural Research Service: Fort Collins, CO, USA, 1993.
- Raich, J.; Parton, W.; Russell, A.; Sanford, R., Jr.; Vitousek, P. Analysis of factors regulating ecosystem development on Mauna Loa using the Century model. Biogeochemistry 2000, 51, 161–191. [Google Scholar] [CrossRef]
- Gupta, S.C.; Larson, W.E. Estimating soil water retention characteristics from particle size distribution, organic matter content and bulk density. Water Resour. Res. 1979, 15, 1633–1635. [Google Scholar] [CrossRef]
- Williamson, J.; Johnson, D. Mineralisation of organic matter in topsoils subjected to stockpiling and restoration at opencast coal sites. Plant Soil 1990, 128, 241–247. [Google Scholar] [CrossRef]
- Pan, Y.; Chen, J.M.; Birdsey, R.; McCullough, K.; He, L.; Deng, F. Age structure and disturbance legacy of North American forests. Biogeosciences 2011, 8, 715–732. [Google Scholar] [CrossRef]
- Liu, J.; Liu, S.; Loveland, T.R. Temporal evolution of carbon budgets of the Appalachian forests in the U.S. from 1972 to 2000. For. Ecol. Manag. 2006, 222, 191–201. [Google Scholar] [CrossRef]
- EPA. The Effects of Mountaintop Mines and Valley Fills on Aquatic Ecosystems of the Central Appalachian Coalfields; US Environmental Protection Agency: Washington, WA, USA, 2011.
- Lal, R. Soil carbon sequestration impacts on global climate change and food security. Science 2004, 304, 1623–1627. [Google Scholar] [CrossRef]
- Chatterjee, A.; Lal, R.; Shrestha, R.K.; Ussiri, D.A.N. Soil carbon pools of reclaimed minesoils under grass and forest landuses. Land Degrad. Dev. 2009, 20, 300–307. [Google Scholar] [CrossRef]
- Akala, V.A.; Lal, R. Soil organic carbon pools and sequestration rates in reclaimed minesoils in Ohio. J. Environ. Qual. 2001, 30, 2090–2104. [Google Scholar] [CrossRef]
- Friedlingstein, P.; Cox, P.; Betts, R.; Bopp, L.; von Bloh, W.; Brovkin, V.; Cadule, P.; Doney, S.; Eby, M.; Fung, I.; et al. Climate-carbon cycle feedback analysis: Results from the C4MIP model intercomparison. J. Clim. 2006, 19, 3337–3353. [Google Scholar] [CrossRef]
- Palmer, M.A.; Bernhardt, E.S.; Schlesinger, W.H.; Eshleman, K.N.; Foufoula-Georgiou, E.; Hendryx, M.S.; Lemly, A.D.; Likens, G.E.; Loucks, O.L.; Power, M.E.; et al. Mountaintop mining consequences. Science 2010, 327, 148–149. [Google Scholar] [CrossRef] [PubMed]
- Zipper, C.E.; Burger, J.A.; Skousen, J.G.; Angel, P.N.; Barton, C.D.; Davis, V.; Franklin, J.A. Restoring forests and associated ecosystem services on Appalachian coal surface mines. Environ. Manag. 2011, 47, 751–765. [Google Scholar] [CrossRef] [PubMed]


Publisher’s Note: MDPI stays neutral with regard to jurisdictional claims in published maps and institutional affiliations. |
© 2020 by the authors. Licensee MDPI, Basel, Switzerland. This article is an open access article distributed under the terms and conditions of the Creative Commons Attribution (CC BY) license (http://creativecommons.org/licenses/by/4.0/).