Abstract
To secure the safety of xEV (all types of electrical vehicles), the United Nations released Global Technical Regulation No. 20, “Global Technical Regulations on the EVS (Electric Vehicle Safety)” in March 2018. The fire resistance test of the rechargeable energy storage system (REESS) describes an experimental procedure to evaluate the safety performance—specifically, whether passengers would have sufficient time to escape from the xEV before the explosion of the battery in a fire. There are two options for component-based REESS fire resistance tests: a gasoline pool fire and a liquefied petroleum gas (LPG) burner. This study describes the process for optimizing the specifications of the fire resistance test apparatus for xEV batteries using an LPG burner, which was first proposed by the Republic of Korea. Based on the results of the measurement and a computational fluid dynamics analysis of the prototype test apparatus, new equipment designs were proposed by determining the nozzle spacing and number, fuel flow rate, and experimental conditions. To cover a wide range of xEV battery sizes, a final test apparatus consisting of 625 burners was selected. For three different battery sizes, it was possible to satisfy the temperature requirements, ranging from 800 to 1000 °C, of the GTR fire resistance test. The final apparatus design developed in the present study has been included in GTR No. 20 for EVS since March 2018.
1. Introduction
The global market share of electric-powered vehicles (xEV) has been gradually increasing due to tightened regulations on environmental pollution, climate change caused by greenhouse gases, and the need for alternative energy resources [1,2]. According to a typical scenario of the International Energy Agency, the annual sales of xEV will be about 65 million by 2050 in major global markets including North America, Europe, China, India, and Pacific regions [1]. If ambitious policies are continuously introduced to meet more challenging climate goals, the market volume of light-duty xEV is predicted to grow to 220 million in 2030 [2]. In adopting xEV, however, there remain some technical barriers, including safety concerns [3]. In order to ensure the safety of xEV from battery fires, the UN released GTR No. 20 “Global Technical Regulation on the EVS (Electric Vehicle Safety)” in March 2018 after a long discussion in the informal working group on EVS since 2012 [4,5,6,7,8].
Since fires due to internal and external factors of the REESS can cause serious damage [9,10,11], the fire resistance of the REESS is one of the main safety requirements of xEv in the GTR. The fire resistance test of the REESS describes an experimental procedure to evaluate the safety performance—specifically, whether passengers would have sufficient time to evacuate the xEV before the explosion of the battery in a fire. In the case of component-based REESS fire resistance tests, there are two options: a gasoline pool fire and a liquefied petroleum gas (LPG) burner.
For the REESS safety standards, the Republic of Korea led the way by establishing seven test procedures (drop, immersion, overcharge, overdischarge, short circuit, thermal exposure, and fire resistance tests) in 2009 [12]. The test procedure was revised in 2014 to meet the trend of high power, large capacity, and large scale of REESS. Table 1 shows the main contents of the fire resistance test of REESS described in the Korea Motor Vehicle Safety Standard [13,14]. In the discussion on the GTR enactment of EVS, Korea submitted a draft on the fire resistance test of REESS using a LPG burner as an alternative to the UN R.100 gasoline pool fire method [4]. The IWG called for two kinds of justification for Korea’s proposal. The first is the equivalence of the thermal energy delivered to the REESS between the two methods during the test period. The other is the detailed structure and specifications of the apparatus for implementing reliable conditions for the fire resistance test using the LPG burner.

Table 1.
Traction battery safety test 48.6.7 explaining fire resistance test in KMVSS Test Procedure Annex 1.48.
The final goal of this study is to develop an experimental apparatus using LPG burners for the fire resistance test of xEV batteries. A systematic experiment was necessary to determine the detailed specifications of the fire resistance test apparatus using LPG burners that meet the requirements of IWG for EVS. With a prototype test apparatus equipped with LPG burners, an initial experiment was performed to check whether the requirements of the fire resistance test were satisfied. To reduce the number of experiments, the performance of the prototype apparatus was analyzed using CFD. After verifying the accuracy and reliability of the CFD results by carefully comparing them with the initial experimental data, an additional CFD analysis was applied to study the effects of the burner nozzle spacing, the number of burners, and the fuel supply flow rate. Based on the simulation results, the final design of the apparatus was selected for the fire resistance test. It could not only satisfy the target temperature conditions of the fire resistance test procedure, but also maintained the temperature distribution uniformly at the measurement points below the device under test.
This paper is organized as follows. A description of the prototype test apparatus and an assessment of its temperature measurement data are given in Section 2. The first part of Section 3 contains a brief explanation on the CFD analysis method to predict the experimental data of the prototype apparatus. The latter part of Section 3 shows the applications of CFD to various test apparatus designs with different burner spacing, number of burners, arrangement, and fuel supply flow rates. Section 4 presents the experimental results of the selected test apparatus from the CFD analysis of Section 3. It discusses in detail whether the experimental results meet the criterion of GTR. The conclusions are summarized in Section 5.
2. Prototype Test Apparatus and Its Experimental Results
2.1. Description of Prototype Test Apparatus
Figure 1 shows a prototype test apparatus. It consists of a burner zone with a total of 156 burners and a DUT slide on which the mock-up is placed. The DUT slide exposes the mock-up directly to the flame above the burner zone and then moves it away from the burner zone according to the test schedule. The Bunsen burner is manufactured in the manner described in GTR No. 13 (Global technical regulation on hydrogen and fuel cell vehicles) [15] and Korea’s regulations on the safety of pressure vessels for automobiles.
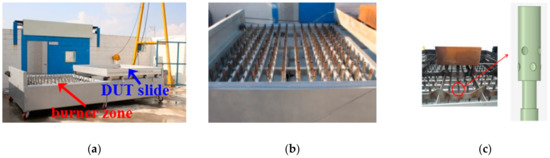
Figure 1.
Configurations of prototype test apparatus: (a) front view of apparatus; (b) burner zone (156 EA); (c) Bunsen burner.
The prototype test apparatus was designed with a modular structure in order to evenly distribute the fuel flow rate to all the burners. Figure 2 shows a schematic diagram of an installation with 156 burners in four modules. Each module has three lines, each with 13 burners installed. The distance between the centers of adjacent burners was 15 cm. In order to keep the LPG supply pressure constant, a regulator was installed separately for each module. Two modules with a shared fuel supply line are connected to one LPG cylindrical vessel.
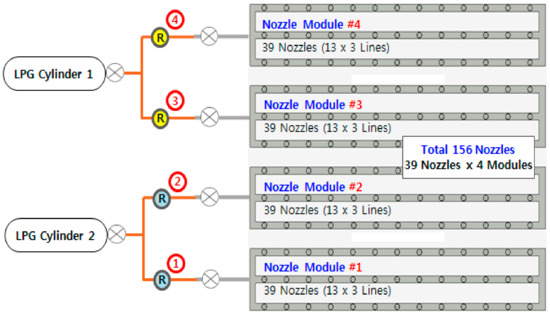
Figure 2.
Schematic diagram of modulated burner installation with LPG supply system; ® means regulators.
Figure 3 shows the temperature measurement locations around the mock-up, an empty cubic metal frame with dimensions of 920 × 605 × 205 mm. Although the actual REESS of xEV has various shapes, it is difficult to consider the shape effects of all kinds of real REESS for the development of the test apparatus. Therefore, experiments were performed using cubic mock-ups assumed to be representative shapes of REESS. K-type thermocouples are installed at more than five positions 25 mm below the bottom of the mock-up, according to the test regulations (Figure 3a). In the case of the prototype test apparatus, six measurement locations were selected to check that the entire bottom surface (T1–T2, T4–T6) and the periphery (T3) of the mock-up were heated uniformly and the temperature was kept constant (Figure 3b).
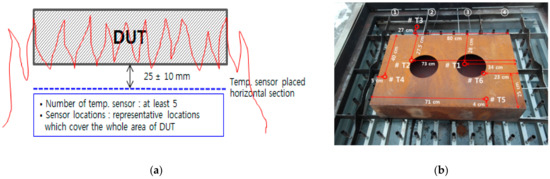
Figure 3.
Vertical and planar positions of temperature measurement in prototype test apparatus: (a) vertical position of temperature measurement; (b) six positions at the horizontal plane in (a).
2.2. Uniformity of Mass Flow Rate in Burners
The flow rate of LPG fuel supplied to the individual burners was analyzed in the fuel supply line of the prototype test apparatus. Taking into account the specifications of the regulator with a rated outlet pressure of 25 kPa, the fuel supply to the individual burners was examined under the condition of a regulator pressure of 20 kPa. Flowmaster (Mentor Graphics, Wilsonville, OR, US), one-dimensional system simulation software, was used to analyze mass flow rate. As input parameters, the ambient temperature, properties of LPG, and shape information such as diameter, length, surface roughness, and curvature of each pipe part were utilized. The domain of the analysis included LPG regulators, hoses, valves, nozzle modules, and individual Bunsen burners. The temperature of LPG at the regulator was set to 1.3 °C, the ambient temperature at the time of the test. Figure 4 shows the modeling geometry to analyze a module with 39 burners using Flowmaster.
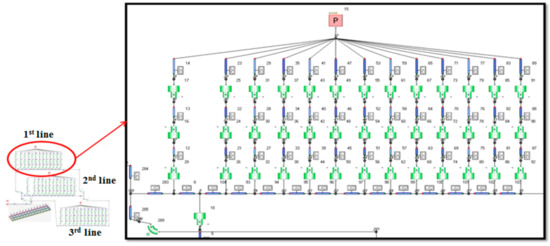
Figure 4.
Modeling geometry of fuel supply system for one module consisting of 39 burners.
The analysis showed that the total mass flow rate of the fuel supplied to one module was about 35 kg/h, with the average fuel flow rate to the individual burners equal to 0.897 kg/h. Figure 5 shows the distribution of the fuel mass flow rate supplied to 39 burners, modeled as in Figure 4. Bunsen burners are numbered 1 to 13 in the 1st line, 14 to 26 in the 2nd line, and 27 to 39 in the 3rd line in Figure 5. The main supply line of LPG was connected between the burners numbered 14 and 15 in the 2nd line, where the amount of fuel flow rate was predicted to be slightly higher. Overall, it was confirmed that the fuel was distributed evenly to the individual burners.
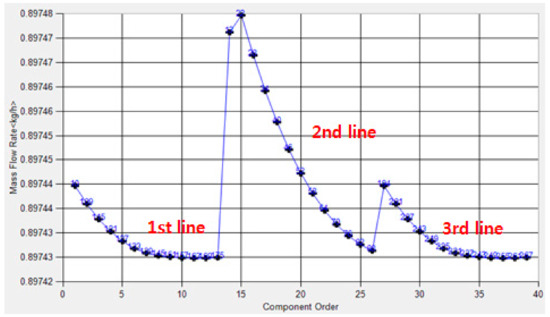
Figure 5.
Distribution of LPG mass flow rate at 39 burners in a module, modeled as in Figure 4.
2.3. Fire Resistance Test of Prototype Test Apparatus
In order to reduce the number of experiments, the pressure regulators of the prototype test apparatus in Figure 2 were divided into two groups with different LPG mass flow rates to figure out the effect of the two fuel flow rates. Modules 1 and 2 in Figure 2 were fed LPG with 35 kg/h per module, and modules 3 and 4 were fed with 50 kg/h per module. Figure 6 shows a photograph of the fire resistance test and temperature data measured at the six locations described in Figure 3. The temperature of T2, T3, and T4, installed in modules 1 and 2 with a fuel mass flow rate of 35 kg/h, did not reach 800‒1100 °C. This means that it could not satisfy the criterion of the fire resistance test for REESS. On the other hand, with a fuel mass flow rate of 50 kg/h, the temperature of T1, T5, and T6 installed in modules 3 and 4, although it briefly dropped below 800 °C, remained within the range of 800‒1100 °C on the whole. In addition, there was an undeniable temperature fluctuation during the 2-min test period after reaching 800 °C. It is confirmed that the prototype apparatus could reach the temperature criterion of 800‒1100 °C by adjusting the LPG mass flow rate, but could not maintain a stable temperature during the direct flame exposure time of REESS.
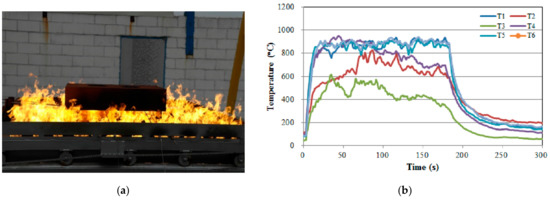
Figure 6.
Experimental results of prototype test apparatus: (a) mock-up installed at the burner zone; (b) temperature profiles at six measurement points.
3. CFD Analysis
3.1. Simulation Method
Numerical analysis was performed using commercial CFD software, ANSYS Fluent [16]. The conservation equations of mass, momentum, energy (enthalpy), and species scalar (mass fraction) for turbulent reacting flow are as follows:
The symbols in Equations (1)–(4) are explained in the Acronyms and Symbols section at the end of the paper. The bar denotes a time-averaged value. The tilde and double prime indicate a Favre averaged value and its fluctuation, respectively (for example, ). There are three unclosed terms, Reynolds stresses () in Equation (2) and sources for enthalpy () and species (), respectively, in Equations (3) and (4).
A realizable - model was applied to close the Reynolds stress term in Equation (2). To treat the source terms in Equations (3) and (4), the eddy dissipation model (EDM) was considered as the turbulence‒chemistry interaction of a turbulent non-premixed flame [17]. The EDM assumes an overall reaction rate proportional to the turbulent mixing rate (). In turbulent non-premixed flames, turbulence slowly mixes the fuel and oxidizer into the reaction zones, where they burn quickly with the net rate of production of species as below:
for the th reaction written in general form as follows:
where the empirical constants and in Equation (5) are 4.0 and 0.5, respectively [16]. Assuming that LPG is composed of propane only, the chemical reaction is analyzed using a two-step heat release mechanism. A standard wall function was used to bridge the viscosity-affected region between the wall and the fully turbulent region. The P1 model was applied for the radiation heat transfer and the weighted-sum-of-gray-gases model was used as the absorption coefficient model of the combustion gases.
For CFD analysis, the volume of the computation domain, 10 m (width) × 10 m (depth) × 4 m (height), was considered as shown in Figure 7. The bottom and all the side surfaces were treated with the wall boundary conditions, and the ceiling with the pressure outlet boundary condition. To find the velocity boundary condition at the outlet of the fuel injection nozzle, the fuel supply line was analyzed using Flowmaster. The average velocity calculated using the fuel mass flow rate supplied to the injection nozzle was applied as the velocity boundary condition at the nozzle outlet. The initial velocity around the test apparatus was set to 0 m/s and natural convection due to the temperature difference from the burning zone was taken into account. The initial ambient temperature was assumed to be 1.3 °C.
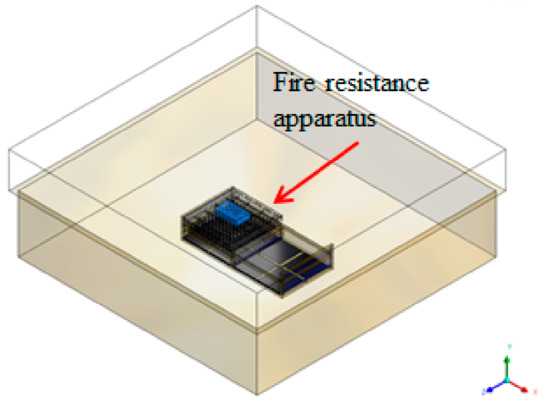
Figure 7.
Volume of computation domain (10 m × 10 m × 4 m) used in CFD.
3.2. Validation on Experimental Results of Prototype Test Apparatus
For the simulation of the prototype apparatus, the grid system was made of approximately 5,342,000 tetrahedral cells. Figure 8 shows an enlarged view of the prototype test apparatus in Figure 7, and its grid used for simulation. Finer meshes were applied to the nozzle exit area of the Bunsen burners to reproduce its geometry.
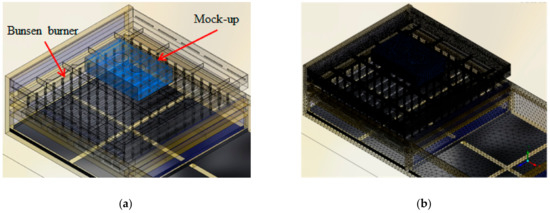
Figure 8.
Geometry of prototype apparatus (a) and its grid system using tetrahedral (b).
The convergence of the simulation cases in the manuscript was carefully checked using the residuals of the main physical variables in Equations (1)–(4) as the basis for determining the steady state solution. The simulation was judged to be converged if the residuals of most variables remained below 10−4 for a sufficient number of iterations, with the residual of energy equation maintained below 10−6. There was little change in the turbulent fields with more iteration after the 2000th step. This means that the simulation cases were considered to be qualitatively converged.
Figure 9a shows the CFD results obtained under the same fuel flow rate conditions as the measurements in Figure 6b. It shows the two-dimensional temperature distribution at the location described in Figure 3a. The number at the top of Figure 9a is the module number in Figure 2. Module 1 is located at the leftmost quarter, and module 4 at the rightmost one. Each module was supplied with a fuel flow rate of 35 kg/h in the left half, and 50 kg/h in the right half. Therefore, the temperature in the right half is higher than that in the left half. The temperatures at positions T1 to T6 by CFD analysis in Figure 9a were predicted to be much higher than those measured in the experiment in Figure 6b. The difference between the measurement and simulation is around 200 °C at T5 and T6. This means that there might be a problem with the fuel supply, or that incomplete combustion occurred in the prototype test apparatus. Since the prototype apparatus was made without a vaporizer, there was a problem with ice in the LPG supply line. In addition, some burners were found to have gaps at the nozzle tips made by spot welding. This means that some portion of the LPG did not pass through the flame region, but rather seemed to exit into the low-temperature region without a complete reaction.
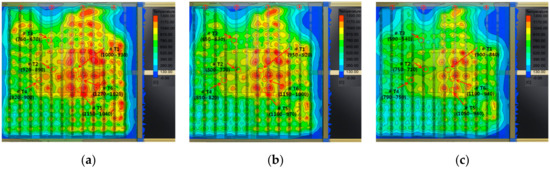
Figure 9.
Simulation results for prototype test apparatus: (a) 35 kg/h LPG supply to modules 1 & 2 and 50 kg/h LPG supply to modules 3 & 4; (b) 15% fuel cut in each module; (c) 30% fuel cut in each module.
In order to find the proper amount of fuel flow rate to match the experimental results in Figure 6b, a CFD analysis was performed with the reduced amount of fuel delivered to each module. Figure 9b,c shows the CFD results with fuel cut down by 15% and 30%, respectively, at the fuel flow rate in Figure 9a. As shown in Table 2, the simulation case with a 30% fuel cut most closely predicts the temperature measured in the experiment. Therefore, in the experiment of Figure 6, the mass flow rate of LPG actually supplied to Bunsen burners is expected to be about 24.6 kg/h per module in the left half and about 35 kg/h per module in the right half. According to the CFD results for the 30% fuel cutoff condition in Table 2, the temperature in the left half showed a downward deviation in the target temperature range of the fire resistance test (800‒1100 °C). On the other hand, the temperature in the right half satisfied the criterion of the temperature range during the 2-min test period. Therefore, the appropriate LPG mass flow rate to meet the test criterion is around 35 kg/h per module.
Table 2.
Comparison of temperature at six points between measurement and CFD.
3.3. Proposals of Test Apparatus
The CFD results of the prototype test apparatus in Figure 9 show that the temperature is too high in the vicinity of the burners. Also, the temperature around the burner in the center area is much higher than that in the outer region. It does not meet the design objective of the test apparatus to make the temperature uniform in the measurement plane. Based on the CFD analysis of the prototype test apparatus, a denser installation of the burners was proposed as the new design element of the test apparatus.
Figure 10 shows two types of test apparatus with a narrow gap between the adjacent burners and an increased number of burners. The two designs, (A) and (B), suggest the installation of 63 and 125 burners per module, respectively. In both cases, four modules were connected to make a test apparatus. The number of burners in the proposed designs (A) and (B) increased 1.6- and 3.2-fold, respectively, compared to the prototype test apparatus.
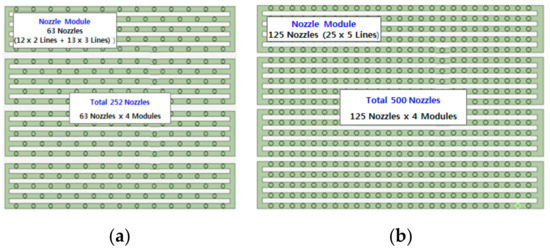
Figure 10.
Shapes of newly proposed test apparatus: (a) new design (A) with total 252 burners in four modules; (b) new design (B) with total 500 burners in four modules.
3.4. Simulation for Newly Proposed Test Apparatuses
Figure 11 shows the temperature distribution obtained by CFD analysis on the two newly proposed test apparatuses. Figure 11a,b shows the results with LPG mass flow rate () of 35 kg/h per module, determined from the information in Table 2. As shown in Figure 11a,b, the two newly proposed test apparatuses have more uniform temperature distribution compared to the prototype apparatus in Figure 9c. Also, as shown in Figure 11b, design (B) with the denser burner installation shows more uniform temperature distribution than design (A). On the other hand, the maximum temperature tends to approach 1100 °C at equal to 35 kg/h per module. In the actual experiment, therefore, the temperature might exceed 1100 °C, the upper limit of the test criterion. In order to prevent the temperature rising above the test criterion, the effect of reduced fuel mass flow rate was investigated. As shown in Figure 11c,d, the overall planar temperature distribution decreased adequately at = 30 kg/h per module. In the case of design (A), the temperature is still close to the upper limit (1100 °C) at the positions just above the burners (Figure 11c). On the other hand, in the case of design (B), the temperature is sufficiently below the upper limit while satisfying the range of the test criterion (800‒1100 °C) as in Figure 11d. Therefore, it is expected that the temperature will not exceed the upper limit in the actual test of proposed design (B) at equal to 30 kg/h per module.
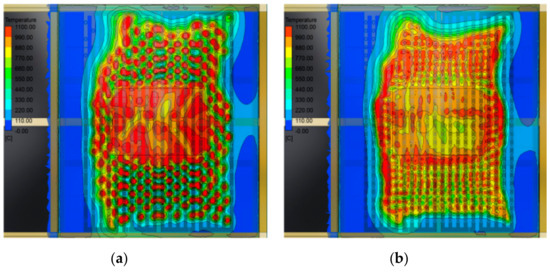
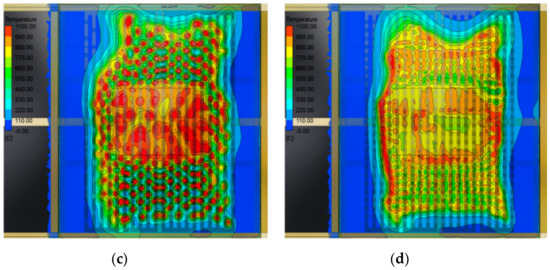
Figure 11.
Temperature distribution at measurement plane (25 ± 10 mm downward from the bottom of mock-up): (a) test apparatus (A) with 35 kg/h; (b) test apparatus (B) with = 35 kg/h; (c) test apparatus (A) with = 30 kg/h; (d) test apparatus (B) with = 30 kg/h.
Figure 12 shows the temperature distributions in the vertical plane at the center of the mock-up that simulates the battery. Figure 12a,b shows the results of the LPG mass flow rate of 35 kg/h per module, while Figure 12c,d shows those of 30 kg/h per module. The temperature under the mock-up of design (B) has a more even spatial distribution than that of design (A). In addition, as shown in Figure 12d, the upper limit of temperature is not exceeded in the vertical plane at the fuel mass flow rate of 30 kg/h, while the temperature criterion of the fire resistance test is satisfied.
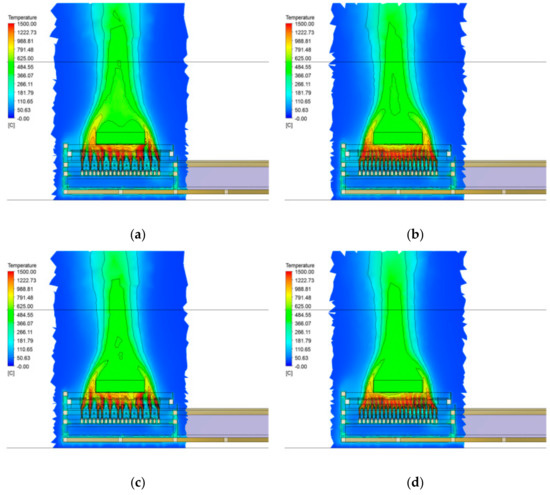
Figure 12.
Temperature distribution at central section of mock-up: (a) test apparatus (A) with = 35 kg/h; (b) test apparatus (B) with = 35 kg/h; (c) test apparatus (A) with = 30 kg/h; (d) test apparatus (B) with = 30 kg/h.
Based on the CFD results in Figure 11 and Figure 12, it is advantageous to adopt design (B) where the number of burners per module is adequate to satisfy the temperature criterion of the fire resistance test. In addition, it is necessary to finely adjust the LPG mass flow rate (35 kg/h per module) drawn from the experiment and simulation of the prototype apparatus in Section 3.2. If the LPG mass flow rate is set to 35 kg/h per module, the local temperature may exceed the upper limit in the actual test according to Table 2 and Figure 11. It was concluded that the selection of the LPG mass flow rate of 30 kg/h per module could achieve a uniform temperature distribution in the measurement plane without exceeding the upper temperature limit.
4. Experiment on the Finally Selected Test Apparatus
The final test apparatus was determined considering the problems found in the prototype apparatus and the CFD analysis on the newly proposed designs. First, a storage tank (1 ton) equipped with a vaporizer was installed to supply a large amount of LPG without ice formation (Figure 13a). In order to adjust the flow rate more precisely than the pressure regulator, the LPG flow rate control system was applied with both a mass flow meter and a proportional control valve (Figure 13b) [18]. As considered in design (B), the center-to-center distance between the neighboring burners was set to 75 mm for a dense arrangement (Figure 13c). Considering that the size of the xEV battery tended to increase in capacity, it was necessary to enlarge the burner zone. By adding one module to design (B), a burner zone consisting of five modules with a total of 625 burners was manufactured (Figure 13d).
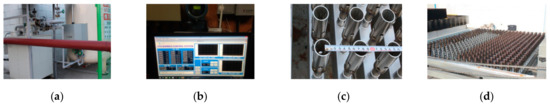
Figure 13.
Components of final test apparatus: (a) LPG storage tank & vaporizer; (b) LPG flow rate control system; (c) burners with spacing 75 mm (center to center); (d) burner zone with 625 nozzles in five modules.
In order to consider the size effects of REESS, three mock-ups made of steel with a thickness of 3mm were prepared as shown in Figure 14. The dimensions of the large, medium, and small sizes are 1000 × 1000 × 200 mm (floor area 1 m2), 920 × 605 × 206 mm (floor area 0.56 m2) and 300 × 200 × 300 mm (floor area 0.06 m2), respectively. The floor area of the large mock-up is about 17 times that of the small one. Five typical temperature measurement locations of each mock-up were selected as shown in Figure 14. K-type thermocouples were installed 25 mm below the mock-up floor.
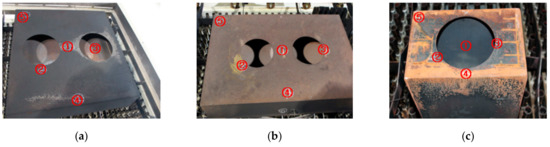
Figure 14.
Shape of mock-ups and their temperature measurement points: (a) large mock-up; (b) medium-sized mock-up; (c) small mock-up.
Figure 15 shows the results of the fire resistance test on the three mock-ups in the final apparatus. The fuel flow rate was controlled at 30 kg/h per module, consisting of 125 nozzles, as determined in Section 3.4. According to the measurements, the average temperatures of the large, medium, and small mock-ups for 2 min were 881 °C, 878 °C, and 877 °C, respectively. In the same order, the maximum temperatures were 955 °C, 940 °C, and 980 °C, respectively, and did not exceed the upper temperature limit (1100 °C) of the test criterion. The temperature reached 800 °C within 30 s at all measurement positions, and remained nearly constant during the test period (2 min), as shown in Figure 15. Compared with the experiment results using the prototype test apparatus in Figure 6b, the range of temperature fluctuation is much narrower. The reason for the relatively large temperature fluctuation in the small mock-up is that the turbulent flames of the Bunsen burner move more freely due to the small floor area of the mock-up, as shown in the photograph in Figure 15c. Nevertheless, the temperatures at all the measurement locations of the small mock-up were kept more stable than the measurement results in Figure 6b. This confirms that the final design of the test apparatus meets the temperature criterion of the fire resistance test for REESS in xEV.
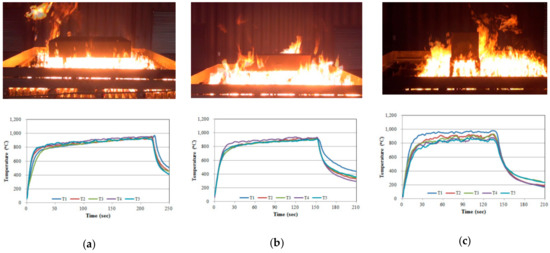
Figure 15.
Experimental results of final test apparatus: (a) large mock-up; (b) medium-sized mock-up; (c) small mock-up.
5. Conclusions
In this study, an experimental apparatus was developed with LPG Bunsen burners to meet the criterion of the fire resistance test for the REESS of xEV. As the first step, a prototype test apparatus was built and initial experiments were performed. The number of tests was reduced by supplying different LPG mass flow rates to each divided module region of the prototype test apparatus. The fuel loss caused by the fuel supply system was analyzed by comparing the initial experimental results with the CFD analysis.
In order to meet the criterion of the fire resistance test, two kinds of apparatus designs were proposed and CFD was applied to predict their performance. Based on the CFD analysis on the effects of the number of Bunsen burners, its arrangement and fuel mass flow rate, the layout of burner installation and the fuel flow rate that could reliably meet the temperature criterion of the fire resistance test were determined. In addition, the final test apparatus was equipped with a LPG mass flow rate control system.
Fire resistance tests were performed on three mock-ups at the LPG mass flow rate of 30 kg/h per module, determined from CFD analysis. Five locations were selected for temperature measurements in all the mock-ups. The temperature data at all points remained stable, showing narrow fluctuations within the allowed temperature range (800‒1100 °C) during the 2-min test period.
The final design of the apparatus meets the temperature criterion of the fire resistance test of GTR. Finally, the test method using the LPG Bunsen burner in the present study was included in GTR No. 20 for electrical vehicle safety, released by the UN in March 2018 after the six-year discussion of the informal working group [19].
Acronyms and Symbols
| CFD | Computational fluid dynamics |
| DUT | Device under test |
| EDM | Eddy dissipation model |
| EVS | Electric vehicle safety |
| GTR | Global technical regulation |
| IWG | Informal working group |
| KMVSS | Korea Motor Vehicle Safety Standard |
| LPG | Liquefied petroleum gas |
| REESS | Rechargeable energy storage system |
| UN | United Nations |
| WSGGM | Weighted-sum-of-gray-gases model |
| xEV | All types of electrical vehicles |
| , | Empirical constants of EDM |
| Effective mass diffusion coefficient | |
| Enthalpy | |
| Symbol denoting species n | |
| Molecular weight of product | |
| Molecular weight of the leanest reactant | |
| Static pressure | |
| Volumetric heat source by chemical reaction | |
| Production rate of species by chemical reaction | |
| , , | Velocity in , , and direction, respectively |
| , , | Spatial coordinate in , , and direction, respectively |
| Mass fraction of species | |
| Mass fraction of product | |
| Mass fraction of the leanest reactant | |
| Effective thermal diffusion coefficient | |
| Dirac delta function | |
| Turbulent dissipation rate | |
| Turbulent kinetic energy | |
| Viscosity | |
| Stoichiometric coefficient for reactant | |
| Stoichiometric coefficient for product | |
| Density |
Author Contributions
H.J. and B.M. performed the experiments. H.J. did the CFD simulation. G.G.L. analyzed and validated the data. H.J. and G.G.L. contributed to the paper writing. All authors have read and agreed to the published version of the manuscript.
Funding
This research was supported by the World Harmonization Program for Motor Vehicle Safety Standard, funded by the Ministry of Land, Infrastructure and Transport, Republic of Korea.
Conflicts of Interest
The authors declare no conflict of interest.
References
- Harighi, T.; Bayindir, R.; Padmanaban, S.; Mihet-Popa, L.; Hossain, E. An overview of energy scenarios, storage systems and the infrastructure for vehicle-to-grid technology. Energies 2018, 11, 2174. [Google Scholar] [CrossRef]
- Mihet-Popa, L.; Saponara, S. Toward green vehicles digitalization for the next generation of connected and electrified transport systems. Energies 2018, 11, 3124. [Google Scholar] [CrossRef]
- Un-Noor, F.; Padmanaban, S.; Mihet-Popa, L.; Mollah, M.N.; Hossain, E. A comprehensive study of key electric vehicle (EV) components, technologies, challenges, impacts, and future direction of development. Energies 2017, 10, 1217. [Google Scholar] [CrossRef]
- UNECE. Proposal of Fire Resistance Test. EVS-02-07e. 2012. Available online: https://wiki.unece.org/display/trans/EVS+2nd+session (accessed on 16 September 2019).
- UNECE. Progress Report of TFG 7-Fire Resistance Test. EVS-05-17e. 2014. Available online: https://wiki.unece.org/display/trans/EVS+5th+session (accessed on 16 September 2019).
- UNECE. Korea Research Results-Fire Resistance Test. EVS-06-26e. 2014. Available online: https://wiki.unece.org/display/trans/EVS+6th+session (accessed on 16 September 2019).
- UNECE. Korea Research Results-Fire Resistance Test. EVS TF-02-24e. 2015. Available online: https://wiki.unece.org/display/trans/2nd+EVS+Task+Force+meetings+in+Paris (accessed on 16 September 2019).
- UNECE. Korea Research Results-Fire Resistance Test.EVS TF-03-28e. 2015. Available online: https://wiki.unece.org/pages/viewpage.action?pageId=25270993 (accessed on 16 September 2019).
- Miao, Y.; Hynan, P.; Jouanne, A.; Yokochi, A. Current Li-ion battery technologies in electric vehicles and opportunities for advancements. Energies 2019, 12, 1074. [Google Scholar] [CrossRef]
- Hong, J.; Wang, Z.; Liu, P. Big-data-based thermal runaway prognosis of battery systems for electric vehicles. Energies 2017, 10, 919. [Google Scholar] [CrossRef]
- Plug-in Electric Vehicle Fire Incidents. Available online: https://en.wikipedia.org/wiki/Plug-in_electric_vehicle_fire_incidents (accessed on 8 January 2020).
- Jung, H.; Kim, K.; Lee, K.; Kwon, H. A Study on fire resistance test procedure for traction battery. In Proceedings of the 23rd International Conference of Enhanced Safety Vehicles, Seoul, Korea, 27–30 May 2013. Paper No. 13-0353. [Google Scholar]
- KMVSS, Traction Battery; Ministry of Land, Infrastructure and Transport: Sejong, Korea, 2018; Article No. 18-3.
- KMVSS Test Procedure, Traction Battery Safety Test; Ministry of Land, Infrastructure and Transport: Sejong, Korea, 2019; Annex 1—Part No. 48.
- UN/ECE/TRANS/180/Add13. Global Technical Regulation on Hydrogen and Fuel Cell Vehicles; United Nations: Geneva, Switzerland, 2013; GTR No.13; pp. 80–84. [Google Scholar]
- ANSYS Inc. Ansys Fluent Theory Guide; ANSYS Inc.: Canonsburg, PA, USA, 2013. [Google Scholar]
- Magnussen, B.F.; Hjertager, B.H. On mathematical models of turbulent combustion with special emphasis on soot formation and combustion. Proc. Combust. Inst. 1977, 16, 719–729. [Google Scholar] [CrossRef]
- Moon, B. A Study on Equivalence of Thermal Energy at Domestic and International Fire Resistance Test Standards for REESS. Master’s Thesis, Ajou University, Suwon, South Korea, July 2017. [Google Scholar]
- UN/ECE/TRANS/180/Add20. Global Technical Regulation on the Electric Vehicle Safety; United Nations: Geneva, Switzerland, 2018; GTR No. 20; pp. 98–102. [Google Scholar]


© 2020 by the authors. Licensee MDPI, Basel, Switzerland. This article is an open access article distributed under the terms and conditions of the Creative Commons Attribution (CC BY) license (http://creativecommons.org/licenses/by/4.0/).