Abstract
Greenhouse gases such as carbon dioxide and methane cause global warming and consequently climate change. Great efforts are being made to reduce greenhouse gas emissions with the objective of addressing this problem, hence the popularity of technologies conductive to reducing greenhouse gas emissions. CO2 emissions can be reduced by improving the thermal efficiency of combustion engines, for example, by using cogeneration systems. Coal mine methane (CMM) emerges due to mining activities as methane released from the coal and surrounding rock strata. The amount of methane produced is primarily influenced by the productivity of the coal mine and the gassiness of the coal seam. The gassiness of the formation around the coal seam and geological conditions are also important. Methane can be extracted to the surface using methane drainage installations and along with ventilation air. The large amounts of methane captured by methane drainage installations can be used for energy production. This article presents a quarterly summary of the hourly values of methane capture, its concentration in the methane–air mixture, and electricity production in the cogeneration system for electricity and heat production. On this basis, neural network models have been proposed in order to predict electricity production based on known values of methane capture, its concentration, pressure, and parameters determining the time and day of the week. A prediction model has been established on the basis of a multilayer perceptron network (MLP).
1. Introduction
The history of hard coal mining in Poland goes back to the end of the 18th century. At that time, first mines were opened in the Upper Silesian Basin. It is a region rich in hard coal deposits, where its mining continues to this day. Until the mid-20th century, coal was mined from non-methane deposits. There are known cases when, after encountering a methane hazard, further mining (or even construction of mines) was abandoned. Due to its explosiveness, methane accompanying hard coal mining in mines poses a serious threat to the safety of mining crews and production of mining plants. The detailed characteristics of the existing methane deposits and the description of parameters influencing its secretion can be found in this article [1]. Methods for safe coal mining and simultaneous methane emission reduction are being sought all over the world. The relationships between coal production, methane emission, methane drainage, and utilisation are analysed so that both coal mining and methane extraction are possible at the same time (co-exploitation) [2]. The problem with methane emission to the atmosphere and with the use of this gas concerns closed mines as well [3]. In mines, the basic methods of controlling methane hazard include ventilation of mine workings and methane drainage from coal seams. Methane from coal seams in mines—coal mine methane (CMM)—is extracted to the surface using ventilation of underground excavations and installations used for methane drainage [4,5].
According to a previous study [6], the potential to create a greenhouse effect due to methane is estimated to be 28–34 times higher than for carbon dioxide. Additionally, recent studies [7] may indicate that methane emission due to industrial use of fossil fuels is much higher than previously estimated. Regardless of the division into sources of emission, the concentrations of atmospheric methane are ever-increasing and, according to the data as of February 2020, is 1873.7 ppb (CH4 mole fraction) against 1864.9 ppb in February 2019 and 1625.9 ppb in July 1983—the beginning of measurements [8]. It follows that methane is the most important greenhouse gas (GHG) in the atmosphere except for CO2 (non-CO2 GHG) [9]. Its atmospheric lifetime is relatively short (approximately 9–15 years [10]), but it is responsible for about 14% of the total GHG emission [11]. Of the three main greenhouse gases (CO2, CH4, and N2O), from the time of rapid development of industrial activity (since 1750), the greatest percentage increase in concentrations in the atmosphere has been observed in methane [12].
In 2019 in Poland, the annual coal extraction from hard coal seams was 61.6 million Mg, with approximately 80% of production coming from coal seams containing methane [13]. Figure 1 shows how the total emission of methane into the atmosphere is formed and (broken down into methane) removed by the mine’s ventilation system (ventilation air methane—VAM) and by the installations used for methane drainage (coal mine methane—CMM) in the Polish hard coal mining industry in the last 13 years.
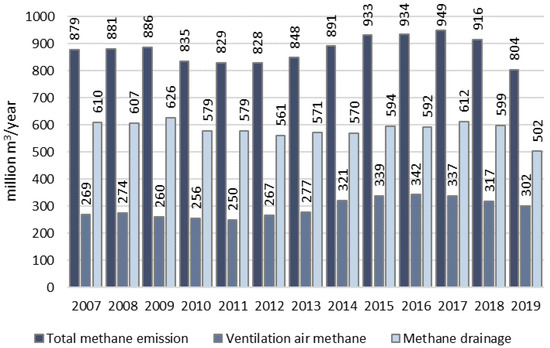
Figure 1.
Methane emissions into the atmosphere—total, with ventilation air (VAM) and captured by coal mine methane (CMM) drainage—in Polish hard coal mining in the years 2007–2019 [13].
As the concentrations of methane from the installations used for methane drainage most often exceed 40%, this gas can be used as a low-methane fuel in various types of heat and power installations, e.g., in boilers with gas burners, engines, and gas turbines. In Poland, low-methane gas is used as fuel in many power installations, e.g., in Jastrzębska Spółka Węglowa S.A. (JSW S.A.). Nevertheless, the total rate of economic use of methane captured by methane drainage from coal seams of Polish mines remains at the level 50%.
Drained methane, depending on its quality and volume flow, can be used in various ways. The methods of methane utilisation are described in detail in numerous articles, e.g., [4,14,15,16]. The basic methods of methane utilisation include
- power generation in gas engines or turbines;
- fuel used in ovens, boilers and burners;
- VAM oxidation processes;
- injection into gas pipelines;
- vehicle fuel;
- production of fertilizers;
- flaring.
Combustion of captured methane is the simplest method to reduce CH4 emissions. The result is CO2 and water. In this case, CO2 emissions are less hazardous to the environment than CH4 emissions. Direct methane combustion should only be used when there is no other option or in case of a failure. The problem with using VAM is mainly related to low methane concentrations at very high airflows. The limitation of most technologies is methane concentration at the level of 0.5% [17]. The methods of VAM utilisation are described in numerous articles, e.g., references [12,18,19,20]. The injection of captured methane directly into natural gas pipelines is a very costly solution due to the high purity and, above all, concentration requirements. By far the most developed method of methane utilisation is conversion to electricity and heat. The database of projects concerning the methane use, developed by the US Environmental Protection Agency (US EPA) [21], contains a list of over 200 projects. More than half of installations concerns the electricity generation, directly and in cogeneration with heat (Figure 2).
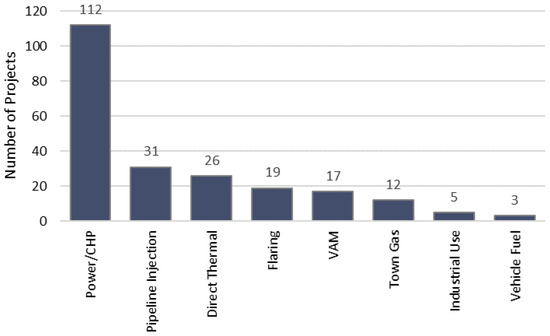
Figure 2.
Coal mine methane projects list [21].
The distribution of projects using drained methane differs in Poland. In 2019, using methane drainage, 340 million cubic metres of methane was obtained, out of which around 200 million cubic metres (58.8%) was used as fuel. Almost half of the methane captured (47%) (Figure 3) was used as fuel in gas burners in gas-fired boilers. This is due to the relatively low cost of such a solution compared to other options. Twenty-five percent of methane was burnt in gas engines to generate electricity and heat.
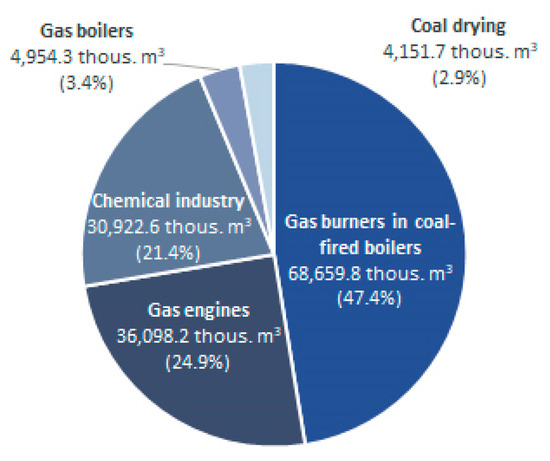
Figure 3.
Use of drained methane in Polish coal mines.
Methods of drained methane utilisation in one of the coal companies in Poland—JSW S.A.—and recorded gas parameters are shown in Figure 4. Captured methane is used both for own needs of individual mines (e.g., hot-water boilers, dryers) and, above all, to generate power and/or heat in gas engines. The 2017 detailed data on the use of drained methane in JSW S.A. have been presented in Table 1. A total of 103,648.8 thousand cubic metres of drained methane was used, and more than half (55%) was used in gas engines—57,248.8 thousand cubic metres. The percentage share of methane use in individual mines is notable. It ranges from 95% (Zofiówka coal mine, Zofiówka section), through 92% (Pniówek coal mine), and 91% (Borynia coal mine, Borynia section) to 59% (Budryk coal mine). On average, JSW S.A. uses 79% of captured methane. More than 27 thousand cubic metres remain to be used.
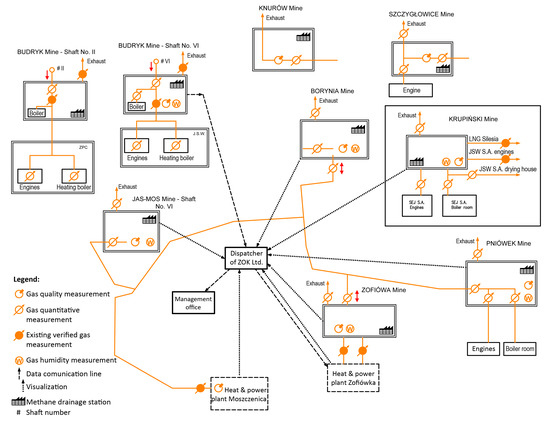
Figure 4.
A diagram of distribution and methods of methane utilisation in Jastrzębska Spółka Węglowa S.A. (JSW S.A.).

Table 1.
The use of captured methane in JSW S.A. in 2017 [22].
In order to increase the efficiency of drained gas use, the composition of the methane–air mixture used in power and heat installations should be stable [23]. The stabilisation of the quantitative and qualitative parameters of drained gas can be obtained as a result of
- controlling and regulating the process of methane drainage from coal seams in the mine;
- the use of installations for stabilisation, such as underground tanks for storing drained gas and surface gas tanks;
- supplying high-methane gas from an external source;
- removal of inert gases from the methane–air mixture (mine gas purification).
2. Materials and Methods
2.1. Case Study
The subject of this study is the system of methane capture in Pniówek mine belonging to the area of the Upper Silesian Coal Basin (southern Poland). The main element of the methane drainage system installation is the methane drainage station whose task is to create a vacuum pressure in the pipeline network of the firedamp drainage system installation and to transport the captured gas from installations for methane utilisation. In general, the methane drainage station includes the suction-side installation, vacuum generators, pressure-side installation, gas-cooling installation, control and safety devices, and measurement and control equipment. In the suction-side installation, there is an exhaust stack which enables gas to be discharged to the atmosphere under deposit pressure when the methane drainage station is stopped. Detonation flame arresters, protecting the drainage station’s equipment against the effects of a methane explosion in the pipelines connecting the station with the mine, are mounted in the installation.
The negative pressure produced by one unit is controlled by changing the speed of the motor driving the blower. That adjustment is made by means of frequency converters controlled by a computer system from the measuring room. Thanks to this solution, depression in the suction pipeline can be automatically kept at a given level. Four blower units with DR 1600T type compressors were installed in Pniówek hard coal mine, for example. Basic operating parameters of the drainage station are shown in Table 2.
Table 2.
Operating parameters of the drainage station located in the Pniówek coal mine.
In the methane drainage station of the Pniówek coal mine, the methane mixture is pumped at various pressures to three consumers (Figure 5). In order to achieve proper parameters, two compression stages are used. From the intake manifold, gas is sucked in through a system of three first-stage blowers (the fourth one serves as a backup); after compression (up to approximately 0.02 MPa), the gas is directed to a heat exchanger, and from there, through a check valve, to the discharge manifold. A portion of the gas from the 1st compression stage discharge manifold flows through the flow measurement system to the gas engines driving the generators, while the remaining part of the captured gas is sucked in by the second compression-stage blower system. This system consists of two blower units with DR 1200T type compressors. They increase the gas pressure to 0.08 MPa. After compression, the gas is fed through the heat exchanger and non-return valve into the discharge manifold of the second compression stage, from which it flows through two separate flow measurement systems to the heat plant of the Pniówek coal mine and into the network of transmission pipelines. The amount of gas captured for the consumers’ needs is regulated by adjusting the speed of motors of first- and second-stage blowers synchronized with each other. In an emergency situation, i.e., no gas offtake by consumers, the system of relief valves through deflagration flame arresters and exhaust stacks directs the gas to the atmosphere. The system of relief valves is installed on both first and second compression stage manifolds. Such a solution ensures that the pressure and volume flow required by the consumer are automatically kept constant.
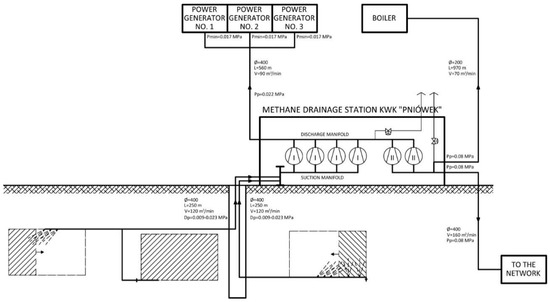
Figure 5.
Methane drainage system installation located in the Pniówek coal mine.
The methane drainage station functions fully automatically. A stable pressure of gas sent to consumers is obtained, and all impurities in the form of dust, water, or oil and water condensate are removed. The prepared methane–air mixture can be used to produce electricity and heat. Figure 6a shows a blower used to create depression based on a Polish Roots-type gas compressor. The methane drainage station with cogeneration of electricity and heat is shown in Figure 6c.
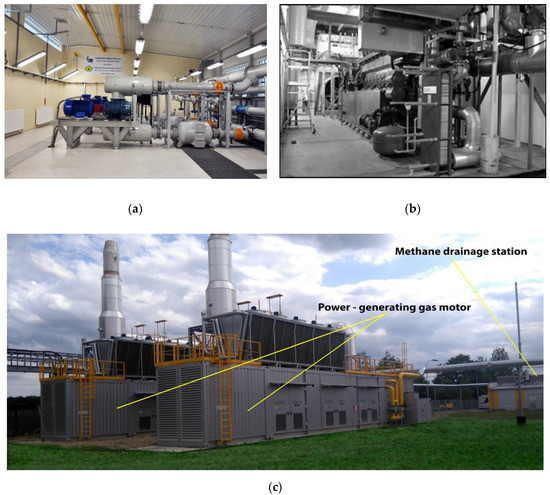
Figure 6.
Methane drainage system installation (a) Roots-type blower; (b) combined power and cooling system installation located in the Pniówek coal mine [25]; (c) Drainage station with a cogeneration system of power and heat generation.
The Pniówek coal mine has a trigeneration power and cooling system based on gas engines and electricity generators as well as absorption and compressor refrigerators with a cooling capacity of 10 MW. It is a central air conditioning system launched in 2000 [24]. Gas engines using methane captured from methane drainage produce heat, which is used for transformation in absorption refrigerators. A fragment of the combined power and cooling system installation located in the Pniówek coal mine is shown in Figure 6b.
The basic parameters of the power and cooling system located in the Pniówek coal mine are
- two Deutz TBG 632 V16 gas engines;
- two absorption refrigerators with a cooling capacity of 4700 kW;
- two compression refrigerators with a cooling capacity of 3200 kW;
- fuel: gas captured from methane drainage in Pniówek coal mine: volume flow rate approximately 50 m3/min, methane concentration approximately 50%;
- system electric power: 6.4 MW;
- system thermal power: 7.4 MW;
- system cooling capacity: 7.9 MW.
2.2. Measuring System
The combined power and cooling system located in the Pniówek coal mine is equipped with a measuring system that enables the analysis of parameters of gas captured from methane drainage and the volume of electricity production. Detailed information about the measured values is presented in Table 3.
Table 3.
Parameters of the air-methane mixture measured in the Pniówek coal mine [25].
The location of measurement points in the power and cooling system in the Pniówek coal mine is shown in a simplified block diagram (Figure 7).
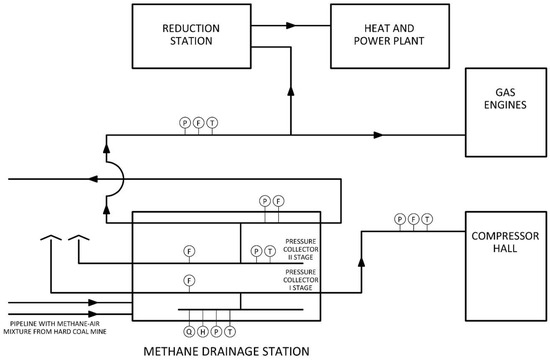
Figure 7.
The Pniówek coal mine methane utilization measuring system: T—gas temperature measurement; H—gas humidity measurement; P—gas pressure measurement; F—gas flowrate measurement; Q—gas quality measurement [23].
Six parameters, whose impact on electricity production was verified, were used for the purposes of the analysis. The variables were divided into two groups: time variables, determining the day of the week and time of measurement, and parameters describing the air-methane mixture. The parameters are presented in Table 4.
Table 4.
Identified variables.
The analysis was carried out on the basis of the values of the above-mentioned parameters from a period of three months, from 1 January to 31 March 2017. Due to different sampling period of variables, hourly averages of each parameter were used for the analysis. In total, the analysis included 2161 samples of the indicated research period.
2.3. Measuring Methodology
2.3.1. Neural Networks
Information processing systems, whose operating pattern is based on observations of the human brain and neural networks, are referred to as artificial neural networks (ANNs). An ANN consists of many interconnected elements—neurons. There are many types of neural networks, which are different in terms of structure, mode of operation, and degree of advancement. The models can be divided into two categories: feedforward networks and recurrent networks. In the former, neurons are grouped into layers. The signal travels from the input layer through successive connections to the output layer. Neurons of one layer are connected to neurons of another layer. But there is no connection between neurons of the same layer. Feedforward networks include multilayer perceptron (MLP), the cerebellar model articulation control (CMAC) network, and the learning vector quantization (LVQ) network.
In recurrent networks, the output signal of some neurons is coupled back to the same neurons or to neurons of preceding layers. This means that the signal travels both forward and backward. There are also two main types of learning: supervised and unsupervised learning algorithms. In addition, a third type can also be distinguished: reinforcement learning, which is considered to be a specific variety of supervised learning. The operation of the neural network is strongly dependent on the activation function in use, the task of which is to transform the signal taking into account the weight of a given connection. Some popular functions in use include linear, threshold, sigmoid, hyperbolic tangent, and radial basis function [26].
For the purposes of this article, a widely popular multilayer perceptron (MLP) model, including an error backpropagation algorithm, was used. An MLP network consists of an input and output layer and at least one hidden neural layer. The flow of information in the network starts in the input layer, passes through the intermediate layers, and ends with the output neural layer. Due to the use of the backpropagation algorithm, the model can be used in the network learning process. The MLP method is applied in many areas, including time series forecasting, system optimization, and pattern recognition. The backpropagation algorithm is a supervised learning process, which compares the obtained results and actual values, and makes it possible to adjust the weights and thresholds of all neurons. An example of an MLP network, with the connection weights marked for the first neurons from each layer, is shown in Figure 8. The parameter indicates the synaptic weight connecting the j-th neuron of one layer to the i-th neuron of another layer, where m indicates successive groups of connections (m = 1 for connections between the first and the second layer, and m = 2 indicates connections between the second and the third layer, etc.) [27].
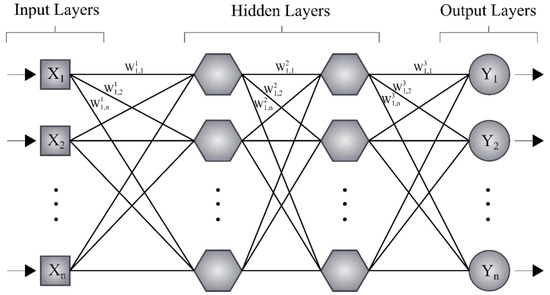
Figure 8.
Example of an multilayer perceptron (MLP) neural network structure.
On the basis of collected data, neural network models were prepared using the Statistica artificial neural network package (Statitsica 13, StatSoft, Tulsa, OK, USA) [28]. The activation function and the number of hidden layers were selected by means of statistical tests using the least squares method. In this study, four selected activation functions—linear, hyperbolic tangent, logistic, and exponential—were examined. In order to find the optimum number of hidden neurons, various numbers of neurons from 20 to 500 were used in the models. The various combination of activation functions and numbers of hidden neurons as described above were tested. The Broyden-Fletcher-Goldfarb-Shanno (BFGS) algorithm was used for the purposes of this article. The data were divided into three sets: training (70%), test (15%), and validation (15%) samples. This article presents five selected neural networks which were characterized by the best correlation coefficients.
2.3.2. Evaluation of the Model
Four fit indices were used to verify the accuracy of the presented models, namely the correlation coefficient (r), the mean absolute error (MAE), root mean squared error (RMSE), and mean absolute percentage error (MAPE). The values of the indices were calculated according to the following formulae:
where is the covariance, means the standard deviation, is the entire number of observations, denotes the actual value, and represents the predicted value.
3. Results
3.1. Preliminary Analysis of the Collected Data
Based on the results from a methane drainage station, an analysis of gas captured from methane drainage in the research period was carried out. The first stage was the statistical analysis of the collected data, including looking for any correlation between data. Figure 9 shows the changes in electricity production, the mixture and methane capture, and concentration of methane in the methane–air mixture in the first quarter of 2017.
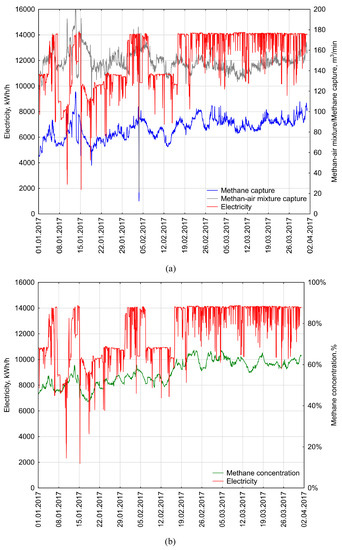
Figure 9.
The course of variables in the analysed period. (a) Electricity production, clean methane, and methane–air mixture capture; (b) electricity production and methane concentration in the mixture.
The energy production marked in red on the figure varies from 2000 kWh/h to over 14,000 kWh/h. The coverage of pure methane in this period varies from 10 to 120 m3/min, while the concentration of methane is the most stable of the presented parameters and varies from 41% to 67%. Detailed statistical data on all variables included in the analysis are presented in Table 5.
Table 5.
Descriptive statistics for input and output variables.
An important aspect of the analysis was the total methane capture and the amount of electricity that was produced in the context of reducing direct methane emissions to the atmosphere. As mentioned at the beginning of the article, methane is characterized by a high GWP, hence its capture is particularly important, and the production of electricity is an additional benefit. Figure 10 shows the variability of the methane capture and electricity production in the analysed period, both in a daily and monthly cycle.
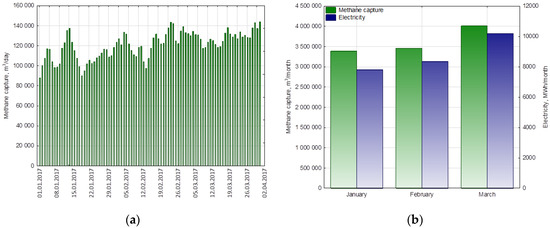
Figure 10.
Variability of methane capture in the analysed period (a) in a daily cycle and (b) in a monthly cycle, taking into account electricity production.
The monthly methane capture in the first quarter of 2017 varies from 3,384,315 m3 to 4,009,869 m3 per month, which translates into electricity production from 7790 MWh to 10,190 MWh per month. The emission of methane in this amount corresponds to approx. 66,700–79,035 tonnes of CO2eq, assuming a GWP equal to 30. As a result of methane combustion, more carbon dioxide is released into the atmosphere than the methane supplied to the process. For every tonne of methane burned, 2.75 tonnes of carbon dioxide are emitted. Due to the much lower greenhouse effect of this gas, despite the higher emissions, this process has a much lower environmental impact compared to the emission of pure methane. With such a significant emission of methane to the atmosphere during extraction, methane combustion plays a key role in reducing the greenhouse effect.
The next step in the statistical analysis of the collected data was to determine the relationship between electricity production and selected parameters. For this purpose, the dependence of electric energy on methane concentration and pure methane capture were presented, where the independent variables were divided into specific value ranges. Figure 11 presents the described dependencies in the form of box plots and also contains a surface chart showing the dependence of electricity production as a function of methane concentration and pure methane consumption in the analysed period.
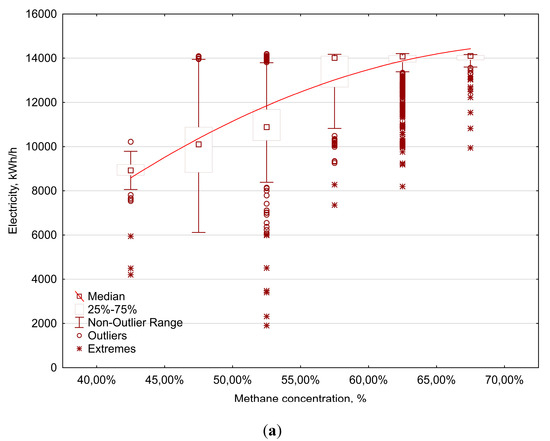
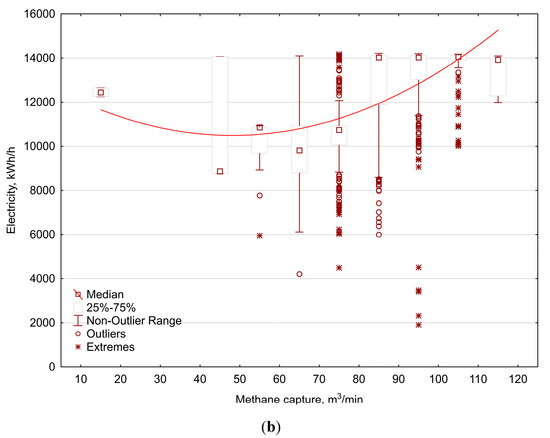
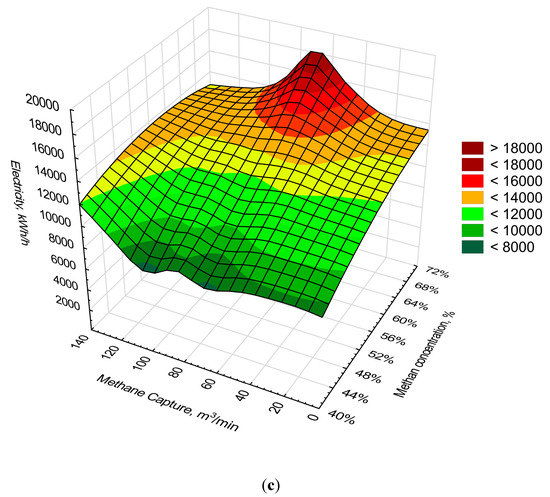
Figure 11.
Dependence of electricity production in the function (a) methane concentration, (b) methane capture, and (c) methane capture and methane concentration.
Electricity production depends on many factors, therefore, for further analysis, a correlation matrix was used that shows relations between both the sought value and the identified parameters, and between individual variables. The matrix is presented in Table 6.
Table 6.
Descriptive statistics for input and output variables.
On the basis of the correlation analysis, it was noticed that the parameter characterizing the methane-air mixture and the time of measurement showed the lowest impact on energy production. For further analysis, all factors were adopted, except for the mixture capture, due to the partial inclusion of this value in the parameter describing the concentration of methane in the mixture, which shows a much higher correlation coefficient. In summary, the predictive model was built on the basis of five variables: one qualitative parameter (day of the week) and four quantitative parameters (hour, pressure, methane capture, and methane concentration).
3.2. Neural Network Models
In this section, models with the best fit according to the correlation coefficient are presented. During the preparation of the models, the number of hidden neurons varied from 5 to 500. The research also considered the different activation functions of both the input and output layers. The error function was chosen as the sum of the squares. Five networks were selected that showed the best model fit in each of the following groups: the training, test, and validation groups. Detailed data on the network are presented in Table 7.
Table 7.
Network configurations tested.
3.3. Prediction Results—Evaluation
Based on the evaluation factors described above, the selected networks were compared with each other. The results are shown in Table 8.
Table 8.
Performance evaluation of proposed models.
As one can see, the best results were achieved by the MLP 4 model, which has a correlation coefficient of 0.94, an average error of 441.58 kWh/h, which translates into an average error percentage of 4%.
Based on the proposed models, Table 9 compares the sensitivity analysis. As can be seen, despite the initially low values of the correlation coefficients for the hour of observation, the sensitivity coefficient is noticeably high for each of the models. Each of the models showed the greatest sensitivity in terms of methane concentration, which indicates the importance of this parameter.
Table 9.
Sensitivity analysis of inputs.
Due to the best results of the above-mentioned MLP 4 network, further analysis of the results was performed for this model only. Based on the obtained values, predicted according to the model, relationship between the actual and predicted values is presented, and the values as a function of time are compared in Figure 12. As one can see, the biggest problem in the presented model are the extreme values that are the worst mapped by the proposed model.
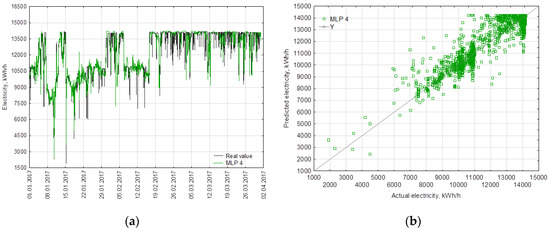
Figure 12.
Results of the MLP 4 best-fit prediction model. (a) Comparison of actual and predicted results over the period under review; (b) the accuracy of the match between predicted and actual values.
4. Discussion
The article discusses issues related to the capture of methane from hard coal mine on the example of the Pniówek mine in Poland. The analysis includes the study of methane capture and electricity production from mine’s firedamp drainage system. The study takes into account both the environmental impact and the economic justification for such solution. Monthly methane capture from the analysed firedamp drainage installation in the analysed period ranges from 3,384,315 m3 to 4,009,869 m3, which corresponds to monthly electricity production from 7790 MWh to 10,190 MWh. Taking into account the high GWP coefficient of methane, such methane emission as CO2 equivalent amounts to approx. 66,700–79,035 tonnes of CO2eq. Analysing the electricity production with the use of such amount of methane and assuming the calorific value of hard coal at the level of 30 MJ/kg and 100% boiler efficiency, the monthly methane capture in the analysed period corresponds to the production of electricity which would be possible with the combustion of 960 tonnes to 1270 tonnes of hard coal. As mentioned above, as a result of methane combustion, carbon dioxide is released into the atmosphere, the amount of which is 2.75 times the amount of fuel supplied. Based on the results obtained for March, the amount of methane captured that was subsequently combusted was 4,009,869 m3, which corresponds to 79,035 t CO2eq. When methane is combusted, 7245 t of CO2 is released into the atmosphere, which means a reduction in emissions expressed in CO2 units by over 90%.
Considering the energy consumption of the mining industry and the costs associated with electricity consumption during operation, proper management of energy resources is essential to maintain the profitability of mining. Currently, the share of electricity costs ensuring safe conditions for underground work in hard coal mines is significant. Therefore, the energy efficiency of underground hard coal mining depends, inter alia, on the electricity cost of the main technological processes. An important direction of increasing the energy efficiency of hard coal mining is forecasting power consumption and monitoring electricity consumption, as well as appropriate management of the electricity produced. This article presents models of artificial neural networks for the energy system using methane from the hard-coal mine’s firedamp drainage system. The models presented are characterized by a correlation coefficient ranging from 0.918 to 0.940. The mean prediction error for the proposed networks varies from 441.58 to 545.64, and the mean percentage error from 4.05% to 5.14%. The evaluation indicators made it possible to select the most precise network—MLP 4, whose MAPE was 4.05%. The proposed model was characterized by the activation function of the hyperbolic tangent hidden layer and the logistic output layer, with the total number of hidden units: 290. Analysing the sensitivity coefficients for each of the input variables, it can be noticed that, among the proposed inputs, in each of the presented models, the methane concentration has the greatest impact on the predicted value. What is more, the time and day of observation are also significant. Preliminary statistical analysis showed that there is no significant correlation between electricity production and the hour of measurements, however, in the neural network model this parameter plays an important role.
As the analysis showed, the production of electricity fuelled by hard-coal-bed methane strongly depends on many factors. The most important parameter turned out to be the concentration of methane in the air-methane mixture discharged by the ventilation system. The proposed model allows for the determination of electricity production with high accuracy, which enables proper management of the mine’s energy system.
5. Conclusions
In addition to the properties of coal deposits, there are many factors that influence CMM emissions during mining. Moreover, the gas produced by CMM activities can be high quality gas such as pre-extraction methane or gas with a low methane concentration, e.g., VAM. Poland is one of the countries with significant CMM emissions. Other leading global emitters include the United States, Russia, Australia, Ukraine, Kazakhstan, and India. Recognising the importance of the capture and use of coordinate measuring machines for mine safety, power generation, and greenhouse gas reduction, these countries implement various CMM projects. Depending on economic, social, and regulatory conditions, the implementation of CMM projects involves a number of challenges which may slow down or limit their progress. These challenges must be addressed and solved in cooperation with both government agencies and the private sector in each country, as well as through cooperation at international level by financing and demonstrating the importance of the capture and use of CMM in improving mine safety, power generation, and in reducing greenhouse gases.
Methane emissions from the mines have been of great interest for years. This is a very important topic, not only for environmental reasons, but also because of its energy benefits and resulting financial benefits. Methane is associated with great danger, both for employees and the environment, but when used properly, it can become a valuable energy resource. The conducted analysis showed that it is possible to estimate in detail the energy benefits on the basis of parameters defining the captured ventilation air from mines. Proper prediction of electricity production is very important for the efficient management of energy resources. The artificial neural network models allow for the estimation of electricity production for specific input parameters. It also makes it possible to distinguish the parameters that determine the amount of electricity produced. Coal companies are constantly making technical and economic efforts to intensify the use of released and captured methane. Investments implemented in this regard are capital intensive and time-consuming. Due to the gas network infrastructure in the vicinity of the mine and the related limitations of methane transport from coal seams, most of the power systems are located in the mines or in close proximity. Proper determination of electricity production in installations in the mine will allow mine operators to determine how much electricity obtained from other sources, including the transmission network, is necessary for the proper functioning of the mine. In the case of large installations and possible surpluses of electricity production related to the variability of electricity consumption by mines over time, it allows mine operators to determine the amount of electricity transferred to the grid.
Author Contributions
Conceptualization, M.B. and J.C.; methodology, M.B. and K.Z.; software, K.Z.; validation, M.B. and P.Ż., and J.C.; formal analysis, P.Ż. and R.Ł.; investigation, K.Z. and J.C.; resources, P.Ż. and R.Ł.; data curation, K.Z.; writing—original draft preparation, P.Ż., R.Ł., and K.Z.; writing—review and editing, M.B. and J.C.; visualization, P.Ż. and R.Ł.; supervision, M.B. and J.C.; project administration, M.B. and R.Ł.; funding acquisition, M.B. All authors have read and agreed to the published version of the manuscript.
Funding
This research received no external funding.
Conflicts of Interest
The authors declare no conflict of interest.
Nomenclature
| C | Methane concentration, % |
| Ep | Electricity production, kWh/h |
| F | Methane-air mixture capture, m3/min |
| FCH4 | Methane capture, m3/min |
| H | Relative humidity of gas, % |
| P | Pressure of the methane-air mixture, kPa |
| T | Temperature of gas, °C |
References
- Moore, T.A. Coalbed methane: A review. Int. J. Coal Geol. 2012, 101, 36–81. [Google Scholar] [CrossRef]
- Wang, L.; Cheng, Y.-P. Drainage and utilization of Chinese coal mine methane with a coal-methane co-exploitation model: Analysis and projections. Resour. Policy 2012, 37, 315–321. [Google Scholar] [CrossRef]
- Karacan, C.Ö. Modeling and analysis of gas capture from sealed sections of abandoned coal mines. Int. J. Coal Geol. 2015, 138, 30–41. [Google Scholar] [CrossRef]
- Karacan, C.Ö.; Ruiz, F.A.; Cotè, M.; Phipps, S. Coal mine methane: A review of capture and utilization practices with benefits to mining safety and to greenhouse gas reduction. Int. J. Coal Geol. 2011, 86, 121–156. [Google Scholar] [CrossRef]
- Szlązak, N.; Borowski, M.; Obracaj, D.; Swolkień, J.; Korzec, M. Comparison of methane drainage methods used in Polish coal mines. Arch. Min. Sci. 2014, 3, 655–675. [Google Scholar] [CrossRef]
- IPCC. Climate Change 2014, Synthesis Report. In Contribution of Working Groups I, II and III to the Fifth Assessment Report of the Intergovernmental Panel on Climate Change; Core Writing Team, Pachauri, R.K., Meyer, L.A., Eds.; IPCC: Geneva, Switzerland, 2014; p. 151. [Google Scholar]
- Hmiel, B.; Petrenko, V.V.; Dyonisius, M.N.; Buizert, C.; Smith, A.M.; Place, P.F.; Harth, C.; Beaudette, R.; Hua, Q.; Yang, B.; et al. Preindustrial 14CH4 indicates greater anthropogenic fossil CH4 emissions. Nature 2020, 578, 409–412. [Google Scholar] [CrossRef] [PubMed]
- NOAA. Ed Dlugokencky, NOAA/GML. Available online: www.esrl.noaa.gov/gmd/ccgg/trends_ch4/ (accessed on 24 June 2020).
- Montzka, S.A.; Dlugokencky, E.J.; Butler, J.H. Non-CO2 greenhouse gases and climate change. Nature 2011, 476, 43–50. [Google Scholar] [CrossRef] [PubMed]
- U.S. EPA. Identifying Opportunities for Methane Recovery at U.S. Coal Mines: Profiles of Selected Gassy Underground Coal Mines (2002–2016). 2019; Updated version: July 2019. U.S. EPA Coalbed Methane Outreach Program, EPA 430-K-18-001. Available online: https://www.epa.gov/sites/production/files/2019-11/documents/epa_cmop_gassy_mine_profiles_2002-2016_final.pdf (accessed on 29 June 2020).
- GMI. Coal Mine Methane: Reducing Emissions, Advancing Recovery and Use Opportunities. Global Methane Initiative, September 2011. Available online: https://www.globalmethane.org/documents/coal_fs_eng.pdf (accessed on 29 June 2020).
- Jiang, J.; Mira, D.; Cluff, D.L. The combustion mitigation of methane as a non-CO2 greenhouse gas. Prog. Energy Combust. Sci. 2018, 66, 176–199. [Google Scholar] [CrossRef]
- WUG. Ocena Stanu Bezpieczeństwa Pracy, Ratownictwa Górniczego Oraz Bezpieczeństwa Powszechnego w Związku z Działalnością Górniczo-Geologiczną w 2019 Roku. Wyższy Urząd Górniczy, Katowice. 2020. Available online: https://wug.intracom.com.pl/download/WUG_Stan_bhp_19,7247.pdf (accessed on 29 June 2020).
- Su, S.; Beath, A.; Guo, H.; Mallett, C. An assessment of mine methane mitigation and utilisation technologies. Prog. Energy Combust. Sci. 2005, 31, 123–170. [Google Scholar] [CrossRef]
- UNECE. Best Practice Guidance for Effective Methane Drainage and Use in Coal Mines, 2nd ed.; ECE Energy Series No. 47; United Nations: Geneva, Switzerland, 2016. [Google Scholar]
- Zhou, F.; Xia, T.; Wang, X.; Zhang, Y.; Sun, Y.; Liu, J. Recent developments in coal mine methane extraction and utilization in China: A review. J. Nat. Gas Sci. Eng. 2016, 31, 437–458. [Google Scholar] [CrossRef]
- Cheng, Y.-P.; Wang, L.; Zhang, X.-L. Environmental impact of coal mine methane emissions and responding strategies in China. Int. J. Greenh. Gas Control. 2011, 5, 157–166. [Google Scholar] [CrossRef]
- Su, S.; Agnew, J. Catalytic combustion of coal mine ventilation air methane. Fuel 2006, 85, 1201–1210. [Google Scholar] [CrossRef]
- Karakurt, I.; Aydin, G.; Aydiner, K. Mine ventilation air methane as a sustainable energy source. Renew. Sustain. Energy Rev. 2011, 15, 1042–1049. [Google Scholar] [CrossRef]
- Gosiewski, K.; Pawlaczyk, A. Catalytic or thermal reversed flow combustion of coal mine ventilation air methane: What is better choice and when? Chem. Eng. J. 2014, 238, 78–85. [Google Scholar] [CrossRef]
- GMI. International Coal Mine Methane Projects List. Global Methane Initiative, 16 February 2016. Available online: https://www.globalmethane.org/tools-resources/resource_details.aspx?r=4751 (accessed on 6 July 2020).
- Data provided by JSW S.A. Unpublished work.
- Borowski, M.; Życzkowski, P.; Łuczak, R.; Karch, M.; Cheng, J. Tests to Ensure the Minimum Methane Concentration for Gas Engines to Limit Atmospheric Emissions. Energies 2020, 13, 44. [Google Scholar] [CrossRef]
- Napieraj, S.; Borowski, M.; Karch, M. Ecologically and economically effective methods of coal bed methane using. J. Polish Miner. Eng. Soc. 2019, 21, 279–286. [Google Scholar] [CrossRef]
- Nawrat, S.; Kuczera, Z.; Łuczak, R.; Napieraj, S.; Życzkowski, P. Gospodarcze wykorzystanie metanu z odmetanowania pokładów węgla polskich kopalń węgla kamiennego. Górnictwo i Geoinżynieria 2006, 30, 35–51. [Google Scholar]
- Pham, D.T.; Liu, X. Neural Networks for Identification, Prediction and Control; Springer: London, UK, 1995; pp. 1–21. [Google Scholar]
- Nunes Silva, I.; Hernane Spatti, D.; Andrade Flauzino, R.; Liboni, L.H.B.; dos Reis Alves, S.F. Artificial Neural Networks. In A Practical Course, 1st ed.; Springer: Cham, Switzerland, 2017; pp. 55–114. [Google Scholar]
- StatSoft. STATISTICA (Data Analysis Software System); StatSoft, Inc.: Tulsa, OK, USA. Available online: www.statsoft.com (accessed on 1 August 2020).


© 2020 by the authors. Licensee MDPI, Basel, Switzerland. This article is an open access article distributed under the terms and conditions of the Creative Commons Attribution (CC BY) license (http://creativecommons.org/licenses/by/4.0/).