Abstract
Mineral base oil, a product of multistep fine refining of the relevant fractions from vacuum distillation of crude oil, is a main component of so-called mineral lubricating oils containing aliphatic and alicyclic substituted aromatic hydrocarbons, i.e., derivatives of benzene and biphenyl. Mineral lubricating oil is composed mostly of mineral base oil and a low amount of enriching additives, most often products of advanced organic chemical technology. The application of mineral lubricating oils in open cutting systems has a very negative impact on environment and on the operator’s health. This work presents a simple, cheap and fast methodology allows identification of the group-type composition of base oil in lubricating oil and to estimate the content or total absence of base oil of mineral and vegetable origin in lubricating oil. The first step of the test is an in-situ screening for fluorescence of petroleum fraction under the 365 nm light. The next is the performance of infrared spectra with Fourier transformation (FT-MIR) to identify and estimate the content of vegetable oil and its derivatives and the performance of UV-Vis spectra to identify and determine the content of aromatic hydrocarbons, as well as dyes present in the lubricating oil. The last stage is normal phase thin layer chromatography (NP-TLC) using different visualization methods to evaluate the group-type composition of lubricating oil. Effectivity of the developed procedure has been confirmed during control of group-type composition evaluation of lubricating oils in cutting systems. The procedure can be also applied with respect to different oil matrices.
1. Introduction
Lubricating oils are specialized and complex mixtures of base oil (>90%) and a package of enriching additives [1,2]. The quality, type and mutual proportions of the components determine the class of the produced oil. Base oils can be classified as oils derived from petroleum (i.e., mineral base oils), synthetic, semi-synthetic (base oil in part “mineral” and in part “synthetic”) and natural origin oils (mainly vegetable oils or animal fats) [1].
Mineral base oil is a product of refining of relevant fractions from vacuum distillation of crude oil. Lubricating oils are composed of base oil and certain refining additives. Mineral lubricating oil is a lubricating oil composed of mineral base oil and additives, often in a few percent. Enriching additives are most often products of advanced organic chemical technology. It is worth emphasizing that lubricating oil composition is a trade secret, both in terms of base oil and enriching additives in final product.
The main function of lubricating oil is to reduce friction and frictional heat and to prevent wear on working components, corrosive links, creation of seals and to keep surfaces clean from contamination [2,3,4]. Lubricating oil are emitted into the environment in the form of oil mist and micro-drops in open cutting systems [5,6]. The range of the pollution effect depends on the size of the drops, the height of the saw and the wind.
As reported, the use of mineral based lubricating oils in open cutting systems has a negative impact on health and the environment [7,8,9]. This is mainly due to low biodegradability of oils of petroleum origin. Mineral oil clogs the soil pores, which reduces soil permeability, aeration and water infiltration as a result of an oxygen deficit [10,11]. The oil migrates through soil to the surrounding water reservoirs, where it interferes the oxygen gas exchange between water and the atmosphere [12]. It also reduces the access of light to the depth of the tank, an oxygen deficit occurs at the bottom [13,14]. Changes in the aquatic ecosystem often lead to changes in the functioning of aquatic organisms, disturb the development of aquatic plants and cause eutrophication [8,10,14].
Mineral lubricating oils used in open cutting systems are a threat to operators of this type of equipment. People exposed to long-term contact with oil mist report symptoms such as eye and upper respiratory tract irritation, headache and fatigue [15,16]. A high level of cancer incidence, including most often skin cancer may occur [13,17].
Unfortunately, most of the ingredients derived from mineral based lubricating oils undergo extremely slow biodegradation. Furthermore, structural changes due to chemical reactions under the influence of sunlight, oxygen presence, as well as reactions with water and soil components may occur [18,19]. Secondary chemical compounds may be more ecotoxic and harmful to health than primary chemical forms [13,16,20]. Petroleum based oils may undergo transformation due to the influence of light and water. Substituted phenols, biphenols, naphthols and other much more environmentally harmful chemical compounds may be formed.
Lubricating oils used in open cutting systems are applied in forestry or during road and gardening works [4]. In Polish forests, about 40,000 chainsaws were applied for forestry work during 2015 [21] and the average age of tractor used in forestry is 23 years. Over 20 million cubic meters of wood were harvested in 2009 in Poland, and this amount increased up to 40.5 million cubic meters in 2019. Annually, almost 4 billion cubic meters of wood are treated worldwide.
To obtain one cubic meter of wood, a chainsaw uses 50 mL, while a harvester uses only 20 mL of lubricating oil for the same amount of harvested wood [22]. Annually, about 112 million liters of lubricating oils are used to process the wood. The amount of lubricating oil emitted to the environment is believed to increase annually [22,23]. The vast majority, i.e., over 60% of used lubricating oils, is produced on the basis of mineral oils. As a consequence, even over 70 million liters of mineral oils may be emitted into the environment [14]. Lubricants are emitted to the environment during breakdowns and leaks, natural consequences of exploitation of hydraulic systems of mentioned machines [21].
In Poland due to the decision of the General Director of State Forests [24] the emission of the oils is to be prevented using sorbents and sorption mats to absorb spilled fuel or oil and other technological fluids used in machines, tractors, chainsaws and other devices. Woodcutters are allowed to use safe canister dispensers preventing pouring of oil and fuel mixture during refueling of the saw. The issues related to the oil mist remain unregulated. As current regulations allow the use of lubricating oils containing up to 50% components of petroleum origin, the consumer who decides to buy and use them unknowingly exposes himself to health damage and contributes to environmental contamination [7,25,26,27]. Lubricating oils produced exclusively on a natural basis are more expensive and less durable, therefore they are not a choice of the first raw among the consumers [7].
In the European Union, biodegradability of lubricating oils is tested using OECD 301 B procedures [28]. The regulation includes methodologies for assessing biodegradability by subjecting the test oil to specific microorganisms for 28 days [29,30]. Samples achieving a degradation ratio of 60% are considered as safe for environment. However, the procedure may not be adequate for lubricating oils, as the remaining 40% of the sample may undergo biodegradation for up to several hundred years [26,31]. The microbiological methodology of OECD 301 B with soil bacteria, which consists of the volume of CO2 released for 28 days determination in relation to the theoretical amount of CO2 that should be formed from the tested material, is inadequate. The method should inform that even with a 50% petroleum base oil content in this type of lubricating oil, the tested oil meets the requirements of the microbiological OECD 301 B test.
The group-type composition of lubricating oils is an important element in assessing their quality and environmental impact [32,33]. Commonly, the composition of conventional lubricating oils produced from the processing of crude oils can be determined using Fourier transformation infrared spectrometry (FT-MIR) [34,35,36,37,38], proton nuclear magnetic resonance spectroscopy (1HNMR) [39] carbon isotope 13C nuclear magnetic resonance spectroscopy (13CNMR), mass spectrometry (MS), as well as visible and ultraviolet spectrophotometry (UV-Vis) [40,41,42]. However, mainly chromatographic techniques [1,32,37,43,44,45,46,47,48] i.e., gas chromatography (GC) [49,50,51,52], high performance liquid column chromatography (HPLC) combined with different detection techniques [46,50,53,54,55], and thin layer liquid chromatography, with a stationary phase applied to quartz rods and a flame ionization detector (TLC-FID) [50,56,57,58,59,60] are applied to separate, identify and determine the group-type composition of conventional lubricating oils produced from the processing of crude oil. Methods for group-type composition determination are standardized [61,62,63,64,65].
Until 2000 many papers regarding a critical look at methods for determining the group-type composition of petroleum products, including lubricating oils can be found. Later, only articles mentioning the use of specific method for a particular application were prepared and developed. The determination of the group-type composition of modern lubricating oils becomes problematic, as they contain ingredients derived not only from the processing of crude oil, but also more often ingredients of natural origin—vegetable base oils and/or animal fats—and it is planned that in the future modern lubricant oils will contain only highly biodegradable fractions of natural origin. This situation hinders the matrices analysis, however due to legal regulations, forcing natural origin additives, most methods and standards are devoted exclusively to mineral lubricating oils [66,67].
The aim of this research is to develop a procedure for technical control of lubricating oils, including a preliminary in-situ screening test and further laboratory tests, which would confirm whether environmental contamination may occur.
2. Materials and Methods
2.1. Sample Preparation
The authors applied samples of lubricant oil of every known type. The sample list includes standards and real samples and is presented in Table 1.

Table 1.
List of oil samples applied in analyses.
2.2. Drop Test Development
The drop test is based on the phenomenon of fluorescence. The tested oil sample is illuminated with a mercury lamp emitting light with a wavelength λ = 365 nm. The tested material (20 µL) is introduced into a cylindrical hollow on a black, matte plate (90 × 50 × 10 mm) with eight holes (each hole 10 mm in diameter and 7 mm deep). The plate is placed in a blind photographic chamber. The ultraviolet light with an excitation wavelength λ = 365 nm is emitted onto the plate by LED lamp (Manufacturer: MR Chemie, Unna, Germany). The illuminated sample plate is photographed (camera Xiaomi Mi A2 Lite, resolution 4240 × 2824 pix, matrix: 12 Mpx, Beijing, China) and evaluated. The performance of the test is presented in Figure 1 (Figure 1).
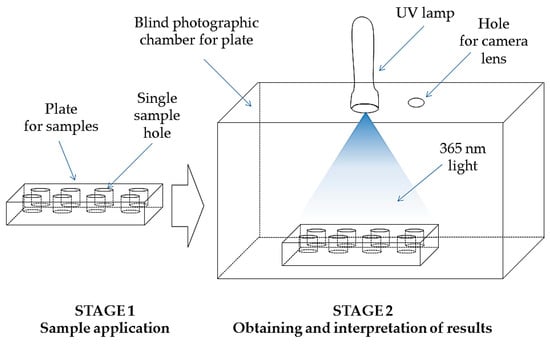
Figure 1.
A schematic diagram of drop test performance.
The test allows to identify the petroleum oil fraction in the tested material. If the test sample contains unsubstituted, aliphatic, alicyclic or monocyclic aromatic hydrocarbons, then the sample emits blue fluorescence. In the presence of polycyclic hydrocarbons blue color light is emitted. The occurrence of fluorescence indicates the presence of a petroleum fraction, most likely monocyclic structures (benzene, its aliphatic and alicyclic derivatives). Blue fluorescence reveals, when the oil contains refined petroleum base oil, low volatile alkylates or petroleum oil (e.g., turbine oil). If the tested material does not emit fluorescence during the test, it is found that the oil is based on vegetable or synthetic origin (polyalphaolefin type or polyester type). The drop test does not determine the content of hydrocracked or isomerized oil produced on a petroleum basis. These types of oil bases consist of very stable, usually synthetic compounds, chemical polymers and are similar to polyisoethylene, polyisopropylene or synthetic polyesters and their various mixtures. These types of polymers have lower molecular weights. In this case, there is no absorption of UV light at the excitation wavelength λ = 360 nm and no fluorescence phenomenon [68]. If fluorescence at 365 nm of a different color occurs, other oil components, i.e., phenol derivatives may be present in the sample [69,70,71].
2.3. Adaptation of UV-Vis Spectroscopy for Lubricating Oil Composition Determination
UV-Vis spectra were performed for 2.5 mL of analyte solutions with a concentration of 0.25 mg of sample (oil) per 1 mL of n-hexane (purity for LC, Merck, Darmstadt, Germany). The absorption of n-hexane can be observed at 205 nm. To perform UV-Vis spectra, the HP DAD Spectrophotometer 8452A (Agilent, CA, USA) was used with the Chemstation UV-Vis (B.02.01 software, Agilent) and a quartz cuvette with an optical path length of 1 cm. A spectrum of pure n-hexane (purity for LC, Merck, Darmstadt, Germany) as the background was taken and samples spectra were taken sequentially in triplicates for each sample to maintain consistent and reproducible results. The test was performed at a scanning speed of 400 nm/min, in the measuring range of absorbance from 0 to 1.6 as well as in the wavelength range from 200 to 800 nm. The test was performed at 20 ± 1 °C. Due to the limitations of linearity resulting from the Lambert–Beer law, two wavelengths 230 and 265 nm were chosen for the comparison of the spectra for tested substances. If the lubricating oil contains a dye, the UV-Vis spectrum should also be applied in the range of 400–800 nm for the same concentration of 0.25 mg/mL, but on a scale of 0.00 to 0.01 [Au]—on the light absorption side.
Absorption spectrophotometry is the most widely used instrumental method in chemical analysis due to its high precision, sensitivity and availability of apparatus [41,72]. Absorption spectrophotometry in the area of ultraviolet and visible light enables identification and indicative determination of the group-type composition of aromatic structures present in the oil base. The technique also allows the determination of the added dye in lubricating oil [42,49,50,73]. By analyzing the location of the maximum absorption (λmax), the structure of selected systems can be determined [74]. The presence of aromatic hydrocarbons in the sample causes a formation of a maximum absorption at a wavelength of approximately 265 nm. Synthetic improvers may also contain aromatic hydrocarbons, ketones, or other types of organic chemicals that absorb UV in the 270 nm wavelengths. The low content of additives in lubricating oil indicates that light absorption in this range will be low, if the oil does not contain a significant content of aromatic (petroleum) as oil base. In the absence of aromatic hydrocarbon fraction, it is possible to assess the presence and content of natural vegetable or animal origin oil—maximum absorption at a wavelength of approximately 230 nm. A maximum of absorption occurring at a wavelength of approximately 230 nm indicates the presence of groups of components—acylglycerols (triacylglycerols (TAG), diacylglycerols (DAG) and monoacylglycerols (MAG)), as well as fatty acid methyl esters (FAME). The polyalphaolefins (PAO) absorb light up to approximately 220 nm, without a maximum.
2.4. FT-MIR Spectroscopy Adaptation for Lubricating Oils Analysis
To perform the FT-MIR spectra, a Bruker Tensor 27 apparatus with an ATR overlay (Bruker, Tucson, AZ, USA) and a desktop computer with OPUS (software version 2.1b, Bruker) for collecting and analyzing FT-MIR data were used. Spectral range from 4000 cm−1 to 600 cm−1 was applied. A resolution of 4 cm−1 was used for spectra purposes, the sample and background scans number was equal to 256, the gap between the monolithic diamond crystal and the adapter was equal to 5 mm. Raw samples were tested in triplicates.
The examination of the absorption spectrum in the mid-infrared range with Fourier transformation (FT-MIR) allows the identification and indicative determination of the origin of the oil base used in the production of the tested lubricating oil. Infrared spectra are characteristic for specific groups of chemical compounds (groups of several atoms connected with each other by chemical bonds). For lubricating oils, the FT-MIR technique enables the determination of an easily biodegradable oil base, i.e., oil base structures of vegetable, ester or synthetic origin. The advantage of using the method is the speed of testing, while the expensive apparatus is a significant disadvantage.
2.5. NP-TLC Method Development
TLC Silica Gel 60 F254s plates 100 × 200 mm (Merck, Darmstadt, Germany) were impregnated with a 25 mL solution of berberine sulfate (6 mg berberine sulfate (analytical purity, Sigma-Aldrich, Shinagawa, Japan) in methanol (purity to LC, Merck, Darmstadt, Germany) for test purposes. A glass atomizer (100 mL Erlenmeyer flask, with NS 19/26 socket, Duran spray head (with Duran tube) with clamp and rubber head (Lenz Laborglasinstrumente, Merck, Darmstadt, Germany) was applied. The plate was dried after impregnation (40 °C via 15 min, until constant weight). The use of impregnation allows to increase the fluorescence intensity of aromatic hydrocarbons, all visible groups of oil components i.e., aliphatic and aliphatic substituted hydrocarbons (paraffins) and alicyclic hydrocarbons (naphthenics) that are not identifiable and can be assessed using other described visualization methods.
All tested samples were prepared at a concentration of 20 mg per mL of dichloromethane (analytical purity, Chempur, Piekary Śląskie, Poland). Glycerin and propylene glycol solutions were prepared at a concentration of 20 mg sample per mL acetone (analytical purity, POCH, Gliwice, Poland) and 3 μL of each sample was immediately imposed onto the plate under warm air supply. The plate was dried (105 °C for 15 min, until constant weight). A three-step elution was performed in a glass chromatography chamber (250 × 50 × 200 mm) filled to the level of 9 mm with eluent. At the first stage, a mixture of dichloromethane and methanol 95:5 (v/v), respectively, was applied as eluent and the plate was developed until the eluent reached 30% of unwinding height. At the second stage, toluene (analytical purity, POCH, Gliwice, Poland) was applied as eluent, the plate was developed until the eluent reached 60% of unwinding height. Finally, n-hexane was applied as eluent (purity for LC, Merck, Darmstadt, Germany) and the plate was developed until the eluent reached 100% of the unwinding height. After each elution step, the plate was dried (105 °C for 15 min, until constant weight) and photographed under a UV lamp (λ = 254 nm and 365 nm) type TB 02 (Telbid, Warszawa, Poland). After the three step NP-TLC elution procedure, the plate was placed in a desiccator with crystal iodine (analytical purity, Sigma-Aldrich, Poznań, Poland) for 15 min, at 35–40 °C. Exposed in iodine TLC plates were photographed in visible light. Due to chemicals used, the described procedure needs to be carried under the extract.
The NP-TLC methodology allows to determine the sum of paraffins and naphthenics (P + N), aliphatic and alicyclic substituted aromatic hydrocarbons (A), the group of acylglycerols and their derivatives (AG), as well as fatty acids methyl esters (FAME). Thin layer chromatography in normal phase system (NP-TLC) is most commonly used to separate, identify and determine the composition of this type of samples. [59,60,75,76,77,78,79].
The retention factor (k) for groups of ingredients was calculated on the basis of the following formula, where Rf is the quotient of the path traveled through the substances (a) to the entire separation path (b) [80]:
3. Results and Discussion
3.1. Drop Test
The luminescence of the drops of oil samples is presented in Figure 2. The intensity and the color of the drops depends on the group-type composition of the tested sample, especially on the origin of the base oil. For glycerin (sample 1, Figure 2), propylene glycol (sample 2, Figure 2), as well as oils of vegetable origin (samples 1 and 5, Figure 2), synthetic ester type oil (sample 4, Figure 2) and polyalphaolefin type base oil (PAO 6) (samples 6 and 7, Figure 2) no fluorescence was observed. In the case of lubricant oil for cutting systems produced on the basis of a mixture of vegetable and mineral oil (commercially available) (sample 10, Figure 2), a navy-blue light fluorescence is observed, indicating a mixed composition. However, in the case of oils derived from petroleum (samples 8, 9 and 11, Figure 2), there is a clear light blue fluorescence caused by the presence of aromatic, aliphatic and/or alicyclic aromatic hydrocarbons. The results are summarized in Table 2 (please refer).
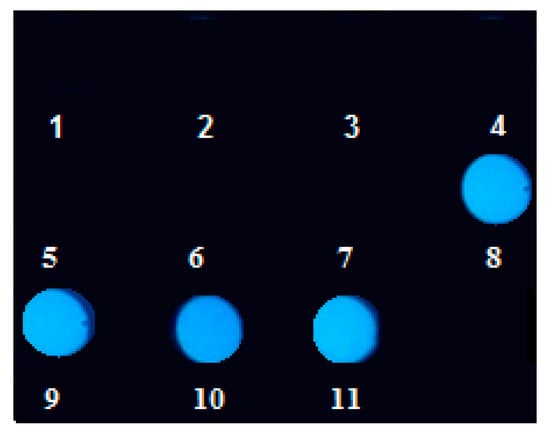
Figure 2.
Photograph of oil drops of 11 samples applied to a black matte plate, placed in a dark place and illuminated with a UV LED lamp at λ = 365 nm. The sample type is presented in Table 1, please refer.
Table 2.
Summary of test results for all tested samples in relation to all developed test techniques.
In the initial tests, drop test was carried out on a paper sheet. Such attempts failed, as the oil drops were absorbed by the paper and the diameter of the oil drop grew over time. Consequently, several samples differed in diameter and the differences in the luminescence intensity between the samples was not measurable. To improve the method, a plate with hollow places for samples was proposed. The samples remained unchanged in shape and volume throughout the experiment. In the literature, a similar idea is reported, however the tested samples were poured onto the surface of the water, which was placed in a black container [81]. This approach resulted in the samples being blurred on the water surface. Therefore, it can be stated, that the solution developed in this study allows to achieve repeatable and comparable results during drop test performance, that has not yet been proposed in the literature.
Exposure of samples of different concentrations of mineral and non-mineral components on UV illumination was considered. Two UV lamps emitting light (λ = 365 nm) were placed in parallel in the portable test chamber at a distance of 25 cm from the sample plate. An even exposure for illumination of all tested samples was achieved. Based on a photograph (Figure 3) of the luminescence of 13 drops of mixtures of vegetable and mineral oil at different concentrations, LOD and LOQ were determined.
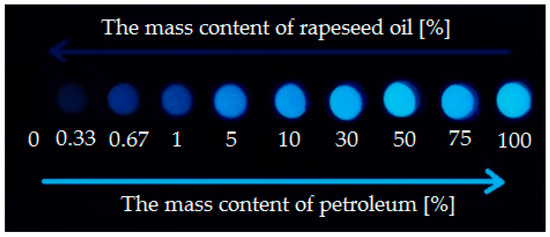
Figure 3.
Fluorescence of mixtures of vegetable and petroleum oil in various proportions (by mass) illuminated with a UV LED lamp, λ = 365 nm.
The limit of detection (LOD) is equal to 0.33% by mass of mineral oil. Limit of quantitation (LOQ) was adopted as LOQ = 3 × LOD therefore is equal to 1% by mass of mineral oil. The method has a fairly high sensitivity and is able to determine small amounts of petroleum components in lubricating oil sample. Contents higher than 40% of mineral oil in the sample, do not increase the intensity of the drop color. The drop test is an ideal, field method for the technical control of lubricating oils used in open cutting equipment, especially in forest areas. Its implementation is very simple, quick and the cost is relatively low and connected with the purchase of equipment (portable chamber equipped with UV lamps). The designed plate allows simultaneous testing of several samples. The method eliminates the sample preparation, which allows the sample to be taken straight from the cutting device tank or canister to perform the test. Support for the method does not require a specialist employee.
If the presence of fluorescence was confirmed during drop test, further tests may be performed to confirm the presence and to determine the components of petroleum origin, when necessary.
3.2. UV-Vis Spectroscopy
The superimposed UV-Vis spectra for the tested samples are summarized in Figure 4. All samples that showed a maximum absorbance at 230 nm were classified as containing a vegetable/natural oil base. Those showing a maximum absorbance at 265 nm were designated as containing ingredients from the processing of crude oil. Based on the registered UV-Vis spectra of the tested samples, a calibration curve was prepared for oil of petroleum origin (Please see Figure S1—Supplementary Material, A = 1.8951c − 0.0164) and vegetable oil (Please see Figure S1—Supplementary Material, A = 1.6058c + 0.0106). Low concentration calibration curves were also prepared (Please see Figure S2—Supplementary Material). A linear relation was observed in the range of concentrations of oil produced on a petroleum basis from 0.01 to 1 mg/mL, for which the analyzed samples were in the Lambert–Beer law range, i.e., they showed absorbance under 1. LOD and LOQ were determined on the basis of calibration curves. Limit of detection (LOD) was calculated from LOD = 3S/N, where S—signal [AU], and N—noise [AU] detection limit for petroleum oil, characterized by a maximum absorbance at 265 nm is 0.50 ± 0.003 mg oil/mL n-hexane, while the limit of quantification is 0.150 ± 0.002 mg oil/mL n-hexane. As a result of the analysis of UV-Vis spectra, a linear relationship was observed in the range of edible rapeseed oil concentrations from 0.01 to 1 mg/mL. The detection limit for oil of plant origin, characterized by a maximum absorbance at 230 nm is 0.150 ± 0.002 mg oil/mL n-hexane, while the limit of quantification is 0.450 ± 0.003 mg oil/mL n-hexane.

Figure 4.
Compilation of UV-Vis spectra of oil samples (concentration of samples 0.25 mg oil/mL n-hexane).
Analysis of the obtained results shows that the UV-Vis spectroscopy method does not show sufficient selectivity, despite the use of concentrations above LOD and LOQ. Based on the obtained spectra, it can only be concluded that the oil is a mixture of the mentioned oils (Figure 4). The presence of components of plant/ester origin and of petroleum origin (aromatic hydrocarbons) can be identified. In addition, one can assess whether a given oil base is a 100% synthetic oil base of polyalphaolefin type (PAO). In the case of tested samples, UV-Vis spectra of vegetable oil, rapeseed oil and saw oil produced on the basis of vegetable oil with enriching additives and FAME showed a maximum absorbance at 230 nm wavelength, which indicates components of vegetable/ester origin. UV-Vis spectra of petroleum machine oil, i.e., base oils SAE 10/95 and SAE 30/95 were characterized by maximum absorbance at 265 nm, which means that aromatic hydrocarbons are present. In the case of chainsaw oil produced on the basis of a mixture of vegetable and petroleum oil—the spectrum was characterized by two significant absorbance maxima at 230 and 265 nm, which occurs when the lubricating oil is composed of vegetable/ester and petroleum origin. UV-Vis spectra for synthetic polyalphaolefin oil (PAO) were characterized by light absorption only for wavelengths up to 220 nm, without a maximum. The main findings from UV-Vis analysis are summarized in Table 2 (please refer).
Totten et al. [81] also investigated UV-Vis of oils spectra. The maximum absorption for mono-, di- and multi-aromatic hydrocarbons was observed at 197, 230 and 260 nm respectively. Morassuti et al. [82] revealed two main absorption bands with a maximum of about 230 and 260 nm, corresponding to di- and poly-aromatic regions, also called polycyclic aromatic hydrocarbons, PAHs. In the case of tests provided in this paper the tested samples of lubricating oils produced from crude oil processing, the maximum absorbance for aromatic hydrocarbons was found at 265 nm. Modern lubricating oils contain ingredients and bases of natural origin randomly. Therefore, it is worth noting that the proposed method can also be applied to identify and determine the composition in terms of natural ingredients. In literature [74,83,84,85], the maximum absorbance is often found around 230–235 nm and its occurrence is attributed to diene groups (–C=C–C=C–), which coincides with the results of the study presented in this paper. Spectrum testing can also be used to identify oxidized components in vegetable oils, where the maximum is shifted to 235 nm [86]. In the literature [86] cyclohexane was used as a solvent, however n-hexane was proposed in these studies for price reasons. The authors confirmed, that liquid alkane, i.e., n-hexane may also be an optimal solvent for the tested samples. The method allows the identification and determination of dye in the tested sample.
The main purpose of using the UV-Vis spectrometry method in the technical control procedure for modern lubricating oils is to confirm the result of the drop method, when necessary. The study aims to assess the group-type composition of the sample. Since the test can be performed quickly and the amount of chemicals used is low, the method becomes environmentally friendly.
3.3. FT-MIR Spectroscopy
The FT-MIR spectra were performed for all tested samples, the spectra are presented in Figure 5. The obtained FT-MIR spectra were interpreted on the basis of the curves, and the main findings are presented in Table 2.
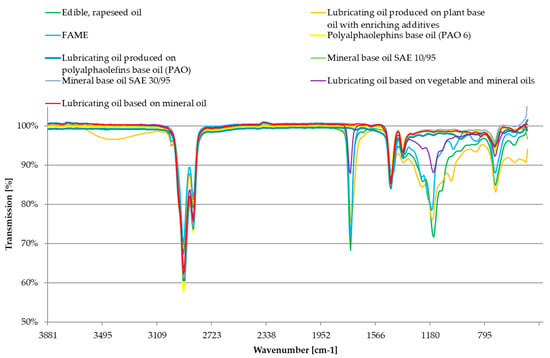
Figure 5.
Compilation of FT-MIR spectra for tested oil samples.
The signal for a wavenumber of about 1100 cm−1 occurs due to the stretching vibrations of C–O bonds, which are characteristic for ester molecular structures, it is a signal characteristic for oils of vegetable origin. Petroleum oils do not show any light absorption in this area. The absorbance at 1747 cm−1 wavelength occurs due to the presence of carbonyl molecular structures. The signal in this area is associated with the stretching vibrations of the C=O carbonyl group, present in oil ester bond. The signal is not found in petroleum oil, due to the lack of ester fraction. With the increase of the vegetable oil content, the content of carbonyl groups clearly increases, which is also reported in the literature [73,87,88]. The signals in the range of 1450–1350 cm−1 are derived from rocking vibration and scissor C-H bonds, which occur in an easily biodegradable oil base (of plant origin) and in an oil base derived from petroleum. Signals in these areas do not show the sense of sample differentiation. The stretching vibrations in the 2850–3100 cm−1 range, correspond to the bands of the C–H groups, characteristic for simple alkanes (in the 3000–2850 cm−1 range) and for alkenes and aromatic hydrocarbons (in the 3100–3000 cm−1 range). The small presence of these spectral fragments may take place when some groups of substances are added to the oil i.e., antioxidants. Vibrations in the 2850–3100 cm−1 range occur both in mineral and in vegetable oils.
Based on prepared mixtures of mineral and vegetable oils (% by weight) a calibration curve was prepared (Figure S3—Supplementary Material). Matwijczuk et.al. [89] also carried measurements on FT-MIR of vegetable oils and reported presence of ester bonds at the wave number of 1160 cm−1 and a carboxyl group from vegetable oils identifiable at the wavenumber of 1740 cm−1.
In the case of rapeseed oil, vegetable-based chainsaw oil and FAME, the recorded spectra show that the oils mentioned are ester-based, or that the mineral oil content is below LOD. SAE 10/90 and SAE 30/90 oil bases, as well as machine oil of petroleum origin have a typical mineral oil spectrum, i.e., no signal at wave number 1100 cm−1 and a significant signal at wave number 1774 cm−1 occur. In the case of chainsaw oil produced as a mixture of vegetable and mineral oils it was found that the oil contains about 37% oil of natural origin. The detection limit for ester structures is 5% by mass, while the limit of quantification is 15% by mass. For carbonyl structures present in readily biodegradable lubricating oil, the detection limit (wave number 1747 cm−1) is 3% by mass and the quantification limit is 9% by mass. The course of spectra for ester and mineral oils expose differences for the mentioned substances. The calibration performed for the signal differentiating these substances enables the determination of the mineral oil concentration in the ester oil, with the detection limit in the range of 9–15% by volume (LOD = 9% vol) (Please see Figure S3–Supplementary Material).
The FT-MIR method is a fast method which predestines it for the initial assessment of the composition of the samples of the tested oil. This method also eliminates the sample preparation process, which speeds up the test and reduces the amount of engaged chemicals, therefore it is an environmentally friendly method. The proposed method provides laboratories with fast, automated and high-throughput alternatives to conventional ASTM titration procedures. ASTM published a method [90] for monitoring the condition of lubricating oils with the application of FT-MIR technique in 2018.
3.4. NP-TLC
The authors proposed a modification of the TLC plate method by impregnation with berberine sulfate. Berberine sulfate increases the fluorescence intensity of all studied groups, in particular aromatic hydrocarbons. It has also been shown that berberine sulfate impregnation does not change the retention coefficients of any of the tested substances, thus it does not affect the separation process. To adopt thin-layer liquid chromatography in normal phase systems (NP-TLC) to separate complex matrices i.e., modern lubricating oils, a 3-stage development procedure and a 4-stage visualization procedure are necessary. The development stages of NP-TLC are presented in Figure 6. Spots on late presented in stage 4 are filled, as the iodine vapors reveals the presence of FAME, acylglycerols, natural enriching additives and dyes.
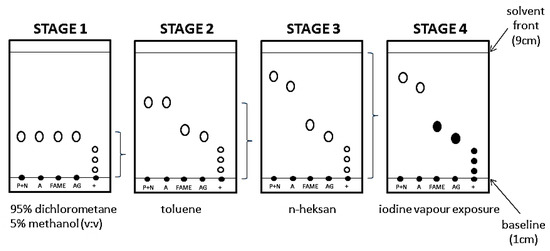
Figure 6.
Schematic diagram of TLC chromatogram development for paraffins and naphthenes (P + N), Aromatic Hydrocarbons (A), FAME, acylglycerols (Tri- and Di-acylglycerols) (TAG + DAG) (AG), Natural originating enriching additives, dyes (+).
During the first stage (Figure 6), a mixture of dichloromethane and methanol was used as eluent (the highest elution strength), which allows the least polar components to be eluted from the start of the chromatogram i.e., ingredients of natural origin, acylglycerols (TAG, DAG, MAG), free fatty acids (FFA), FAME and refining additives produced on a natural basis. The remaining eluents would leave mentioned substances at the start. At this stage, the separation of individual groups of ingredients is not possible (stage 1, Figure 6). In the second stage, toluene is used as eluent. During the plate development in stage 2, weakly polar substances remain in place, while more polar substances are eluted. After this elution stage, the group of ingredients of natural and vegetable origin from a group of ingredients derived from processing of crude oil can be separated (stage 2, Figure 6). Paraffins and naphthenics are not separated from the aromatics and FAME from the natural components. Therefore, a third eluent-n-hexane, was applied. The elution strength of n-hexane is higher than of toluene, but lower than of a mixture of dichloromethane and methanol. This stage allows the separation of paraffin and naphthenic groups from aromatics. In addition, n-hexane elutes FAME, which allows this component to be identified. After completing three stage elution, the exposure of the plate to iodine vapors (stage 4, Figure 6), allows the visualization of components that have a double or ester bond in their structure.
The NP-TLC test was performed three times for all oil samples to obtain reproducible results. The results of the tests for samples are summarized in Table 2 and presented in Figure 7 and Figure 8. It was found that the methodology allows to determine the retention factor (k) for paraffins and naphthenics (P + N; k = 0.19), aliphatic and alicyclic substituted aromatic hydrocarbons (A; k = 0.29), FAME (k = 1.04), acylglycerols (TAG + MAG; k = 1.56). Studies have shown that the detection limit for components of petroleum origin LOD = 1 mg/mL, while the detection limit for oils of natural origin (acylglycerol fraction TAG + DAG) is 0.5 mg/mL. Using a professional TLC plate scanner and software dedicated to this solution, one could determine the content of individual fractions. The group-type composition of modern lubricating oils can also be determined using thin layer liquid chromatography in normal phase systems using a flame ionization detector (TLC-FID) [57]. The validation regarding TLC measurements presented in this paper was within the scope of validation carried out during initial tests. The detection limit for the petroleum part of the base oil is 5% m/m, while the determination limit is 10% m/m. For the natural/vegetable part of the base oil, the detection limit is also 5% m/m, while the determination value is 10% m/m.
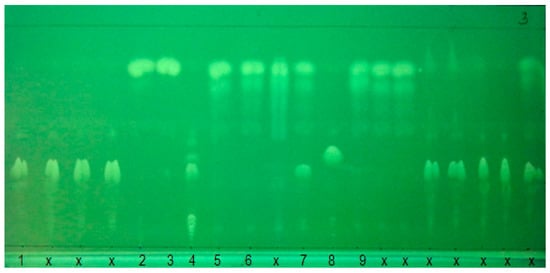
Figure 7.
Chromatogram after third stage of plate development, l = 365 nm. The sample type is presented in Table 1, please refer; x—other commercially available lubricating oils.
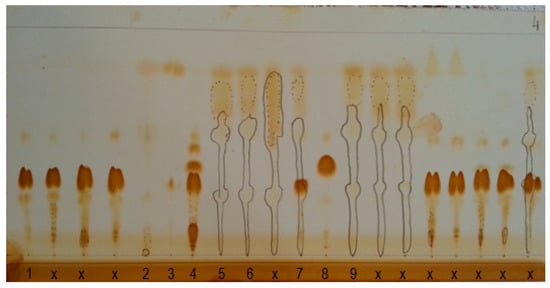
Figure 8.
Chromatogram after fourth stage of plate visualization, i.e., after iodine vapor exposure. The sample type is presented in Table 1, please refer; x—other commercially available lubricating oils.
The summary of the results obtained during the developed methodology is presented in Table 2. Spectroscopic methods were adopted for identification and indicative determination of the group-type composition of modern lubricating oils. The study of UV-Vis light absorbance in the range of 210 ÷ 410 nm allows to identify and approximately determine the content of aromatic hydrocarbons, as well as dyes present in the lubricating oil. The study of the FT-MIR spectra in the range from 4000 cm−1 to 550 cm−1 were used to identify and determine the content of fatty acid esters, or other types of esters, constituting a vegetable or synthetic, biodegradable oil. The NP-TLC method has been modified and adapted to separate, identify and evaluate the group-type composition of modern lubricating oils using different visualization methods. Favorable conditions for NP-TLC plate impregnation with berberine sulfate method and preparation were applied, results confirmed the given hypothesis.
3.5. Procedure Summary
The proposed methods form a procedure that allows to identify and preliminary determine the content of individual groups of components in modern lubricating oils. A detailed possibility of each test accuracy is presented in Table 2. The developed methodology and equipment enable a fast, uncomplicated and cheap in situ screening test using the phenomenon of fluorescence of petroleum fraction under the influence of light with a wavelength of 365 nm (aliphatic/alicyclic aromatic hydrocarbons substituents), typical for mineral base oils. The determined fraction is a component of lubricating oils characterized as the most toxic for the environment and health. The developed procedure consists of several stages that allow to determine the group-type composition, differentiating substances in the range of hydrocarbons constituting petroleum components, acylglycerols and their derivatives, as well as fatty acid methyl esters (FAME).
The prepared procedure has been successfully used in measurements for the Regional Directorate of State Forests in Poland, on samples taken from both the saw tank and the canisters. As the obtained results seem promising, future research is directed on the procedure for both identification of component groups and determination of the group-type composition of lubricating oils.
The possible direction for future investigation is to prepare a detailed determination of individual groups of lubricating oils, i.e., allowing the calculation of the absolute mass content of individual groups of compounds, preferably using high performance liquid chromatography (HPLC). To this end, it is worth conducting further research and interlaboratory tests to obtain more extensive comparative material and to introduce the HPLC method as a standard method for determining the group composition of lubricating oils, especially those emitted to the environment and other low-volatile petroleum fractions.
Independently, methods allowing to separate natural ester oil fractions into components such as TAG, DAG, MAG, FFA, are described in the literature [57,91]. Methods for determining components in the fraction derived from the processing of crude oil are described in [56,58,92]. Assessment of the group composition of base oils [60] and vegetable oils using a flame ionization detector (FID) [57] should be carried separately.
4. Conclusions
Perceiving the problem of mineral base oil presence in lubricating oils, the aim of this work was to develop a new, easy, low cost and uncomplicated technical control procedure for testing the group-type composition of lubricating oils, with particular emphasis on oils emitted to the environment.
The authors proposed a three–step technical control procedure involving:
- A simple drop test, allowing to test the fluorescence of an oil sample against a black, matte background under the influence of 365 nm light. The test reveals the presence of aromatic hydrocarbons, if luminescence occurs. Further methodology is proposed as follows:
- Assessing the presence and content of easy biodegradable fraction (acylglycerols and their derivatives) by examining the spectrum of oil sample in the medium infrared range with Fourier transformation (FT-MIR), as well as assessing the identification and determination of a group of ingredients of petroleum origin (aromatic hydrocarbons) by examining the spectrum of the oil solution in n-alkane, using spectrophotometry in the UV-Vis range.
- Assessing the group-type composition of oil using multi-stage thin layer chromatography in normal phase system (NP-TLC), with different methods of visualization of spots representing groups of oil components, including plate impregnation with berberine salt, for visualization under the influence of UV light 365 nm and after iodine exposure.
The possible direction for future investigation is to prepare a detailed determination of individual groups of lubricating oils. For this reason the NP-HPLC technique coupled with UV-VIS-DAD/RID/LLSD detection, with gradient or step elution are planned to be engaged. The authors intend to publish the results as the subject of another publication.
Supplementary Materials
The following are available online at https://www.mdpi.com/1996-1073/13/15/3772/s1, Figure S1. UV-VIS calibration curves for mineral and vegetable oils, λ = 230 and λ = 265 nm for high concentrations. Figure S2. UV-VIS calibration curves for mineral and vegetable oils, λ = 230 and λ = 265 nm for low concentrations. Figure S3. FT-MIR calibration curves for wave numbers 1100 cm−1 and 1747 cm−1.
Author Contributions
Data curation, P.N. and M.A.K.; funding acquisition, M.A.K.; investigation, P.N. and M.A.K.; methodology, P.N., M.A.K. and K.K.; supervision, M.A.K.; validation, P.N.; writing—original draft, P.N.; writing–review & editing, K.K. and M.A.K. All authors have read and agreed to the published version of the manuscript.
Funding
This research received no external funding.
Acknowledgments
The authors thank the Regional Directorate of State Forests in Gdańsk, especially the Head of the Department of Development and Innovation Andrzej Schleser, as well as Piotr Neubauer for the initiative to undertake research on the development of the technical inspection procedures of lubricating oils and for successful cooperation. The authors also thank to Piotr Rybarczyk for his contribution to the preparation of the equipment for the drop test.
Conflicts of Interest
The authors declare no conflict of interest. The funders have no role in the design of the study; in the collection, analyses or interpretation of data; in the writing of the manuscript, or in the decision to publish the results.
References
- Beran, E. Wpływ Budowy Chemicznej Bazowych Olejów Smarowych na ich Biodegradowalność i Wybrane Właściwości Eksploatacyjne; PWR: Wrocław, Poland, 2008; ISBN 1896-4532. [Google Scholar]
- Syahir, A.Z.; Zulkifli, N.W.M.; Masjuki, H.H.; Kalam, M.A.; Alabdulkarem, A.; Gulzar, M.; Khuong, L.S.; Harith, M.H. A review on bio-based lubricants and their applications. J. Clean. Prod. 2017, 168, 997–1016. [Google Scholar] [CrossRef]
- Singh, Y. Tribological behavior as lubricant additive and physiochemical characterization of Jatropha oil blends. Friction 2015, 3, 320–332. [Google Scholar] [CrossRef]
- Rudko, T.; Rybczyński, R. Właściwości smarne olejów roślinnych i mineralnych stosowanych w układach tnących pilarek. Acta Agrophys. 2010, 15, 145–153. [Google Scholar]
- Briassoulis, D.; Mistriotis, A.; Mortier, N.; Tosin, M. A horizontal test method for biodegradation in soil of bio-based and conventional plastics and lubricants. J. Clean. Prod. 2020, 242, 118392. [Google Scholar] [CrossRef]
- Neri, F.; Foderi, C.; Laschi, A.; Fabiano, F.; Cambi, M.; Sciarra, G.; Aprea, M.C.; Cenni, A.; Marchi, E. Determining exhaust fumes exposure in chainsaw operations. Environ. Pollut. 2016, 218, 1162–1169. [Google Scholar] [CrossRef]
- Nowak, P.; Kucharska, K.; Kamiński, M. Ecological and Health Effects of Lubricant Oils Emitted into the Environment. Int. J. Environ. Res. Public Health 2019, 16, 3002. [Google Scholar] [CrossRef]
- Włodarczyk-Makuła, M. Zagrożenie zanieczyszczenia środowiska wodnego związkami ropopochodnymi. LAB Lab. Apar. Bad. 2013, 21, 12–16. [Google Scholar]
- Wojtkowiak, R.; Tomczak, R.J. Analiza porównawcza wybranych właściwości olejów smarujących układ tnący pilarki łańcuchowej. Rośliny Oleiste 2003, XXIV, 317–325. [Google Scholar]
- Abosede, E.E. Effect of Crude Oil Pollution on some Soil Physical Properties. IOSR J. Agric. Vet. Sci. 2013, 6, 14–17. [Google Scholar] [CrossRef]
- Dmochowska, A.; Dmochowski, D.; Biegugnis, S. Charakterystyka biorekultywacji gleb skażonych produktami ropopochodnymi metodą pryzmowania ex situ. Annu. Set Environ. Prot. 2016, 18, 759–771. [Google Scholar]
- Klamerus-Iwan, A.; Błońska, E.; Lasota, J.; Kalandyk, A.; Waligórski, P. Influence of Oil Contamination on Physical and Biological Properties of Forest Soil After Chainsaw Use. Water Air Soil Pollut. 2015, 226, 389. [Google Scholar] [CrossRef]
- Aluyor, E.O.; Ori-jesu, M. Biodegradation of mineral oils—A review. Afr. J. Biotechnol. 2009, 8, 915–920. [Google Scholar]
- Stelmaszuk, W.; Linowska, E.; Podedworny, I.; Antoniuk, N. Wpływ produktów ropopochodnych na organizmy żywe. In Proceedings of the Związki ropopochodne-kryteria i metodyka oceny skażenia, Karwice, Poland, 14–15 April 1994. [Google Scholar]
- Gawęda, E.; Bednarek, K.; Szydło, Z. Oznaczanie mgły olejowej w powietrzu na stanowiskach pracy metodą wagową. Bezpieczeństwo Pr. 2005, 12, 11–14. [Google Scholar]
- Rogoś, E.; Urbański, A. Charakterystyki tribologiczne roślinnych olejów bazowych dla olejów hydraulicznych. Tribologia 2010, 5, 201–212. [Google Scholar]
- Krzemińska, S.; Irzmańska, E. Zagrożenia olejami mineralnymi na stanowiskach pracy oraz nowe rozwiązania polimerowych materiałów ochronnych w wybranych środkach ochrony indywidualnej. Med. Pr. 2011, 62, 435–443. [Google Scholar]
- Cain, R.B. Biodegradation of Lubricants. In Proceedings of the 8th International Biodeterioration and Biodegradation, Windsor, ON, Canada, 26–31 August 1990; pp. 249–275. [Google Scholar]
- Bartz, W.J. Lubricants and the environment. Tribol. Int. 1998, 31, 35–47. [Google Scholar] [CrossRef]
- Khaled, M.A.R. Biodegradation of used lubricating and diesel oils by a new yeast strain Candida viswanathii KA-2011. Afr. J. Biotechnol. 2012, 11, 14166–14174. [Google Scholar]
- Krasodmosmki, M. Nowoczesne Środki Smarowe do Specjalistycznych Zastosowań w Urządzeniach Przemysłowych, Transporcie i Komunikacji; Instytut Nafty i Gazu—Państwowy Instytut Badawczy: Kraków, Poland, 2015; ISBN 2353-2718. [Google Scholar]
- Lasy Państwowe. Available online: http://www.lasy.gov.pl/pl (accessed on 3 April 2019).
- Lasy Państwowe 2020. Available online: https://www.bdl.lasy.gov.pl/portal/lasy-na-swiecie (accessed on 20 May 2020).
- Decyzja nr 126 z Dnia 12 Sierpnia 2019 r. w Sprawie Udostępnienia Jednolitych Wzorów Dokumentów Oraz Stosowania Standardów Jako-Ściowych Odnoszących Się Do Wszystkich Istotnych Cech Przedmiotu Zamówienia Dotyczących Zamawiania usług Leśnych z Zakresu Gosp; Generalny Dyrektor Lasów Państowywch: Warszawa, Poland, 2019.
- Stryker, W.A. Absorption of liquid petrolatum (“mineral oil”) from the intestine. Arch. Pathol. Lab. Med. Online 1941, 31, 670–692. [Google Scholar]
- Beran, E. Biodegradowalność jako nowe kryterium w ocenie jakości olejów smarowych. Przem. Chem. 2005, 84, 320–328. [Google Scholar]
- Kramer, D.; Lok, B.; Krug, R. The Evolution of Base Oil Technology. In Turbine Lubrication in the 21st Century; ASTM International: West Conshohocken, PA, USA, 2001; pp. 25–38. [Google Scholar]
- Nowak, P.; Kucharska, K.; Kamiński, M. Current legal regulations regarding the emission of lubricating oils to the environment. In Proceedings of the IV Interdyscyplinarna Akademicka Konferencja Ochrony Środowiska, Politechnika Gdańska, Gdańsk, Poland, 5–7 April 2019. [Google Scholar]
- Rozporządzeniu Komisji (WE) NR 440/2008 z Dnia 30 Maja 2008 r. Metoda OECD 301 A-F; Komisja Europejska: Bruksela, Belgia, 2008.
- Rozporządzenie (WE) nr 1907/2006 Parlamentu Europejskiego i Rady w Sprawie Rejestracji, Oceny, Udzielania Zezwoleń i Stosowanych Ograniczeń w Zakresie Chemikaliów (REACH); Parlament Europejski: Strasbourg, France, 2006.
- Organization for Economic Co-operation and Development (2006) OECD Guidlines for the Testing of Chemical; OECD: Paris, France, 2006.
- Wieczorek, A. Oznaczenia składu grupowego olejów bazowych. Naft. Gaz 2018, 74, 67–74. [Google Scholar] [CrossRef]
- Nowak, P.; Kucharska, K.; Kamiński, M. Metody kontroli olejów smarowych emitowanych do środowiska. In Proceedings of the XIV Konferencja Dla Miasta i Środowiska—Problemy Unieszkodliwiania Odpadów, Warszawa, Poland, 26 November 2018. [Google Scholar]
- Iob, A.; Ali, M.A.; Tawabini, B.S.; Abbas, N.M. Hydrocarbon group (PONA) analysis of reformate by FT-i.r. spectroscopy. Fuel 1996, 75, 1060–1064. [Google Scholar] [CrossRef]
- Pawelec, E.; Eksploatacji, I.T. Zastosowanie Spektrofotometrii FT-IR Do Oceny Zmiany Składu Smaru Plastycznego Wskutek Wymuszeń Mechanicznych Nauka Technika; Chemik: Radom, Poland, 2011. [Google Scholar]
- Sharma, K.; Sharma, S.P.; Lahiri, S.C. Characterization and Identification of Petroleum Hydrocarbons and Biomarkers by GC-FTIR and GC-MS. Pet. Sci. Technol. 2009, 27, 1209–1226. [Google Scholar] [CrossRef]
- Rudzinski, W.E.; Aminabhavi, T.M.; Sassman, S.; Watkins, L.M. Isolation and Characterization of the Saturate and Aromatic Fractions of a Maya Crude Oil. Energy Fuels 2000, 14, 839–844. [Google Scholar] [CrossRef]
- Heikal, E.K.; Elmelawy, M.S.; Khalil, S.A.; Elbasuny, N.M. Manufacturing of environment friendly biolubricants from vegetable oils. Egypt. J. Pet. 2017, 26, 53–59. [Google Scholar] [CrossRef]
- Sarpal, A.S.; Kapur, G.S.; Chopra, A.; Jain, S.K.; Srivastava, S.P.; Bhatnagar, A.K. Hydrocarbon characterization of hydrocracked base stocks by one and two-dimensional n.m.r. spectroscopy. Fuel 1996, 75, 483–490. [Google Scholar] [CrossRef]
- Weber, S.; Schrag, K.; Mildau, G.; Kuballa, T.; Walch, S.G.; Lachenmeier, D.W. Analytical Methods for the Determination of Mineral Oil Saturated Hydrocarbons (MOSH) and Mineral Oil Aromatic Hydrocarbons (MOAH)—A Short Review. Anal. Chem. Insights 2018. [Google Scholar] [CrossRef]
- Zieliński, W.; Rajca, A. Metody Spektroskopowe i ich Zastosowanie do Identyfikacji Związków Organicznych; Wydawnictwa Naukowo-Techniczne: Warszawa, Poland, 2000. [Google Scholar]
- Baszanowska, E.; Otremba, Z. Ultraviolet-induced fluorescence of lubricate oils. Combust. Engines 2015, 163, 21–25. [Google Scholar]
- Beens, J. The role of gas chromatography in compositional analyses in the petroleum industry. TrAC Trends Anal. Chem. 2000, 19, 260–275. [Google Scholar] [CrossRef]
- Barman, B.N.; Cebolla, V.L.; Membrado, L. Chromatographic Techniques for Petroleum and Related Products. Crit. Rev. Anal. Chem. 2000, 30, 75–120. [Google Scholar] [CrossRef]
- Hsu, C.S. Characterization of heavy hydrocarbons by coupling high performance liquid chromatography with mass spectrometry (LC/MS). Am. Chem. Soc. Div. Pet. Chem. 2000, 45, 584. [Google Scholar]
- Pei, P.; Britton, J.; Hsu, S. Hydrocarbon Type Separation of Lubricating Base Oil in Multigram Quantity by Preparative HPLC. J. Liq. Chromatogr. 1983, 6, 627–645. [Google Scholar] [CrossRef]
- Gudebska, J. Chromatografia Cieczowa w Oznaczaniu Składu Grupowego Olejów Bazowych i Asfaltów Drogowych; Rozprawa Doktorska: Gdańsk, Poland, 1999. [Google Scholar]
- Ashoori, S.; Sharifi, M.; Masoumi, M.; Mohammad Salehi, M. The relationship between SARA fractions and crude oil stability. Egypt. J. Pet. 2017, 26, 209–213. [Google Scholar] [CrossRef]
- Coutinho, D.M.; França, D.; Vanini, G.; Mendes, L.A.N.; Gomes, A.O.; Pereira, V.B.; Ávila, B.M.F.; Azevedo, D.A. Rapid hydrocarbon group-type semi-quantification in crude oils by comprehensive two-dimensional gas chromatography. Fuel 2018, 220, 379–388. [Google Scholar] [CrossRef]
- Silva, S.L.; Silva, A.M.S.; Ribeiro, J.C.; Martins, F.G.; Da Silva, F.A.; Silva, C.M. Chromatographic and spectroscopic analysis of heavy crude oil mixtures with emphasis in nuclear magnetic resonance spectroscopy: A review. Anal. Chim. Acta 2011, 707, 18–37. [Google Scholar] [CrossRef]
- Choodum, A.; Tripuwanard, K.; Daeid, N.N. Analysis of chain saw lubricating oils commonly used in Thailand’s southern border provinces for forensic science purpose. Forensic Sci. Int. 2014, 241, 60–68. [Google Scholar] [CrossRef] [PubMed]
- Krasodomski, W.; Krasodomski, M. GC/MS application in the structural group analysis of basic lubricant oils. Part I—State of knowledge. Naft. Gaz 2010, 8, 711–718. [Google Scholar]
- Bissada, K.K.; Tan, J.; Szymczyk, E.; Darnell, M.; Mei, M. Group-type characterization of crude oil and bitumen. Part I: Enhanced separation and quantification of saturates, aromatics, resins and asphaltenes (SARA). Org. Geochem. 2016, 95, 21–28. [Google Scholar] [CrossRef]
- Kamiński, M. Studies on Selectivity of Hydrocarbon Group-Type Separation of Petroleum Vacuum Distillates and Base Oils by HPLC. Chem. Analityczna 2003, 48, 531–542. [Google Scholar]
- Robbins, W.K. Quantitative Measurement of Mass and Aromaticity Distributions for Heavy Distillates 1. Capabilities of the HPLC-2 System. J. Chromatogr. Sci. 1998, 36, 457–466. [Google Scholar] [CrossRef]
- Karlsen, D.A.; Larter, S.R. Analysis of petroleum fractions by TLC-FID: Applications to petroleum reservoir description. Org. Geochem. 1991, 17, 603–617. [Google Scholar] [CrossRef]
- Nowak, P.; Kosińska, J.; Glinka, M.; Kamiński, M. The Thin-Layer Microchromatography (μTLC) and TLC–FID Technique as a New Methodology in the Study of Lubricating Oils. J. AOAC Int. 2017, 100, 922–934. [Google Scholar] [CrossRef]
- Jiang, C.; Larter, S.R.; Noke, K.J.; Snowdon, L.R. TLC–FID (Iatroscan) analysis of heavy oil and tar sand samples. Org. Geochem. 2008, 39, 1210–1214. [Google Scholar] [CrossRef]
- Gudebska, J.; Kamiński, M. The method of identification of low-volatile petroleum products utilizing thin-layer chromatography. Chem. Anal. 1998, 43, 859–865. [Google Scholar]
- Kamiński, M.; Gudebska, J.; Górecki, T.; Kartanowicz, R. Optimized conditions for hydrocarbon group type analysis of base oils by thin-layer chromatography-flame ionisation detection. J. Chromatogr. A 2003, 991, 255–266. [Google Scholar] [CrossRef]
- ASTM D1319:2018 Standard Test Method for Hydrocarbon Types in Liquid Petroleum Products by Fluorescent Indicator Adsorption; ASTM International: Ottawa, ON, Canada, 2018.
- PKN. PN EN 12916; PKN: Warsaw, Poland, 2016. [Google Scholar]
- PN-72/C-04025 Oznaczanie Składu Grupowego Węglowodo-Rów Metodą Chromatografii Elucyjnej; PKN: Warsaw, Poland, 2018.
- ASTM D 2007:2016 Standard Test Method for Characteristic Groups in Rubber Extender and Processing Oils and Other Petroleum-Derived Oils by the Clay-Gel Absorption Chromatographic Method; ASTM International: Ottawa, ON, Canada, 2016.
- ASTM D4124-09:2018 Standard Test Method for Separation of Asphalt into Four Fractions; ASTM International: Ottawa, ON, Canada, 2018.
- Habibullah, M.; Masjuki, H.H.; Kalam, M.A.; Ashraful, A.M.; Habib, M.A.; Mobarak, H.M. Effect of Bio-Lubricant on Tribological Characteristics of Steel. Procedia Eng. 2014, 90, 740–745. [Google Scholar] [CrossRef]
- Madankar, C.S.; Dalai, A.K.; Naik, S.N. Green synthesis of biolubricant base stock from canola oil. Ind. Crops Prod. 2013, 44, 139–144. [Google Scholar] [CrossRef]
- Nowak, P.; Kucharska, K.; Kamiński, M.; Rybarczyk, P. A new method and equipment for the detection of presence and estimation of the content of the petroleum-based fraction in lubricating oils, especially those emitted to the atmosphere. Apar. Badaw. Dydakt. 2019, 2, 245–250. [Google Scholar]
- Mattley, Y. Fluorescence of Cutting Oils. Available online: www.oceanoptics.com (accessed on 20 May 2020).
- Vasco, P.; Herrik, E.; Cebolla, V.L.; Membrado, L.; Domingo, P.; Henrion, P.; Garriga, R.; Gonz, P. Quantitative Applications of Fluorescence and Ultraviolet Scanning Densitometry for Compositional Analysis of Petroleum Products in Thin-Layer Chromatography. J. Chromatogr. Sci. 1999. [Google Scholar] [CrossRef]
- Steffens, J.; Landulfo, E.; Courrol, L.C.; Guardani, R. Application of Fluorescence to the Study of Crude Petroleum. J. Fluoresc. 2010, 21, 859–864. [Google Scholar] [CrossRef]
- Szafran, M.; Dega-Szafran, Z. Określanie struktury związków organicznych metodami spektroskopowymi. Tablice i Ćwiczenia; PWN: Warszawa, Poland, 1988. [Google Scholar]
- Nowak, P.; Kamiński, M. Wykorzystanie zjawiska fluorescencji i spektofotometrii dla metod wstępnej oceny grupowego składu olejów i ich komponentów. In Proceedings of the IX Kongres Technologii Chemicznej, Gdańsk, Poland, 3–7 September 2018. [Google Scholar]
- Kyriakids, N.; Skarkalis, P. Fluorescence Spectra Measurement of Olive Oil and Other Vegetable Oils. J. AOAC Int. 2000, 83, 1435–1439. [Google Scholar] [CrossRef]
- Dudley, P.A.; Anderson, R.E. Separation of polyunsaturated fatty acids by argentation thin layer chromatography. Lipids 1975, 10, 113–115. [Google Scholar] [CrossRef]
- Wilson, R.; Sargent, J.R. High-resolution separation of polyunsaturated fatty acids by argentation thin-layer chromatography. J. Chromatogr. A 1992, 623, 403–407. [Google Scholar] [CrossRef]
- Fuchs, B.; Süß, R.; Teuber, K.; Eibisch, M.; Schiller, J. Lipid analysis by thin-layer chromatography—A review of the current state. J. Chromatogr. A 2011, 1218, 2754–2774. [Google Scholar] [CrossRef]
- Myher, J.J.; Kuksis, A. General strategies in chromatographic analysis of lipids. J. Chromatogr. B Biomed. Sci. Appl. 1995, 671, 3–33. [Google Scholar] [CrossRef]
- Buchgraber, M.; Ulberth, F.; Emons, H.; Anklam, E. Triacylglycerol profiling by using chromatographic techniques. Eur. J. Lipid Sci. Technol. 2004, 106, 621–648. [Google Scholar] [CrossRef]
- Snyder, L.R.; Kirkland, J.J.; Dolan, J.W. Introduction to Modern Liquid Chromatography, 3rd ed.; Wiley: Hoboken, NJ, USA, 2010; ISBN 9780470167540. [Google Scholar]
- Totten, G.E.; Westbrook, S.R.; Shah, R.J. (Eds.) Fuels and Lubricants Handbook: Technology, Performance, and Testing; ASTM International: Glen Burnie, MD, USA, 2003. [Google Scholar]
- Morassuti, C.Y.; Lima, S.M.; Dos Santos, F.A.; Andrade, L.H.D.C. Fluorescence spectroscopy applied in lubricant oils. Orbital Electron. J. Chem. 2018, 10, 42. [Google Scholar] [CrossRef]
- Gromadzka, J.; Wardencki, W. Trends in edible vegetable oils analysis. Part B. Application of different analytical techniques. Polish J. Food Nutr. Sci. 2011, 61, 89–99. [Google Scholar] [CrossRef]
- Gonçalves, R.P.; Março, P.H.; Valderrama, P. Thermal edible oil evaluation by UV–Vis spectroscopy and chemometrics. Food Chem. 2014, 163, 83–86. [Google Scholar] [CrossRef] [PubMed]
- Zhang, W.; Li, N.; Feng, Y.; Su, S.; Li, T.; Liang, B. A unique quantitative method of acid value of edible oils and studying the impact of heating on edible oils by UV–Vis spectrometry. Food Chem. 2015, 185, 326–332. [Google Scholar] [CrossRef]
- Drabik, J.; Pawelec, E. Monitorowanie Stabilności Oksydacyjnej Oleju Rzepakowego na Różnych Etapach Procesu Termooksydacji Metodą Spektrofotometrii UV-VIS; Instytut Technologii Eksploatacji—Państwowy Instytut Badawczy: Radom, Poland, 2011. [Google Scholar]
- Shankar, R.; Jung, J.-H.; Loh, A.; An, J.G.; Ha, S.Y.; Yim, U.H. Environmental significance of lubricant oil: A systematic study of photooxidation and its consequences. Water Res. 2020, 168, 115183. [Google Scholar] [CrossRef]
- Adhvaryu, A.; Liu, Z.; Erhan, S.Z. Synthesis of novel alkoxylated triacylglycerols and their lubricant base oil properties. Ind. Crops Prod. 2005, 21, 113–119. [Google Scholar] [CrossRef]
- Matwijczuk, A.; Oniszczuk, T.; Matwijczuk, A.; Chruściel, E.; Kocira, A.; Niemczynowicz, A.; Wójtowicz, A.; Combrzyński, M.; Wiącek, D. Use of FTIR Spectroscopy and Chemometrics with Respect to Storage Conditions of Moldavian Dragonhead Oil. Sustainability 2019, 11, 6414. [Google Scholar] [CrossRef]
- ASTM E2412-10(2018). In Standard Practice for Condition Monitoring of In-Service Lubricants by Trend Analysis Using Fourier Transform Infrared (FT-IR) Spectrometry; ASTM International: Ottawa, ON, Canada, 2018.
- Aluyor, E.O.; Ibom, A. Chromatographic analysis of vegetable oils: A review. Sci. Res. Essays 2009, 4, 191–197. [Google Scholar]
- Ali, M.; Hassan, A. Hydrocarbon group types analysis of petroleum products: A comparative evaluation of HPLC and TLC analytical performance. Pet. Sci. Technol. 2002, 20, 771–782. [Google Scholar] [CrossRef]
© 2020 by the authors. Licensee MDPI, Basel, Switzerland. This article is an open access article distributed under the terms and conditions of the Creative Commons Attribution (CC BY) license (http://creativecommons.org/licenses/by/4.0/).