Abstract
This paper intends to prepare a nanofluid sample by suspending Multi-walled Carbon Nanotubes (MWCNTs) at 0.005g/L concentration and analyze the behavior of electrical and dielectric properties based on the International Electrotechnical Commision test method. In order to validate the effectiveness of MWCNT nanofluid, alternating current breakdown voltage (BDV), negative polarity lightning impulse (LI), dielectric permittivity, dissipation factor (DF), DC resistivity and Raman structural measurement are executed accordingly. In the following, an analysis of the statistical distribution using the two-parameter Weibull distribution law of BDV and LI are evaluated at four experimental conditions to predict the probability of breakdown occurring at different percentages. Based on the observation, the MWCNT filler has a substantial effect in improving the BDV and LI characteristics of disposed mineral oil. The permittivity, DF and resistivity performance of MWCNT nanofluid from 25 °C to 90 °C also produces comparable and reliable performance as a fresh transformer oil. As for Raman structure, the revolution of transformer oil by doping MWCNT does not disrupt the original chemical structure of mineral oil. Hence, this study proves the improvement of the electrical and the behavior of dielectric properties and chemical structure of nanofluid, providing a huge contribution towards the development of insulating materials for transformer application.
1. Introduction
Expanding interest for electric power has prompted the development of transformers with exceptional protection. For a number of decades, industries have been concentrating more on improving the efficiency—one of the main components in the transformer—of insulating liquids, known as transformer oil. Precisely, the main function of transformer oil is to insulate parts of transformer, and it serves as a coolant medium, and suppresses arcing and corona discharge. From the beginning of energy evolution, mineral oil has been the most preferred transformer oil as described in IEC60296 [1]. Mineral oil is generally obtained by fractional distillation and subsequent refining treatment of crude natural petroleum. The main components are alkanes, naphthenic saturated hydrocarbons, aromatic unsaturated hydrocarbons, and other compounds. Mineral oil has been selected as transformer oil for decades due to its adequate pouring point at low temperatures, great thermal cooling capacity, high efficiency and accessibility on the market. Despite that, mineral oil has a few disadvantages, such as high fire hazard, low biodegradability potential and the threat of running out resources in the future.
Several university research centers, manufacturers and users of power transformers have conducted studies on natural ester oil as a conventional transformer oil because of its biodegradability. However, natural ester oil possesses higher viscosity and lower oxidative stability compared to mineral oil. Hence, some other researchers studied around improving electrical properties, dielectric properties and thermal efficiency of mineral and natural ester oil by suspending various types of nanoparticles. Instead, according to a few studies, nanoparticles have the capacity of trapping free electrons due to polarization, which slows down the formation of streamers in the presence of impurities in the oil, and thus increases the dielectric performance of the oil [2,3]. From an economic point of view, nanoparticles added into oil, known as nanofluids, could minimize the weight, size and costs of a transformer.
Based on the results reported in Figure 1 and Figure 2, there were some improvements and limitations recorded on alternating the current breakdown strength (BDV) and lightning impulse (LI) of nanofluid-based mineral oil and natural ester oil. According to Salas et al., the BDV of fresh mineral oil can be improved more than 20% with the addition of Ferrofluid (FF) and Tin oxide (TO) [4]. Furthermore, Carbon Nanotubes (CNTs) with high thermal conductivities display greatly improved dielectric strength, by 73.02% after the dispersing of 0.01g/L of CNT nano-filler in the transformer oil [5]. On the other hand, LI tests have demonstrated a slight improvement, and also a tendency to decrease in the previous studies. Detailed analysis reveals that the kind of nanomaterials as well as their surface chemistry has a significant impact on the result of the electrical properties.
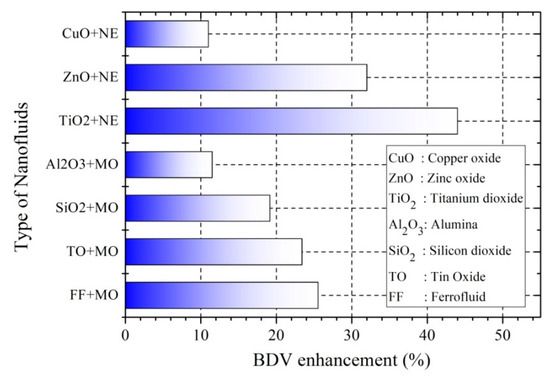
Figure 1.
Reports on the breakdown voltage performance of nanofluids [4,6].
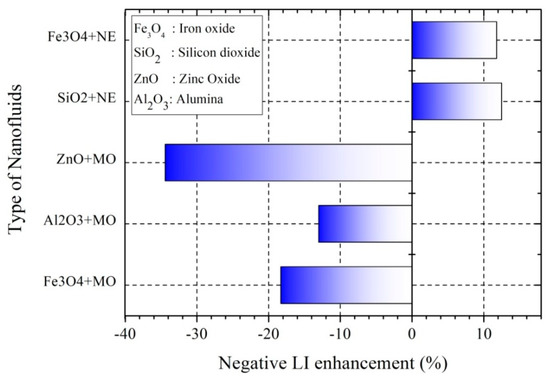
Figure 2.
Reports on the LI performance of nanofluids [6,7].
Although various studies have discovered the capability of nanofluids as alternatives for better transformer oil, there is very limited data availability on the suspension of MWCNT with disposed and wasted transformer oil. The main purpose of this paper is to retreat, recycle and reclaim the disposed mineral oil by adding some nanomaterial to enhance its electrical and dielectric performance, as outlined by the IEC standard. In the first part of this paper, comparisons of change in BDV and LI in terms of the experimental conditions of oil samples are discussed. Probability failure analysis of oil samples for the conformity of the experimental data is also performed by applying the Weibull two-parameter distribution. Weibull distribution constitutes a helpful tool in the design and maintenance of transformers by improvising the predictability of the insulating oil performance. The second part is devoted to the analysis of dielectric measurements of disposed transformer oil and MWCNT nanofluid-based mineral oil, while the third part consists of the observation of the chemical structure behavior of transformer oil before and after the dispersion process occurs.
2. Experimental Setup
2.1. Sample Preparation
The petroleum-based mineral oil (MO) used in this experiment was disposed and wasted by an industry because of its quality, which did not meet the IEC standard requirement. It was operated for 10 years in a 33/11.5kV and 16/20MVA rating transformer, since 15 October 2009. Listed below is the information of the transformer oil given by the industry:
- Date of transformer oil: 15th October 2009
- Manufacturer: Shell
- Brand Name: DIALA S3 ZX-I
- Viscosity, kinematic (40 °C): 8.0
- Viscosity, kinematic (100 °C): 720
- Density (15 °C): 0.881
- Flash Point, open cup: 139 °C
- Pour Point: −60 °C
Figure 3 and Table 1 depict Scanning Electron Microscopy (SEM) and properties of MWCNT. Generally, there are 4 types of oil samples with different conditions, as shown in Table 2. Initially, the first sample is tested directly without any treatment or process. The second sample is filtered by using a Nalgene Rapid-Flow disposable filter with 0.2 µm pore size for 3 repetitions, while the third sample also goes through a similar process, is filtered and then dried and degassed in a vacuum-drying oven at 85 °C and 10 Mbar for 48 h as per IEC60156 [8] (standard treatment oil) procedure. As for the last sample (nanofluid), MWCNT with 0.005 g/L concentration is agitated and doped into the filtered MO by using a magnetic stirrer and an ultra-sonicator for 120 min. A concentration of 0.005 g/L was selected, as it showed the best dielectric performance compared to other concentrations in our case study. The sonicator utilized in this experiment is the conversion of an electrical signal into a physical vibration with the use of sound energy in liquids containing filler for the purpose of agitation and separation of substances. After the sonication process, the fourth sample is dried and degassed in a vacuum drying oven at 60 °C and 10 Mbar for 24 h [9].The nanofluid production process is illustrated in Figure 4.
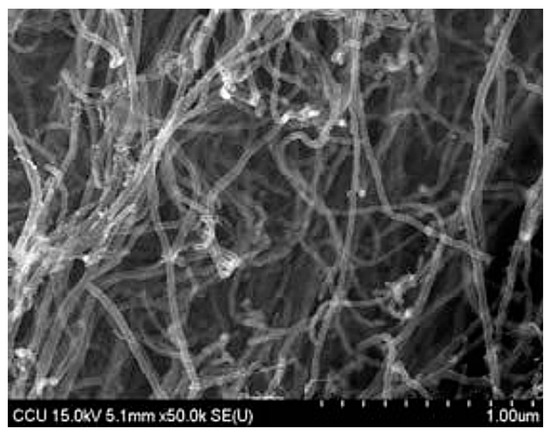
Figure 3.
Scanning Electron Microscopy (SEM) image of Multi-walled Carbon Nanotube.

Table 1.
Properties of Multi-walled Carbon Nanotubes (MWCNTs) involved in this work.
Table 2.
Types of specimen involved in this work.
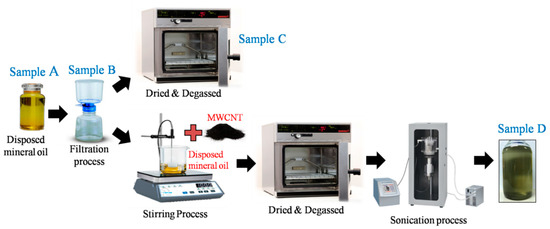
Figure 4.
Preparation process of MWCNT nanofluid.
2.2. Alternating Current Breakdown Voltage Measurement
The BDV measurement is measured in compliance with IEC60156 standards [8]. Each oil samples are filled in a test cell of 500 mL volume and placed horizontally in the BDV testing device (BAUR DTA 100C) containing two semi-elliptical steel electrodes and at a distance 2.5 ± 0.05 mm. The input voltage (90–240 V) at power frequency (50/60 Hz) is continuously injected through the electrode terminals and increased step-by-step at a speed of 2 kV/s until the appearance of spark. The output BDV is up to 100 kV with ± 1 kV accuracy and each measurement of oil samples is repeated 50 times. In order to dissipate the gasses that arise during the electrical discharge, 2 min of rest time between each measurement is allotted. Note that the test cell and electrodes must be clean and dry each time before measuring the BDV of the next oil samples. Based on reliable and informative BDV results, the quality of the insulating oil samples can be determined and compared.
2.3. Lightning Impulse Test Setup
The LI breakdown test of oil samples is carried out in a self-designed transparent oil container consisting of a needle-plane electrode, as shown in Figure 5.
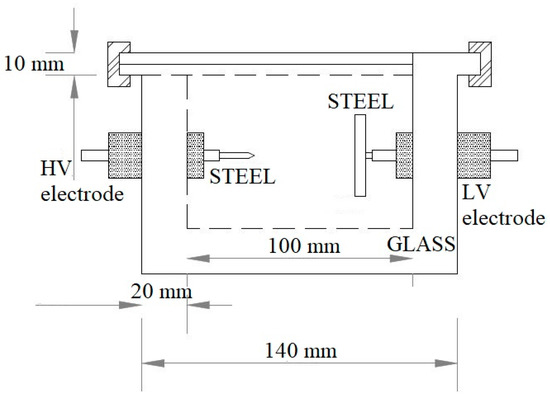
Figure 5.
Self-designed transparent test oil container for testing oil samples in the lightning impulse test.
The needle electrode is connected to the LI source, while the plane electrode with a 35 diameter size is solidly grounded with a 25 ± 1 mm gap distance [10]. Approximately 450 mL volume of oil sample is required for each breakdown test. Due to the negative breakdown, the voltage is generally higher than the positive one at the same gap distance, hence, this experiment focuses on the measurement of LI at a negative polarity, respectively [11]. The schematic diagram and experimental setup, including the LI generating setup, is shown in Figure 6 and Figure 7.
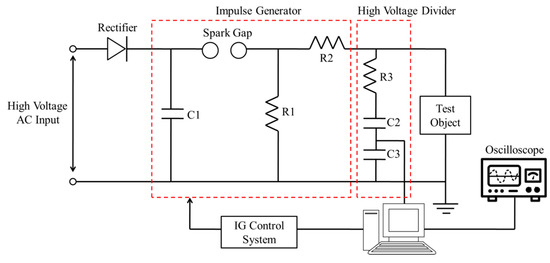
Figure 6.
Schematic of lightning impulse measurement.
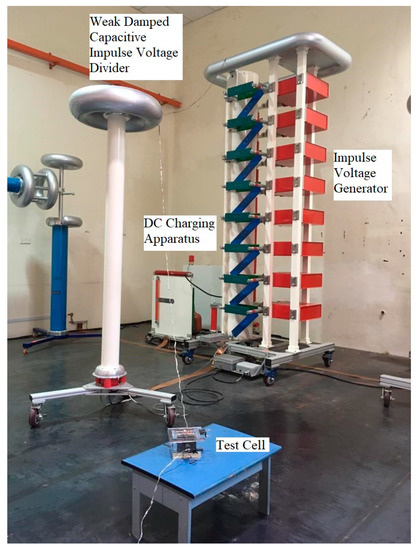
Figure 7.
Lightning impulse laboratory setup.
The test setup consists of a few phases, commenced with a 0–50 kV test voltage DC charging unit with a 5 kVA rate capacitance. It is connected to the impulse voltage generator to provide suitable charging, depending on the impulse energy needed. A motorized control unit system is used to alternate the polarity of the LI generator and gap distance between the spark gap. The 8-stage Marx generator with a maximum voltage of 800 kV is used to generate the standard LI waveform of 1.2/50 µs time period. Then, the weak damped capacitive voltage divider is connected with a generator for measuring the LI full wave voltage, in accordance with IEC 60060-2, shown in a digital storage oscilloscope integrated with a PC.
The rising voltage method, as per IEC60897, is usually preferable to test the oil samples rather than up-down and multiple-level methods because it requires less time and the output of data is almost consistent and reliable [12]. Therefore, the rising method is implemented in this study by injecting one impulse shot per step voltage of 10 kV to the oil samples until breakdown occurs. Next, the voltage applied is reduced and the previous procedure is repeated 15 times with a two-minute time interval between two successive impulse shots for the recovering process [13].
2.4. Dielectric Measurements
Permittivity, DF and resistivity are key parameters for evaluating insulating oil conditions in transformer application. The experimental measurement was carried out for oil samples from an ambient temperature until 120 °C to study the aforementioned properties by utilizing ADTR-2K PLUS equipment. In this paper, the focus was on dielectric measurements of oil samples at a 25 °C and 90 °C temperature. This is because, after charging a transformer after a long shut down, the temperature of the oil will be at an ambient temperature and, during full load, the temperature will be very high and may go up to 90 °C at an overload condition.
2.5. Raman Spectroscopy Analysis
Raman spectroscopy is based on the inelastic scattering of light for analyzing chemical identity and structure behavior of material. It is a very effective method to characterize the detailed bonding structure state of the 4 oil samples with different conditions. The Renishaw Raman instrument consists of an in Via confocal Raman microscope, a combination/hybrid system (SEM-Raman and SPM/AFM-Raman) (Gloucestershire, United Kingdom), and a portable Raman analyzer (RA100 fiber probe instrument), and Renishaw’s WiRE (Window-based Raman Environment) software (Subang Jaya, Malaysia) is utilized in this study to provide dedicated data processing and analysis options.
3. Experimental Setup
3.1. Weibull Analysis of AC BDV Measurements
Statistical studies are performed in this work to predict the performance of the insulating oil at different percentages (1%, 50% and 90%). The two-parameter Weibull distribution, F, is applied,
where, α is the scale parameter which indicates the scattering of data, while β is the shape parameter which indicates the slope of the reference line. A total of 50 successive BDV measurements are computed into the Weibull distribution analysis. The information of BDV is depicted in Figure 8 and Table 3 summarizes the results of each oil sample. The box chart illustrates the maximum, minimum, and average of BDV for four oil samples at different conditions.
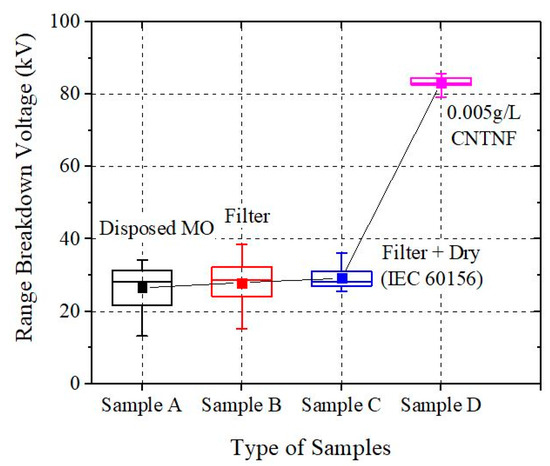
Figure 8.
Box chart of breakdown voltage measurements for all types of oil samples.
Table 3.
Descriptive statistic of fifty AC breakdown voltage values for different oil samples.
Based on Figure 8, there is a slight increment that can be observed from sample A to sample C. There is a stringent need for transformer oil filtration, because during the operation, the transformer gets contaminated by decay items, mechanical impurities, and fading products, and it might become polluted in the vessel in which it is stored in. Hence, the filtration process is an efficient process which discards the unwanted solid particles. As for the drying process, it helps to manage the moisture content level in the disposed transformer oil. Notably, under normal circumstances, the transformer oil is capable of absorbing large amounts of gas, and the most adverse effects caused by gas in transformer oils are due to the presence of oxygen. Oxygen can cause oxidation, which affects the entire insulation system in the transformer. Therefore, the degassing process extracts gasses from the oil and protects the transformer oil from oxidation. As for sample D, there is a huge enhancement observed in the breakdown voltage value after being suspended with 0.005 g/L MWCNT (sample D), as much as 212.58% compared to sample A. Not only that, but sample D’s standard deviation is also extremely small, meaning that the BDV data of sample D are clustered around the average value (83.24 kV), approximately. It is deduced that MWCNT might provide a huge contribution in improving the electrical breakdown properties, as this value indicates higher BDV compared to fresh mineral oil (70 kV) [8].
Figure 9 depicts the Weibull plot of 50 BDV measurements, and Table 4 lists the BDV probability at 1%, 50% and 90%. It is clearly observed that the BDV value of sample D is further to the right than other samples. In particular, significant increments of as much as 490.67%, 207.96%, and 155.99% at 1%, 50% and 90%, respectively, are observed with the addition of MWCNT nanomaterial. A previous author has explained these circumstances, detailing that nano-sized particles are capable of trapping electrons in the insulating oil, providing better results in BDV performance [14]. The dielectric breakdown mechanism is related to the transportation process of electrons in insulating oil, which involves electron hopping in traps and transportation in a delocalized state. The fast electrons developed at a high electric field can be captured and released by the MWCNT shallow trap. Thus, fast electrons will be converted into slower electrons due to these repeatable trapping and de-trapping processes in the insulation, while moving from high electric fields to low electric field regions.
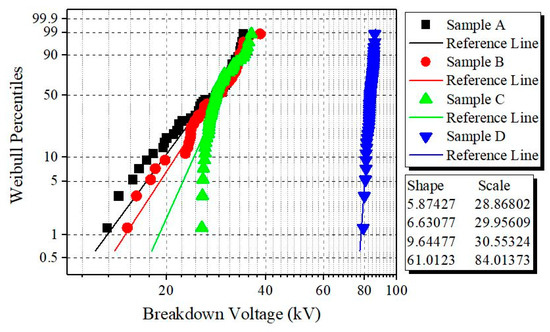
Figure 9.
Weibull distribution results of fifty breakdown voltage data at various sample method preparations.
Table 4.
Probability of 1%, 50% and 90% breakdown voltage values of various oil samples with different treatments.
3.2. Weibull Analysis of LI Measurements
Figure 10 and Table 5 show the box chart of the LI breakdown results of four oil samples at different conditions. It is observed that the LI breakdown values initially drop from sample A to sample C, and increase after being dispersed with 0.005g/L of MWCNT. The repeated lightning impulse test might impose an effect on the oil samples, causing a slight decrement in the degree of polymerization [15]. This also might be due to the volume effect in oil that plays a significant role in the process of discharge initiation [16]. After the filtration, drying and degassing processes, the volume of transformer oil will be slightly decreased. However, after the suspension of MWCNT in the disposed transformer oil, it is observed that the average of LI is 14.16% improved compared to sample A. If referring to the standard deviation and the range between the maximum and minimum value of 15 measurements, sample D also generates the lowest value compared to the other samples.
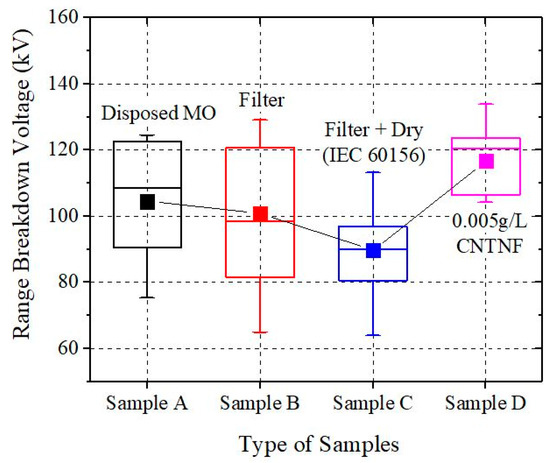
Figure 10.
Box chart of lightning impulse measurements for all types of oil samples.
Table 5.
Descriptive statistic of fifteen lightning impulse breakdown voltages values for different oil samples.
Figure 11 and Table 6 depict the Weibull plot and three probability percentages of four types of samples developed from the Weibull two-parameter distribution. It is observed that sample D shows a slight improvement of LI at a negative polarity, respectively. There is a 49.56% increment observed at the riskiest level of failure, while there is a 10.97% increment at 50% probability. It also can be seen that the LI breakdown value did not improve significantly, although it did in MO through the filtering and drying process.
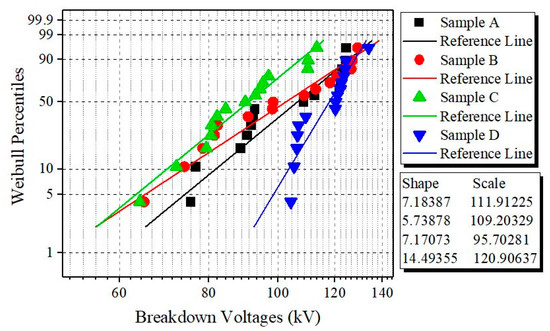
Figure 11.
Weibull distribution results of fifteen lightning impulse breakdown data at various sample method preparations.
Table 6.
Probability of 1%, 50% and 90% lightning impulse breakdown voltage values of various oil samples with different treatments.
This may be further explained as follows. The breakdown is the consequence of conductive pathway forms in insulating oils, named “streamers”. In the process of streamer development, the ionization of oil molecules initiates at the tip of the needle electrode (high local field region) and propagate towards the low field region [17]. Molecule ionization in insulating oil occurs when they encounter high electric field levels, resulting in the creation of a large amount of space charges. The accumulation of space charge in oil samples is considered to be one of the key factors that could exert a non-negligible effect on the electric field and affect the effectiveness of the breakdown mechanism. Meanwhile, as the generated electrons have lighter mass, a greater motion speed and are able to migrate across the molecules compared to the positive charges, the electrons quickly start being swept away from the ionization zone. The fast electrons cause a propagating electric field wave through the oil medium, leading to the breakdown behavior. However, MWCNT has a strong electron adsorption capacity, known as electro-negativity, which results in a reduction of the number of electrons that participate in the formation of electron avalanches under an electric field, hence, they disrupt the development of streamers and enhance the LI breakdown performance.
3.3. Dielectric Permittivity
Figure 12 depicts a comparison of the permittivity for four oil samples at different conditions from an ambient temperature up to120 °C. Referring to the progression of permittivity along the temperature, it is observed that all samples have a slight decrement, except for sample D. Dielectric permittivity refers to molecules polarized by an electric field in dielectric material. At a higher temperature, the polar molecule heat movements are aggravated, causing molecules in oil to move and vibrate. Consequently, this contributes to a decrement in polarization. As for sample D, a further decrease of permittivity at 60 °C leads to an increase in electrical stress of liquid insulation, while the electrical stress of solid insulation is reduced. This is because the permittivity is inversely proportional to the intensity of the electric field. If there are two dielectric materials operating synchronously in a transformer, the lower-value permittivity will experience more electrical stress. Meanwhile, this situation will prevent the aging of solid insulation (insulating paper) and thus improve the life expectancy of the transformer [18].
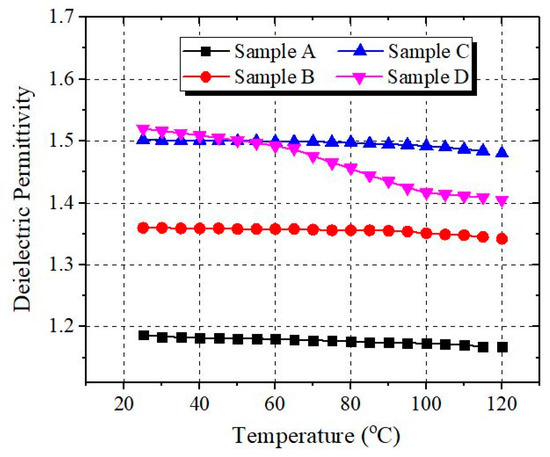
Figure 12.
Permittivity of oil samples at various temperatures.
Figure 13 and Figure 14 show the influence of permittivity towards BDV and LI at 25 °C and 90 °C for all oil samples. It is observed that, at an ambient temperature (25 °C), the pattern of samples increases along with BDV. The permittivity of sample D obtained the highest value compared to the others, as well as the value of BDV and LI. However, this situation differs from the measurement of permittivity at 90 °C, where sample C obtains the highest permittivity, opposite to the results of LI. Nevertheless, the result permittivity value for sample D was 22.13% higher than the disposed transformer oil without any treatment, with only −4.01% differences compared to sample C.
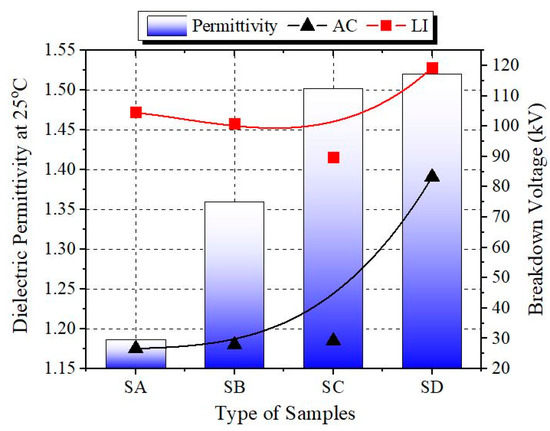
Figure 13.
Influence permittivity of oil samples towards breakdown voltage (BDV) and lightning impulse (LI) measurements at ambient temperature.
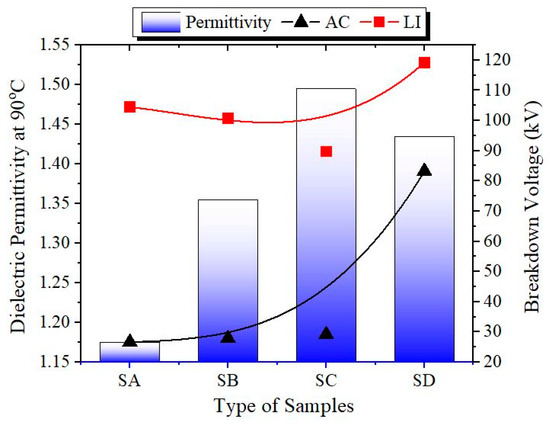
Figure 14.
Influence permittivity of oil samples towards BDV and LI measurements at full-load transformer conditions.
3.4. Dissipation Factor
Figure 15 shows the temperature dependence of DF for sample A, B, C and D. From this figure, it is clear that the DF value of all oil samples decreases exponentially with an increase in the temperature. It is also observed that sample A has a steeper slope compared to the others, which indicates the ageing of the insulation, and contamination. As for sample D, the DF constantly remains within the range of 0.001 to 0.01. The Tan δ testing method is a diagnostic technique used to determine the quality of the insulating oils. It is desirable to have the DF as low as possible due to the low resistive component of the current, which indicates a high resistive insulation.
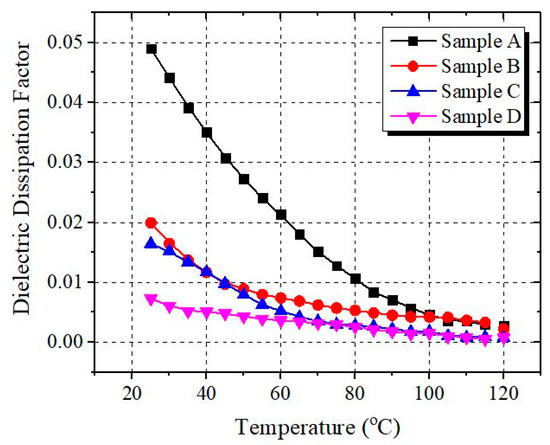
Figure 15.
Dielectric dissipation factor of oil samples at various temperatures.
Focusing on the DF value for 25 °C (Figure 16) and 90 °C (Figure 17), the graph of DF decreases after a few treatment processes are applied. Generally, DF represents the ratio of energy loss to the total energy transmitted through the insulating oil. According to IEC 60422 [19], a catastrophic failure is reported if the DF value achieves 0.04 values and, based on the fresh mineral oil measurement (IEC 247), if the DF value is less than 0.0016. It is observed that sample D strongly achieves that recommended value for both normal and full load conditions of the transformer. Compared to BDV and LI breakdown results, we observed that the DF of sample D also reflected BDV and LI breakdown performances.
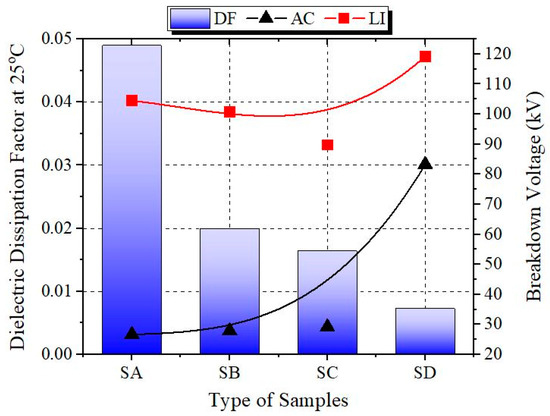
Figure 16.
Influence dissipation factor of oil samples towards AC breakdown voltage and lightning impulse measurement at an ambient temperature.
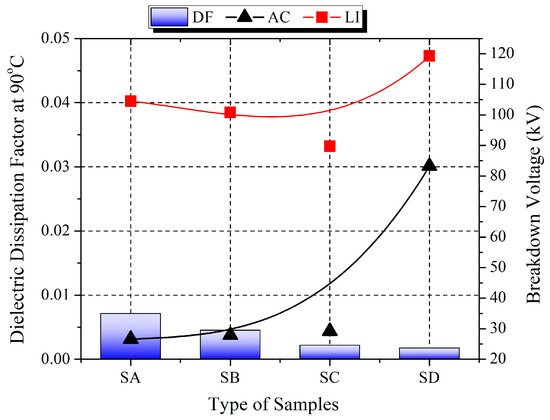
Figure 17.
Influence dissipation factor of oil samples towards AC breakdown voltage and lightning impulse measurement at full-load transformer conditions.
3.5. DC Resistivity
Another important parameter of transformer oil is resistivity, known as specific resistance, where the ratio of the DC potential gradient (volts per centimeter) is parallel to the current flow within the insulating oil. Figure 18 demonstrates the resistivity for all oil samples from an ambient temperature up to a 120 °C temperature, while Figure 19 and Figure 20 focus on resistivity at 25 °C and 90 °C temperatures. It is observed that, with increasing temperature, the resistivity of oil samples exponentially decreases, and the best resistivity is obtained for sample D followed respectively by sample C, B and sample A. The resistivity of the transformer oil must be high at room temperature and should have a good value at high temperatures as well.
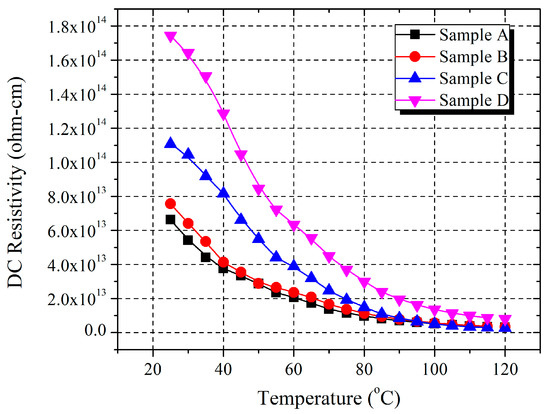
Figure 18.
DC resistivity of oil samples at various temperatures.
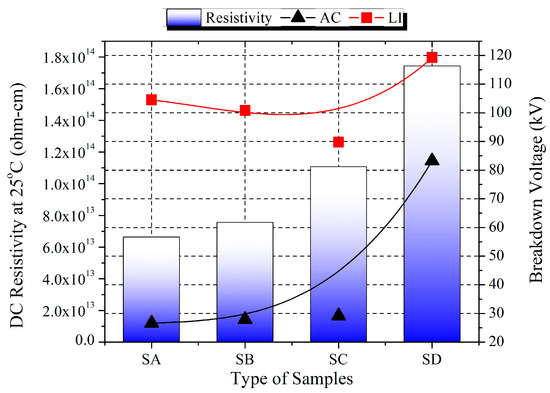
Figure 19.
Influence DC resistivity of oil samples towards breakdown voltage and lightning impulse measurements at ambient temperature.
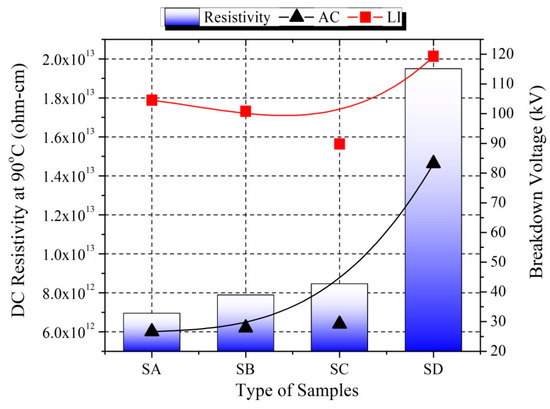
Figure 20.
Influence DC resistivity of oil samples towards breakdown voltage and lightning impulse measurements at full-load transformer condition.
Referring to Figure 19 and Figure 20, when observing the resistivity at 25 °C and 90 °C temperatures, sample D obtains the highest resistivity value for both conditions, which reflects with the BDV and LI breakdown performances. A high resistivity value reflects the low presence of free ions and low concentrations of conductive contaminants. It also helps us to judge the degree of aging, and the pollution level of the insulating oil.
3.6. Raman Structural Information
Figure 21 represents the Raman spectrum measurements of CNT nanofluids ranging from 1300 cm−1 to 3200 cm−1 Raman shifts. It is observed that there are no additional peaks associated with impurity, as all the samples showed numerous features, which are related to complex oil structures and agree well with Somekawa [20].
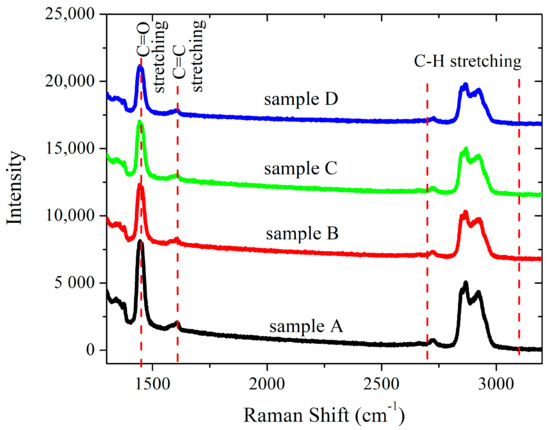
Figure 21.
Raman structure of oil samples between 1300 cm−1 to 3200 cm−1 Ramanshifts.
The sharper and large peak centered at 1450 cm−1 corresponds to the C=O stretching vibration mode, and the peak at 1610 cm−1 is due to an aromatic C=C stretching mode. In the higher wave-number side, the large peak at the 2700–3100 cm−1 region shows a C–H stretching mode which is indicative of the presence of compounds (CH, CH2 and CH3 group) [21,22]. Figure 22 focuses on the first-order (1100–1800 cm−1) and the second-order region (2200–3400 cm−1) of Raman spectrum measurements. Referring to the Raman spectra of the first-order and second-order region, it is analyzed that the peak of the oil sample after doping with CNT reduced about 37% to 47% compared to base oil, which means that Sample D has less crystalline or an improper arrangement of atoms in the lattice.
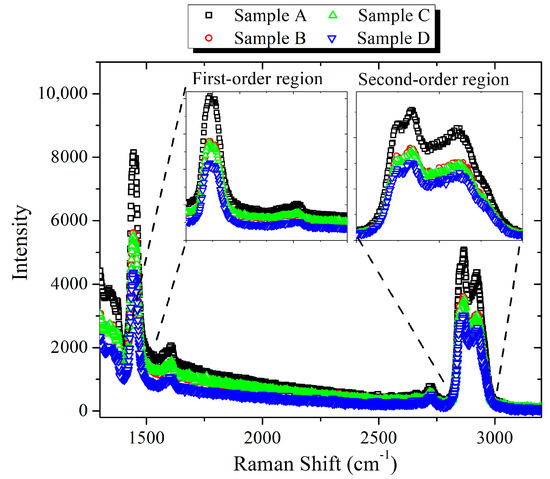
Figure 22.
First order and second order region of Raman structure.
4. Discussion
Laboratory experiments on the BDV and LI characteristics of disposed MO (Sample A), filtered (Sample B), treated MO according to IEC standard (Sample C) and proposed CNT-based MO (Sample D) were carried out in this paper. Statistical variations in different sets of data obtained from the BDV and LI breakdown voltage test are also analyzed using the two-parameter Weibull distribution to predict the probability breakdown failure at different circumstances. It is observed that MWCNT has significant influence on improving the BDV and LI breakdown voltage of disposed MO. An enhancement of 490.67% in BDV and 49.50% in LI breakdown was observed with a 0.005 g/L concentration of nanofluid at the riskiest level of failure (1% Weibull distribution). The increment attained in the AC and lightning impulse breakdown voltage is due to a reduction in charge trapping and de-trapping, stemming from the MWCNT. However, the effect of different concentrations of MWCNT on the electrical and dielectric behavior of disposed oil insulation is recommended to be investigated in future studies. As for dielectric properties, all parameters of sample D are reflected by the behavior of BDV in this experiment, and are comparable with the fresh commercial mineral oil. Information from each test and the results considered together may form the basis for making judgment on whether it is suitable for transformer application.
Author Contributions
Investigation, N.S.S., M.H.A.H. and N.A.M.A.; Resources, W.F.H.W.Z.; Validation, M.F.M.D., A.R.A.R. and J.W.; Writing—original draft, N.S.S.; Writing—review & editing, N.S.S. and M.F.M.D. All authors have read and agreed to the published version of the manuscript.
Funding
This research was funded by Ministry of Higher Education, FRGS/1/2019/STG07/UPNM/02/7.
Conflicts of Interest
The authors declare no conflict of interest.
References
- Herlenius, N.; Rasco, J.; Casserly, E. New IEC 60296 (ed.4) From a Transformer Oil Manufacturer’s Perspective. In Proceedings of the Transformer Life Management Conference, Hannover, Germany, 17–18 September 2014; pp. 1–6. [Google Scholar]
- Li, J.; Du, B.; Wang, F.; Yao, W.; Yao, S. The effect of nanoparticle surfactant polarization on trapping depth of vegetable insulating oil-based nanofluids. Phys. Lett. Sect. A Gen. At. Solid State Phys. 2016. [Google Scholar] [CrossRef]
- Thabet, A.; Shaaban, S.A.; Allam, M. Enhancing dielectric constant of transformer oils using multi-nanoparticles technique under thermal conditions. In Proceedings of the 2016 18th International Middle-East Power Systems Conference (MEPCON), Cairo, Egypt, 27–29 December 2016; pp. 220–225. [Google Scholar] [CrossRef]
- Salas, C.O.; Diego, I.F.; Fernández, F.O.; Estébanez, C.R.; Remesal, S.P. Dielectric properties enhancement of vegetable transformer oil with TiO2,CuO and ZnO nanoparticles. Renew. Energy Power Qual. J. 2018, 1, 623–627. [Google Scholar]
- Suhaimi, N.S.; Ishak, M.T.; Din, M.F.; Ariffin, M.M.; Razali, S.; Amin, N.A.; Hashim, F.R. Breakdown strength of transformer oil filled with carbon nanotubes under various gap distances. J. Fundam. Appl. Sci. 2017, 9, 41. [Google Scholar] [CrossRef]
- Potivejkul, S.; Jariyanurat, K.; Pattanadech, N.; Wattakapaiboon, W. Electrical characteristics of natural ester based nanofluid. In Proceedings of the 2017 International Electrical Engineering Congress (iEECON), Pattaya, Thailand, 8–10 March 2017. [Google Scholar] [CrossRef]
- Rafiq, M.; Li, C.; Ge, Y.; Lv, Y.; Yi, K. Effect of Fe3O4 nanoparticle concentrations on dielectric property of transformer oil. In Proceedings of the 2016 IEEE International Conference on High Voltage Engineering and Application (ICHVE), Chengdu, China, 19–22 September 2016. [Google Scholar] [CrossRef]
- International Electrotechnical Commission. IEC 60156 Insulating Liquids—Determination of the Breakdown Voltage at Power Frequency—Test Method; International Electrotechnical Commission: Geneva, Switzerland, 2018. [Google Scholar]
- Zakaria, I.H.; Ahmad, M.H.; Arief, Y.Z.; Awang, N.A.; Ahmad, N.A. Characteristics of mineral oil-based nanofluids for power transformer application. Int. J. Electr. Comput. Eng. 2017. [Google Scholar] [CrossRef]
- Liang, S.; Wang, F.; Huang, Z.; Chen, W.; Wang, Y.; Li, J. Significantly Improved Electrical Breakdown Strength of Natural Ester Liquid Dielectrics by Doping Ultraviolet Absorbing Molecules. IEEE Access 2019. [Google Scholar] [CrossRef]
- Wang, Z.; Zhou, Y.; Lu, W.; Peng, N.; Chen, W. The impact of TiO2 nanoparticle concentration levels on impulse breakdown performance of mineral oil-based nanofluids. Nanomaterials 2019, 9, 627. [Google Scholar] [CrossRef] [PubMed]
- Katim, N.I.A.; Ishak, M.T.; Amin, N.A.M.; Hamid, M.H.A.; Ahmad, K.A.; Azis, N. Lightning Breakdown Voltage Evaluation of Palm Oil and Coconut Oil as Transformer Oil under Quasi-Uniform Field Conditions. Energies 2018, 11, 2676. [Google Scholar] [CrossRef]
- International Electrotechnical Commission. IEC 60897-Methods for Determination of the Lightning Impulse Breakdown Voltage of Insulating Liquids; International Electrotechnical Commission: Geneva, Switzerland, 1987. [Google Scholar]
- Du, Y.; Lv, Y.; Li, C.; Chen, M.; Zhou, J.; Li, X.; Zhou, Y.; Tu, Y. Effect of electron shallow trap on breakdown performance of transformer oil-based nanofluids. J. Appl. Phys. 2011, 110. [Google Scholar] [CrossRef]
- Sun, P.; Sima, W.; Yang, M.; Wu, J.; Hua, J. Accumulative effect of repeated lightning impulses on transformer insulation: Mechanism analysis. IEEE Trans. Dielectr. Electr. Insul. 2016, 23, 2430–2437. [Google Scholar] [CrossRef]
- Rozga, P.; Hantsz, D. Influence of volume effect on electrical discharge initiation in mineral oil in the setup of insulated electrodes. Electr. Eng. 2017, 99, 179–186. [Google Scholar] [CrossRef]
- Chen, J.; Sun, P.; Sima, W.; Shao, Q.; Ye, L.; Li, C. A promising nano-insulating-oil for industrial application: Electrical properties and modification mechanism. Nanomaterials 2019, 9, 788. [Google Scholar] [CrossRef] [PubMed]
- Yadav, N.; Jarial, R.K.; Rao, U.M. Characterization of mineral oil based Fe3O4 nanofluid for application in oil filled transformers. Int. J. Electr. Eng. Inform. 2018. [Google Scholar] [CrossRef]
- International Electrotechnical Commission (Ed.) IEC 60422-Mineral Insulating Oils in Electrical Equipment-Supervision and Maintenance Guidance 4.0; International Electrotechnical Commission: Geneva, Switzerland, 2013. [Google Scholar]
- Somekawa, T.; Kasaoka, M.; Kawachi, F.; Nagano, Y.; Fujita, M.; Izawa, Y. Analysis of dissolved C2H2 in transformer oils using laser Raman spectroscopy. Opt. Lett. 2013, 38, 1086. [Google Scholar] [CrossRef] [PubMed]
- Du, L.; Chen, W.; Gu, Z.; Zou, J.; Wan, F.; Wang, P.; Pan, C. Analysis of acetic acid dissolved in transformer oil based on laser Raman spectroscopy. In Proceedings of the 2016 IEEE International Conference on High Voltage Engineering and Application (ICHVE), Chengdu, China, 19–22 September 2016. [Google Scholar] [CrossRef]
- Szmatoła, M.; Chrobak, J.; Grabowski, R.; Iłowska, J.; Woch, J.; Szwach, I.; Semeniuk, I.; Drabik, J.; Wrona, M.; Kozdrach, R.; et al. Spectroscopic Methods in the evaluation of modified vegetable base oils from crambe abyssinica. Molecules 2018, 23, 3243. [Google Scholar] [CrossRef] [PubMed]
© 2020 by the authors. Licensee MDPI, Basel, Switzerland. This article is an open access article distributed under the terms and conditions of the Creative Commons Attribution (CC BY) license (http://creativecommons.org/licenses/by/4.0/).