Abstract
The aim of the paper is the techno-economic analysis of innovative integrated combined heat and power (CHP) systems for the exploitation of different renewable sources in the residential sector. To this purpose, a biofuel-driven organic Rankine cycle (ORC) is combined with a wind turbine, a photovoltaic system and an auxiliary boiler. The subsystems work in parallel to satisfy the electric and heat demand of final users: a block of 40 dwellings in a smart community. A 12.6 kWel ORC is selected according to a thermal-driven strategy, while wind and solar subsystems are introduced to increase the global system efficiency and the electric self-consumption. The ORC can be switched-off or operated at partial load when solar and/or wind sources are significant. A multi-variable optimization has been carried out to find the proper size of the wind turbine and photovoltaic subsystems and to define the suitable operating strategy. To this purpose, several production wind turbines (1.0–60.0 kWel) and photovoltaic units (0.3–63.0 kWel) have been considered with the aim of finding the optimal trade-off between the maximum electric self-consumption and the minimum payback period and electric surplus. The multi-objective optimization suggests the integration of 12.6 kWel ORC with 10 kWel wind turbine and 6.3 kWel photovoltaic subsystem. The investigation demonstrates that the proposed multi-source integrated system offers a viable solution for smart-communities and distributed energy production with a significant improvement in the global system efficiency (+7.5%) and self-consumption (+15.0%) compared to the sole ORC apparatus.
Keywords:
biodiesel; CHP; multi-source; multi-variable optimization; ORC; photovoltaic; wind turbine 1. Introduction
In order to overcome today’s sustainability and environmental concerns, multi-source integrated energy systems for combined heat and power generation (CHP) are considered a technical solution capable of increasing flexibility, decentralized generation [1,2], global efficiency and reducing fuel consumptions and emissions [3,4,5]. The exploitation and integration of different renewable energy sources (biomass, solar, wind, tidal and geothermal energy), traditional fossil fuels (natural gas, oil, etc.), as well as various technologies (photovoltaic and solar heating, heat pump and absorption chiller) represents a complex task [6,7,8]. The main goal is finding the proper size of each technology considering both cost-effectiveness and energy efficiency, as well as the proper operating strategies [9,10,11,12,13,14]. To this purpose, different optimization procedures to define the proper system configuration and operation have been proposed in the last few years based both on single and multi-objective optimization [15,16,17,18,19]. Usually, multi-objective approaches are preferred because they provide a proper trade-off between different purposes (e.g., economic, energy and environmental goals) while single objective optimizations refer to a best solution with a specific point of view [11,20,21] and the other objectives are often degraded [22,23]. As an example, Bellos and Tzivanidis [23] compared single, bi and three-objects criteria to define the optimal design of a solar driven trigeneration system for building applications. In particular, the exergy efficiency, the energy efficiency and the saving cash flow of the system have been selected as single and combined goals. As expected, the different approaches provide different system design and performance and the authors suggest the three-objective optimization as the most suitable criterion for the investigated trigeneration system. Chamandoust et al. [24] proposed a multi-objective optimization for a residential smart electric grid adopting economic, environmental and reliability parameters. Specifically, the minimization of the operating costs and emissions of the generation system, the minimization of the load expectation loss in the demand side and the minimization of the difference between renewable production and user energy demand were imposed.
The adoption of both intermittent and programmable renewable sources increases the sustainability of the CHP systems, reduces the greenhouse gas emissions, allowing to meet energy requests continuously [15]. In this context, organic Rankine cycles are flexible energy systems, with different advantages with respect to conventional apparatus: low maintenance, good partial load efficiency, high safety, fast start-up and stop procedures, [25,26]. Furthermore, a noticeable potential for combing renewable energy sources (e.g., wind energy, solar and biofuel) exists. In particular, the integration of wind and solar energy appears very interesting, especially in urban areas [20,27,28,29]. To this purpose, both small and large-scale wind turbines have been installed or are receiving increasing attention for suburban and urban location [30,31,32] owing to their unexploited high potential and their possible role for an efficient transition towards sustainable cities [33,34]. Furthermore, the adoption of biofuel in innovative distributed energy systems (DES) is fundamental to mitigate the environmental concerns [35,36]. However, few investigations on such multi-source integrated systems are present in the literature and further researches are required [37].
The purpose of the present study is the techno-economic analysis and the optimization of an integrated biodiesel/solar/wind CHP system for domestic applications. In particular, the use of innovative multi-source systems to fulfill the energy demand of domestic users in Sicily Island (South Italy) has been investigated and the hourly thermal and electric balances have been evaluated. The apparatus consists of a biodiesel-fuelled organic Rankine cycle, a wind turbine and a photovoltaic unit. The subsystems work in parallel to satisfy the electricity and heat demand while the surplus thermal energy is used in a transesterification process to produce part of the biofuel that feeds the organic Rankine cycle (ORC) cycle. A thermodynamic model has been developed in order to find the suitable ORC nominal power and operating conditions and the proper multi-source system configuration has been defined adopting a multi-variable optimization.
2. Materials and Methods
2.1. Multi-Source Power Plant
The integrated multi-source CHP scheme is sketched in Figure 1. The system consists of a biodiesel-driven organic Rankine cycle (ORC) that operates according to a thermal-driven operating strategy. The biofuel is produced by a transesterification process, whose heat request is partially provided by the heat dumping of the ORC. A photovoltaic system (PV) and a wind turbine (WT) are combined with the ORC unit to increase the global efficiency and the electric self-consumption of the final users. The electricity can be exchanged with the grid while a pre-existent natural gas packaged firetube boiler is used to satisfy the users thermal demand when the ORC heat production is low.
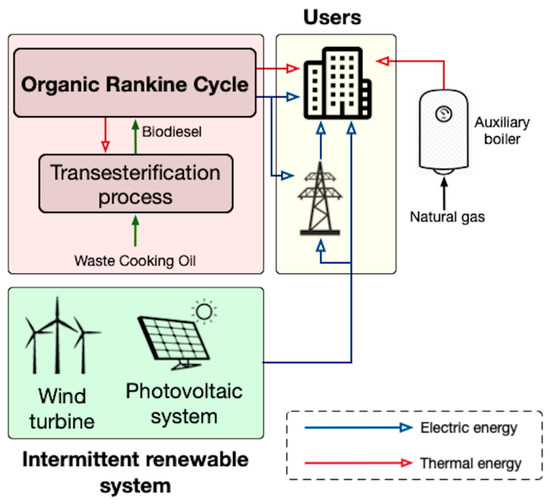
Figure 1.
Integrated multi-source system scheme.
2.1.1. Organic Rankine Cycle (ORC) Subsystem
The ORC involves mainly a pump, an evaporator, a turbine, and a condenser. The corresponding ORC processes on the T-s diagram are shown in Figure 2. The pump raises the pressure of the organic fluid to the maximum value (1–2 process). The heat generator preheats and vaporizes the working fluid (2–4) that expands in the turbine (4–5), then the condensation process occurs (5–1). The thermal input to the system is provided by a biodiesel boiler and a thermal oil circuit is used to avoid organic fluid instability and overheating [38].
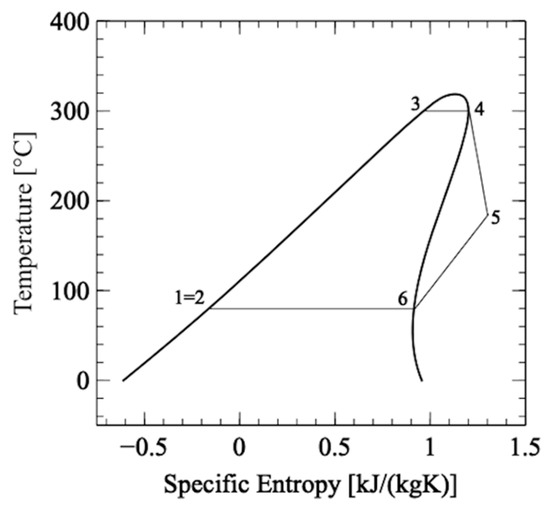
Figure 2.
Organic Rankine cycle (ORC) processes in T-s diagram.
A thermodynamic model has been developed to define the behavior of the ORC subsystem [39] and the Refprop database has been used to evaluate the properties of the working fluid [40]. Steady state conditions have been considered [41], while pressure losses in the ORC apparatus have been disregarded [42]. Furthermore, the ramp rate for energy generation with ORC systems usually reaches 10–30% of nominal power per minute [43]. Considering that the energy investigation is based on an hourly analysis, it has been assumed that the ORC can reach any partial load condition instantaneously. These assumptions are typical for small-scale subcritical ORC units [44,45].
The performances of the ORC at full and part loads have been expressed in terms of electric and thermal power, electric and thermal efficiency, primary energy saving index and energy utilization factor.
The electric power of the ORC subsystem (PORC,el) is:
where Pt and Pp are the turbine and pump power, respectively, ηem,t and ηem,p represents the electro-mechanical efficiencies of ORC turbine and pump. Pp,oil and Pp,cool are the power demand of ancillary pumps (i.e., thermal oil and cooling circuit), and ηem,oil and ηem,cool are the corresponding electro-mechanical efficiencies.
The ORC thermal production (PORC,th) is
where is the thermal power available at the condenser that is used for cogeneration purposes and ηhe represents the efficiency of the heat exchange.
The ORC electric and the thermal efficiency are defined as
where and Hi are the biodiesel mass flow rate and lower heating value, respectively.
The energy utilization factor (EUF) and the primary energy saving index (PES) [46] have been used as cogeneration indicators. Particularly, EUF and PES index are evaluated as:
where ηel,ref and ηth,ref are the reference electric and thermal efficiency, respectively, defined on the mean values of Italian thermoelectric power plants and boilers [47].
2.1.2. Photovoltaic (PV) Subsystem
A numerical model of the photovoltaic (PV) subsystem has been developed integrating the solar irradiance and the ambient conditions provided by the PV-Gis web application [48]. In particular, the electric power of the PV subsystem has been calculated on an hourly basis as:
where ηtot is the total efficiency of the PV unit, G is the global irradiance, N is the modules number, and Am is the area of the single module. The photovoltaic total efficiency depends on the effectiveness of the module ηm, the efficiency of other components ηo (e.g., cables, inverters), the reflectance efficiency ηR, and the temperature efficiency ηT that is calculated according to the literature [49]:
where kT is the temperature coefficient, TNOCT corresponds to the nominal operating temperature of the module and Ta represents the ambient temperature.
2.1.3. Wind Turbine (WT) Subsystem
The performances of the wind turbine (WT) subsystem on an hourly basis have been characterized adopting a home-made zero-dimensional model able to integrate the information provided by the system advisor model (SAM) [50].
The WT power PWT is defined as
where ηem,w is the electro-mechanical efficiency of the wind turbine, Cp corresponds to the performance coefficient, ρ is the air density, A represents the rotor swept area and u is the wind speed. In particular, the wind speed values have been corrected to considering the WT hub height according to the literature [51]:
where u0 is the wind speed at the reference height (10 m) and α is the wind shear exponent.
Furthermore, the acoustic influence area of the wind turbine has been evaluated to guarantee sound pressure values lower than 40 dB that represents the upper limit in residential area according to the national legislation [20,52].
In particular, the noise level Lp has been calculated as [20,53]:
where r is the distance from the wind turbine, LWT corresponds to the WT sound pressure level while α represents the sound absorption coefficient that is set equal to 0.005 dB/m in line with the literature [53,54].
The wind turbine sound pressure level has been defined as [55]:
where D is the WT rotor diameter. It is worthy to notice that the WT manufacturer provides for the selected turbines sound pressure levels (at medium and low wind speed) lower than the corresponding values obtained adopting the previous equation. As a consequence, the expected noise impact of the wind turbines in the investigated area is expected to be lower than estimated values.
2.2. Operating Conditions
2.2.1. ORC Subsystem
The investigation has been performed considering a subcritical ORC unit with saturated conditions at the turbine entrance and toluene has been selected as working fluid owing to its thermal stability and high performance, in line with the literature [27,41,56]. Specifically, the maximum evaporation temperature has been fixed to 300 °C to prevent the liquid presence during the expansion whereas the minimum temperature at the turbine inlet has been set equal to 150 °C. The condensation temperature is always equal to 80 °C to satisfy the user heat demand according to the literature [57].
For the analysis, the efficiencies of the pump and turbine have been fixed to 0.60 and 0.70 [58], respectively, while the total efficiency of the heating process (from biomass to working fluid through the thermal oil circuit) is 0.85 (Table 1) [59]. The reference efficiency for the independent electric and thermal production have been imposed equal to 0.33 and 0.86, respectively [60].

Table 1.
ORC operating conditions and main assumptions.
2.2.2. PV Subsystem
The characteristics of the single photovoltaic module [61] and the main assumptions adopted in this study are highlighted in Table 2 while Figure 3 shows the corresponding performance curves in terms of current, voltage and power. The module nominal power and efficiency at standard test conditions (STC) are 315 Wp and 19.3%, respectively, while the temperature coefficient is equal to 0.38%/°C [61]. The slope of the module was fixed to 30° with a south orientation and the number of modules was varied between 0 and 200 (the maximum PV nominal power is 63.0 kWp). The reflectance efficiency and the efficiency of the other components (e.g., cables, inverters) were fixed equal to 97% and 86%, respectively.
Table 2.
Photovoltaic system characteristics.
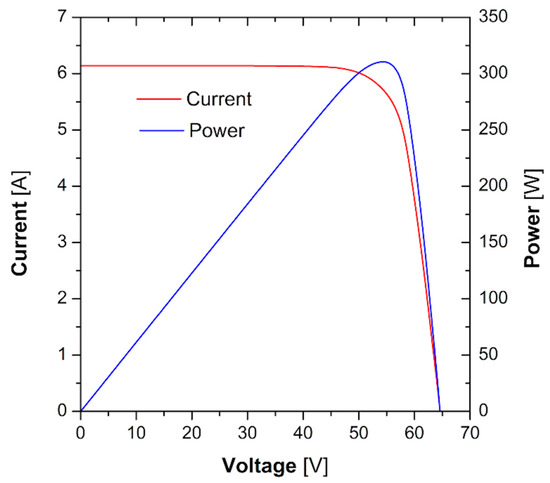
Figure 3.
Characteristic curves of the photovoltaic (PV) module.
2.2.3. WT Subsystem
For the investigation nine production wind turbines have been considered [62]. The corresponding design parameters (nominal power, rated velocity, cut-in and cut-off velocity and rotor blade diameter) are summarized in Table 3 whereas Figure 4 illustrates the power curve of the selected turbines.
Table 3.
Main characteristics of wind turbine (WT) units.
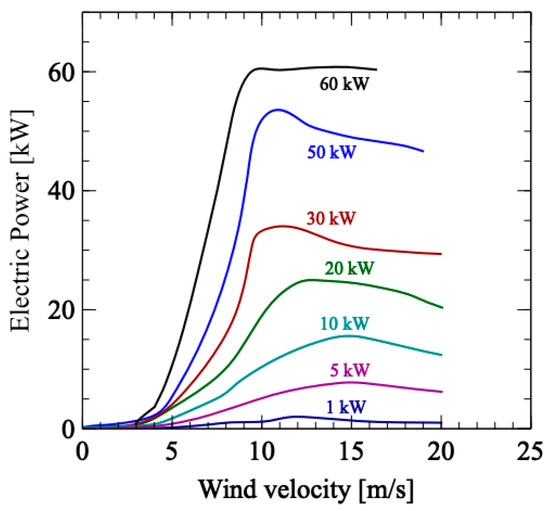
Figure 4.
Wind speed–power curve of the selected WT units.
The nominal power ranges between 1 and 60 kW and the corresponding rotor blade diameter moves from 3.2 to 22.4 m. The rated wind velocity maintains similar values for the selected turbines with values in the range 9–12 m/s.
2.2.4. Electric and Thermal Demand
The investigation has been carried out considering a block of 40 apartments located in Palermo city (Sicily—South Italy). The annual electric and thermal demands are 100.0 MWhel and 332.0 MWhth, respectively, and take into account the request of the lighting system and appliances, including air conditioners for the summer period, space heating and hot water demand. Figure 5 highlights the daily electric (a) and thermal (b) request on an hourly basis of a single dwelling during winter, summer and intermediate seasons. More details are available in the literature [1].
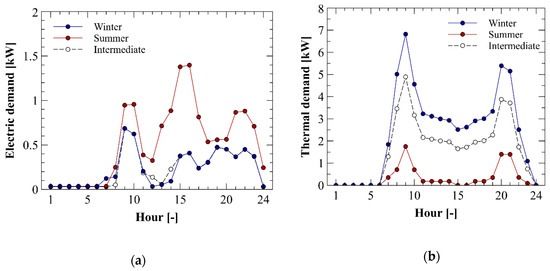
Figure 5.
Daily profiles of electric (a) and thermal (b) power request of a single dwelling during a typical day in winter, summer and intermediate seasons in Southern Italy.
The performance of the integrated CHP system has been evaluated on hourly basis. PV-GIS and SAM software have been used to define the ambient conditions (temperature, solar and wind properties). As an example, Figure 6 shows the hourly distribution of the diffuse irradiance (a) and wind speed (b) registered in Palermo during the year. The mean global irradiance was equal to 250.6 W/m2, with the maximum value measured in June (about 1000 W/m2), whereas the mean wind speed was 4.7 m/s.
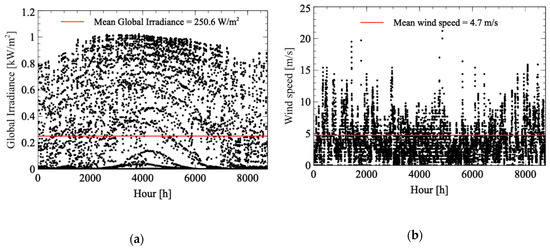
Figure 6.
Hourly global irradiance (a) and wind velocity (b) in Palermo (Italy).
2.3. Optimal Integrated System Configuration
A multi-variable optimization has been carried out to define the most suitable configurations and operating conditions of the multi-source integrated CHP system (components and corresponding nominal power).
In this work, the payback period (t), electric self-consumption (S) and surplus (s) have been considered as optimization parameters (“t-S-s approach”) in order to find a suitable compromise between economic and energy requirements. To this purpose, authors adopted the “minimum distance” method according to the literature [63,64]. The technique recommends selecting the combined system arrangements that minimize the dimensionless distance to the ideal point that is defined by the minimum payback period (tmin), the maximum self-consumed electric energy (Smax) and the minimum electric surplus (smin), according to:
where the subscript i corresponds to the generic ith configuration of the integrated system that guarantees the payback period ti, the electric self-consumption Si and the electric surplus si while tmax, Smin and smax represent the maximum payback period, the minimum electric self-consumption and surplus, respectively. In particular, high self-consumed electric energy and low electric surplus are fundamental to guarantee a limited dependence of the hybrid system from the grid, to promote the development of independent smart communities and the transition towards diffuse energy systems (DES) based on renewable sources. In this way also the transmission losses are decreased [31,65] and the grid operation and balance issues are improved, increasing the safety of the electric energy system, reducing the stress due to the intermittent and stochastic electric production of renewables [24,66], the consequent ramping requirements of conventional power plants to fulfill the users demand [67], increasing, at the same time, the possible integration of additional renewable sources [68]. Furthermore, the low payback period is adopted in the proposed multi-objective optimization in order to guarantee the economic viability of innovative multi-source small-scale energy systems.
Furthermore, two bi-variable optimizations have been implemented considering the payback period and the electric surplus (“t-s approach”), and the electric self-consumption and surplus (“S-s approach”). The corresponding proper system configurations have been obtained adopting the minimum distance criterion according to:
for the t-s and S-s approach, respectively.
In particular, the electric self-consumption and surplus have been evaluated on hourly basis considering the annual operation of the multisource integrated system while the payback period has been calculated to evaluate the economic viability of the system. To this purpose, the investment period has been fixed to 20 years and the main assumptions for the economic investigation are summarized in Table 4. The biodiesel price has been estimated considering the production cost and the energy saving in the transesterification process due to the contribution of the ORC thermal surplus [35,36]. The natural gas price is derived from Italian tariff scenario [69,70] whereas the specific cost of the technologies has been found in the literature (ORC [58,71], WT [72], PV [73]).
Table 4.
Main assumptions for the economic analysis.
3. Results and Discussion
An innovative multi-source energy system for small-scale combined heat and power (CHP) applications was analyzed. The integrated apparatus consists of a biodiesel-fired organic Rankine cycle (ORC), a photovoltaic unit (PV) and a wind turbine (WT). The three subsystems work in parallel to fulfill the electric and thermal demand of a block of 40 dwellings that is part of a smart community. A conventional packaged firetube boiler fuelled by natural gas [74] satisfies the heat request when the ORC supply is insufficient while the thermal surplus is adopted for the production of biodiesel through a pre-existing transesterification process of waste cooking oils (WCOs) [35,36,75], which is collected from the smart community (including dwellings, restaurants, refectories, etc.) and it is considered with no cost. The ORC system is able to work at part loads to fulfill the energy demand of the users. To this purpose, a parametric investigation was done and Figure 7 shows the electric and thermal performance as a function of the ORC electric load. The partial load characteristics were found in accordance with previous works and the minimum load was 40%, corresponding to the minimum evaporation temperature [1,76]. At full load the electric and thermal efficiencies were equal to 14.6% and 70.5%, respectively, while the corresponding values were 8.2% and 77.0% at minimum. The EUF dimensionless parameter was always higher than 83.5% and a negligible influence of the electric load was noticed.
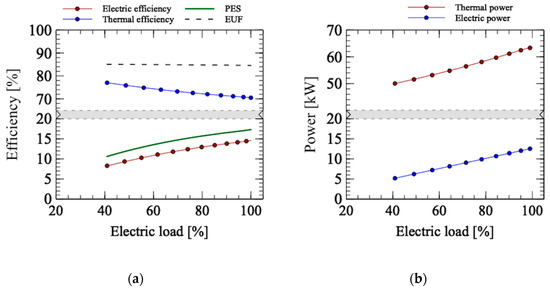
Figure 7.
Effect of electric load on thermal and electric performance. Efficiency (a); Power (b).
Afterwards, the ORC nominal power was defined as adopting a parametric investigation and a thermal-driven strategy was adopted to guarantee the users heat demand on an hourly basis. Particularly, Figure 8 highlights the thermal nominal power and the annual balance in terms of self-consumption, integration and surplus as a function of the ORC electric power. As predictable, the higher the nominal power, the higher the self-consumed energy. Nevertheless, it is evident that 90% of the heat demand was provided when the ORC thermal power (PORC,th) was equal to 106 kWth and a slight influence on the self-consumed thermal energy was present for larger units. On the other hand, the surplus moved from 68% to 178% when PORC,th passed from 106 to 200 kWth. Consequently, the ORC nominal power has been defined in order to assure that the thermal excess and the boiler integration are equal [28,76]. The selected unit presents a nominal electric power equal to 12.7 kWel while the thermal power was 63.5 kWth. The corresponding thermal self-consumption reached 68% whereas the surplus and integration were 32%. The ORC unit satisfies 41.1% of the electric load while the electric excess that is injected to the grid was 8.8%.
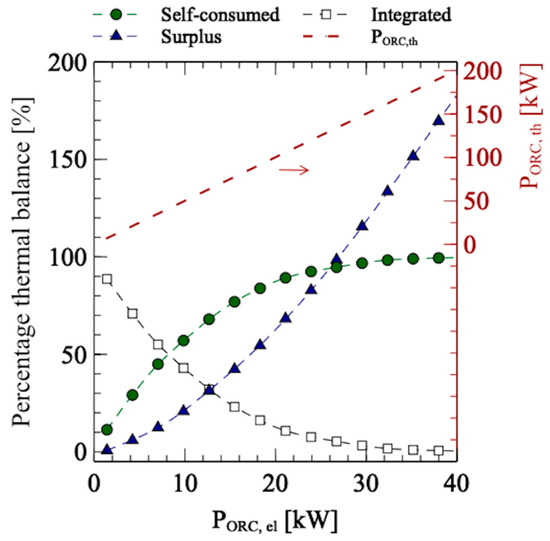
Figure 8.
Influence of ORC size on thermal power and yearly energy balance (self-consumed, surplus and integrated energy).
The selected ORC apparatus was combined with production photovoltaic systems and wind turbines in order to increase the performance of the CHP system and improve the system global efficiency (Figure 1). To this purpose, nine wind turbines were taken into account (PWT = 1–60 kWel) while the peak power of photovoltaic subsystem (PPV) ranges from 0.31 to 63 kWel (1–200 modules). According to Equations (11) and (12), the minimum distance between dwellings and the wind turbine ranged from 90.5 (PWT = 1 kW) to 241.3 m (PWT = 60 kW) to satisfy national noise level requirements whereas the total PV modules surface was between 1.63 m2 (PPV = 0.31 kW) to 326.1 m2 (PPV = 63 kW). As expected, the wind turbines and photovoltaic unit present an intermittent operation during the year depending on the weather conditions. As an example, Figure 9 compares the yearly performance for WT and PV systems of similar maximum power on hourly basis.
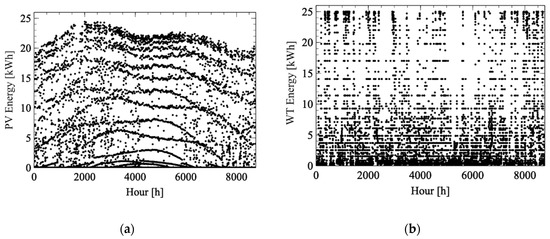
Figure 9.
Energy production of the photovoltaic and wind turbine subsystems with similar maximum power. (a) PV (91 modules) and (b) WT (nominal power = 20 kWel).
3.1. Multi-Variable Optimization
Several ORC-PV-WT arrangements were compared in order to define the most suitable configuration of the multi-source integrated system. To this purpose, a multi-variable optimization was adopted. The optimization criterion aimed at maximizing the electric self-consumption and minimizing both the payback period and the electric surplus (t-S-s approach).
Figure 10 shows the three parameters for all the investigated configurations while Figure 11a,b illustrate the corresponding projections on the coordinate planes (t-s and S-s planes, respectively). The ideal point refers to the minimum payback period (tmin = 6.9 years), the maximum self-consumption (Smax = 64.5%), and the minimum surplus (smin = 8.8%). The investigation shows that the sole biodiesel ORC system presents the minimum electric self-consumption (Smin = 41.1%), surplus and payback period. Conversely, the integration assures a noticeable upsurge in the electric demand fulfillment, with percentages larger than 50% when at least 10 kW wind turbine was installed, independently on the PV peak power.
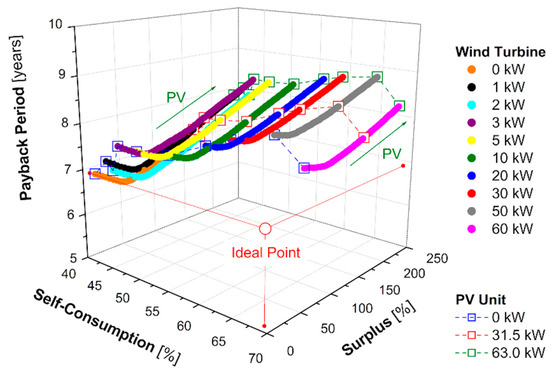
Figure 10.
Self-consumption, surplus and payback period for the different configurations.
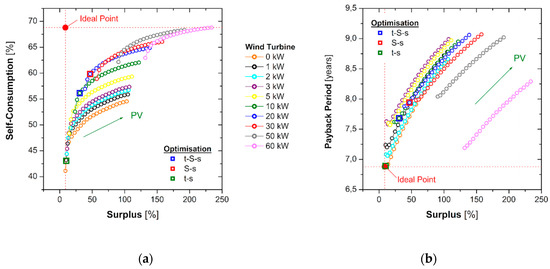
Figure 11.
Self-consumption vs. surplus (a) and surplus vs. payback period (b) for the different configurations.
The maximum self-consumption was 69.9% when PWT = 60 kW and PPV = 63 kW. It is noteworthy that the higher the self-consumption, the higher the electricity injected to the grid (Figure 4b). Furthermore, the payback period increased progressively with the self-consumed electricity when at least 10 PV modules (3.15 kWp) were installed. Consequently, a proper trade-off should be identified and the minimum distance criterion to the ideal point was used to select the optimal multi-source integrated system [21,29]. Specifically, the analysis recommends integrating the selected ORC subsystem (PORC,el = 12.7 kWel and PORC,th = 63.5 kWth) with 6.3 kWel photovoltaic unit and 10 kWel wind turbine. The optimized multi-source energy equipment provides 86.9 MWhel (49.8 MWhel for the ORC alone) per year and it guaranteed 56.1% of the dwellings electric demand whereas the electric excess was 30.8% and the payback period was equal to 7.7 years (Figure 8). ORC, WT and PV subsystems provided 57.3%, 30.2% and 12.5% of the overall electric energy production, respectively. In this case, the acoustic influence area of the wind turbine to fulfill the national noise regulations was about 65,600 m2, with a minimum distance between apartments and WT lower than 145 m.
The performances of the selected multi-source energy system are compared with the systems selected adopting two parameters optimization (Table 5), referring to the ideal points in Figure 10 and Figure 11. The surplus minimization constraint was imposed for all the optimization criteria. The optimized configurations present the same ORC unit (PORC,el = 12.7 kW), as already observed, while the nominal power of the wind turbine and photovoltaic subsystems were different (Figure 12). Specifically, when the payback period was not considered, the S-s optimization suggests a total electric power equal to 46.6 kW, with a 20 kW wind turbine and 13.9 kWp PV unit. In this case the maximum self-consumption (61.1%) was guaranteed but the electric surplus was high (58.5%) and the minimum distance between dwellings and wind turbine to maintain sound pressure levels lower than 40 dB was equal to 162.4 m. Conversely, the adoption of the t-s approach assured a significant decrease in the electric surplus (10.1%) but the integration from the grid reached 56.9% owing to the absence of wind turbine and the negligible share of the photovoltaic unit (1.9 kWp). The t-S-s approach permitted to obtain a similar self-consumption of the S-s criterion (56.1%). However, the electric excess and the payback period were reduced. Furthermore, the comparison with the single ORC unit shows that the integration of the different technologies assured an increase in terms of operating hours (from 5899 to 8760 h/year).
Table 5.
Optimized multi-source integrated systems.
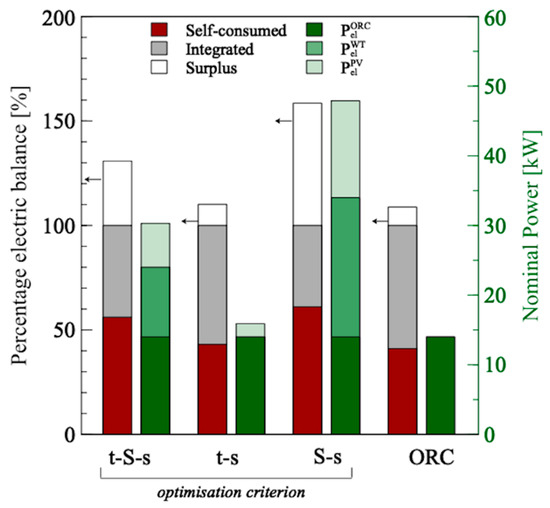
Figure 12.
Annual electric energy balances for multi-source systems. Optimized systems and ORC.
The comparison between the performances of the optimized systems in terms of marginal differences is proposed in Figure 13. To this purpose, the t-S-s criterion was assumed as the reference. A significant increase (+60.7%) in the total electric power was observed when the economic aspects were beyond the optimization goal (S-s approach) whereas lower rises in the self-consumption (+5.0%) and total investment cost (+28.8%) were registered. This configuration guarantees the maximum global efficiency (24.0%) and primary energy saving (40.0%), and the shares of ORC, WT and PV subsystems to the electric production were 30.2%, 46.2% and 23.6%. When the t-s optimization was adopted, the payback period was lower than 7 years and a decrease in the initial investment equal to 34.7% was registered. On the other hand, a noticeable electric integration (+30%) from the grid was necessary and the global efficiency dropped to 10%. Similar results were found for the system configuration that guarantees the minimum payback period. In particular, the results demonstrated that for the investigated innovative multi-source energy system the sole economic optimization was not able to promote an efficient development of renewable DES and the proper balance of the electric grid. In this case, the global efficiency and the electric production reduced significantly with respect to the proposed optimized system (−7.5% and −38.9%, respectively), and a negative impact in terms of both system self-sufficiency and greenhouse gas emissions was produced owing to the higher electric integration from the grid (+11.1%), the lower injection to the grid (−19.5%) and the 2019 renewables share in the national electric mix (about 35%) [77].
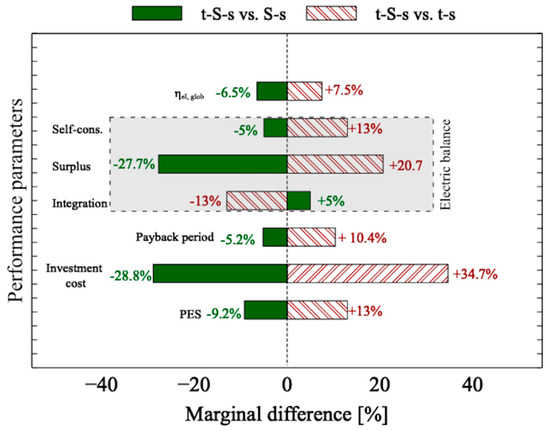
Figure 13.
Marginal differences in performance of the t-S-s optimized configuration with respect to the bi-variable optimizations.
To evaluate in more details the possible advantages of the multi-source integration, the t-S-s optimized configuration was compared to the single-source units characterized by similar nominal power (Pt-S-s = 30.2 kW, PWT = 30 kW and PPV = 29.9 kW). Figure 14 highlights the percentage energy balances and the fuel consumptions for the selected systems. A noticeable increase in the electric and thermal production was noticed when the integrated system was selected. Furthermore, the integration of ORC permits to overcome the non-programmable nature of WT and PV technologies and to increase the flexibility of the CHP apparatus with the possibility to reduce the fuel consumption. Specifically, the natural gas consumption moves from 36,285 m3/year for the WT and PV alone to 11,160 m3/year when the ORC system was adopted.
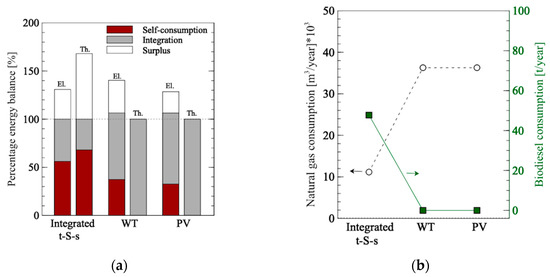
Figure 14.
Comparison between multi-source energy system, WT and PV units in terms of annual electric energy balances (a) and fuel consumptions (b).
In this case, the yearly biodiesel request was equal to 47.8 t/year and permitted to satisfy both the thermal and the electric demand of domestic users. In this way the decrease in fuel consumption was equal to 22.0 tons of oil equivalent with respect to the single-source systems.
3.2. Monthly Energy Balance
Finally, the monthly energy balances of the selected integrated system (t-S-s criterion) to satisfy the electric and thermal loads of a block of 40 dwellings are shown in Figure 15. The thermal load was significantly influenced by the heating period (from December to March in Palermo city, in line with the Italian legislation [78]. Conversely, the dwellings electric demand presents the highest values (larger than 376.2 kWhel/month/apartment) during the summer period, due to the cooling request, whereas analogous demands were observed in the other months (about 150 kWhel/month/apartment).
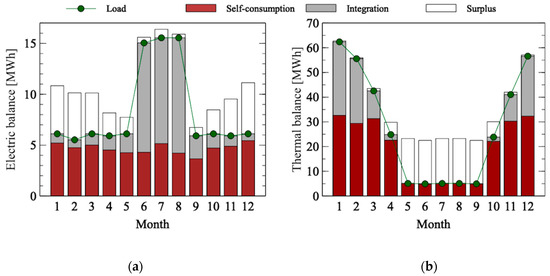
Figure 15.
Monthly electric (a) and thermal (b) balances for the multi/source combined heat and power (CHP) system.
Figure 15a illustrates that the multi-source energy system never fulfilled the global electric demand and 43.9% integration is necessary on an annual basis. The withdrawal from the grid was registered also from October to March although the electric production was higher than the energy request. In fact, the thermal and electric loads were not concurrent during the day. The optimized system satisfied 78.9% of the electric demand from September to May whereas the electric surplus reached 53.9%. On the other hand, a significant integration (70.4%) is noticed from June to August owing to the air conditioners load with a small fraction of the electric production (3.8%) injected to the grid.
The investigation (Figure 15b) shows a noticeable thermal excess from May to September (about 78% of the total production). This thermal surplus was used to partially satisfy the thermal demand of the transesterification process for the production of biodiesel from waste cooking oils. During the winter, the auxiliary boiler is fundamental to meet the peak thermal demand. In particular, the yearly natural gas consumption was close to 11,000 m3 and a very low thermal surplus was found. In this way, the proposed multi-source hybrid CHP system guaranteed a primary energy saving index larger than 30% and an energy utilization factor equal to 83.8%.
The work demonstrated that the optimized integration of different technologies (i.e., ORC, WT and PV) and different final users (i.e., domestic and industrial consumers) permitted to overcome the limits of the particular technologies (e.g., intermittency and stochasticity of wind and solar energy) and allowed a significant primary energy saving as compared to the corresponding single-source energy systems. The proposed integrated solution offers interesting opportunities to achieve the nearly zero energy building (NZEB) target in the residential sector with positive effects in terms of operating costs and environmental impact. To this purpose, the advantages in terms of saving emissions will be highlighted in future work.
4. Conclusions
A fully renewable multi-source integrated energy system for CHP applications has been modeled and analyzed. The system consists of a photovoltaic unit, a wind turbine and a biodiesel-driven ORC. A preliminary investigation was carried out to define the size of the ORC subunit according to a thermal-driven strategy, considering a block of 40 dwellings located in Southern Italy. The ORC thermal and electric nominal power were equal to 63.5 kWth and 12.7 kWel, respectively. The thermal surplus was adopted to partially satisfy the thermal request of a plant for the production of biodiesel through a transesterification process, allowing a significant primary energy saving. The ORC unit alone satisfied 68.0% of the thermal demand and 41.2% of the electric load. Afterwards, the integration with production wind turbines (ranging from 1 to 60 kWel) and photovoltaic systems (from 0.315 to 62 kWel) was analyzed through a techno-economic investigation with the main purpose of increasing the global electric efficiency. A multi-variable optimization was performed in order to guarantee the optimal trade-off between electric self-consumption, surplus and payback period. To this purpose, an hourly energy balance was carried out and a 10 kWel wind turbine and 6.3 kWel photovoltaic unit were found as the optimal integrated solution. The global electric efficiency increased by 7.5 percentage points due to the multi-source exploitation, allowing to overcome the intermittency of the wind and solar sources. At the same time, a significant increase in electric self-consumption was registered (+15 percentage points as compared with respect to the ORC unit alone) whereas the payback period moved from 6.9 to 7.7 years, and the electricity surplus injected to the grid increased from 8.8% to 30.8% of the yearly electric demand. The system was also compared with an optimized configuration defined according to an energy-alone two-variable optimization. Even though this arrangement guaranteed a slightly higher increase in self-consumption (+5% compared to the selected system), it presented a significant increase in the initial investment (+28.8%), a higher payback period (+0.4 years) and an overwhelming surplus production (+27.6%). Furthermore, the adoption of the single-objective optimization system based on the minimum payback period provides the lowest temporal value (−0.8 years as compared to the multi-variable optimized apparatus) but an increase in the electric grid integration (+11.1%) and a decrease in global efficiency (−7.5%) were observed.
As a final remark, the investigation demonstrated that multi-variable optimization of energy systems, integrating different technologies (ORC, WT and PV) and different final users (domestic and industrial), allowed saving the primary energy sources and overcoming the limits of the different technologies, representing an effective technical solution for smart-communities and distributed production as compared to the corresponding single-source units.
Author Contributions
Conceptualization, A.A. and P.M.; methodology, A.A., P.M., S.B.; software, A.A. and P.M.; validation, A.A. and P.M.; formal analysis, A.A. and P.M.; investigation, A.A. and P.M.; resources, A.A., P.M. and S.B.; data curation, A.A. and P.M.; writing—original draft preparation, A.A. and P.M.; visualization, A.A. and P.M.; supervision, A.A. and P.M.; funding acquisition, A.A. and P.M. All authors have read and agreed to the published version of the manuscript.
Funding
This research was funded within the framework of the Miur Project “Community Energy Storage: Gestione Aggregata di Sistemi d’Accumulo dell’Energia in Power Cloud (ComESto), CUP H56C18000150005.
Conflicts of Interest
The authors declare no conflict of interest.
References
- Morrone, P.; Algieri, A.; Castiglione, T. Hybridisation of biomass and concentrated solar power systems in transcritical organic Rankine cycles: A micro combined heat and power application. Energy Convers. Manag. 2019, 180, 757–768. [Google Scholar] [CrossRef]
- Soares, J.; Oliveira, A.C. Numerical simulation of a hybrid concentrated solar power/biomass mini power plant. Appl. Therm. Eng. 2017, 111, 1378–1386. [Google Scholar] [CrossRef]
- Emmi, G.; Zarrella, A.; De Carli, M. A heat pump coupled with photovoltaic thermal hybrid solar collectors: A case study of a multi-source energy system. Energy Convers. Manag. 2017, 151, 386–399. [Google Scholar] [CrossRef]
- Morrone, P.; Algieri, A. Numerical investigation on the energetic performances of conventional and pellet aftertreatment systems in flow-through and reverse-flow designs. Therm. Sci. 2011, 15, 1049–1064. [Google Scholar] [CrossRef]
- Amelio, M.; Morrone, P. Residential cogeneration and trigeneration. In Current Trends and Future Developments on (Bio-) Membranes; Elsevier: Amsterdam, The Netherlands, 2020; pp. 141–175. ISBN 978-0-12-817807-2. [Google Scholar]
- Zhu, Y.; Wang, Z.; Liu, Y.; Wang, H.; Tai, N.; Jiang, X. Optimal Control of Microgrid Operation Based on Fuzzy Sliding Mode Droop Control. Energies 2019, 12, 3600. [Google Scholar] [CrossRef]
- Roy, A.; Auger, F.; Dupriez-Robin, F.; Bourguet, S.; Tran, Q.T. Electrical Power Supply of Remote Maritime Areas: A Review of Hybrid Systems Based on Marine Renewable Energies. Energies 2018, 11, 1904. [Google Scholar] [CrossRef]
- Barbieri, E.S.; Dai, Y.J.; Morini, M.; Pinelli, M.; Spina, P.R.; Sun, P.; Wang, R.Z. Optimal sizing of a multi-source energy plant for power heat and cooling generation. Appl. Therm. Eng. 2014, 71, 736–750. [Google Scholar] [CrossRef]
- Amber, K.; Day, T.; Ratyal, N.; Kiani, A.; Ahmad, R. Techno, Economic and Environmental Assessment of a Combined Heat and Power (CHP) System—A Case Study for a University Campus. Energies 2018, 11, 1133. [Google Scholar] [CrossRef]
- Askari, I.B.; Calise, F.; Vicidomini, M. Design and Comparative Techno-Economic Analysis of Two Solar Polygeneration Systems Applied for Electricity, Cooling and Fresh Water Production. Energies 2019, 12, 4401. [Google Scholar] [CrossRef]
- Bellos, E.; Tzivanidis, C. Parametric Investigation of a Trigeneration System with an Organic Rankine Cycle and Absorption Heat Pump Driven by Parabolic Trough Collectors for the Building Sector. Energies 2020, 13, 1800. [Google Scholar] [CrossRef]
- Ghaem Sigarchian, S.; Malmquist, A.; Martin, V. Design Optimization of a Complex Polygeneration System for a Hospital. Energies 2018, 11, 1071. [Google Scholar] [CrossRef]
- Ubando, A.; Marfori, I.; Aviso, K.; Tan, R. Optimal Operational Adjustment of a Community-Based Off-Grid Polygeneration Plant using a Fuzzy Mixed Integer Linear Programming Model. Energies 2019, 12, 636. [Google Scholar] [CrossRef]
- Algieri, A. Energy Exploitation of High-Temperature Geothermal Sources in Volcanic Areas—A Possible ORC Application in Phlegraean Fields (Southern Italy). Energies 2018, 11, 618. [Google Scholar] [CrossRef]
- Onishi, V.C.; Antunes, C.H.; Fraga, E.S.; Cabezas, H. Stochastic optimization of trigeneration systems for decision-making under long-term uncertainty in energy demands and prices. Energy 2019, 175, 781–797. [Google Scholar] [CrossRef]
- Pina, E.A.; Lozano, M.A.; Serra, L.M. Optimal operation and marginal costs in simple trigeneration systems including thermal energy storage. Energy 2017, 135, 788–798. [Google Scholar] [CrossRef]
- Zhang, Y.; Deng, S.; Zhao, L.; Lin, S.; Ni, J.; Ma, M.; Xu, W. Optimization and multi-time scale modeling of pilot solar driven polygeneration system based on organic Rankine cycle. Appl. Energy 2018, 222, 396–409. [Google Scholar] [CrossRef]
- Martínez, S.; Pérez, E.; Eguía, P.; Erkoreka, A.; Granada, E. Model calibration and exergoeconomic optimization with NSGA-II applied to a residential cogeneration. Appl. Therm. Eng. 2020, 169, 114916. [Google Scholar] [CrossRef]
- Zidane, T.E.K.; Adzman, M.R.; Tajuddin, M.F.N.; Zali, S.M.; Durusu, A.; Mekhilef, S. Optimal Design of Photovoltaic Power Plant Using Hybrid Optimisation: A Case of South Algeria. Energies 2020, 13, 2776. [Google Scholar] [CrossRef]
- Campana, P.E.; Quan, S.J.; Robbio, F.I.; Lundblad, A.; Zhang, Y.; Ma, T.; Karlsson, B.; Yan, J. Optimization of a residential district with special consideration on energy and water reliability. Appl. Energy 2017, 194, 751–764. [Google Scholar] [CrossRef]
- Bellos, E.; Tzivanidis, C. Investigation of a hybrid ORC driven by waste heat and solar energy. Energy Convers. Manag. 2018, 156, 427–439. [Google Scholar] [CrossRef]
- Dar, U.I.; Sartori, I.; Georges, L.; Novakovic, V. Advanced control of heat pumps for improved flexibility of Net-ZEB towards the grid. Energy Build. 2014, 69, 74–84. [Google Scholar] [CrossRef]
- Bellos, E.; Tzivanidis, C. Multi-objective optimization of a solar driven trigeneration system. Energy 2018, 149, 47–62. [Google Scholar] [CrossRef]
- Chamandoust, H.; Derakhshan, G.; Hakimi, S.M.; Bahramara, S. Tri-objective scheduling of residential smart electrical distribution grids with optimal joint of responsive loads with renewable energy sources. J. Energy Storage 2020, 27, 101112. [Google Scholar] [CrossRef]
- Liu, H.; Shao, Y.; Li, J. A biomass-fired micro-scale CHP system with organic Rankine cycle (ORC)—Thermodynamic modelling studies. Biomass Bioenergy 2011, 35, 3985–3994. [Google Scholar] [CrossRef]
- Preißinger, M.; Heberle, F.; Brüggemann, D. Thermodynamic analysis of double-stage biomass fired Organic Rankine Cycle for micro-cogeneration: Thermodynamic analysis of double stage Organic Rankine Cycle. Int. J. Energy Res. 2012, 36, 944–952. [Google Scholar] [CrossRef]
- Wiśniewski, S.; Borsukiewicz-Gozdur, A. The influence of vapor superheating on the level of heat regeneration in a subcritical ORC coupled with gas power plant. Arch. Thermodyn. 2010, 31, 185–199. [Google Scholar] [CrossRef]
- Morrone, P.; Algieri, A.; Castiglione, T.; Perrone, D.; Bova, S. Investigation of Integrated Organic Rankine Cycles and Wind Turbines for Micro-Scale Applications. Energy Procedia 2018, 148, 986–993. [Google Scholar] [CrossRef]
- Morrone, P.; Algieri, A.; Castiglione, T.; Perrone, D.; Bova, S. Investigation of the energy performance of multi-source integrated CHP systems for small-scale applications. AIP Conf. Proc. 2019, 2191, 020115. [Google Scholar] [CrossRef]
- Testi, D.; Urbanucci, L.; Giola, C.; Schito, E.; Conti, P. Stochastic optimal integration of decentralized heat pumps in a smart thermal and electric micro-grid. Energy Convers. Manag. 2020, 210, 112734. [Google Scholar] [CrossRef]
- Qu, F.; Kang, J. Effects of built environment morphology on wind turbine noise exposure at building façades. Renew. Energy 2017, 107, 629–638. [Google Scholar] [CrossRef]
- Bracco, S.; Delfino, F.; Ferro, G.; Pagnini, L.; Robba, M.; Rossi, M. Energy planning of sustainable districts: Towards the exploitation of small size intermittent renewables in urban areas. Appl. Energy 2018, 228, 2288–2297. [Google Scholar] [CrossRef]
- Ge, M.; Zhang, S.; Meng, H.; Ma, H. Study on interaction between the wind-turbine wake and the urban district model by large eddy simulation. Renew. Energy 2020, 157, 941–950. [Google Scholar] [CrossRef]
- Byrne, R.; Hewitt, N.J.; Griffiths, P.; MacArtain, P. Observed site obstacle impacts on the energy performance of a large scale urban wind turbine using an electrical energy rose. Energy Sustain. Dev. 2018, 43, 23–37. [Google Scholar] [CrossRef]
- Kamil, M.; Ramadan, K.M.; Olabi, A.G.; Al-Ali, E.I.; Ma, X.; Awad, O.I. Economic, technical, and environmental viability of biodiesel blends derived from coffee waste. Renew. Energy 2020, 147, 1880–1894. [Google Scholar] [CrossRef]
- Gaurav, A.; Ng, F.T.T.; Rempel, G.L. A new green process for biodiesel production from waste oils via catalytic distillation using a solid acid catalyst—Modeling, economic and environmental analysis. Green Energy Environ. 2016, 1, 62–74. [Google Scholar] [CrossRef]
- Zheng, Y.; Jenkins, B.M.; Kornbluth, K.; Træholt, C. Optimization under uncertainty of a biomass-integrated renewable energy microgrid with energy storage. Renew. Energy 2018, 123, 204–217. [Google Scholar] [CrossRef]
- Peris, B.; Navarro-Esbrí, J.; Molés, F.; Martí, J.P.; Mota-Babiloni, A. Experimental characterization of an Organic Rankine Cycle (ORC) for micro-scale CHP applications. Appl. Therm. Eng. 2015, 79, 1–8. [Google Scholar] [CrossRef]
- Algieri, A.; Morrone, P. Comparative energetic analysis of high-temperature subcritical and transcritical Organic Rankine Cycle (ORC). A biomass application in the Sibari district. Appl. Therm. Eng. 2012, 36, 236–244. [Google Scholar] [CrossRef]
- Lemmon, E.W. REFPROP Reference Fluid Thermodynamic and Transport. NIST Online Databases. Available online: https://www.nist.gov/srd/refprop (accessed on 26 April 2020).
- Algieri, A.; Morrone, P. Energetic analysis of biomass-fired ORC systems for micro-scale combined heat and power (CHP) generation. A possible application to the Italian residential sector. Appl. Therm. Eng. 2014, 71, 751–759. [Google Scholar] [CrossRef]
- Algieri, A.; Morrone, P. Techno-economic Analysis of Biomass-fired ORC Systems for Single-family Combined Heat and Power (CHP) Applications. Energy Procedia 2014, 45, 1285–1294. [Google Scholar] [CrossRef]
- Matek, B. Flexible Opportunities with Geothermal Technology: Barriers and Opportunities. Electr. J. 2015, 28, 45–51. [Google Scholar] [CrossRef]
- Feng, Y.; Zhang, W.; Niaz, H.; He, Z.; Wang, S.; Wang, X.; Liu, Y. Parametric analysis and thermo-economical optimization of a Supercritical-Subcritical organic Rankine cycle for waste heat utilization. Energy Convers. Manag. 2020, 212, 112773. [Google Scholar] [CrossRef]
- Wang, Q.; Wang, J.; Li, T.; Meng, N. Techno-economic performance of two-stage series evaporation organic Rankine cycle with dual-level heat sources. Appl. Therm. Eng. 2020, 171, 115078. [Google Scholar] [CrossRef]
- Chacartegui, R.; Vigna, L.; Becerra, J.A.; Verda, V. Analysis of two heat storage integrations for an Organic Rankine Cycle Parabolic trough solar power plant. Energy Convers. Manag. 2016, 125, 353–367. [Google Scholar] [CrossRef]
- Commission Delegated Regulation (EU) 2015/2402. Available online: https://eur-lex.europa.eu/eli/reg_del/2015/2402/oj?eliuri=eli%3Areg_del%3A2015%3A2402%3Aoj (accessed on 1 September 2019).
- Photovoltaic Geographical Information System (PVGIS). Available online: https://ec.europa.eu/jrc/en/pvgis (accessed on 4 May 2020).
- Jakubiec, J.A.; Reinhart, C.F. A method for predicting city-wide electricity gains from photovoltaic panels based on LiDAR and GIS data combined with hourly Daysim simulations. Solar Energy 2013, 93, 127–143. [Google Scholar] [CrossRef]
- System Advisor Model (SAM). Available online: https://sam.nrel.gov/ (accessed on 23 April 2018).
- Pallabazzer, R. Sistemi Di Conversione Eolica; Hoepli.IT: Milan, Italy, 2011. [Google Scholar]
- Decreto del Presidente del Consiglio dei Ministri 14 Novembre 1997 Determinazione Dei Valori Limite Delle Sorgenti Sonore. (GU Serie Generale n.280 del 01-12-1997). Available online: https://www.gazzettaufficiale.it/atto/serie_generale/caricaDettaglioAtto/originario?atto.dataPubblicazioneGazzetta=1997-12-01&atto.codiceRedazionale=097A9602 (accessed on 27 May 2020).
- Mathew, S. Wind Energy: Fundamentals, Resource Analysis, and Economics; Springer: New York, NY, USA, 2006; ISBN 978-3-540-30905-5. [Google Scholar]
- Manwell, J.F.; McGowan, J.G.; Rogers, A.L. Wind Energy Explained: Theory, Design and Application, 2nd ed.; Wiley: Chichester, UK, 2009; ISBN 978-0-470-01500-1. [Google Scholar]
- Rogers, A.L.; Manwell, S.; Wright, S. Wind Turbine Acoustic Noise, A White Paper; Renewable Energy Research Laboratory: Amherst, MA, USA, 2006.
- Algieri, A.; Morrone, P.; Perrone, D.; Bova, S.; Castiglione, T. Analysis of multi-source energy system for small-scale domestic applications. Integration of biodiesel, solar and wind energy. Energy Rep. 2020, 6, 652–659. [Google Scholar] [CrossRef]
- Drescher, U.; Brüggemann, D. Fluid selection for the Organic Rankine Cycle (ORC) in biomass power and heat plants. Appl. Therm. Eng. 2007, 27, 223–228. [Google Scholar] [CrossRef]
- Tocci, L.; Pal, T.; Pesmazoglou, I.; Franchetti, B. Small Scale Organic Rankine Cycle (ORC): A Techno-Economic Review. Energies 2017, 10, 413. [Google Scholar] [CrossRef]
- Calise, F.; d’Accadia, M.D.; Vicidomini, M.; Scarpellino, M. Design and simulation of a prototype of a small-scale solar CHP system based on evacuated flat-plate solar collectors and Organic Rankine Cycle. Energy Convers. Manag. 2015, 90, 347–363. [Google Scholar] [CrossRef]
- Ministero Dello Sviluppo Economico, Decreto Ministeriale 5 Settembre 2011-Regime Di Sostegno Per La Cogenerazione Ad Alto Rendiment. Available online: http://www.sviluppoeconomico.gov.it/images/stories/normativa/DM-5-SETTEMBRE2011.pdf (accessed on 13 April 2020).
- SunPower Italia. Available online: https://www.sunpowercorp.it/it (accessed on 26 April 2020).
- Aeolos—Wind Turbines—Home Wind Generators—Small Wind Turbines. Available online: https://www.windturbinestar.com/ (accessed on 26 April 2020).
- Dincer, I. Renewable energy and sustainable development: A crucial review. Renew. Sustain. Energy Rev. 2000, 4, 157–175. [Google Scholar] [CrossRef]
- Algieri, A.; Zema, D.A.; Nicotra, A.; Zimbone, S.M. Potential energy exploitation in collective irrigation systems using pumps as turbines: A case study in Calabria (Southern Italy). J. Clean. Prod. 2020, 257, 120538. [Google Scholar] [CrossRef]
- Rezaeiha, A.; Montazeri, H.; Blocken, B. A framework for preliminary large-scale urban wind energy potential assessment: Roof-mounted wind turbines. Energy Convers. Manag. 2020, 214, 112770. [Google Scholar] [CrossRef]
- Schibuola, L.; Scarpa, M.; Tambani, C. Demand response management by means of heat pumps controlled via real time pricing. Energy Build. 2015, 90, 15–28. [Google Scholar] [CrossRef]
- Balcombe, P.; Rigby, D.; Azapagic, A. Energy self-sufficiency, grid demand variability and consumer costs: Integrating solar PV, Stirling engine CHP and battery storage. Appl. Energy 2015, 155, 393–408. [Google Scholar] [CrossRef]
- Psimopoulos, E.; Bee, E.; Widén, J.; Bales, C. Techno-economic analysis of control algorithms for an exhaust air heat pump system for detached houses coupled to a photovoltaic system. Appl. Energy 2019, 249, 355–367. [Google Scholar] [CrossRef]
- ARERA—Prezzi Finali Del Gas Naturale Per I Consumatori Domestici—UE E Area Euro. Available online: https://www.arera.it/it/dati/gpcfr1.htm (accessed on 3 May 2020).
- Calise, F.; d’Accadia, M.D.; Vicidomini, M. Optimization and dynamic analysis of a novel polygeneration system producing heat, cool and fresh water. Renew. Energy 2019, 143, 1331–1347. [Google Scholar] [CrossRef]
- Turgut, M.S.; Turgut, O.E. Multi-objective optimization of the basic and single-stage Organic Rankine Cycles utilizing a low-grade heat source. Heat Mass Transfer. 2019, 55, 353–374. [Google Scholar] [CrossRef]
- Windustry. Available online: http://www.windustry.org/ (accessed on 3 May 2020).
- National Renewable Energy Laboratory (Nrel) Solar Technology Cost Analysis. Available online: https://www.nrel.gov/analysis/solar-cost-analysis.html (accessed on 4 May 2020).
- Superior Boiler. Available online: https://superiorboiler.com/boilers/ (accessed on 31 May 2020).
- Abd Rabu, R.; Janajreh, I.; Honnery, D. Transesterification of waste cooking oil: Process optimization and conversion rate evaluation. Energy Convers. Manag. 2013, 65, 764–769. [Google Scholar] [CrossRef]
- Settino, J.; Morrone, P.; Algieri, A.; Sant, T.; Micallef, C.; Farrugia, M.; Spitieri-Staines, C.; Licari, J.; Micallef, A. Integration of an Organic Rankine Cycle and a Photovoltaic Unit for Micro-Scale CHP Applications in the Residential Sector. Energy Procedia 2017, 126, 597–604. [Google Scholar] [CrossRef]
- Terna Transparency Report. Available online: https://www.terna.it/it/sistema-elettrico/transparency-report (accessed on 7 June 2020).
- Implementation of the Energy Performance of Buildings Directive Country Reports 2008; European Commission: Brussels, Belgium, 2008; ISBN 978-2-930471-29-7.


© 2020 by the authors. Licensee MDPI, Basel, Switzerland. This article is an open access article distributed under the terms and conditions of the Creative Commons Attribution (CC BY) license (http://creativecommons.org/licenses/by/4.0/).