Article

Cantilevered Piezoelectric Micro Generator Design Issues and Application to the Mining Locomotive

Underground Communication Research Laboratory, University of Quebec in Abitibi-Temiscamingue, 675, 1e Avenue, Val-d’Or, QC J9P1Y3, Canada
*
Author to whom correspondence should be addressed.
Energies 2020, 13(1), 63; https://doi.org/10.3390/en13010063
Submission received: 9 September 2019 / Revised: 8 December 2019 / Accepted: 18 December 2019 / Published: 20 December 2019

Abstract

:
This paper will present a complete discussion in recent design strategies for harvesting vibration energy using piezoelectric cantilever transducers. The interest in this primary energy source is due to its presence in non-negligible quantities in most of the engines used in the industrial process. Previous work has shown that it is possible to harvest significant amounts of energy capable of supplying a wireless sensor (WS) node. However, in most research, only one step of the energy conversion and utilization chain is studied. Starting from the definition of the different design issues for a piezoelectric micro generator (PMG), the leading optimization solutions will be reviewed in this paper. Based on the findings, the quantification of the data transmission range of wireless sensor nodes powered by a PMG is proposed to support the objectives envisioned by Industry 4.0. The vibration characteristics taken from mining locomotives that have not yet been treated previously are used to illustrate the improvement of the various optimization solutions. Through our objectives, this work offers a comprehensive discussion on the use of vibrational energy by wireless sensors, bringing together the fields of mechanics, electrical, electronics, and wireless communications. The theoretical basis for each design stage is provided through the design equations. Based on actual measurements of ambient vibration, it is demonstrated, considering an optimal design of the PMG, that a WS could transmit data beyond 1 km for physical phenomena to be controlled every 7 min.

1. Introduction

Nowadays, the need to automate most industrial processes is essential. This automation increases productivity, reduces costs, improves efficiency, and increases safety [1]. There is growing talk of Industry 4.0 [2], in which manufactured products can control their manufacturing processes. Let us recall that in the first industrial revolution it was the question of the mechanization of the industrial processes. The intensive use of electric energy led to the second industrial revolution, and widespread digitization led to the third industrial revolution.
In automated systems, most devices have communication facilities that allow them to transmit information on their operating status at regular intervals of time. Such objects are called smart objects and are also the basis of the new paradigm known as the Internet of Things (IoT) [3]. For example, the IoT considers the incorporation in the same building of several sensors for monitoring operations; this concept is known as the smart building [4]. An essential step in the automation of industrial processes is then, to provide most devices by micro-sensor capable of performing simple measurement in their immediate environment and transmitting them to a base station (BS) [5].
Initially, the sensors used are wired, and when many sensors are needed, these wired connections can be troublesome for many industrial applications [6]. This has led to the advent of the wireless sensor (WS) [7], which by freeing wired connections offers more flexibility in their deployment. The data collected by WS are transmitted wirelessly to BS. Given the advantages offered by the WS, namely flexibility, ease of deployment, low cost, they are now playing a vital role in the industry 4.0 [8]. More specifically, in the industrial environment, WSs are used in the automation system [9], operations control, system monitoring (humidity, temperature, fire alarm, dust index, toxic gas, and pollution) [9,10], and motion control [11]. In most of these industrial applications, WSs are placed in difficult-to-access locations (mining crushers for example) and maintenance operations for the replacement of batteries can be costly.
This issue of energy autonomy of WSs has given rise in recent years to a new field of research known as energy harvesting (EH) [12]. Energy harvesting is the process of converting ambient energy into electrical energy; the most targeted application is the power supply of the WSs.
EH technologies differ from one another depending on the nature of the used primary energy source. The main considered sources are the internal light, electromagnetic energy, vibration, and heat [13]. Among these primary sources, vibration abounds in the industrial applications due to the many engines used in most processes [14]. Concerning the specific case of the mining industry, crushers that operate 24 h a day, mining locomotives for the transport of personnel and minerals, trucks, are examples of sources of vibration.
A lot of research has been proposed in recent years to optimize the performance of vibratory energy harvesters. However, since the harvesting and use of vibration energy combine three areas of activity (mechanical, electronic and wireless communications), very little or no work offers a comprehensive analysis of the performance of the WS powered by the harvested energy. Therefore, it is to overcome this lack that this paper proposes an end-to-end analysis of the autonomous WS based on the vibratory energy; the performance criterion is the transmission range of the node. To achieve this objective, Section 2 recalls the problematic of this paper as well as a comparison with related works. In Section 3, there will be a question of sizing the PMG for optimal harvesting. In Section 4, we apply the design strategies mentioned earlier to the design of a PMG optimized for Industrial Wireless Sensor (IWSs) applied to a mining locomotive. Finally, the conclusion of this paper is proposed in Section 5.

2. Context, Problematic, Main Contributions and Comparison with Related Work

2.1. Context of the Study

Given the advantages offered by the WSs, namely flexibility, ease of deployment, low cost, mentioned above, they can play a vital role in Industry 4.0 [8]. However, in most industrial process, sensors are placed in difficult-to-access locations. An example is the drive diagram of semi-autogenous grinding (SAG) in the mining industry shown in Figure 1 [15].
Figure 1 shows a process that requires multiple sensors for speed control, vibration levels, and temperature regulation. Access to these sensors is very often complicated, and this makes the maintenance operations due to charging or replacing the batteries, costly because, in most cases, this requires the cessation of production. This work is then in the context of the EH, which aims to extend the lifespan of sensor nodes.

2.2. Problematic and Main Contributions

This paper is intended to define the main design issues of autonomous WS based on piezoelectric energy harvesting (PEH). The conversion chain for optimal harvesting will be reviewed, to improve existing solutions and propose new optimization solutions. The problematic of this work is thus to provide a reliable perpetual power supply to WSs deployed in an industrial environment. The interest of WSs in an industrial environment is no longer to be justified in the light of Industry 4.0 requirements (automation through the use of smart objects [16]).
To consider the use of vibration energy using piezoelectricity, a piezoelectric transducer (PT) is used to convert vibrations into alternative electrical energy. The amplitude of this alternating current (AC) energy is very often small to be directly straightened by a diode; a non-linear module is then used to amplify the harvested energy. The increased AC energy is then rectified, filtered, and adapted to be stored in a battery. This battery will then be used to power a WS. On the other hand, the function of the WS will be the measurement of environmental data, their processing, and the transmission of the processed data to BS. This end-to-end use of vibrational energy is shown in Figure 2 below.
This paper is intended to recall the main design issues of autonomous WS based on PEH. The conversion chain for optimal harvesting will be reviewed, to improve existing solutions and propose new optimization solutions. This work is motivated by the fact that after observing the conversion chain shown in Figure 1, we found that very few PMG design works offer a complete design solution for a given application. We understand by a complete design solution, a design that considers the energy need of WS, the characteristics of ambient vibrations, the design of the optimal PT, and an adapted energy harvested circuit (EHC) while aiming to limit the size of the PMG. However, in the literature, most of the work deals with only one and at most two of the issues. This can be justified by the fact that a complete solution combines several specialties, the most important of which are: mechanics, electronics, power electronics, and wireless communications.
In the field of mechanics, it is more precisely dealt with the characteristics of vibrations and PT. One of the pioneers in the design of PT is S. Roundy [17]. He has developed through his various works, some of which are mentioned in [18,19,20,21], the design equations of PT for optimal harvesting.
In the electronic field and more specifically in the design of the non-linear module, D. Guyomar, through many research including [22,23,24,25], proposed solutions to amplify the output voltage of the PT. About the rectification of the AC signal provided by the PT, some of the work offered in recent years is also to be considered. These works focus on the design of new diodes with increasingly low threshold voltages [26,27] because it helps to minimize losses in the conversion circuit.
In the field of power electronics, advances in the design of direct current (DC)/DC converters are also to be careful to optimize the harvested power. These converters not only improve the conversion efficiency [28,29,30] but also perform maximum power point tracking (MPPT) [31,32].
The wireless communications domain also interests the operability of a WS powered by a PMG. This is because it is necessary to propose energy consumption models of WSs that are quite complete [33,34,35] to be able to predict the reliability of the autonomous WS. Intending to an optimal solution, we must also consider the solutions proposed in recent years, aiming to minimize the energy budget of the WSs [36,37,38,39].
This work is addressed to beginners in the field as well as to experts who would like to bring new optimization solutions. We want this paper to alleviate the fact that the different areas involved in the design of PMGs have evolved as long separately. The main contributions of this review can then be summed up as follows:
  • Define the design consideration of PMG.
  • Undertake an analytical study of a PMG by provides the design equations.
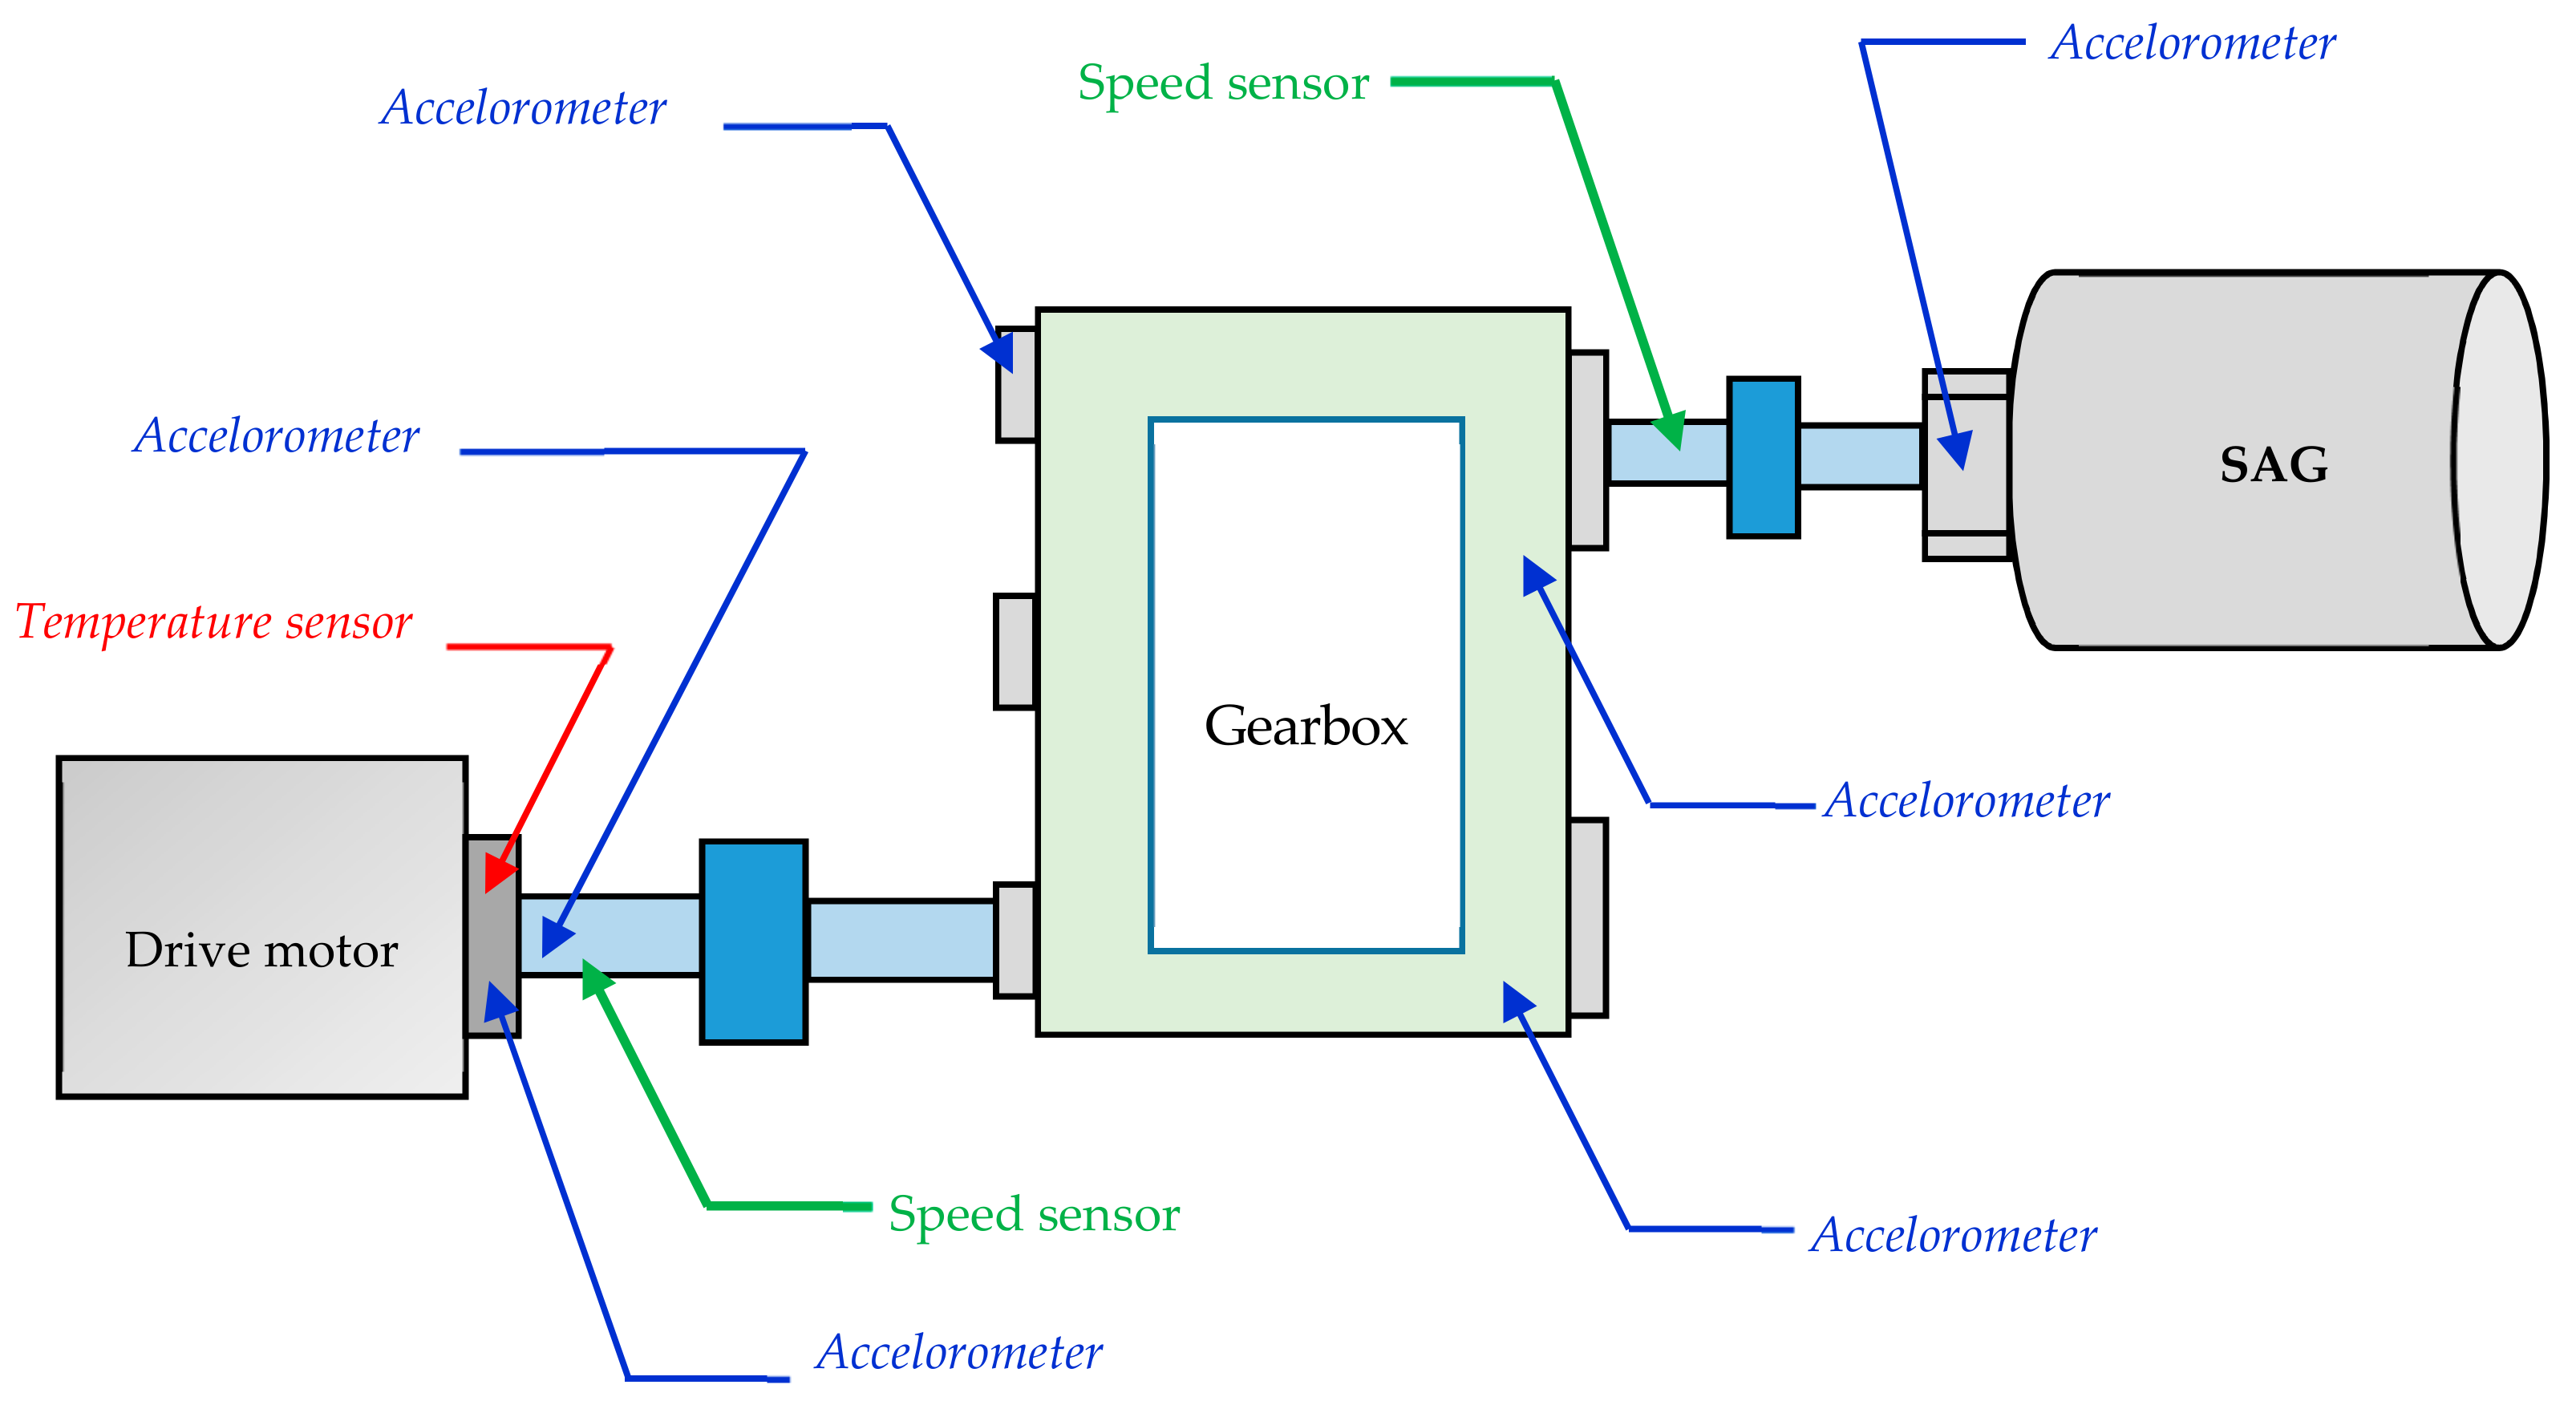
  • Vibration levels detected in a mining locomotive.
  • Design, modeling, and simulation of PMG dedicated to WSs for industrial applications.
  • Estimation of the level of harvestable power in a mining locomotive.
  • Performance evaluation of the WS powered by the harvested energy.

2.3. Comparison with Related Works

As mentioned above, very few works or even a survey offer a complete discussion of harvesting and exploitation of vibratory energy. Most of the surveys focus only on one part of the complete solution. As comparative studies, we refer readers to the work and surveys referred to [8,19,24,40,41,42,43,44,45,46,47,48,49]. A summary of this research is listed down in Table 1.
The work in [8] proposes a review of wireless sensor networks (WSN) in the context of Industry 4.0. It is addressed to the industrial environment of WSN topology, IWSs communications technologies, significant applications of IWSs, and major IWSs features. It also provides a new architecture based on the quality of service (QoS) and quality of data for IWNs.
In [40], it is presented a complete review of the history of vibrational piezoelectric conversion. After classifying piezoelectric energy harvesters into three major groups: macro and mesoscale, micro electromechanical systems (MEMS) scale, and nanoscale, Alperen and Honor recalled the manufacturing methods and the reached output power levels. This work considered only the PT without an EHC. The influence of the piezoelectric material is also treated.
In recent years, to follow the miniaturization of the WSs, many works have been proposed to accompany the miniaturization of PTs, which are classified in [40] into three groups: macro and mesoscale, MEMS scale, and nanoscale. To take into account three-dimensional effects in PT structures, even at small scales, analysis tools have been developed in [48] while maintaining the one-dimensional model by Giacomo et al.
Giacomo et al. in [49] also analyzed the complex domain concerning the modeling of non-linear transducers. Nonlinear analysis of the behavior of the piezoelectric transducer was considered, and an experimentally validated model was established.
In [47], the advances made in the field of vibrational energy harvesting means piezoelectric and electromagnetic transducers have been proposed. This work also deals only with the PT without taking an interest in the EHC circuit. The different geometries of the transducer are presented as well as the design equations.
In [42], Niezrecki et al. have treated the physical principle of piezoelectric conversion by emphasizing the used piezoelectric material. They also only deal with the architecture of the PT.
In [43], Renaud et al. have postponed the manufacturing techniques of PTs. More precisely, after having processed the machining technologies, a PT is then manufactured. By deriving analytical equations, a comparison between theoretical estimations and experimental results was proposed.
In [44], Lu et al. have proposed a power balance of the PT and have derived the optimal DC power recoverable through a PT combined with a bridge rectifier.
Roundy et al. [19], which is the most comprehensive and reference work to date, have proposed modeling a PMG conversion chain including PT, diode bridge, and DC/DC converter. Equivalent electrical circuits have been established, and an expression of the optimal load resistance has been defined according to the dimensions of the PT. The input characteristics of their design have been set for an acceleration of 2.5   m / s 2 and a frequency of 120   Hz .
Guyomar et al. offer in [24] the state of the art on the various nonlinear techniques designed to amplify the open circuit performance of the PT. The optimization of the PMG through DC/DC converters is widely discussed in [45].
Caliò et al. [46], have proposed a review on solutions of piezoelectric energy harvesting. It is mainly developed according to the principle of piezoelectric transduction, the properties of the main piezoelectric materials, the modeling of PT, and the performance of PTs in terms of power density. The techniques for adjusting the frequency are also processed. This is one of the most comprehensive survey on PMGs; the only aspect that has not been addressed is the definition of PMG design considerations.
As can be seen, very little or no work proposes the complete conception of the PMGs, because of the multidisciplinary nature of this research field. It is to be seen that the most processed design phase in the literature is that of the PT. It also appears that very few surveys incorporate the energy budget of the WS into their studies. However, these are the primary design consideration, since, in most industrial processes, events can occur at any time. It is essential to ensure that the amount of the harvested energy allows the WS to be able to track these events to ensure a good quality of service.
In comparison with the work mentioned above, we have in this paper integrated the requirements of wireless communications and defined all design considerations of the PMG. The rest of this paper deals with the sizing of the PMG for a given application. Each floor will be treated individually to deduce a global optimization solution.

3. Design Consideration of a Piezoelectric Micro Generator for Wireless Sensor

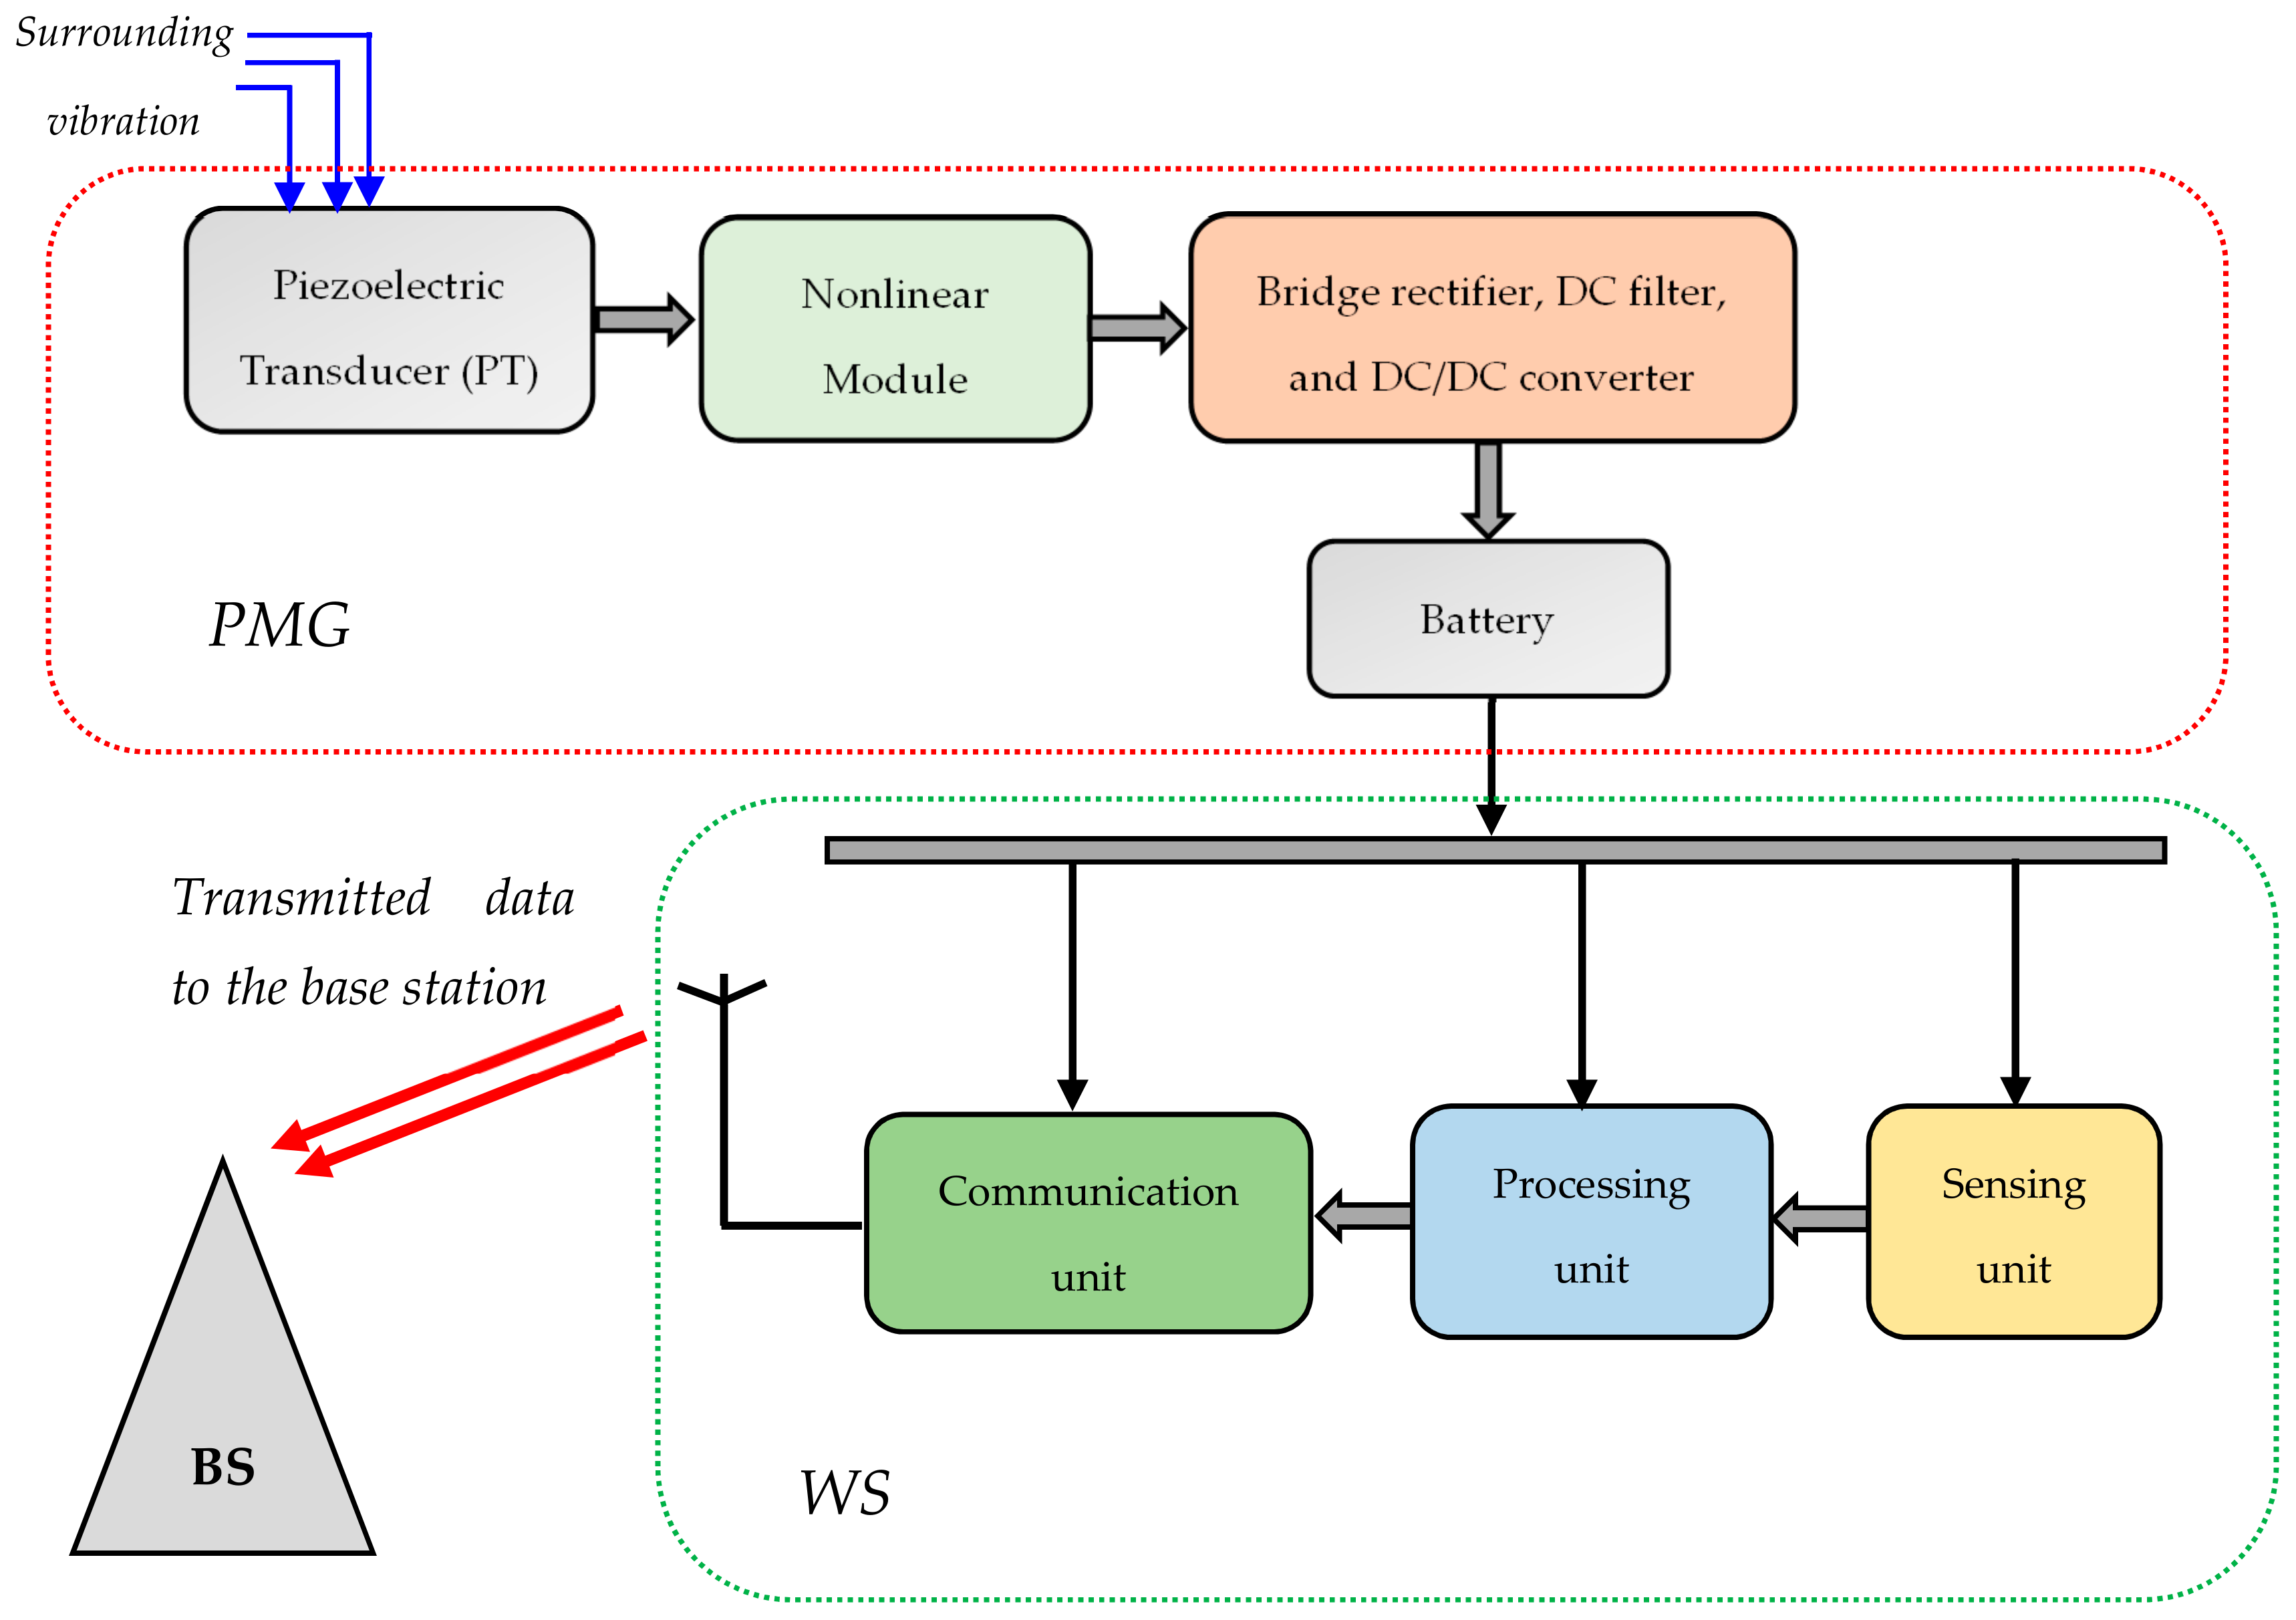
3.1. Generic Model for Converting Vibrations into Electrical Energy

Since the input of PMG is the vibrations, it is obvious that its performance strongly depends on the characteristics of the input vibrations. The model for converting vibrations into energy was proposed by William et al. [50]. The model consists of a second-order system that relates the input vibration y t to the output displacement z t , as shown in Figure 3. K is the stiffness, m is the equivalent mass, and b m and b e are, respectively, the mechanical and electrical damping.
From the model in Figure 3, and for a sinusoidal excitation vibration, the electrically generated power by the system is expressed in [51] as:
P = m ξ Y 2 ω ω n ω 3 1 ω ω n 2 2 + 2 ξ ω ω n 2  
with ω n and Y is the resonant frequency and the amplitude of vibration, respectively. ξ is the damping ratio ξ = b / 2 m ω n .
Figure 4 is an example of an electrical power frequency response for several electrical damping values. The result is that the maximum power is reached at the resonance, from where they need before any design to determine the characteristics of ambient vibrations. For ω = ω n , the maximum recoverable power is obtained from the Equation (1) as:
P max = m Y 2 ω 3 4 ξ
This expression can finally be written in the function of the input acceleration A (with A = ω 2 Y ) as follows:
P max = m A 2 4 ξ ω n
The latter equation shows that the maximum recoverable power is proportional to the square of the amplitude of the input acceleration A and inversely proportional to the fundamental frequency ω n .

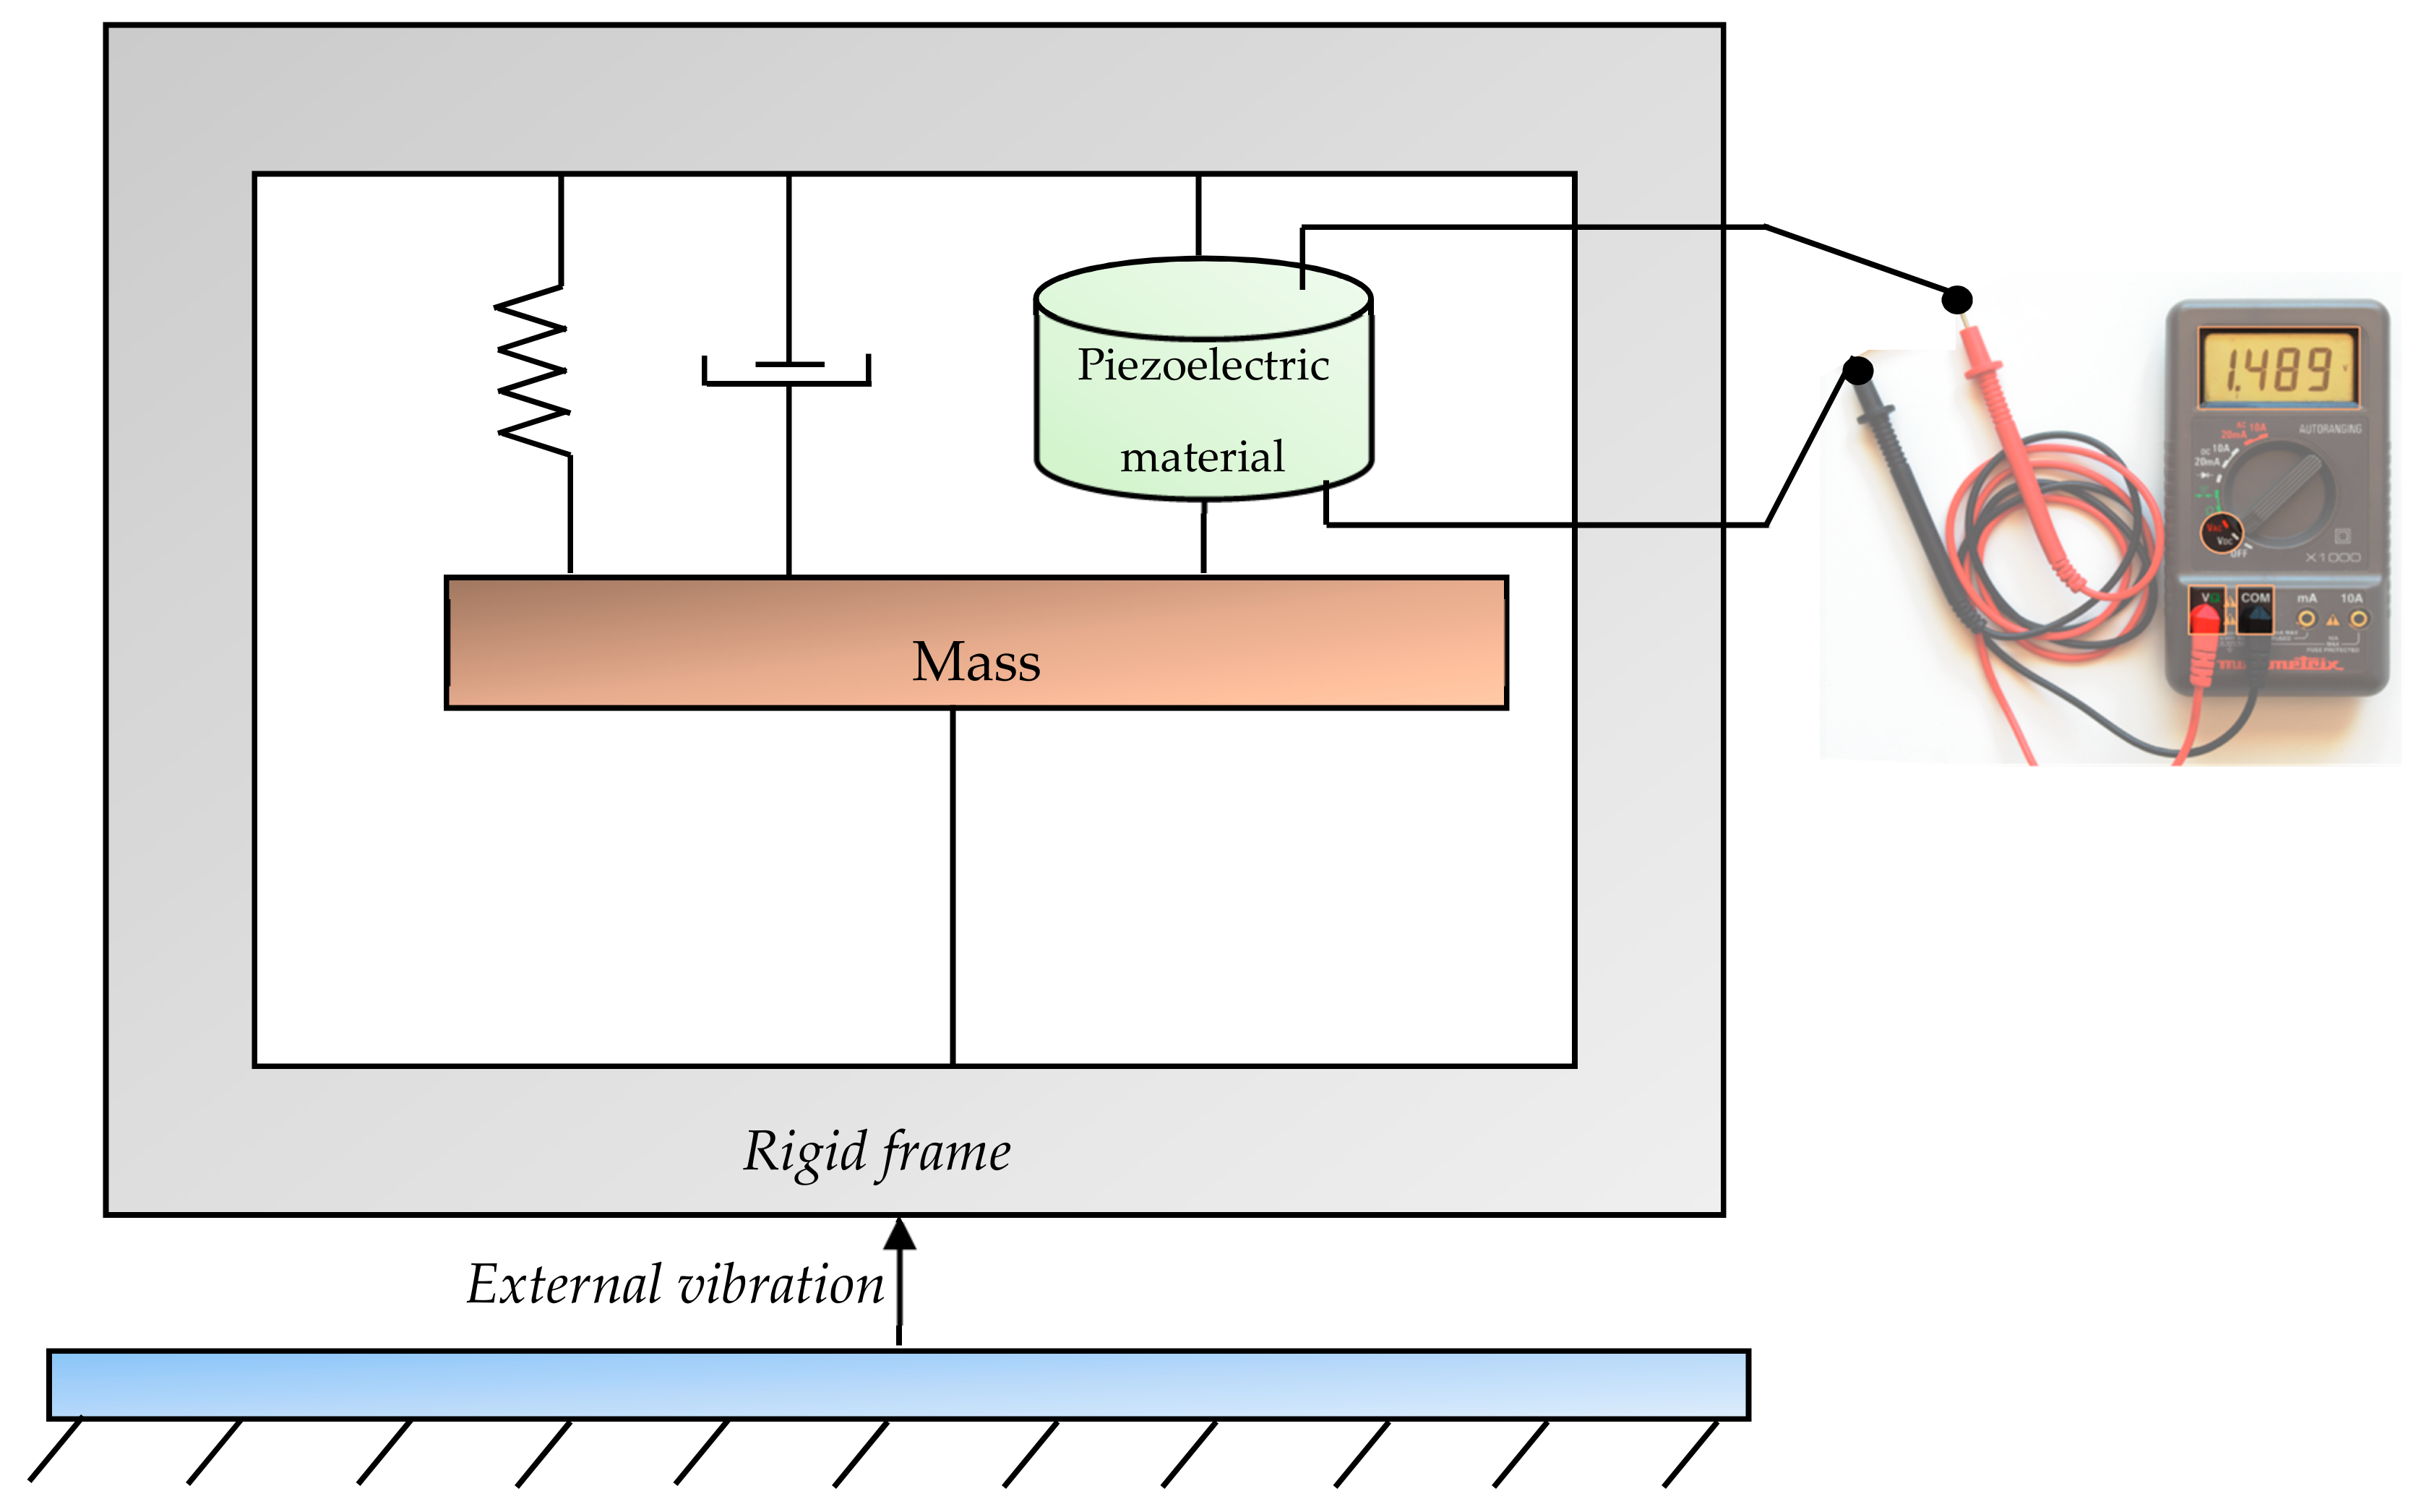
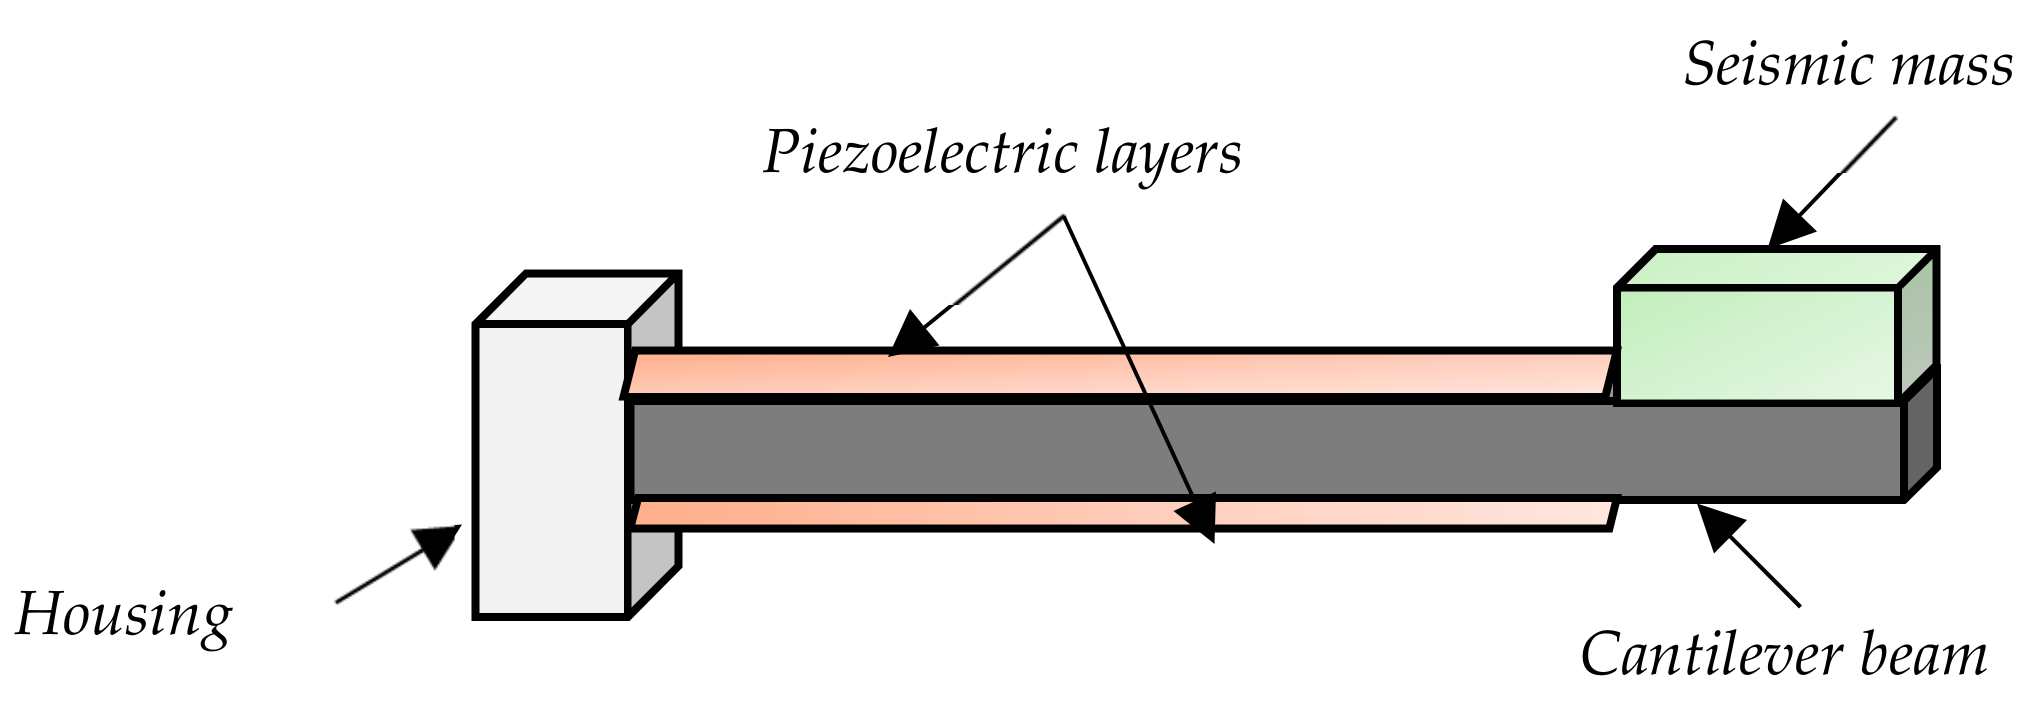
3.2. The Piezoelectric Transducer (PT) Design

Once the characteristics of the ambient vibrations are known, they will allow the PT to be sized. The PT is the essential element of the conversion chain; this is justified by the results reported in Table 1. There are three main conversion mechanisms of the mechanical energy of vibrations into electrical energy: electrostatic, electromagnetic, and piezoelectric. These different techniques of harvesting vibrational energy have been detailed in [47]. Among these conversion mechanisms, the piezoelectric technique has received the most attention, thanks to its direct mechanical-electric conversion ability, and thanks to its capacity to be integrated into desired applications [48,52].
The piezoelectric conversion means is based on the piezoelectric effect discovered in 1880 by the Curie Brothers [53]. They found that some crystals possessed the property to polarize under the result of pressure, with a degree of polarization proportional to the degree of pressure; this is the direct piezoelectric effect as shown in Figure 5.
They exist a series of constants that evaluate the activity level of piezoelectric material, and the main one are the piezoelectric strain constant d , the electromechanical coupling coefficient k , and the dielectric permittivity ε [47,48,49]. The factors d and k , are respectively defined by Equations (4) and (5) below.
  d = strain   developed applied   field
k i j 2 = W i e W j m
where W i e is the electrical energy stored in the i a x i s and W j m is the mechanical input energy in the j a x i s .

3.2.1. PT Design Equations

Several PTs geometries exist in the literature; most of them are treated in [47,54]. In most real-world applications, the fundamental vibrational frequency values are relatively low. It would be difficult to use a piezoelectric material directly as an elastic element; obtaining a flexible structure allowing large displacement requires a leverage action. This leverage action is usually achieved by using a structure of the fix-free beam type, better known as a cantilever structure [19,48,49,55].
The cantilever-type PT is shown in Figure 6 below and consists of three main parts: piezoelectric layers, cantilever beam, and seismic mass [19]. The piezoelectric layers that make up the active part of the structure are used to convert the mechanical vibrations into electrical energy. The cantilever beam is used to amplify the relative displacement of the seismic mass. Finally, the seismic mass increases the mechanical stress applied to the piezoelectric layers, thereby increasing the output power. The electrical output performance of a cantilever PT depends on its L, W, h and m dimensions, respectively, for length, width, thickness, and seismic mass.
The PT for a given application must consider, the amplitude A of the input vibrations, the fundamental frequency f R , of the supply voltage level of the EHC, V OC , and finally of the required power to operate the WS, P W S . The dimensions of the PT influence all these parameters.
Without looking at the design parameters mentioned above, in the literature, several designs are satisfied to recover a certain amount of energy. In [6] for example, a power of 1.1   μ W from vibrations in an moving automobile at 60   km / h . The authors in [6] have used, to achieve the above performance, the composite QP21B of Mide Technology whose dimensions are 41.4 × 17 × 0.76   mm 3 . The design equations of a PT are resulting from the work of Smith et al. [56,57], where the constitutive equations describing the behavior of a bimorph cantilever PT have been derived. In these equations, the deflection δ at the free end of the beam and the charges Q on the electrodes, are connected to the applied force F to the free end of the beam and to the applied voltage V   to the electrodes through a matrix 2 × 2 expressed under the static conditions as follows:
δ Q = S 11 L 3 2 W h 3 3 d 31 L 2 4 h 2 3 d 31 L 2 4 h 2 2 ε 33 W L h 1 k 31 2 4 F V
The factors S 11 ,   d 31 ,   k 31 and ε 33 depend on the used piezoelectric material. If the piezoelectric beam comprises only the piezoelectric layers, the thickness t of the piezoelectric beam is linked to that of a piezoelectric layer by the relationship:
t 2   h

Resonance Frequency of the PT

Depending on the size L ,   W , h of the beam and the seismic mass m , the resonance frequency f R is derived from the constitutive equations, considering the absence of an external tension V ; what gives:
f R = 2 π W h 3 S 11 L 3 m

Open Circuit Voltage of a PT

For the WS to receive energy, the PT’s open-circuit voltage V OC   must exceed a certain threshold. The generated open circuit voltage is defined in [58] as follows:
V OC = 3 2 d 31 L Q m m A ε 33 W h

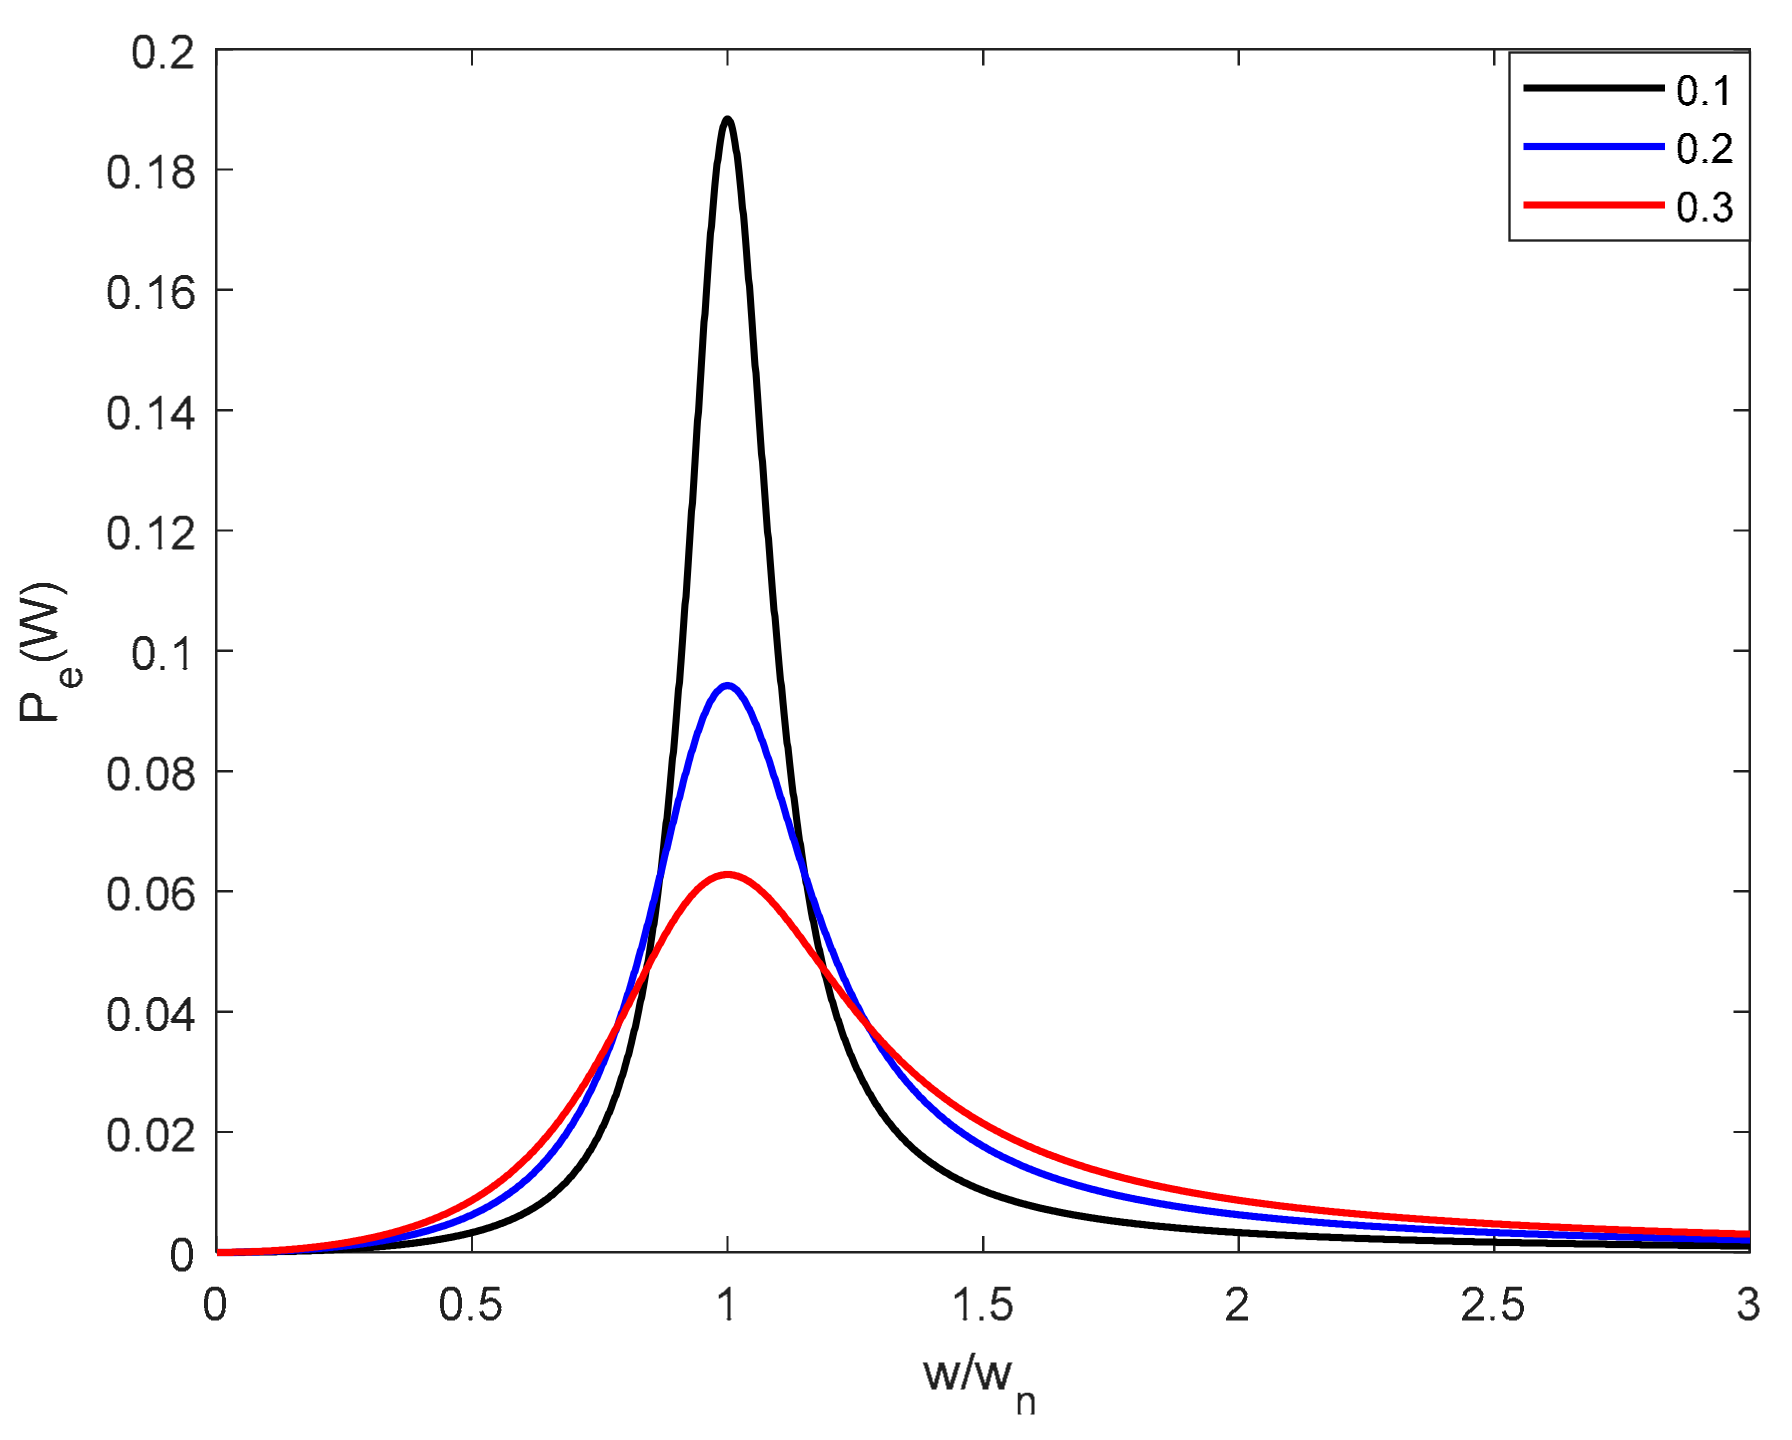
Output Power of the PT

It is important to consider the energy budget of the WS when designing the PT as well as the dissipated power in the EHC. As for the consumed power in the EHC, it depends on the used diodes.
Concerning the energy consumed by the WS, it can be evaluated through its different activities; this activity depends on the WSN topology in which the WS is located. In most industrial applications, the used WSNs are star types [59,60], i.e., they consist of BS, also called a coordinator or sink, and a set of WSs that directly transmit the collected data to the sink. As an indication, the other main WSN topologies are the mesh topology [61] and the cluster topology [62]. A comparison of the performance of these topologies is offered in [63]. Figure 7 below represents a star-type WSN and the various activities of the WS in the network [64].
As shown in Figure 7b, three sources of energy dissipation must be considered to estimate the power consumed by the WS: sensor sensing, microcontroller processing, and radio transmission.
The sensor sensing energy E acqui is defined in [33] as the sum of the energies due to data capture E sens   and that necessary to record the data in memory E record . Its estimated expression for a packet size of bits is defined in [33] as follows:
E acqui = V sup I sens T sens E sens + V sup 8 I read T read + I write T write E record
where V sup is the supply voltage of the WS. I sens , I read , and I write are respectively, the total current required for sensing activity, the current for reading 1-byte data and the current for writing 1-byte of data. T sens , T read , and T write are, respectively, the time duration for WS sensing, the time duration for reading 1-byte data and the time duration for writing 1-byte data.
Energy for data processing E pro includes energy loss from switching E switch and the energy loss due to leakage current E leak [33]. In [65] E pro is expressed as:
E pro = N cyc C avg V sup 2 E switch + V sup I 0 e V sup n P V t N cyc f E leak
where N cyc is the number of clock cycles per task, C avg is the average capacitance switch per cycle, I 0 is the leakage current, n P is a constant which depends on the processor, V t is the thermal voltage, and f is the sensor frequency.
Energy for the transmission of bits-data, E tx depends on the distance d between the WS and the sink and the path loss exponent [66]. Assuming that the transmission distances are greater than 88   m as in [34], this energy is expressed as follows:
E tx , d = E elec + ε amp d 4
where E elec is the energy consumption per bit in the transmitter and the receiver circuitry. Its value is evaluated experimentally in [37] at 50   nJ / bit . ε amp represents the transmit amplifier for two rays evaluated experimentally also in [37] at 0.0013   pJ / bit / m 4 .
Equations (10)–(12) show that, once the hardware parameter of the used WS, is defined, the energy dissipated to transmit data depends on the packet’s length and the total distance d between the WS and the sink. This energy requirement of the WS per operating cycle, E WS is thus defined by:
E WS ,   d = E acqui + E tx , d + E pro
From the WS energy budget, the power to be provided by the PT can then be determined as follows:
P = E W S T + P d , E H C
where P d , E H C is the dissipated power in the EHC, T represents the duration of a WS operating cycle that is defined by:
T = T sens + T read + T write + T A + T sleep
T sens , T read , and T write are defined as previously, while T A and T sleep represents the duration of the active mode and the sleeping mode respectively, of the microprocessor used. Considering as in most of the work the parameters of the Mica2 Motes [67], the time duration of the active mode will be 1   mS and that of the sleeping at 299   mS as in [68].
To quantify the energy required for the operability of the WS, the parameters of commercial off-the-shelf components are often used. For the CC2520 of Texas Instruments, used in several works like [33,64,69], the parameters for estimating the energy budget, and the references in which these values were defined are reported in Table 2.

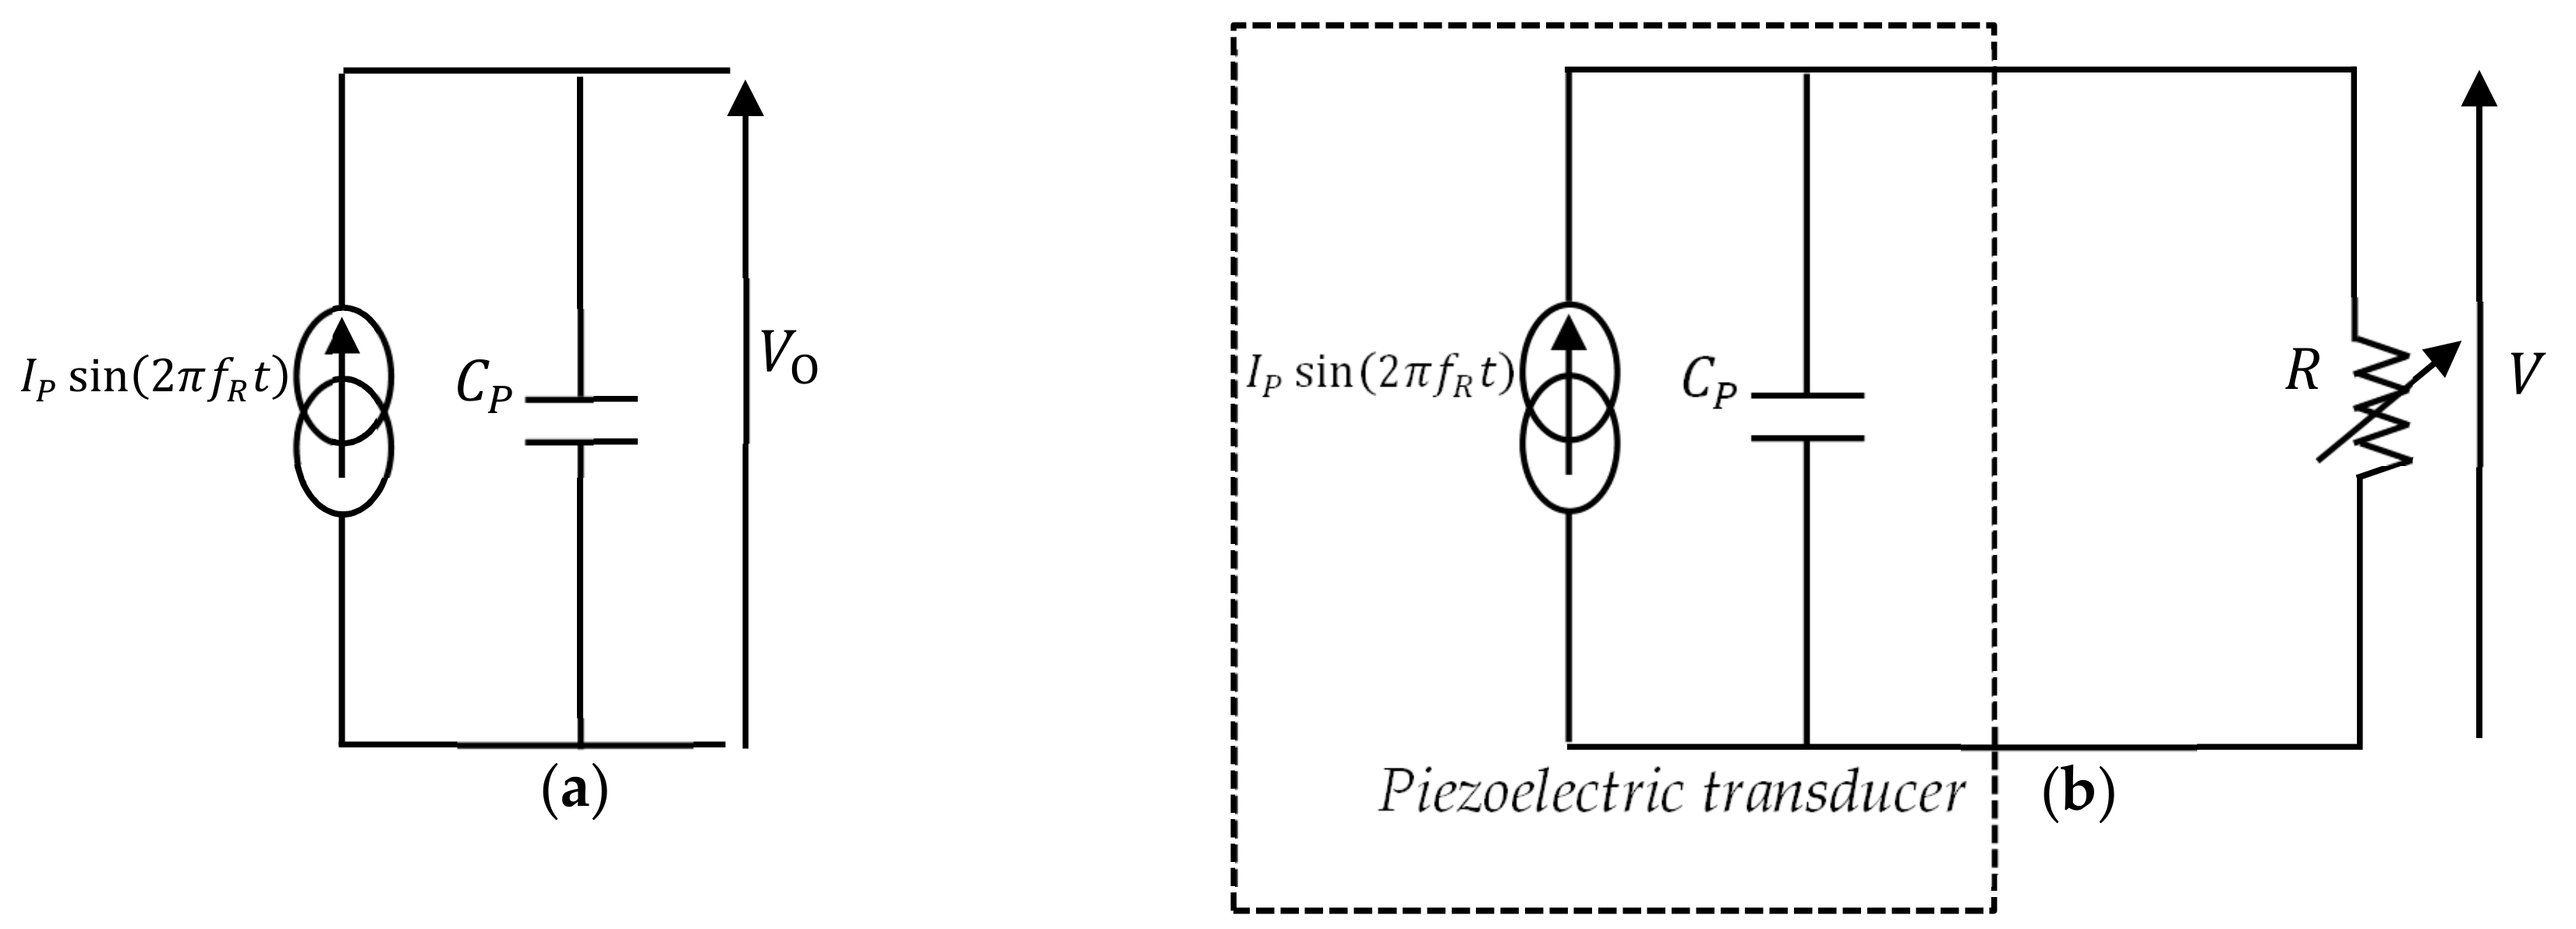
3.2.2. Electrical Model of PT

An electric model of the transducer is necessary to size the energy harvesting circuit. In [29,31], it has been established that the PT at the resonance is equivalent, to an alternating current source of magnitude I P and frequency f R , in parallel with a capacity C P as shown in Figure 8. In [19], it is established that the current source i P t is proportional to the moving speed as follows:
i P t = L W d 31 S 11 S ˙
where S ˙ is the strain rate, and the value of the capacitor C P is determined as follows:
C P = ε 33 W L t
A method is proposed in [31,73] to determine experimentally the parameters I P and C P . It consists of connecting to the PT various resistance value as shown in Figure 8b. For each resistance value, the excitation frequency is adjusted to the system resonance frequency and, the output voltage V 0 is taken. This voltage is theoretically expressed as:
V 0 = I P R 1 + 2 π f R C P 2  
A least-squares adjustment of the data to the Equation (16) allows determining the values of C P and I P . It is this method that we will use in this work to electrically model the PT for the measured vibration characteristics.

3.3. The Non-Linear Circuit Design

The output voltages, as well as the power levels of the PTs, are generally very low. In [74] for example, it was necessary to put five PT (with the unit dimensions of 3 × 2.4 × 0.05   mm 3 ) and a seismic mass of 8 × 12.4 × 0.5   mm 3 to achieve 66.75   μ W under an optimal load resistance of 220   k Ω ; this when the acceleration was 5   m / s 2 , and the frequency, 234.5   Hz . It is obvious that such PT would be cumbersome for real WSs which are very small.
The research carried out in the field of nonlinear modules has the purpose of proposing solutions to amplify the voltage and the maximum energy that can be transferred to the load. The most used non-linear technique is the synchronized switch harvesting on inductor (SSHI) technique [22].

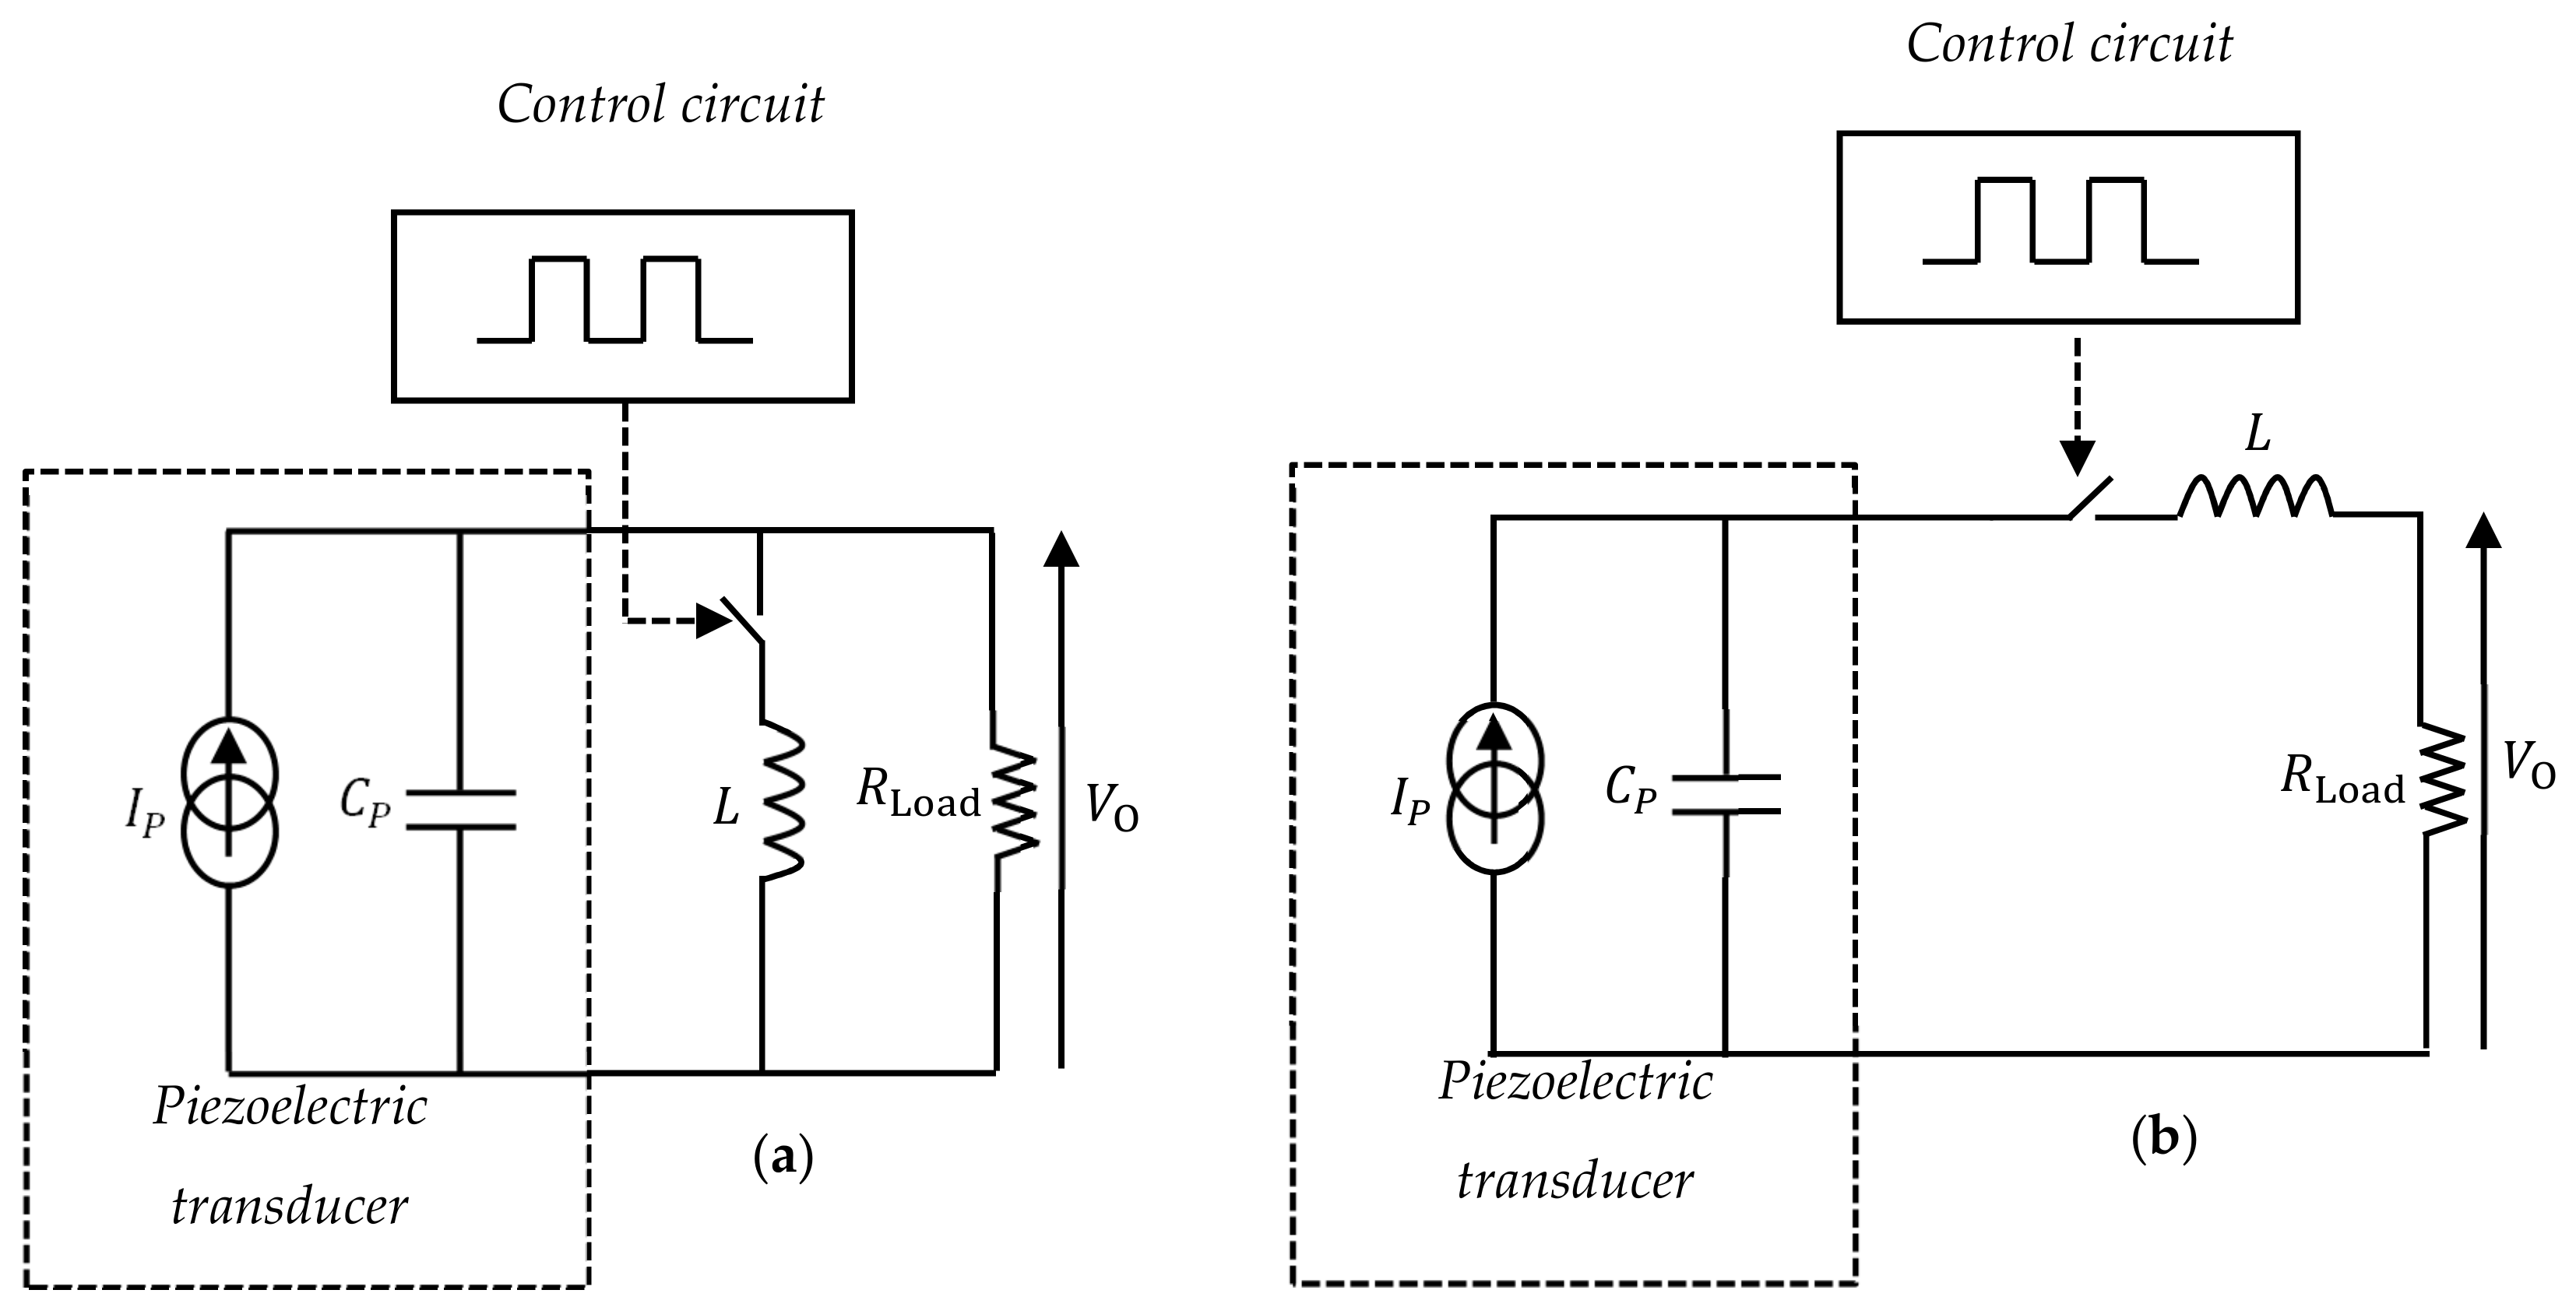
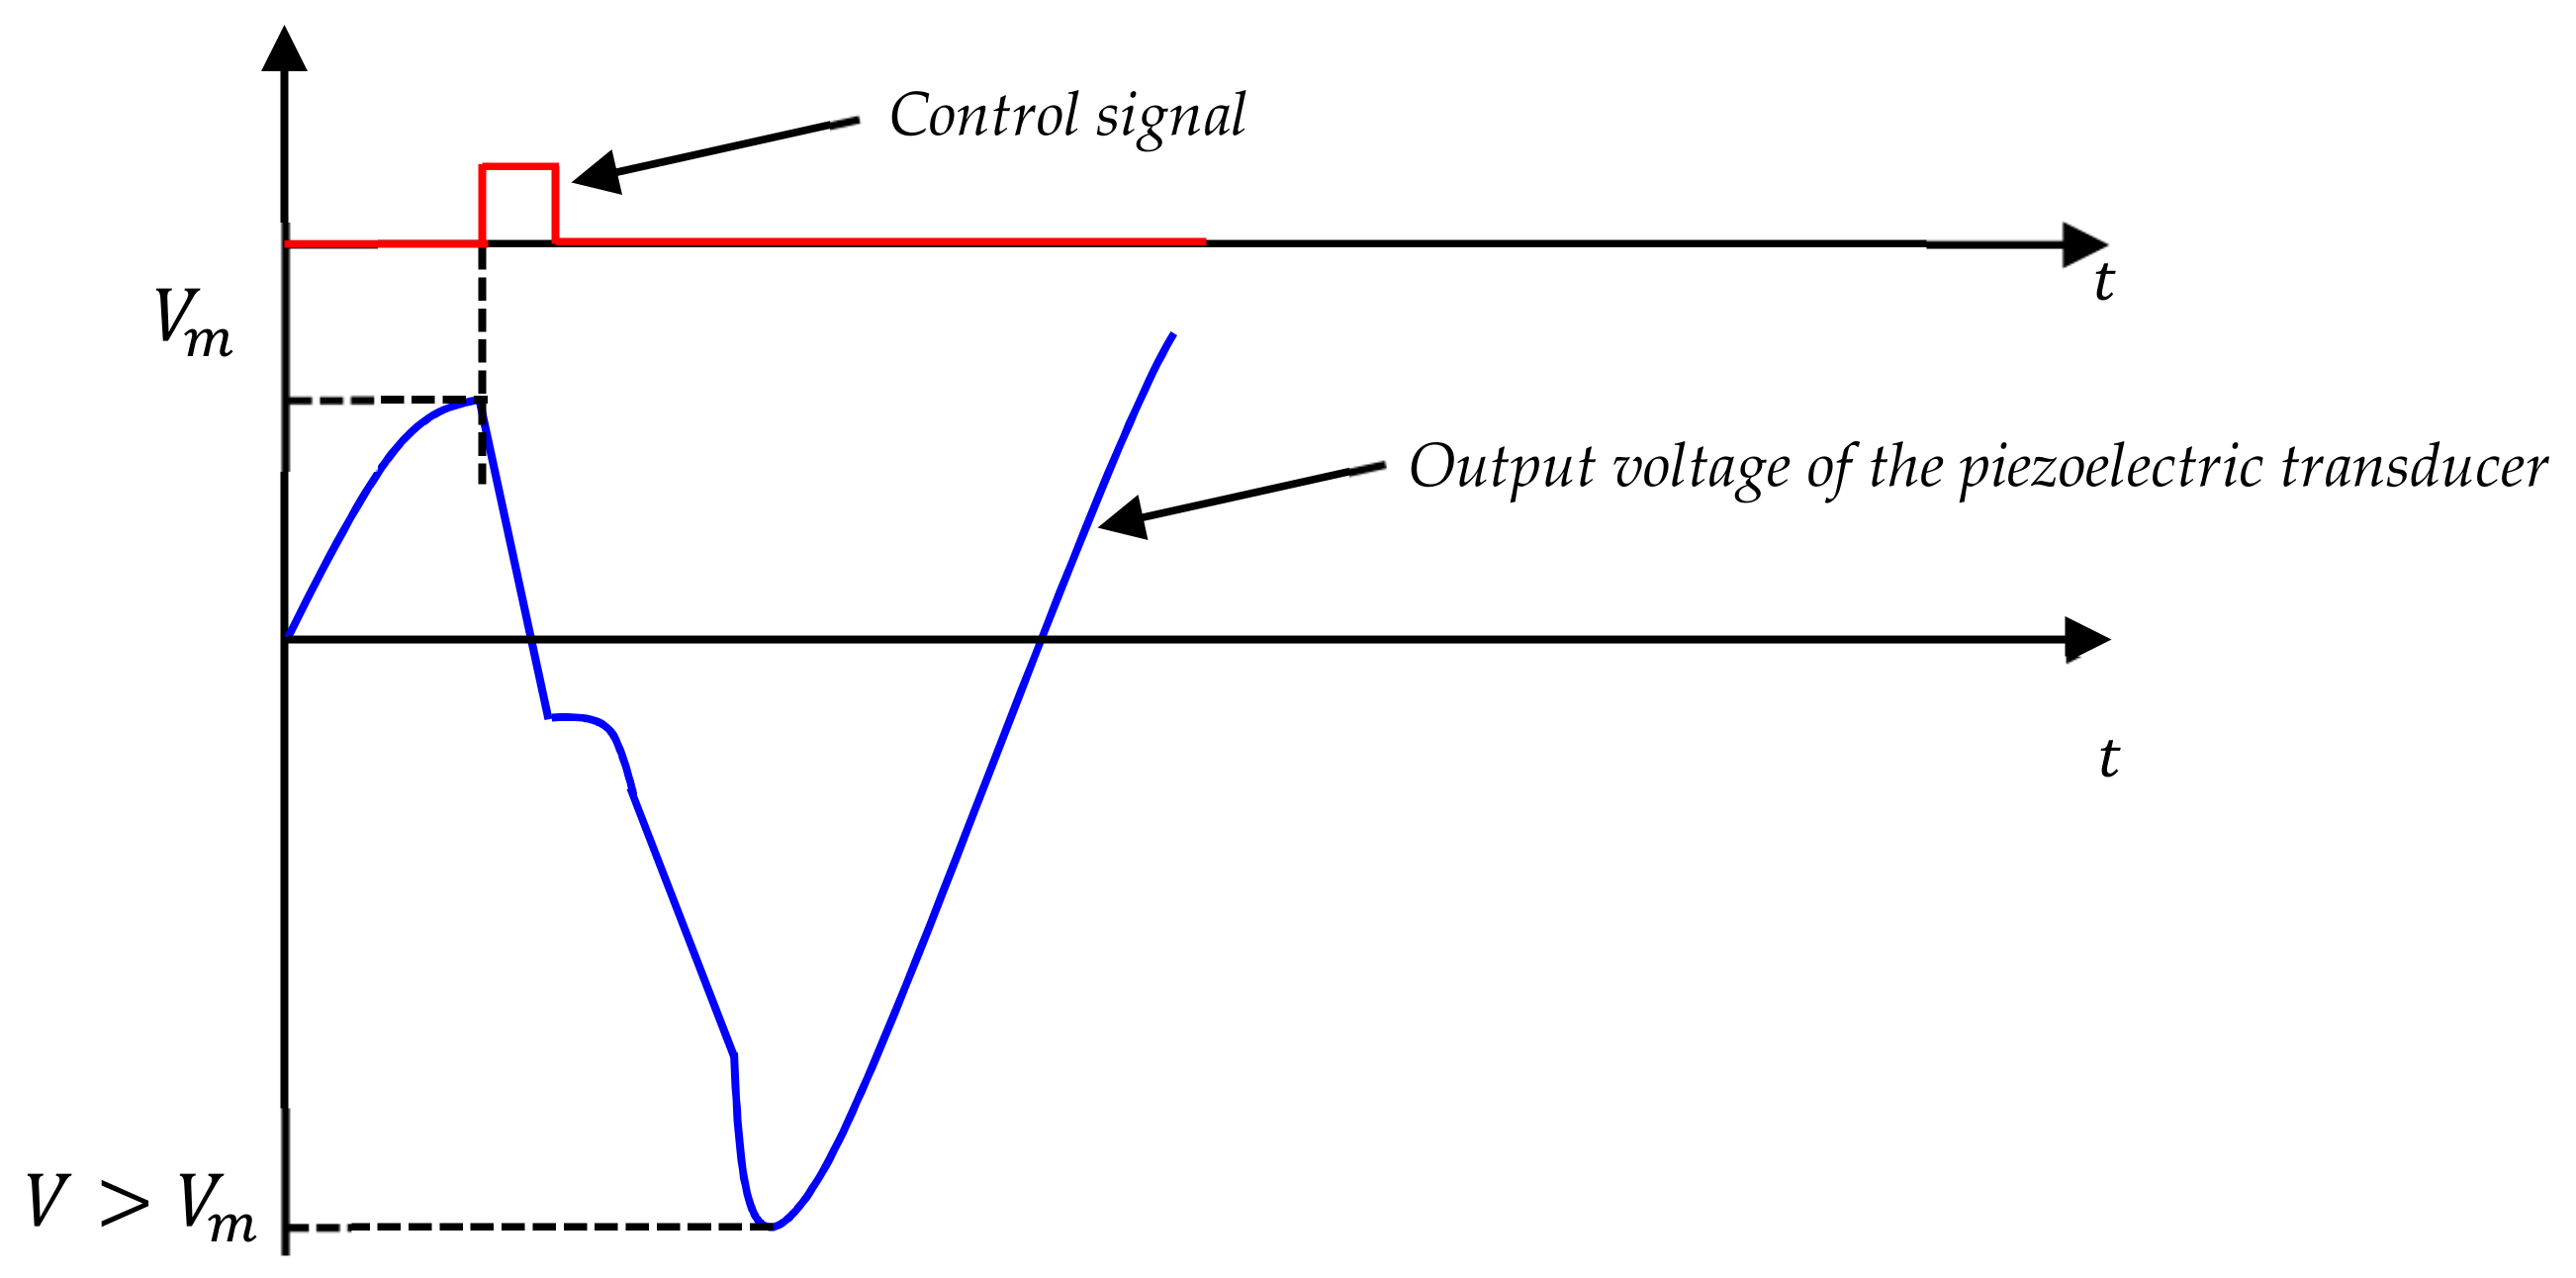
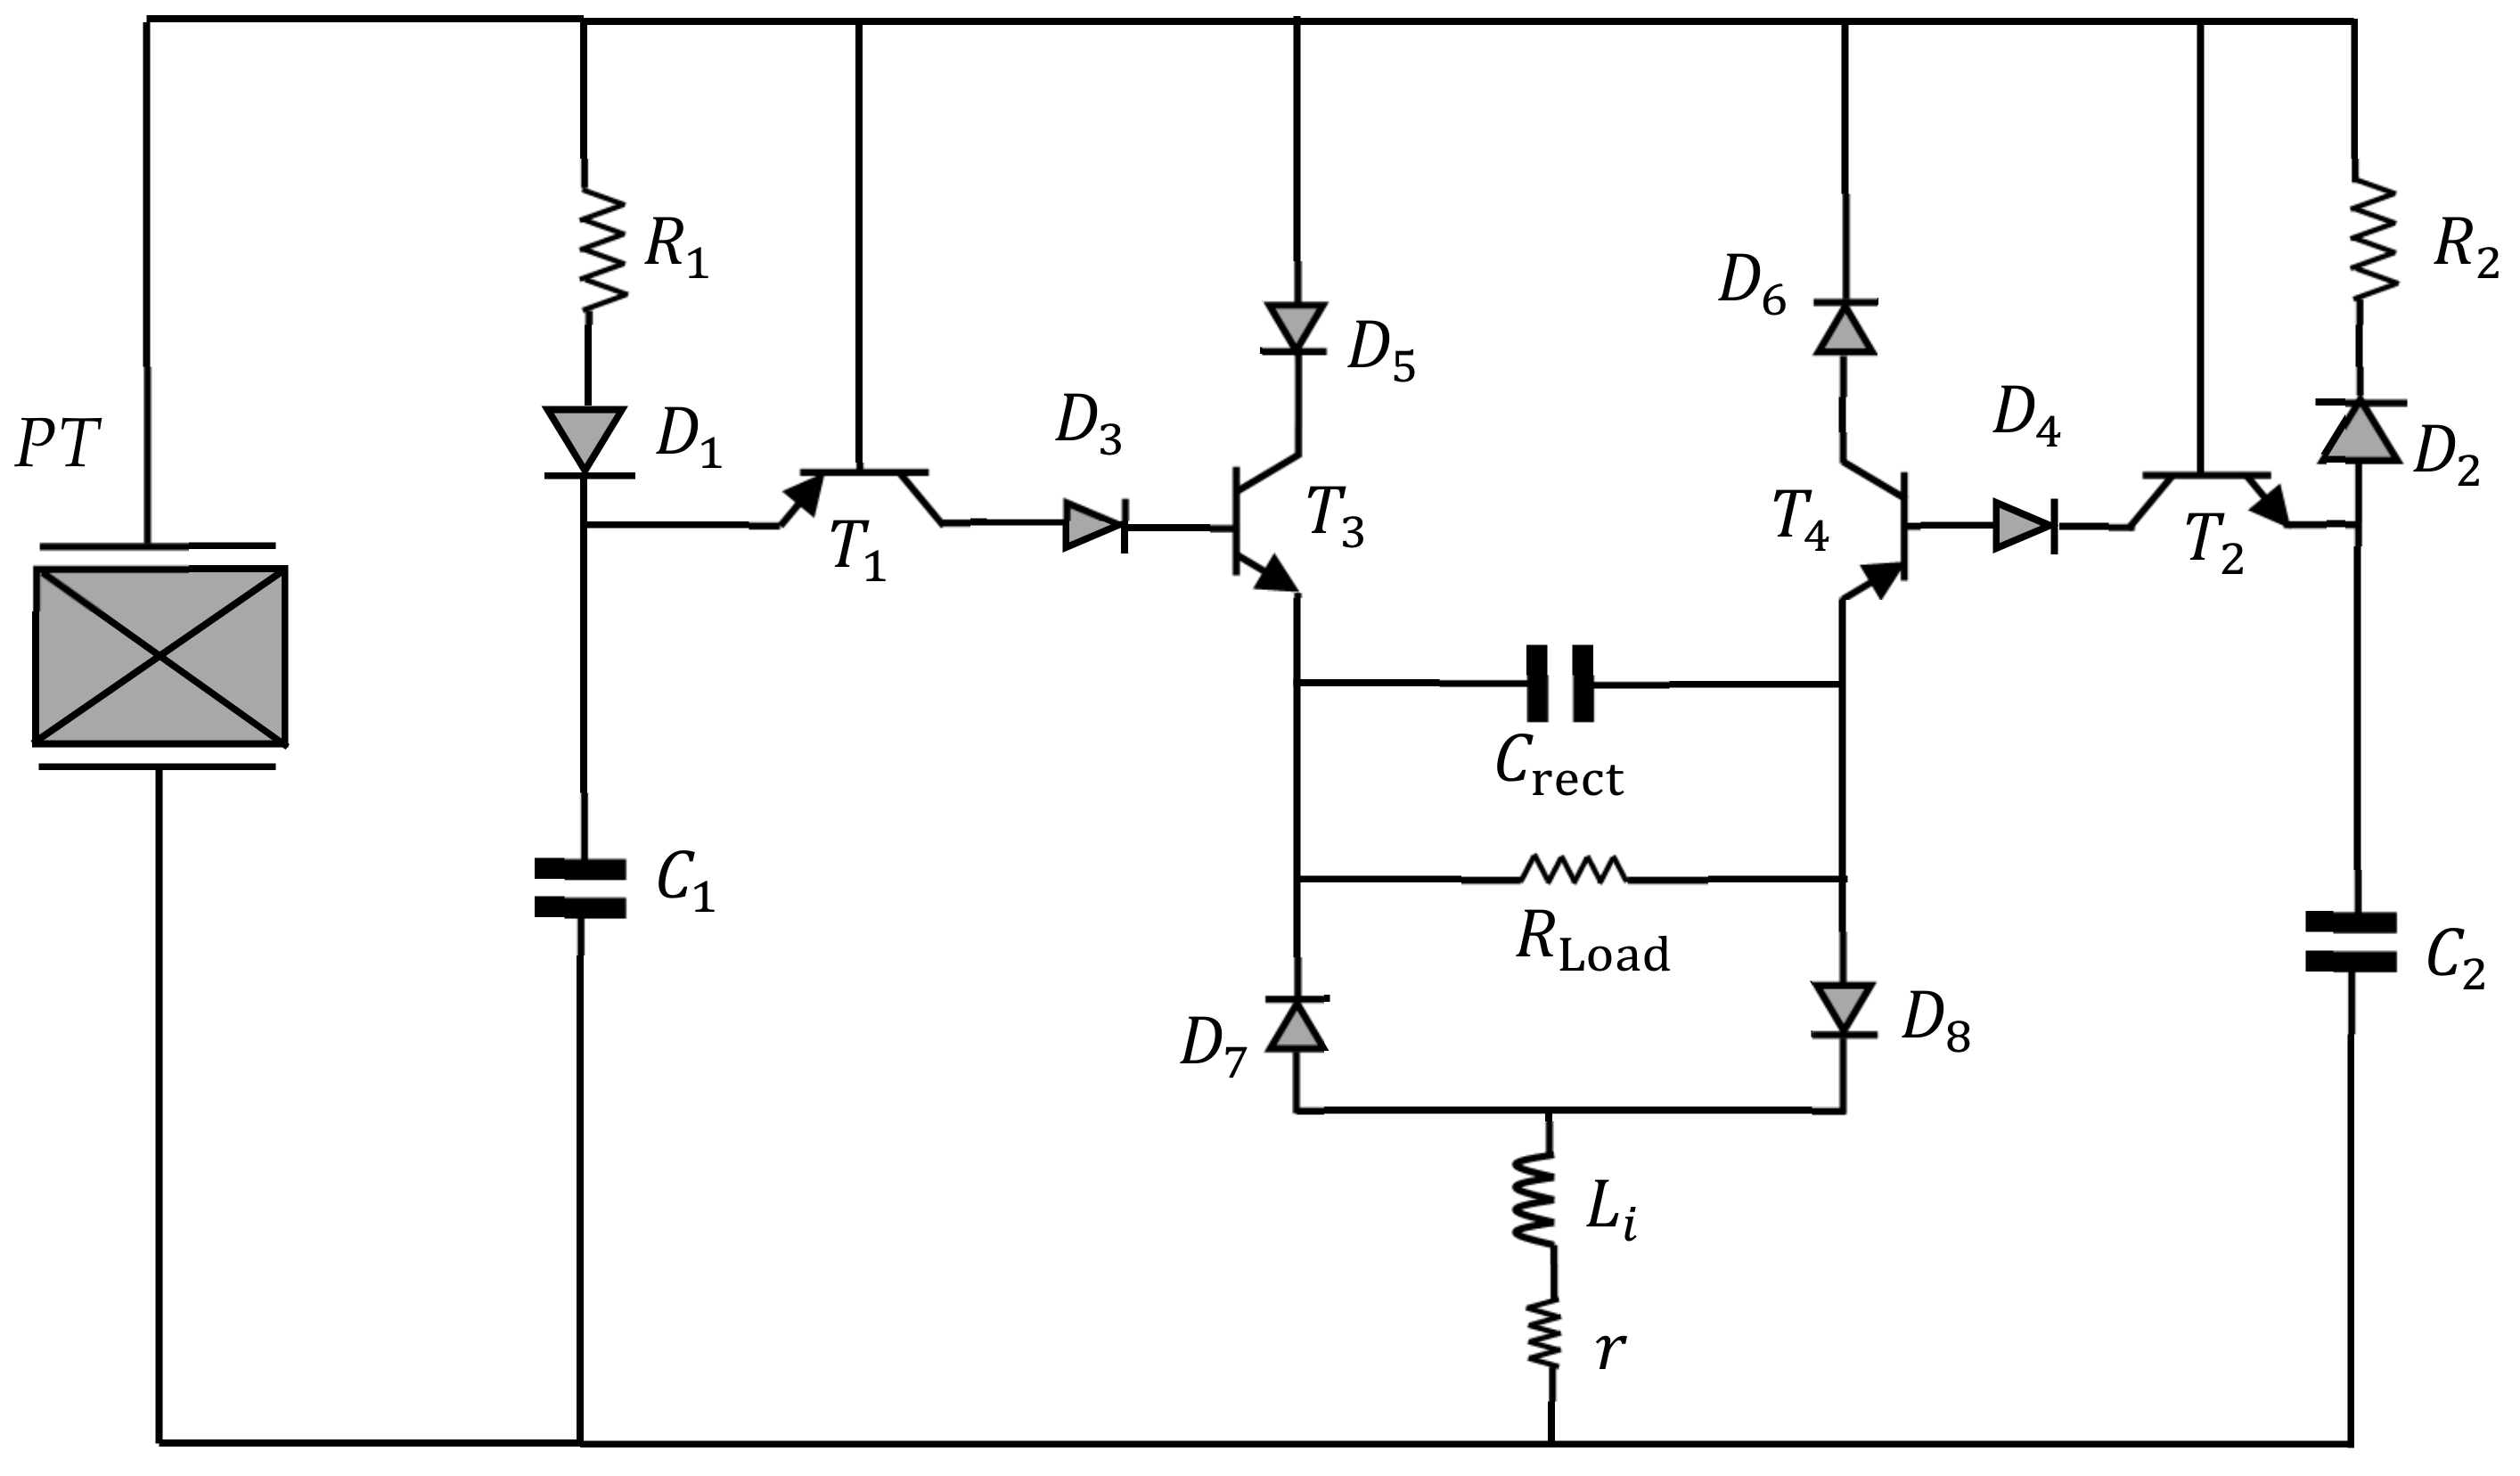
3.3.1. Non-Linear Circuit Principle

The electrical model of the PT shows that its internal impedance is capacitive (cf Figure 8a). To harvest the maximum energy, it must be connected, a load whose impedance is the dual of the internal impedance of the generator, i.e., an inductance L defined as:
L = 1 ω 2 C P
The frequencies are not very high in most of the usual applications, and the values of C P being very low, the above relationship gives rise to large inductance values. To overcome this limit, designers choose a suitable value of L then, this value is switched for a period equal to half the oscillation period of the circuit composed of L and C P [75], i.e., the duration of:
T = π L C P
The inductance L can be put in parallel with the PT to give rise to the configuration called P-SSHI [76,77]. The serial inductance can also be connected to the PT; this is known as the S-SSHI [51,78]. The principle diagrams of these two configurations are shown in Figure 9.
At the moment of switching on these circuits, the capacitor C P is charged to the maximum voltage value. Closing the switch causes a complete discharge of the capacity and an increase of the current in the inductance up to the maximum value. This current will then decrease by charging the capacitor with a reverse voltage at its initial voltage giving an output voltage higher than the initial maximum voltage. It is this analysis that gives rise to the waveforms shown in Figure 10. The reversal of the voltage through the inductance is not perfect since some of the electrical energy before inversion is lost in the switching device. The electrical quality factor models these losses.

3.3.2. Control Circuit for the Synchronized Switch Harvesting on Inductor (SSHI) Technique

The control circuit oversees generating the signal applied to the switch. The control signal is a pulse generated at times of the maximum and minimum of the open-circuit voltage value. The control circuit must, therefore, include a peak detector, a comparator, and a switch. In the literature, two methods are proposed to carry out the control circuit.
  • The first solution is to use two generators; the output of the second generator is used to generate the control signal [79,80].
  • In the most common solution, the control signal is produced from the signal provided by the PT [81,82,83,84].
The first method requires the manufacture of two generators in phase with the same frequency of oscillation, which makes it difficult to implement. Several switches have been proposed in the literature [78,85], and the most popular circuit for generating the control signal presented in this work is the one shown in Figure 11. The circuit comprises the PT and the SSHI circuit; it was proposed in [78] and has been reused in several other works as [86,87,88]. The circuit in Figure 11 includes two switches for the detection of positive and negative maxima of the output voltage of the PT. A detailed analysis of the operation of the circuit is proposed in [78].

3.4. Alternating Current/Direct Current (AC/DC) Converter, DC/DC Converter and Wireless Sensor (WS) Performance

In a lot of work on PMGs, designers are limited to the performance of PT [89,90,91], the objective of these works consists of determining the optimum load of the designed PT. However, as we mentioned above the major application of any process of EH is the power of the WS [92]. The WS requires a DC power supply voltage; the electronic load of a PT must be a constant voltage. The different circuits designed for this purpose are offered in works such as [29,31,93,94] and will be presented in this subsection. These circuits can be classified into three major groups [95]: the standard rectifier capacitor circuit (SRCC), the active rectifier capacitor (ARC), and the SSHI circuit. For each of these circuits, it will be discussed, after proposing the configuration to define the expression of the maximum harvestable power.

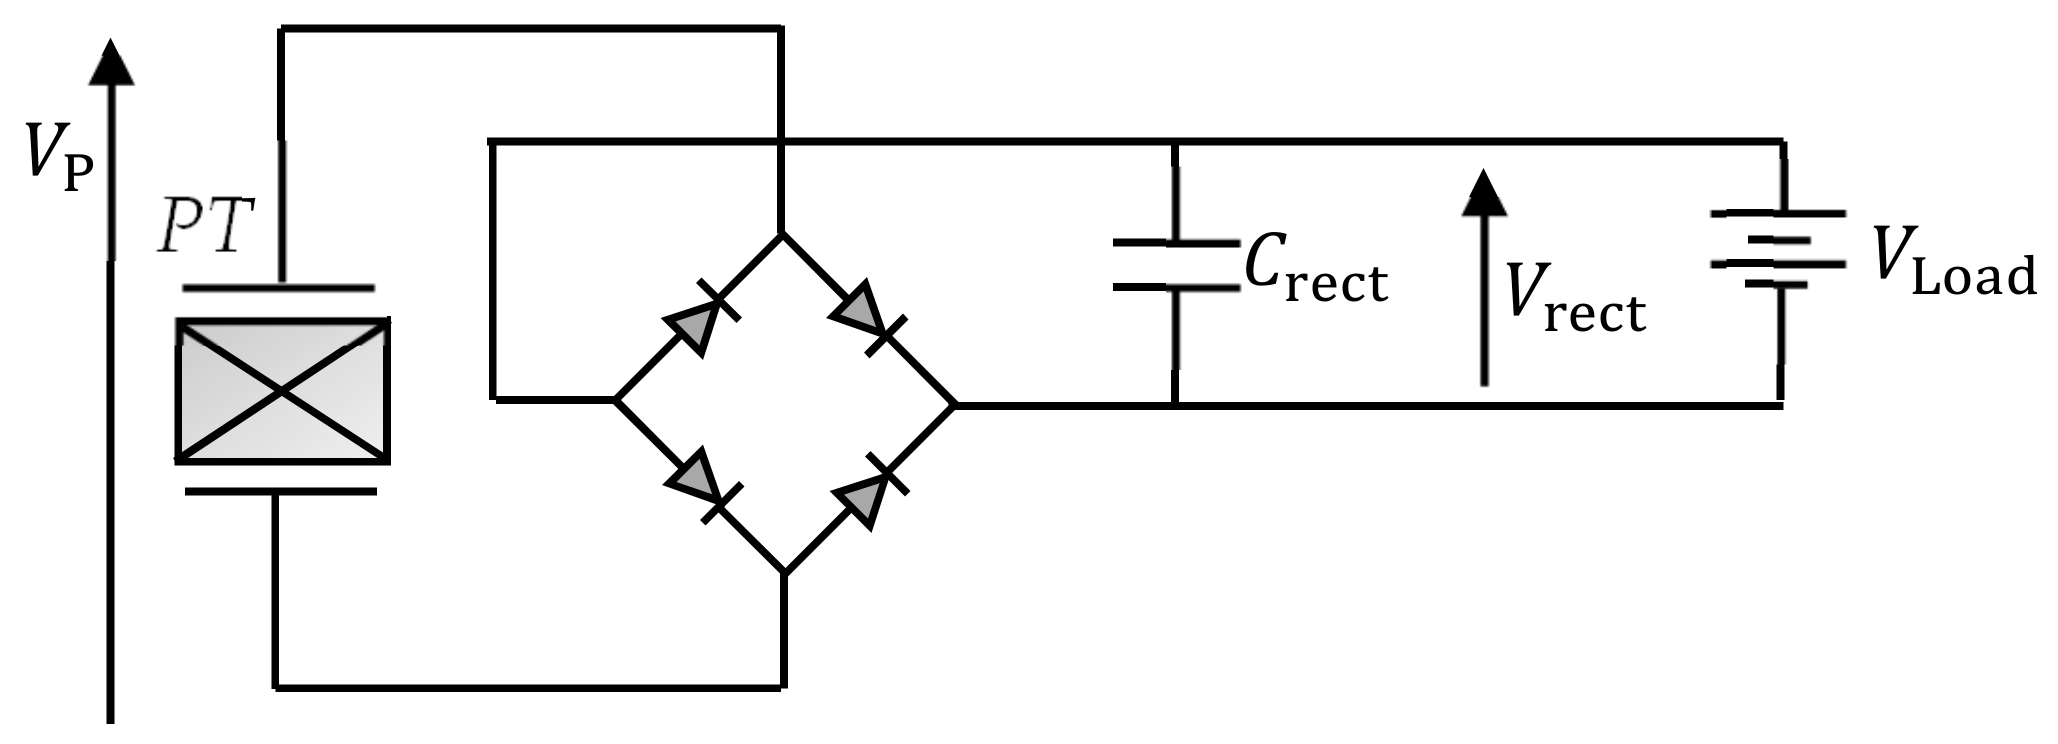
3.4.1. Standard Rectifier-Capacitor Circuit (SRCC)

In the standard conversion circuit, the PT is connected to a standard rectifier-capacitor as shown in Figure 12. A full bridge rectifier with a capacitor is used to straighten the AC signal. The value capacitor C rect is used to filter any non-DC component. For this circuit to be operational, the open-circuit voltage of the PT must be higher than at least twice the threshold voltage of the used rectifying diode. The proposed solutions to overcome this limitation is then the manufacture of low-voltage threshold diodes [96,97,98].
Another condition for the circuit in Figure 12 to function correctly is to choose C rect such as C rect C P [99] where C P is the capacity of the PT. It is shown in [31] that the power P SRCC delivered to the load is expressed as:
P SRCC = 2 V rect π I P 2 π f R V rect C P
The maximum value of this power is reached when the voltage V rect is equal to half of the Open circuit voltage V O C of the PT. This maximum power is expressed according to the parameters of the equivalent electrical circuit as follows:
P SRCC max = I P 2 4 π 2 f R C P

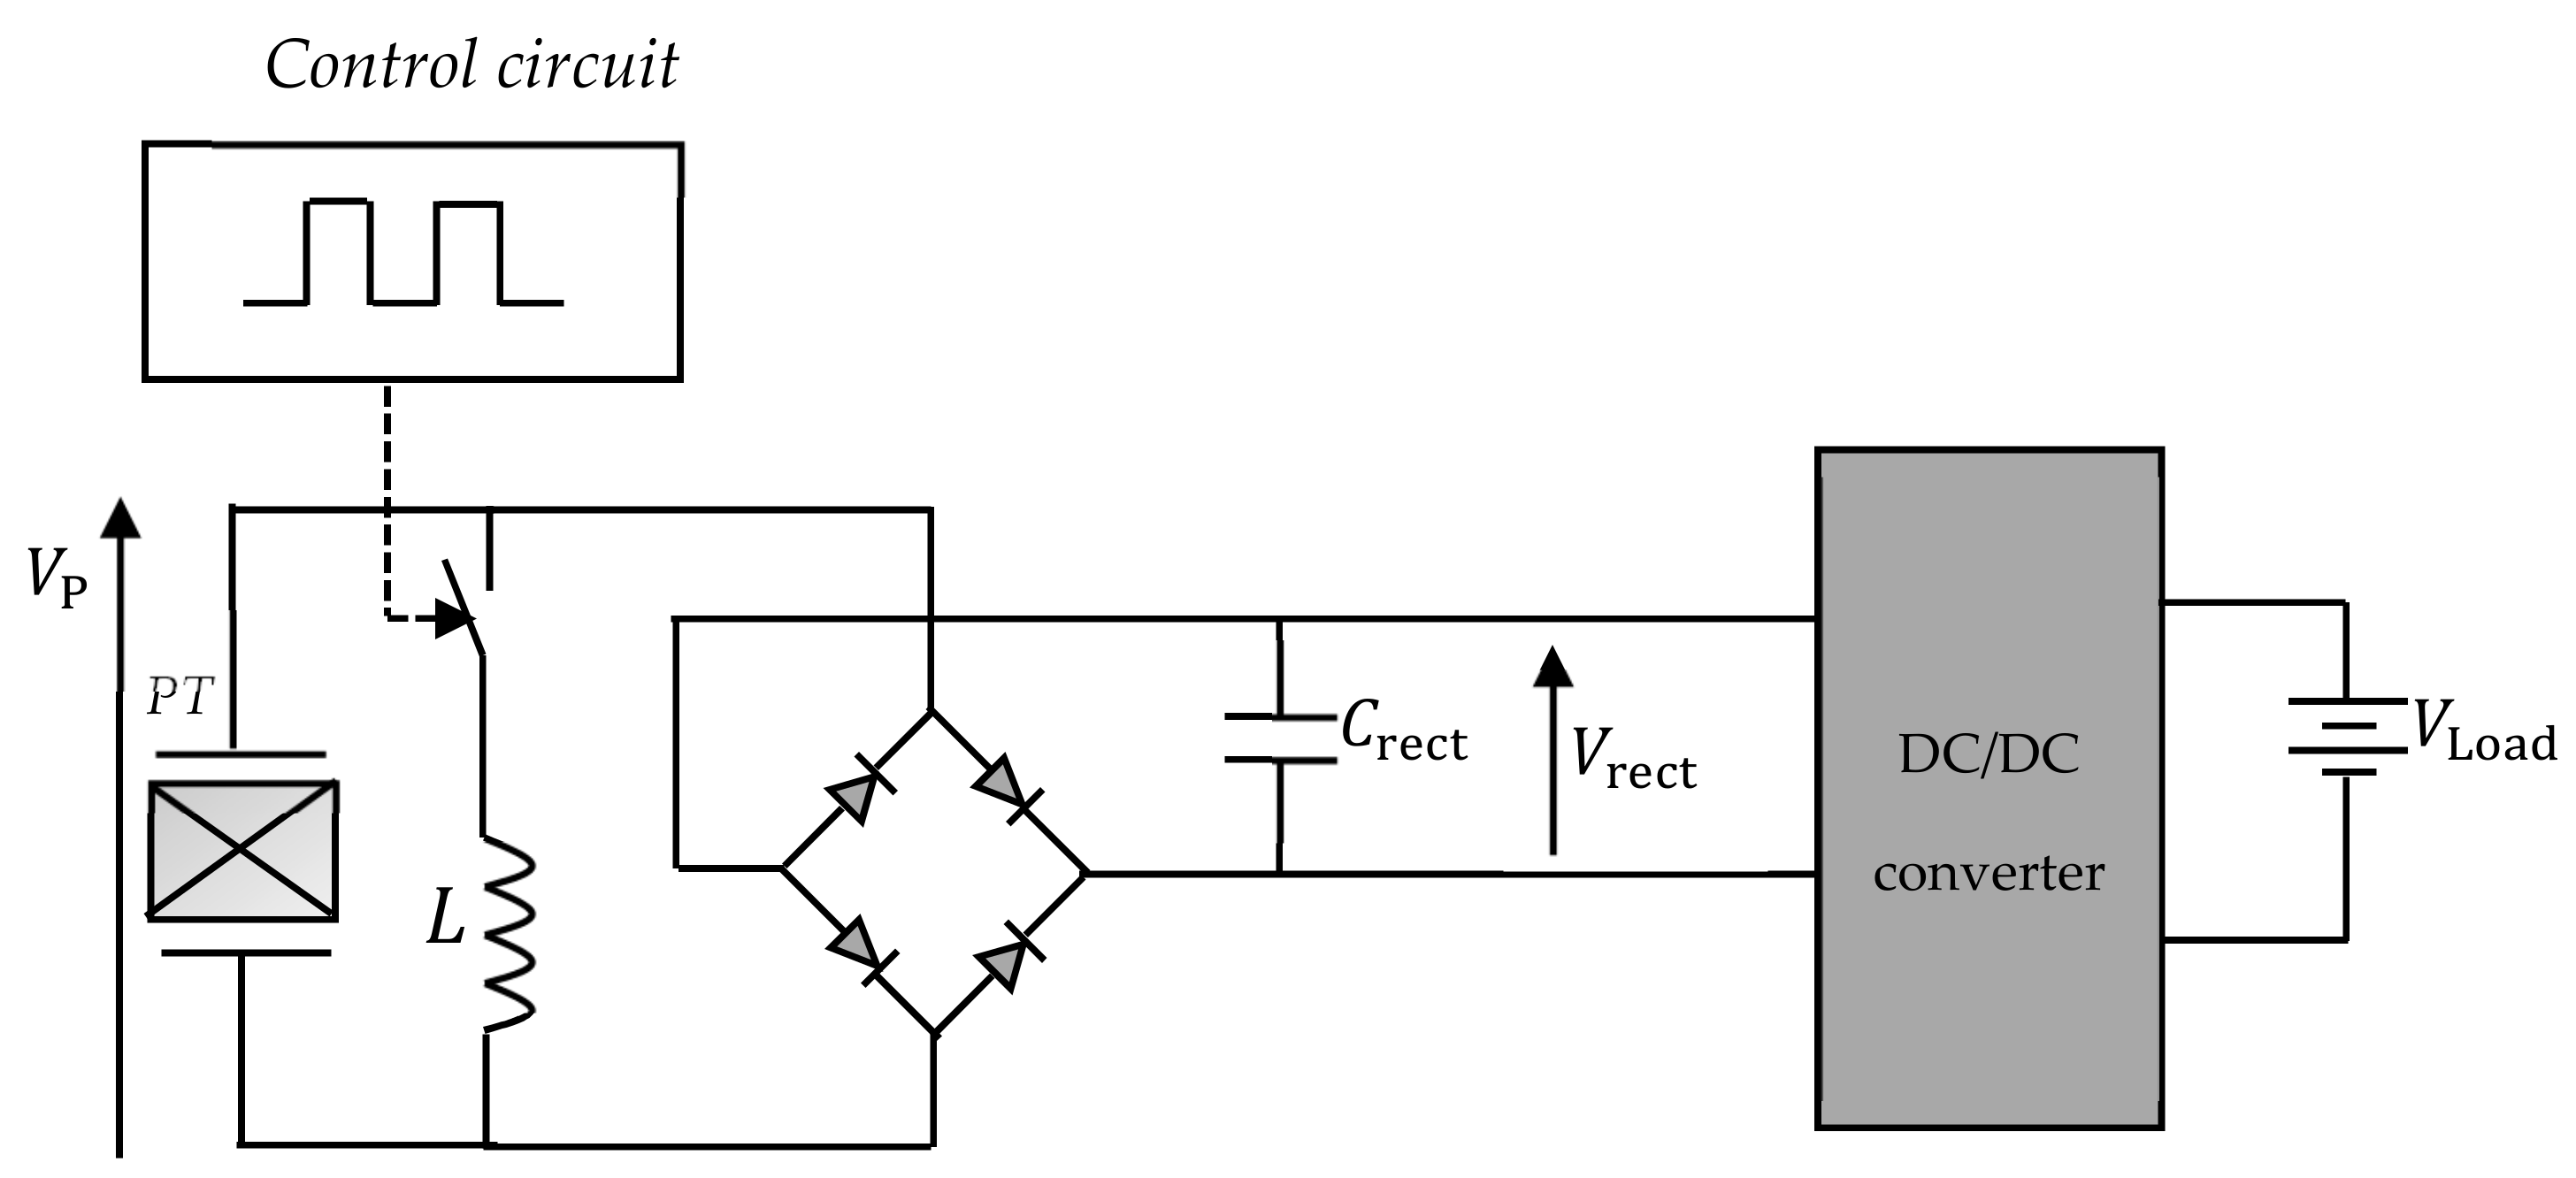
3.4.2. Active Rectifier Capacitor (ARC)

To achieve a perfect impedance matching to the load, the active rectifier-capacitor topology shown in Figure 13 was proposed in [29,31]. The DC/DC converter allows the AC/DC converter output to be adjusted to the load by performing an MPPT function [100,101]. An increase in the harvested power of 400   % compared to the standard circuit in Figure 12 has been reached in [29].
There are several DC/DC converter; these have been presented in [102]. The two main structures are the DC/DC buck converter and the DC/DC boost converter. The choice of the DC/DC converter depends on the voltage values V rect and the supply voltage of the used battery. The value of the rectified voltage, V rect for optimal performance is defined in [29] as:
V rect = I P 4 π f R C P
Recall that I P and C P depend on the size and properties of the used piezoelectric material.
Once the choice of the DC/DC converter is made, one of the design issues is the determination of the duty cycle allowing the optimum power transfer to the load. In [29], an expression of the optimal duty cycle, k o p t based on the size of the PT, and the battery characteristics of a lower DC/DC converter is defined as follows:
k o p t = 8 f R V rect L C P f S V rect V bat
where f R is the resonance frequency of the PT, V rect is the rectified voltage, L is the value of the used inductance to design the DC/DC converter, f S is the switching frequency of the DC/DC converter, and V bat is the supply voltage of the used battery. For additional information about the DC/DC converter, applied to PT, interested readers are referred to [29,30,31,103].

3.4.3. Piezoelectric Micro Generator (PMG) with SSHI

As in the previous subsections, in this part, the main results are presented about the maximum harvestable power with an SSHI circuit. The circuit of PMG using the SSHI technique and, more specifically, the P-SSHI is shown in Figure 14. It is to date the complete structure of the PMGs proposed in the literature. For the autonomous operation of the PMG, the control circuit must draw its energy from that collected from the surrounding vibrations. However, very little work has proposed an evaluation of the dissipated energy in the EHC. It should be further clarified that most of the equations evaluating the maximum recovered power are derived from the analyses assuming ideal behavior of the rectifying diode. The real diodes are, however, characterized by a threshold voltage V D and dynamic resistance R D , and the dissipated power P D is defined as:
P D = V D I + R D I 2
Taking into consideration the dissipated power in the EHC, Liang and Liao [104], quantified the power lost during the formatting of the harvested energy. The results of their work have made it possible to define the application limits of the SSHI technique. More specifically, for the standard circuit in Figure 12, it has been established in [104], the following expressions for the harvested power P SEHC and the power dissipated P d , SEHC :
P SEHC = 4 f R C P V D C V OC V D C 2 V D P d , SEHC = 8 f R C P V D V OC V D C 2 V D
By performing the same analysis with the circuit of Figure 14, Liang and Liao [104] compared the power harvested with the standard circuit with that provided by the optimized circuit. It emerged from this comparison that the standard circuit was more effective when the open-circuit voltage is less than 5.84   V .
The objective of this section was to defer the results of quantitative studies of PMGs for WS. The various circuits proposed in recent years for the design of the PMGs have been reviewed, and the expressions of maximum recoverable powers have been provided. In the continuation of this work, we apply the various solutions proposed to date to the design of a PMG for the supply of WSs applied to a mining locomotive. The objective is to evaluate the performance of the complete optimal solution of the PMG for WS based on vibration data taken from a mining locomotive.

4. Design of an Optimized PMG for Supplying IWSs: The Case of a Mining Locomotive

In this section, the design of an optimized PMG applied in the mining industry is proposed. The case of locomotives in a mining environment will be dealt with here. The choice of this application is justified by the fact that, in the era of major socio-economic upheavals, the economy of many countries, including Canada, sub-Saharan Africa, China, South, and Central America are still heavily fueled by the mining industry. To remain competitive, the mining industry has to offer certain facilities such as the ability to equip itself with locomotives for the carriage minerals on rails and wagons for the transportation of personnel. The autonomous WSs would then be an excellent compromise for supporting monitoring applications on the old mining locomotive. This will then be a question of quantifying the DC energy supplied to WS based on the characteristics of the detected vibrations in a mining locomotive. Depending on the harvested energy, the WS’s performance will also quantify regarding the minimum data packet length, transmitted to the BS.
As mentioned in the previous section, the first step in the design is the determination of the main characteristics of ambient vibrations.

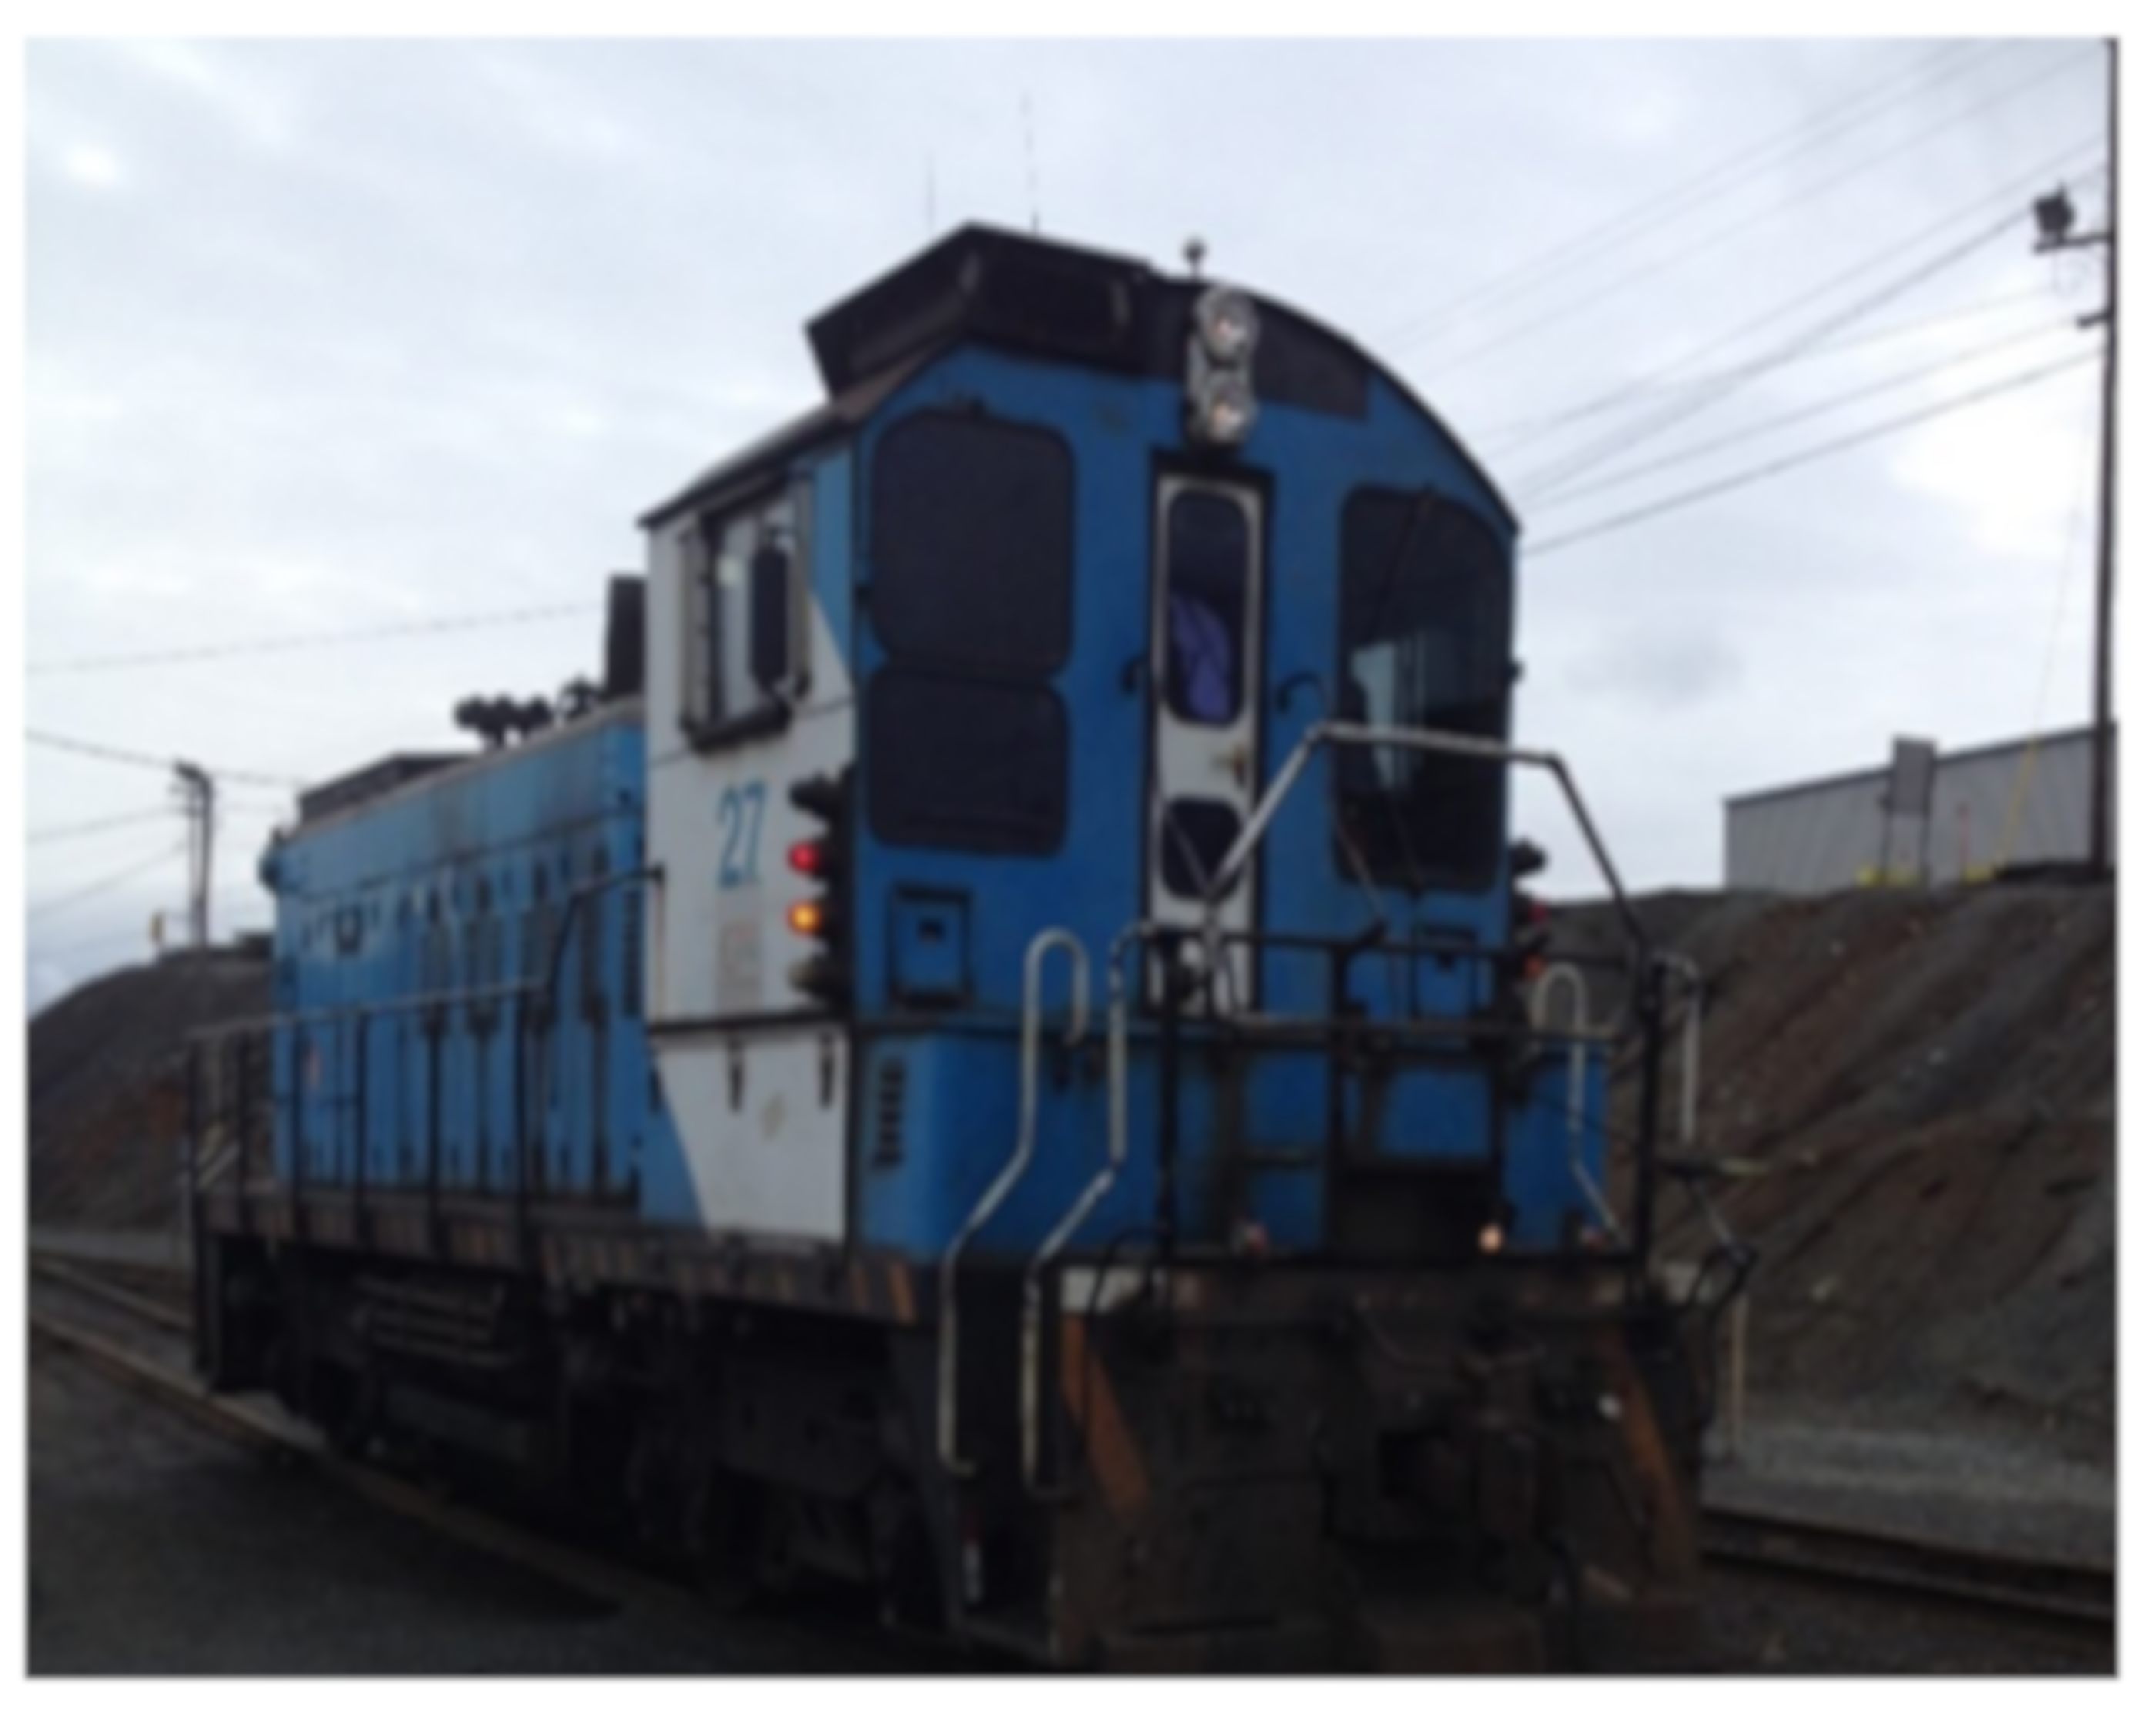
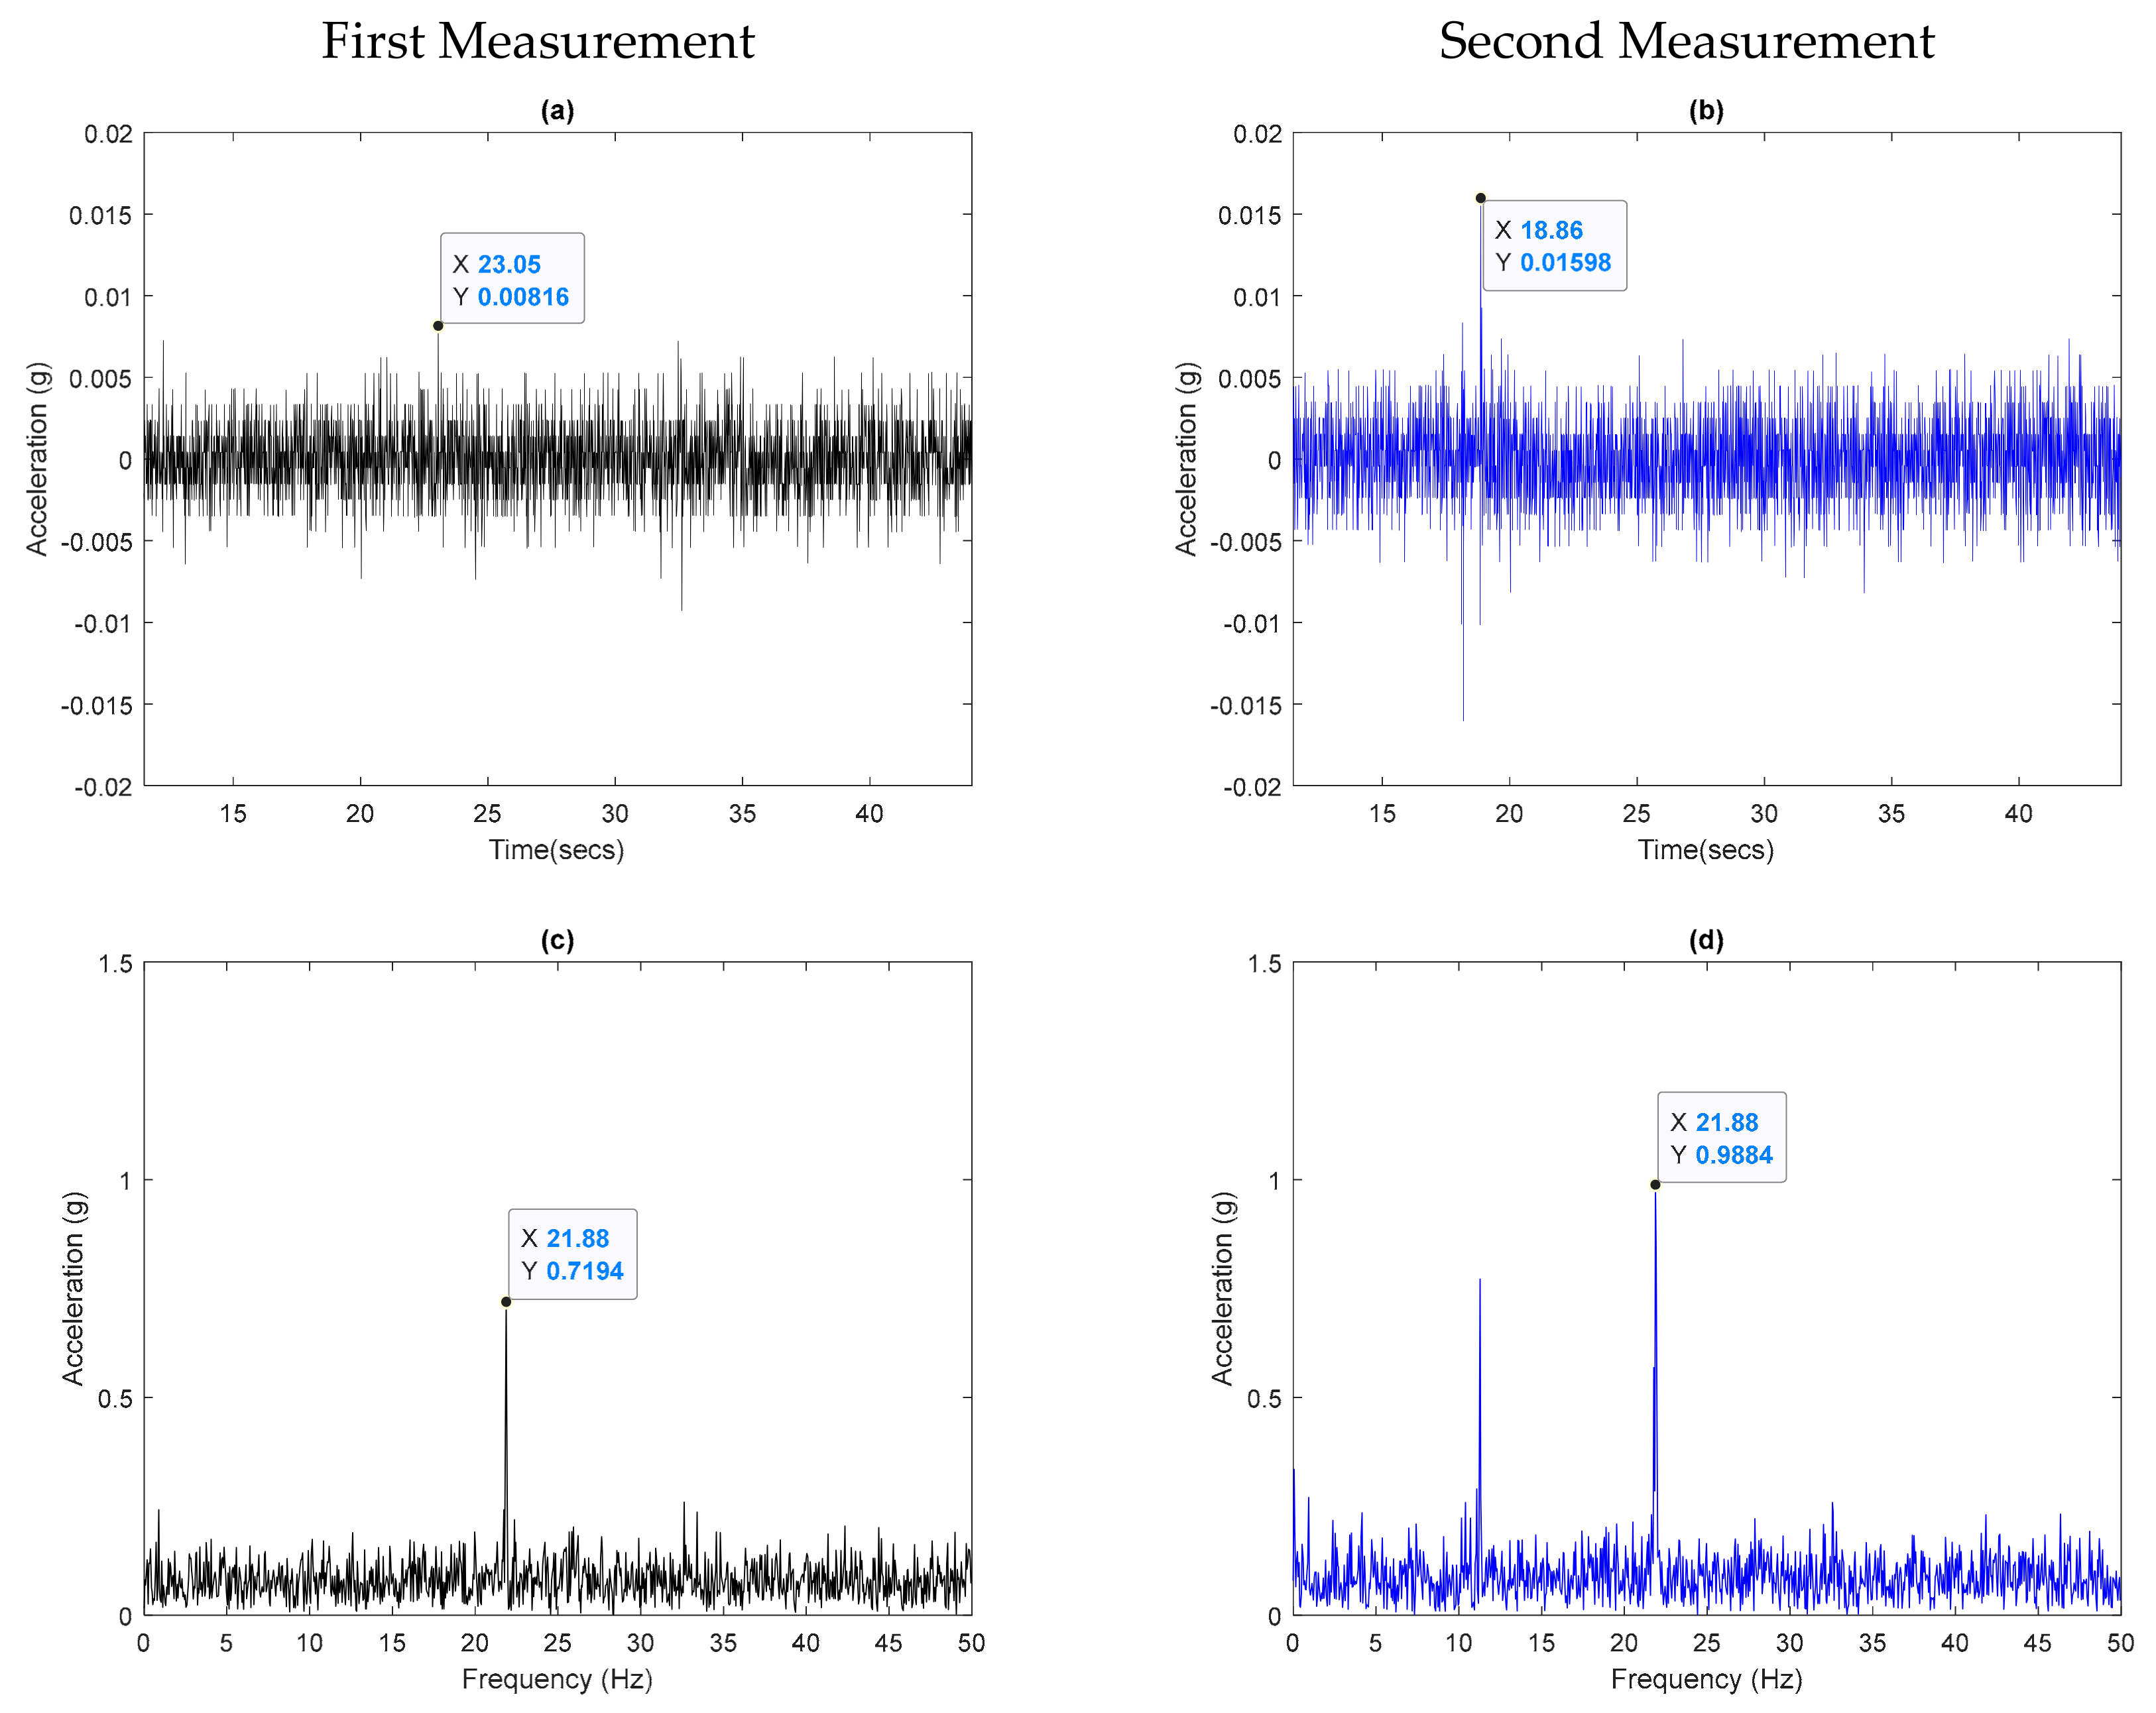
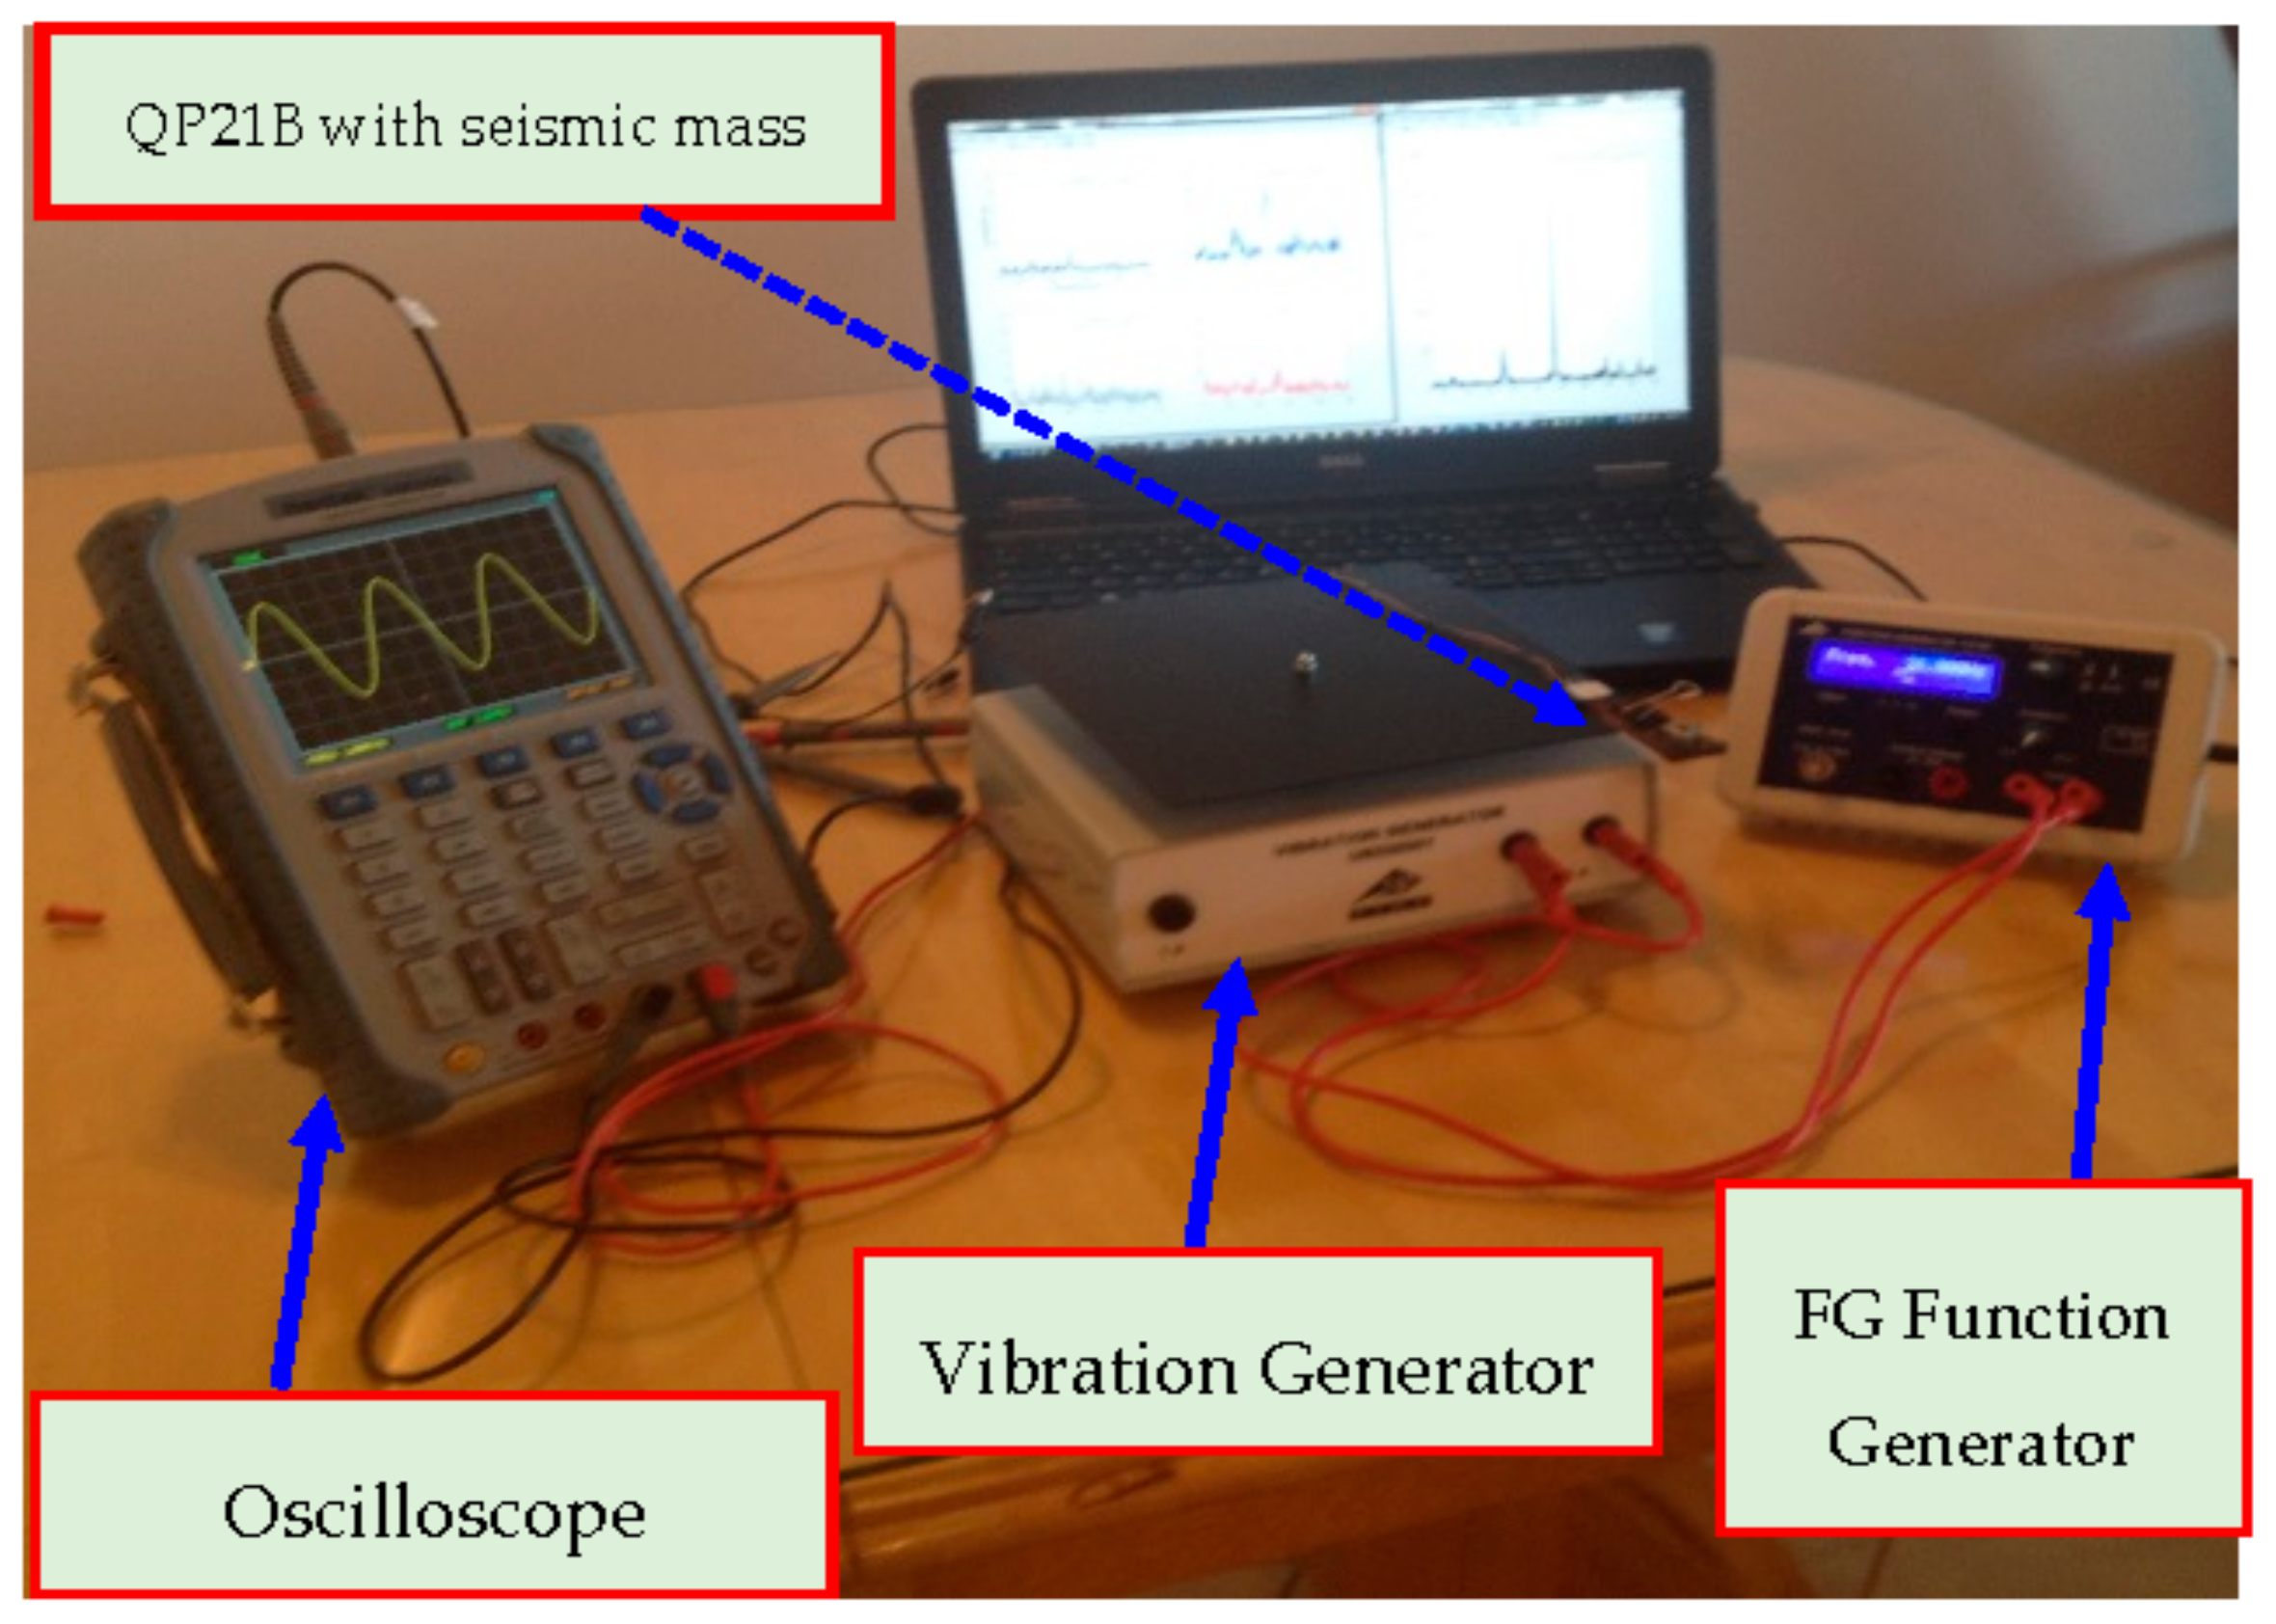
4.1. Test Locomotive and Measured Vibration

To get an idea of the vibration spectrum in a mining locomotive, locomotive number 27 of the Glencore Horne Foundry of Rouyn Noranda is used. A global view of the locomotive is shown in Figure 15 below.
A Vernier GDX-ACC triaxial accelerometer is used for data acquisition, as shown in Figure 16.
The GDX-ACC accelerometer can be used to measure accelerations between ± 200   g and offers the ability to connect via Bluetooth [105]. The sampling frequency is 1000   Hz , and the measured data is recorded with the graphical analysis software [106] of Vernier; these data are then transferred to MATLAB for in-depth processing. The accelerometer is located on the board of the locomotive, and the vibration data obtained are shown in Figure 16. Two series of measures are represented for comparison; frequency analysis is achieved through the MATLAB’s Fast Fourier Transform.
From the acceleration time response (Figure 17a,b), we find that the maximum acceleration is 0.008   g for the first measurement, while an acceleration peak of 0.015   g is reached in the case of the second measure. This difference is explained by the influence of the locomotive operating speed which was not kept constant in both tests.
In the frequency domain (Figure 17c,d), the fundamental frequency in both measurements is the same, and it is 21.88   Hz . The spectrograms that represent the frequency distribution of power are shown in Figure 17e,f. A maximum power density of 22.35   dB / Hz is obtained in the case of the first measurement while a power density of 19.11 dB / Hz is reached in the case of the second measure. According to these observations, the PT must, therefore, be sized in a way that resonates around 21.88   Hz .

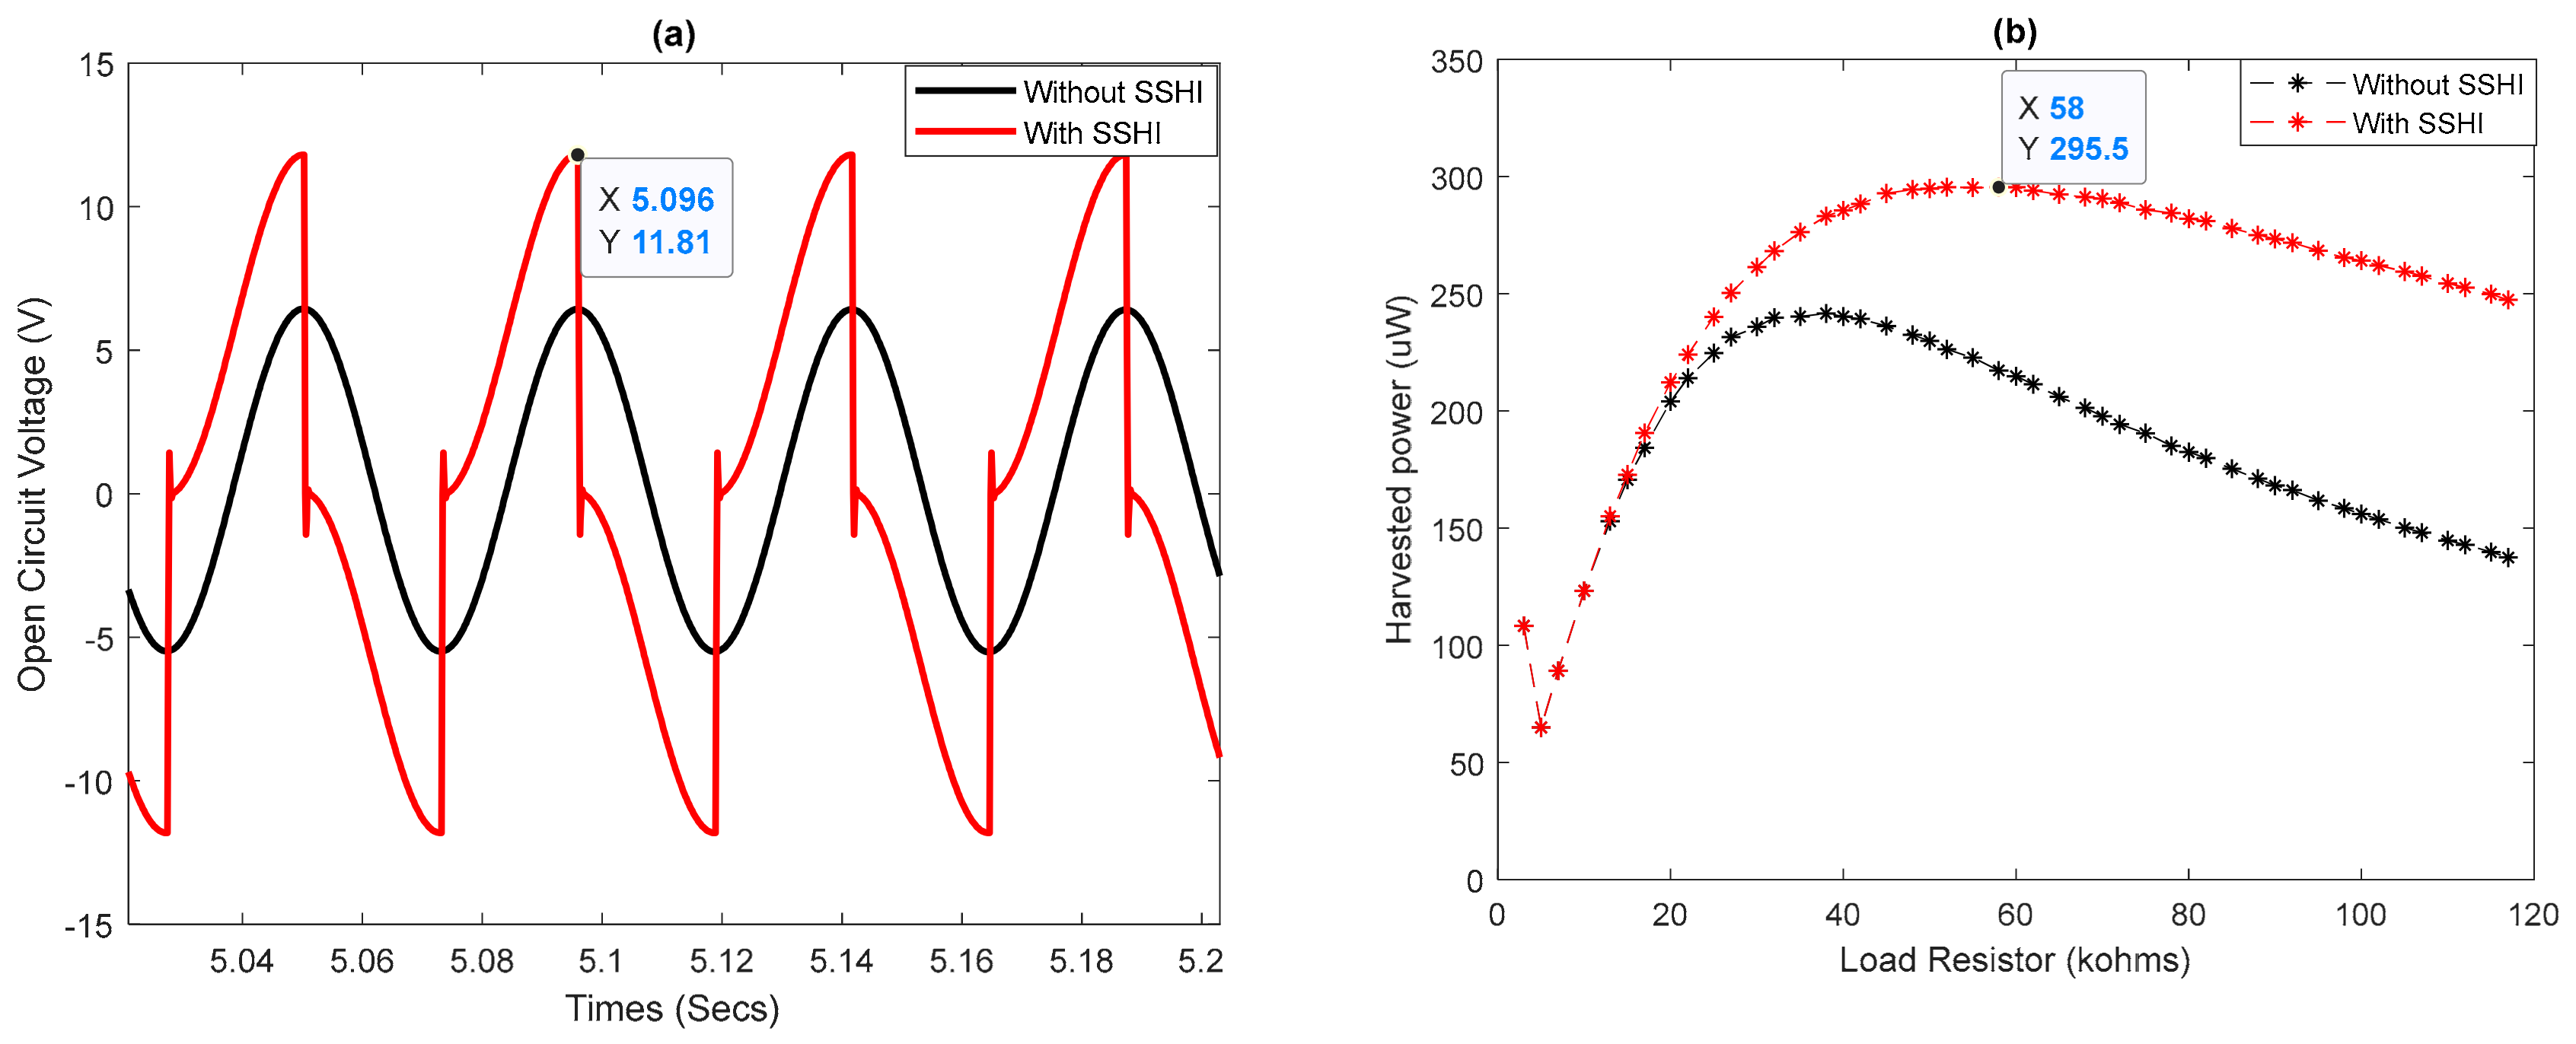
4.2. Modeling of the PT and Open Circuit Performance

To obtain the PT’s electrical parameters based on the measured vibrations, the experimental setup shown in Figure 18 proposed in [73] is used. This work [73] resulted in participation in the 19th EEEIC International Conference on Environment and Electrical Engineering. The setup includes the QP21B Mide Technology’s composite as a piezoelectric transducer. The transducer is attached to a U58556001 vibration generator marketed by 3B Scientific. The vibration generator is powered by an FG 100 function generator still sold by 3B Scientific. A Hantek oscilloscope records signals from the transducer.
To harvest the maximum energy, it is essential to adjust the resonance frequency of the QP21B composite to the fundamental frequency of ambient vibrations. For this, an additional mass m t is necessary. The value of this seismic mass is defined in [107] as follows:
m t = k 2 π f 0 2 m
Using the measurement spectrum data in the mining locomotive, i.e., f 0 = 21.88   Hz , A = 0.72   g , (see Figure 17c) as input parameters. A least-square fitting of data to (18) yields the following values of I P and C P .
I P = 0.164   mA   ; C P = 200   μ F
With these values, the performance of the open-circuit PT is shown in Figure 19; the schematic in Figure 8a was used to obtain these results. It is found in Figure 19a a sinusoidal voltage of amplitude 5.98 V. Figure 19b shows that a maximum power of 240.3   μ W is attainable, for optimal load resistance of 35   k Ω . The used software is the Simscape Tool of MATLAB/SIMULINK.
To optimize PT performance, the schematic in Figure 9a is used. The results obtained in comparison with those obtained without the SSHI technique are shown in Figure 20. It shows that the output voltage is twice as high as the initial voltage, and a maximum power of 295.5   μ W is reached on an optimal load resistance of 58   k Ω ; this corresponds to an improvement in 123   % compared to the initial power. It should be recalled that experimental results, with the circuit in Figure 11, yielded an improvement in harvested power of 160 % [104]. In the following subsection, an evaluation of the performance of a WS concerning the transmission distance for the various configurations of PMG is performed.

4.3. PMG and WS Performances

To ensure the operation of the WS based on the harvested energy, it is necessary to achieve performance enslavement of the WS to the amount of energy available. To accomplish this, some research uses the duty cycle strategy, which is to leave the WS in standby mode until the harvested energy is sufficient [69,108]. In other recent work, the used enslavement parameter is the transmission distance, which is the distance d between the WS and the BS [34,64].
Using the distance as the enslavement parameter combined with the duty cycle strategy, the WS performance is shown in Figure 21 below. For each of the curves, the energy requirement of a WS in a star topology WSN is compared to the amount of energy provided by the different configurations of PMG presented in this paper. The energy requirement of WS is evaluated with Equation (13), with estimation parameters that are provided in Table 2, with a packet size set at 512   bits . WS performance is defined in terms of sleeping time and the transmission range. It is assumed that the harvesting process is also performed during the active mode of the WS.
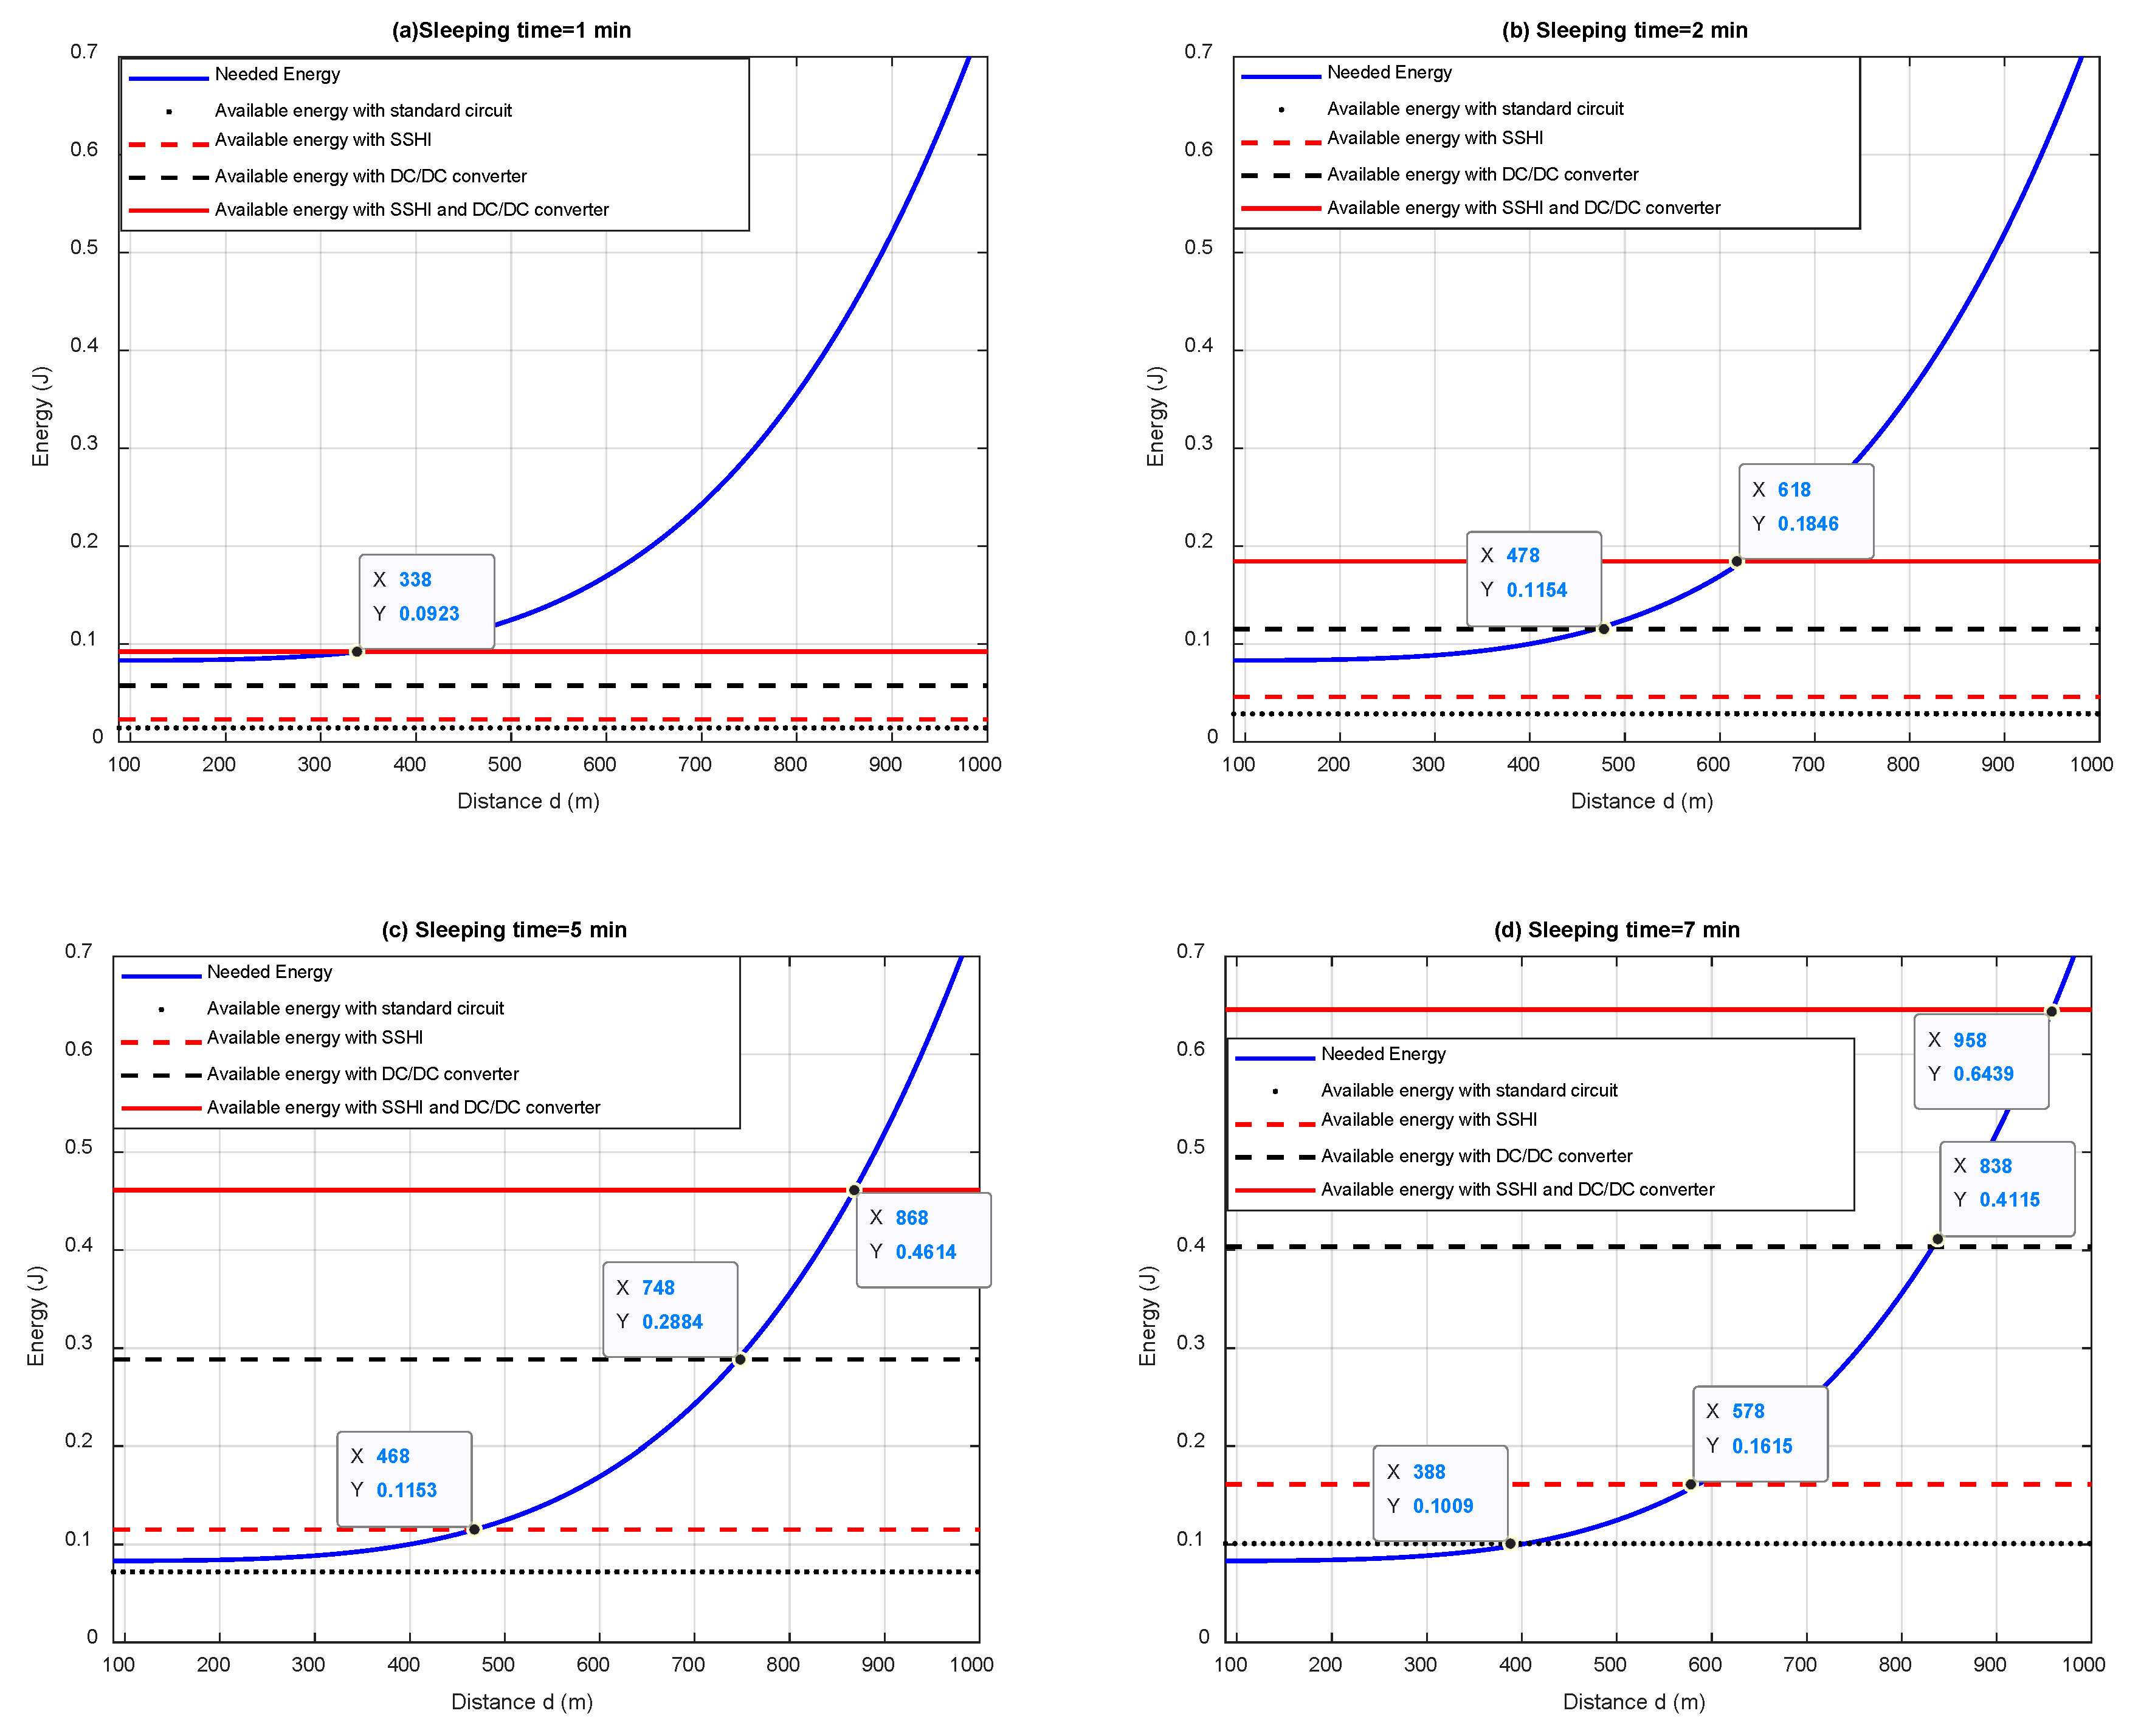
  • Figure 21a deals with applications for which measurements are to be taken every minute. The curve shows that it is only by considering all the proposed optimizations that it is possible to transmit data at only 338   m .
  • Figure 21b represents the case where a physical quantity must be checked every two minutes. When designing the PMG with a DC/DC converter, it is possible to transmit data at 478   m . If all optimization solutions are considered, then the data can be transmitted up to 618 m. The standard circuit, as well as the only SSHI optimization, does not offer enough energy for the WS to transmit.
  • Figure 21c examines the case of applications where measurements are to be made every 5 min. The performance of the standard circuit does not always allow the WS to transmit while using the SSHI technique; it is possible to communicate to around 468   m .
  • Figure 21d considers the case where measurements can be taken every 7 min. Even with this low duty cycle, the WS powered by the standard circuit can only transmit at 388   m ; while considering the optimal solution, it is possible to send data to about 1   km .

5. Conclusions

We have provided in this paper, a step-by-step design of a self-powered wireless sensor node. The feeding of the node is based on the vibrational energy through piezoelectric harvesters. The characteristics of the vibrations detected in a mining locomotive were considered for the design of the PMG. Firstly, in the introduction, we have justified, through several recent works, the fact that the energy harvest of vibrations is the most suitable for industrial applications. The ubiquitousness of this source is no longer to be demonstrated, given the number of types of machinery used in several industrial processes. Afterward, in Section 2, the main contributions of this work and the comparison with the existing works were clarified. To obtain optimal design, the conversion chain, including energy use, was reviewed in Section 3. The results highlight the design issues of autonomous WSs based on a PMG; the main features are the characteristics of the input vibrations, the power requirements of the WS, and the constraints related to the size of the circuits. A detailed study of each design step has been proposed through design equations that are known to be the basis of any new optimization solution. There was then discussed in Section 4 of the design of the PMG, optimized for applications in a mining locomotive. To illustrate the contribution of the various optimization solutions proposed in the literature, an end-to-end evaluation has also been proposed by quantifying the gain regarding data transmission range by WS when optimization solutions were considered. The results have shown a WS operability that can meet Industry 4.0 requirements. More specifically, we have demonstrated that optimal design can transmit data at 388 m to 1 km for a measurement frequency ranging from 1 to 7 min. As future work, it would be interesting to analyze the reliability of autonomous nodes based on PMGs.

Author Contributions

A.M. got the idea for the paper and wrote the manuscript. The two professors N.H., and N.K., have all supervised the entire writing of this work done by A.M. while bringing each in their field of predilection. N.H. has contributed to everything that was related to the wireless communication aspect via a wireless sensor. N.K. and A.M. brought to the acquisition of the vibration data and the design equations of the piezoelectric transducer. Finally, N.K. has supervised designs in the electronic field of this work. All authors have read and agreed to the published version of the manuscript.

Funding

This research received no external funding.

Conflicts of Interest

The authors declare no conflict of interest.

References

  1. Leitão, P.; Colombo, A.W.; Karnouskos, S. Industrial automation based on cyber-physical systems technologies: Prototype implementations and challenges. Comput. Ind. 2016, 81, 11–25. [Google Scholar] [CrossRef] [Green Version]
  2. Valente, G.; Muttillo, V.; Muttillo, M.; Barile, G.; Leoni, A.; Tiberti, W.; Pomante, L. SPOF—Slave Powerlink on FPGA for Smart Sensors and Actuators Interfacing for Industry 4.0 Applications. Energies 2019, 12, 1633. [Google Scholar] [CrossRef] [Green Version]
  3. Fortino, G.; Trunfio, P. Internet of Things Based on Smart Objects: Technology, Middleware and Applications; Springer: Berlin, Germany, 2014. [Google Scholar]
  4. Minoli, D.; Sohraby, K.; Occhiogrosso, B. IoT considerations, requirements, and architectures for smart buildings—Energy optimization and next-generation building management systems. IEEE Internet Things J. 2017, 4, 269–283. [Google Scholar] [CrossRef]
  5. Asada, G.; Burstein, A.; Chang, D.; Dong, M.; Fielding, M.; Kruglick, E.; Ho, J.; Lin, F.; Lin, T.; Marcy, H. Low power wireless communication and signal processing circuits for distributed microsensors. In Proceedings of the 1997 IEEE International Symposium on Circuits and Systems (ISCAS), Hong Kong, China, 12 June 1997; pp. 2817–2820. [Google Scholar]
  6. Zhu, Q.; Guan, M.; He, Y. Vibration energy harvesting in automobiles to power wireless sensors. In Proceedings of the 2012 IEEE International Conference on Information and Automation, Shenyang, China, 6–8 June 2012; pp. 349–354. [Google Scholar]
  7. Dong, M.J.; Yung, K.G.; Kaiser, W.J. Low power signal processing architectures for network microsensors. In Proceedings of the 1997 International Symposium on Low Power Electronics and Design, Monterey, CA, USA, 18–20 August 1997; pp. 173–177. [Google Scholar]
  8. Li, X.; Li, D.; Wan, J.; Vasilakos, A.V.; Lai, C.-F.; Wang, S. A review of industrial wireless networks in the context of industry 4.0. Wirel. Netw. 2017, 23, 23–41. [Google Scholar] [CrossRef]
  9. Chen, M.; Wan, J.; González-Valenzuela, S.; Liao, X.; Leung, V.C. A Survey of Recent Developments in Home M2M Networks. IEEE Commun. Surv. Tutor. 2014, 16, 98–114. [Google Scholar] [CrossRef]
  10. Li, Z.; Outbib, R.; Giurgea, S.; Hissel, D. Fault diagnosis for PEMFC systems in consideration of dynamic behaviors and spatial inhomogeneity. IEEE Trans. Energy Convers. 2018, 34, 3–11. [Google Scholar] [CrossRef]
  11. Felser, M. Real-time ethernet-industry prospective. Proc. IEEE 2005, 93, 1118–1129. [Google Scholar] [CrossRef]
  12. Tanneru, H.K.; Kuruvinashetti, K.; Pillay, P.; Rengaswamy, R.; Packirisamy, M. Feasibility Studies of Micro Photosynthetic Power Cells as a Competitor of Photovoltaic Cells for Low and Ultra-Low Power IoT Applications. Energies 2019, 12, 1595. [Google Scholar] [CrossRef] [Green Version]
  13. Chalasani, S.; Conrad, J.M. A survey of energy harvesting sources for embedded systems. In Proceedings of the IEEE Southeastcon 2008, Huntsville, AL, USA, 3–6 April 2008; pp. 442–447. [Google Scholar]
  14. Gungor, V.C.; Hancke, G.P. Industrial wireless sensor networks: Challenges, design principles, and technical approaches. IEEE Trans. Ind. Electron. 2009, 56, 4258–4265. [Google Scholar] [CrossRef] [Green Version]
  15. Mouapi, A.; Mrad, H.; Parsad, A. Implementation of a Reliability Test Protocol for a Multimeasurement Sensor dedicated to Industrial Applications of the Internet of Things. Measurement 2019, 107312. [Google Scholar] [CrossRef]
  16. Shrouf, F.; Ordieres, J.; Miragliotta, G. Smart Factories in Industry 4.0: A Review of the Concept and of Energy Management Approached in Production Based on the Internet of Things Paradigm. In Proceedings of the 2014 IEEE International Conference on Industrial Engineering and Engineering Management (IEEM), Bandar Sunway, Malaysia, 9–12 December 2014; pp. 697–701. [Google Scholar]
  17. Roundy, S. Shad Roundy—Associate Professor. Available online: https://mech.utah.edu/faculty/shad-roundy/ (accessed on 15 January 2017).
  18. Roundy, S.; Steingart, D.; Frechette, L.; Wright, P.; Rabaey, J. Power Sources for Wireless Sensor Networks. In Proceedings of the European Workshop on Wireless Sensor Networks, Berlin, Germany, 19–21 January 2004; pp. 1–17. [Google Scholar]
  19. Roundy, S.; Wright, P.K. A piezoelectric vibration based generator for wireless electronics. Smart Mater. Struct. 2004, 13, 1131. [Google Scholar] [CrossRef] [Green Version]
  20. Roundy, S.; Wright, P.K.; Rabaey, J. A study of low level vibrations as a power source for wireless sensor nodes. Comput. Commun. 2003, 26, 1131–1144. [Google Scholar] [CrossRef]
  21. Yeo, H.G.; Xue, T.; Roundy, S.; Ma, X.; Rahn, C.; Trolier-McKinstry, S. Piezoelectric MEMS Energy Harvesters for Powering Sensor Systems. Multidiscip. Digit. Publ. Inst. Proc. 2018, 2, 1103. [Google Scholar] [CrossRef] [Green Version]
  22. Guyomar, D.; Badel, A.; Lefeuvre, E.; Richard, C. Toward energy harvesting using active materials and conversion improvement by nonlinear processing. IEEE Trans. Ultrason. Ferroelectr. Freq. Control 2005, 52, 584–595. [Google Scholar] [CrossRef] [Green Version]
  23. Lefeuvre, E.; Badel, A.; Petit, L.; Richard, C.; Guyomar, D. Semi-passive piezoelectric structural damping by synchronized switching on voltage sources. J. Intell. Mater. Syst. Struct. 2006, 17, 653–660. [Google Scholar] [CrossRef]
  24. Guyomar, D.; Lallart, M. Recent progress in piezoelectric conversion and energy harvesting using nonlinear electronic interfaces and issues in small scale implementation. Micromachines 2011, 2, 274–294. [Google Scholar] [CrossRef] [Green Version]
  25. Guyomar, D.; Badel, A. Nonlinear semi-passive multimodal vibration damping: An efficient probabilistic approach. J. Sound Vib. 2006, 294, 249–268. [Google Scholar] [CrossRef]
  26. Soeleman, H.; Roy, K.; Paul, B. Robust Ultra-Low Power Sub-Threshold DTMOS Logic. In Proceedings of the 2000 International Symposium on Low Power Electronics and Design, Rapallo, Italy, 25–27 July 2000; pp. 25–30. [Google Scholar]
  27. Kim, J.-J.; Roy, K. Double gate-MOSFET subthreshold circuit for ultralow power applications. IEEE Trans. Electron Devices 2004, 51, 1468–1474. [Google Scholar] [CrossRef]
  28. Yamane, T.; Hamamura, S.; Zaitsu, T.; Minomiya, T.; Shoyama, M.; Fuda, Y. Efficiency Improvement of Piezoelectric-Transformer DC-DC Converter. In Proceedings of the PESC 98 Record. 29th Annual IEEE Power Electronics Specialists Conference, Fukuoka, Japan, 22 May 1998; pp. 1255–1261. [Google Scholar]
  29. Ottman, G.K.; Hofmann, H.F.; Lesieutre, G.A. Optimized piezoelectric energy harvesting circuit using step-down converter in discontinuous conduction mode. IEEE Trans. Power Electron. 2003, 18, 696–703. [Google Scholar] [CrossRef]
  30. Lefeuvre, E.; Audigier, D.; Richard, C.; Guyomar, D. Buck-boost converter for sensorless power optimization of piezoelectric energy harvester. IEEE Trans. Power Electron. 2007, 22, 2018–2025. [Google Scholar] [CrossRef]
  31. Ottman, G.K.; Hofmann, H.F.; Bhatt, A.C.; Lesieutre, G.A. Adaptive piezoelectric energy harvesting circuit for wireless remote power supply. IEEE Trans. Power Electron. 2002, 17, 669–676. [Google Scholar] [CrossRef] [Green Version]
  32. Kong, N.; Ha, D.S. Low-power design of a self-powered piezoelectric energy harvesting system with maximum power point tracking. IEEE Trans. Power Electron. 2012, 27, 2298–2308. [Google Scholar] [CrossRef]
  33. Halgamuge, M.N.; Zukerman, M.; Ramamohanarao, K.; Vu, H.L. An estimation of sensor energy consumption. Prog. Electromagn. Res. 2009, 12, 259–295. [Google Scholar] [CrossRef] [Green Version]
  34. Mouapi, A.; Hakem, N. A New Approach to Design Autonomous Wireless Sensor Node Based on RF Energy Harvesting System. Sensors 2018, 18, 133. [Google Scholar] [CrossRef] [Green Version]
  35. Duarte-Melo, E.J.; Liu, M. Analysis of Energy Consumption and Lifetime of Heterogeneous Wireless Sensor Networks. In Proceedings of the IEEE Global Telecommunications Conference, GLOBECOM’02, Taipei, Taiwan, 17–21 November 2002; pp. 21–25. [Google Scholar]
  36. Chang, J.-H.; Tassiulas, L. Maximum lifetime routing in wireless sensor networks. IEEE/ACM Trans. Netw. 2004, 12, 609–619. [Google Scholar] [CrossRef]
  37. Heinzelman, W.R.; Chandrakasan, A.; Balakrishnan, H. Energy-Efficient Communication protocol for Wireless Microsensor Networks. In Proceedings of the 33rd Annual Hawaii International Conference on System Sciences, Maui, HI, USA, 7 January 2000; Volume 12, p. 10. [Google Scholar]
  38. Marcelloni, F.; Vecchio, M. A simple algorithm for data compression in wireless sensor networks. IEEE Commun. Lett. 2008, 12, 411–413. [Google Scholar] [CrossRef]
  39. Schurgers, C.; Srivastava, M.B. Energy Efficient Routing in Wireless Sensor Networks. In Proceedings of the 2001, MILCOM Proceedings for Network-Centric Operations: Creating the Information Force, McLean, VA, USA, 28–31 October 2001; pp. 357–361. [Google Scholar]
  40. Toprak, A.; Tigli, O. Piezoelectric energy harvesting: State-of-the-art and challenges. Appl. Phys. Rev. 2014, 1, 031104. [Google Scholar] [CrossRef]
  41. Khaligh, A.; Zeng, P.; Zheng, C. Kinetic energy harvesting using piezoelectric and electromagnetic technologies—state of the art. IEEE Trans. Ind. Electron. 2010, 57, 850–860. [Google Scholar] [CrossRef]
  42. Niezrecki, C.; Brei, D.; Balakrishnan, S.; Moskalik, A. Piezoelectric actuation: State of the art. Shock Vib. Digest 2001, 33, 269–280. [Google Scholar] [CrossRef]
  43. Renaud, M.; Karakaya, K.; Sterken, T.; Fiorini, P.; Van Hoof, C.; Puers, R. Fabrication, modelling and characterization of MEMS piezoelectric vibration harvesters. Sens. Actuators A Phys. 2008, 145, 380–386. [Google Scholar] [CrossRef]
  44. Lu, F.; Lee, H.; Lim, S. Modeling and analysis of micro piezoelectric power generators for micro-electromechanical-systems applications. Smart Mater. Struct. 2003, 13, 57. [Google Scholar] [CrossRef]
  45. Harb, A. Energy harvesting: State-of-the-art. Renew. Energy 2011, 36, 2641–2654. [Google Scholar] [CrossRef]
  46. Caliò, R.; Rongala, U.B.; Camboni, D.; Milazzo, M.; Stefanini, C.; De Petris, G.; Oddo, C.M. Piezoelectric energy harvesting solutions. Sensors 2014, 14, 4755–4790. [Google Scholar] [CrossRef] [PubMed] [Green Version]
  47. Beeby, S.P.; Tudor, M.J.; White, N. Energy harvesting vibration sources for microsystems applications. Meas. Sci. Technol. 2006, 17, R175. [Google Scholar] [CrossRef]
  48. Gafforelli, G.; Ardito, R.; Corigliano, A. Improved one-dimensional model of piezoelectric laminates for energy harvesters including three dimensional effects. Compos. Struct. 2015, 127, 369–381. [Google Scholar] [CrossRef] [Green Version]
  49. Gafforelli, G.; Corigliano, A.; Xu, R.; Kim, S.-G. Experimental verification of a bridge-shaped, nonlinear vibration energy harvester. Appl. Phys. Lett. 2014, 105, 203901. [Google Scholar] [CrossRef] [Green Version]
  50. Williams, C.; Yates, R.B. Analysis of a micro-electric generator for microsystems. Sens. Actuators A Phys. 1996, 52, 8–11. [Google Scholar] [CrossRef]
  51. Priya, S.; Inman, D.J. Energy Harvesting Technologies; Springer: New York, NY, USA, 2009; Volume 21. [Google Scholar]
  52. Mouapi, A.; Hakem, N.; Kandil, N.; Kamani, G.V. Energy Harvesting Design for Autonomous Wireless Sensors Network Applied to Trains. In Proceedings of the 2016 IEEE International Ultrasonics Symposium (IUS), Tours, France, 18–21 September 2016; pp. 1–4. [Google Scholar]
  53. Mason, W.P. Piezoelectricity, its history and applications. J. Acoust. Soc. Am. 1981, 70, 1561–1566. [Google Scholar] [CrossRef]
  54. Saadon, S.; Sidek, O. A review of vibration-based MEMS piezoelectric energy harvesters. Energy Convers. Manag. 2011, 52, 500–504. [Google Scholar] [CrossRef]
  55. Renaud, M.; Sterken, T.; Fiorini, P.; Puers, R.; Baert, K.; Van Hoof, C. Scavenging Energy from Human Body: Design of a Piezoelectric Transducer. In Proceedings of the 13th International Conference on Solid-State Sensors, Actuators and Microsystems, 2005, Digest of Technical Papers, TRANSDUCERS’05, Seoul, Korea, 5–9 June; 2005; pp. 784–787. [Google Scholar]
  56. Smits, J.G.; Ballato, A. Dynamic Behavior of Piezoelectric Bimorphs. In Proceedings of the Ultrasonics Symposium, Baltimore, MD, USA, 31 October–3 November 1993; p. 463. [Google Scholar]
  57. Smits, J.G.; Choi, W.-S. The constituent equations of piezoelectric heterogeneous bimorphs. IEEE Trans. Ultrason. Ferroelectr. Freq. Control 1991, 38, 256–270. [Google Scholar] [CrossRef]
  58. Lee, H.J.; Sherrit, S.; Tosi, L.P.; Walkemeyer, P.; Colonius, T. Piezoelectric energy harvesting in internal fluid flow. Sensors 2015, 15, 26039–26062. [Google Scholar] [CrossRef] [PubMed] [Green Version]
  59. Khanna, R.; Pisharody, G.; Carlson, C.R. Coordinator for Low Power Sensor nEtwork with Tree or Star Topology. Google Patents 10,462,224, 3 January 2019. [Google Scholar]
  60. Chakraborty, I.; Chakraborty, A.; Das, P. Sensor Selection and Data Fusion Approach for IoT Applications. In Recent Developments in Machine Learning and Data Analytics; Springer: New York, NY, USA, 2019; pp. 17–33. [Google Scholar]
  61. Akyildiz, I.F.; Wang, X.; Wang, W. Wireless mesh networks: A survey. Comput. Netw. 2005, 47, 445–487. [Google Scholar] [CrossRef]
  62. Abbasi, A.A.; Younis, M. A survey on clustering algorithms for wireless sensor networks. Comput. Commun. 2007, 30, 2826–2841. [Google Scholar] [CrossRef]
  63. Shrestha, A.; Xing, L. A Performance Comparison of Different Topologies for Wireless Sensor Networks. In Proceedings of the 2007 IEEE Conference on Technologies for Homeland Security, Woburn, MA, USA, 16–17 May 2007; pp. 280–285. [Google Scholar]
  64. Mouapi, A.; Hakem, N. Performance Evaluation of Wireless Sensor Node Powered by RF Energy Harvesting. In Proceedings of the 2016 16th Mediterranean Microwave Symposium (MMS), Abu Dhabi, UAE, 14–16 November 2016; pp. 1–4. [Google Scholar]
  65. Wang, A.; Chandrakasan, A. Energy-efficient DSPs for wireless sensor networks. IEEE Signal Process. Mag. 2002, 19, 68–78. [Google Scholar] [CrossRef]
  66. Rappaport, T.S. Wireless Communications: Principles and Practice; Prentice Hall PTR: Upper Saddle River, NJ, USA, 1996; Volume 2. [Google Scholar]
  67. Johnson, M.; Healy, M.; van de Ven, P.; Hayes, M.J.; Nelson, J.; Newe, T.; Lewis, E. A comparative review of wireless sensor network mote technologies. In Proceedings of the 2009 IEEE SENSORS, Christchurch, New Zealand, 25–28 October 2009; pp. 1439–1442. [Google Scholar]
  68. Miller, M.J.; Vaidya, N.H. A MAC protocol to reduce sensor network energy consumption using a wakeup radio. IEEE Trans. Mob. Comput. 2005, 4, 228–242. [Google Scholar] [CrossRef]
  69. Mouapi, A.; Hakem, N.; Delisle, G.Y. Autonomous Wireless Sensors Network Based on Piezoelectric Energy Harvesting. Open J. Antennas Propag. 2016, 4, 138. [Google Scholar] [CrossRef] [Green Version]
  70. Instruments Texas. CC2520 Datasheet: 2.4 GHz IEEE 802.15. 4/Zigbee RF Transceiver. SWRS068; Instruments Texas: Dallas, TX, USA, 2007. [Google Scholar]
  71. Shnayder, V.; Hempstead, M.; Chen, B.-R.; Allen, G.W.; Welsh, M. Simulating the Power Consumption of Large-Scale Sensor Network Applications. In Proceedings of the 2nd International Conference on Embedded Networked Sensor Systems, Baltimore, MD, USA, 3–5 November 2004; pp. 188–200. [Google Scholar]
  72. Heinzelman, W.R.; Sinha, A.; Wang, A.; Chandrakasan, A.P. Energy-Scalable Algorithms and Protocols for Wireless Microsensor Networks. In Proceedings of the 2000 IEEE International Conference on Acoustics, Speech, and Signal Processing, ICASSP’00, Istanbul, Turkey, 5–9 June 2000; pp. 3722–3725. [Google Scholar]
  73. Mouapi, A. Design, Modeling and Simulation of Piezoelectric Microgenerator for application in Underground Vehicles. In Proceedings of the 2019 IEEE International Conference on Environment and Electrical Engineering and 2019 IEEE Industrial and Commercial Power Systems Europe (EEEIC/I&CPS Europe), Genova, Italy, 11–14 June 2019; pp. 1–5. [Google Scholar]
  74. Yu, H.; Zhou, J.; Deng, L.; Wen, Z. A vibration-based MEMS piezoelectric energy harvester and power conditioning circuit. Sensors 2014, 14, 3323–3341. [Google Scholar] [CrossRef]
  75. Badel, A.; Guyomar, D.; Lefeuvre, E.; Richard, C. Piezoelectric energy harvesting using a synchronized switch technique. J. Intell. Mater. Syst. Struct. 2006, 17, 831–839. [Google Scholar] [CrossRef]
  76. Do, X.-D.; Ko, Y.-H.; Nguyen, H.-H.; Le, H.-B.; Lee, S.-G. An Efficient Parallel SSHI Rectifier for Piezoelectric Energy Scavenging Systems. In Proceedings of the 13th International Conference on Advanced Communication Technology (ICACT), Seoul, Korea, 13–16 February 2011; pp. 1394–1397. [Google Scholar]
  77. Mateu, L.; Lühmann, L.; Zessin, H.; Spies, P. Modified parallel SSHI AC-DC Converter for Piezoelectric Energy Harvesting Power Supplies. In Proceedings of the 2011 IEEE 33rd International Telecommunications Energy Conference (INTELEC), Amsterdam, The Netherlands, 9–13 October 2011; pp. 1–7. [Google Scholar]
  78. Liang, J.; Liao, W.-H. Improved design and analysis of self-powered synchronized switch interface circuit for piezoelectric energy harvesting systems. IEEE Trans. Ind. Electron. 2012, 59, 1950–1960. [Google Scholar] [CrossRef]
  79. Shu, Y.; Lien, I.; Wu, W. An improved analysis of the SSHI interface in piezoelectric energy harvesting. Smart Mater. Struct. 2007, 16, 2253. [Google Scholar] [CrossRef]
  80. Lefeuvre, E.; Badel, A.; Benayad, A.; Lebrun, L.; Richard, C.; Guyomar, D. A comparison between several approaches of piezoelectric energy harvesting. J. Phys. IV 2005, 128, 177–186. [Google Scholar] [CrossRef]
  81. Ammar, Y.; Basrour, S. Non Linear Techniques for Increasing Harvesting Energy from Piezoelectric and Electromagnetic Micro-Power-Generators. In Proceedings of the Technology & Engineering Symposium on Design, Test, Integration and Packaging of MEMS/MOEMS, DTIP, Stresa, Italy, 26–28 April 2006; p. 5. [Google Scholar]
  82. Badel, A.; Guyomar, D.; Lefeuvre, E.; Richard, C. Efficiency enhancement of a piezoelectric energy harvesting device in pulsed operation by synchronous charge inversion. J. Intell. Mater. Syst. Struct. 2005, 16, 889–901. [Google Scholar] [CrossRef]
  83. Qiu, J.; Jiang, H.; Ji, H.; Zhu, K. Comparison between four piezoelectric energy harvesting circuits. Front. Mech. Eng. China 2009, 4, 153–159. [Google Scholar] [CrossRef]
  84. Richard, C.; Guyomar, D.; Lefeuvre, E. Self-Powered Electronic Breaker with Automatic Switching by Detecting Maxima or Minima of Potential Difference between its Power Electrodes. FR2005/0030000. Publication Number: WO/2007/063194. 2007. [Google Scholar]
  85. Badel, A. Récupération D’énergie et Contrôle Vibratoire par Éléments Piézoélectriques Suivant une Approche non Linéaire. Ph.D. Thesis, University of Savoie, Chambéry, France, 2005. [Google Scholar]
  86. Lu, S.; Boussaid, F. A highly efficient P-SSHI rectifier for piezoelectric energy harvesting. IEEE Trans. Power Electron. 2015, 30, 5364–5369. [Google Scholar] [CrossRef]
  87. Wu, Y.; Badel, A.; Formosa, F.; Liu, W.; Agbossou, A. Self-powered optimized synchronous electric charge extraction circuit for piezoelectric energy harvesting. J. Intell. Mater. Syst. Struct. 2014, 25, 2165–2176. [Google Scholar] [CrossRef]
  88. Cheng, L.-C.; Kang, Y.-C.; Chen, C.-L. A Resonance-Frequency-Tracing Method for a Current-Fed Piezoelectric Transducer. IEEE Trans. Ind. Electron. 2014, 61, 6031–6040. [Google Scholar] [CrossRef]
  89. Priya, S.; Chen, C.-T.; Fye, D.; Zahnd, J. Piezoelectric windmill: A novel solution to remote sensing. Jpn. J. Appl. Phys. 2004, 44, L104. [Google Scholar] [CrossRef]
  90. Mouapi, A.; Hakem, N.; Delisle, G.Y.; Kandil, N. A Novel Piezoelectric Micro-Generator to Power Wireless Sensors Networks in Vehicles. In Proceedings of the 2015 IEEE 15th International Conference on Environment and Electrical Engineering (EEEIC), Rome, Italy, 10–13 June 2015; pp. 1089–1092. [Google Scholar]
  91. Ferrari, M.; Ferrari, V.; Marioli, D.; Taroni, A. Modeling, fabrication and performance measurements of a piezoelectric energy converter for power harvesting in autonomous microsystems. IEEE Trans. Instrum. Meas. 2006, 55, 2096–2101. [Google Scholar] [CrossRef]
  92. Hamilton, M.C. Recent advances in energy harvesting technology and techniques. In Proceedings of the IECON 2012-38th Annual Conference on IEEE Industrial Electronics Society, Montreal, QC, Canada, 25–28 October 2012; pp. 6297–6304. [Google Scholar]
  93. Badel, A.; Benayad, A.; Lefeuvre, E.; Lebrun, L.; Richard, C.; Guyomar, D. Single crystals and nonlinear process for outstanding vibration-powered electrical generators. IEEE Trans. Ultrason. Ferroelectr. Freq. Control 2006, 53, 673–684. [Google Scholar] [CrossRef]
  94. Sodano, H.A.; Inman, D.J.; Park, G. Comparison of piezoelectric energy harvesting devices for recharging batteries. J. Intell. Mater. Syst. Struct. 2005, 16, 799–807. [Google Scholar] [CrossRef]
  95. Phipps, A.G. Modeling and Characterization of Piezoelectric Energy Harvesting Systems with the Pulsed Resonant Converter; University of Florida: Gainesville, FL, USA, 2010. [Google Scholar]
  96. Marzencki, M.; Ammar, Y.; Basrour, S. Integrated power harvesting system including a MEMS generator and a power management circuit. Sens. Actuators A Phys. 2008, 145, 363–370. [Google Scholar] [CrossRef]
  97. Le, T.T.; Han, J.; von Jouanne, A.; Mayaram, K.; Fiez, T.S. Piezoelectric micro-power generation interface circuits. IEEE J. Solid State Circuits 2006, 41, 1411–1420. [Google Scholar] [CrossRef]
  98. Yang, Y.; Qi, J.; Liao, Q.; Li, H.; Wang, Y.; Tang, L.; Zhang, Y. High-performance piezoelectric gate diode of a single polar-surface dominated ZnO nanobelt. Nanotechnology 2009, 20, 125201. [Google Scholar] [CrossRef] [PubMed]
  99. Ngo, K.D.; Phipps, A.; Nishida, T.; Lin, J.; Xu, S. Power Converters for Piezoelectric Energy Extraction. In Proceedings of the ASME 2006 International Mechanical Engineering Congress and Exposition, Chicago, IL, USA, 5–10 November 2006; pp. 597–602. [Google Scholar]
  100. Kim, J.; Kim, C. A DC-DC boost converter with variation-tolerant MPPT technique and efficient ZCS circuit for thermoelectric energy harvesting applications. IEEE Trans. Power Electron. 2013, 28, 3827–3833. [Google Scholar] [CrossRef]
  101. Gasnier, P.; Willemin, J.; Boisseau, S.; Despesse, G.; Condemine, C.; Gouvernet, G.; Chaillout, J.-J. An autonomous piezoelectric energy harvesting IC based on a synchronous multi-shot technique. IEEE J. Solid State Circuits 2014, 49, 1561–1570. [Google Scholar] [CrossRef]
  102. Batarseh, I. Power Electronic Circuits; John Wiley: Hoboken, NJ, USA, 2004; Volume 426. [Google Scholar]
  103. Ramadass, Y.K.; Chandrakasan, A.P. An efficient piezoelectric energy harvesting interface circuit using a bias-flip rectifier and shared inductor. IEEE J. Solid State Circuits 2010, 45, 189–204. [Google Scholar] [CrossRef] [Green Version]
  104. Vernier. Accelerometers. Available online: https://www.vernier.com/products/sensors/accelerometers/ (accessed on 8 September 2018).
  105. Vernier. Graphical Analysis. Available online: https://www.vernier.com/products/software/graphical-analysis/ (accessed on 10 January 2017).
  106. MIDÉ. Packaged Piezoelectric Actuators and Sensors. Available online: https://www.mide.com/collections/vibration-energy-harvesting-with-protected-piezos (accessed on 23 December 2018).
  107. Seah, W.K.; Eu, Z.A.; Tan, H.-P. Wireless Sensor Networks Powered by Ambient Energy Harvesting (WSN-HEAP)-Survey and Challenges. In Proceedings of the 2009 1st International Conference on Wireless Communication, Vehicular Technology, Information Theory and Aerospace & Electronic Systems Technology, Aalborg, Denmark, 17–20 May 2009; pp. 1–5. [Google Scholar]
  108. Rout, R.R.; Ghosh, S.K. Enhancement of lifetime using duty cycle and network coding in wireless sensor networks. IEEE Trans. Wirel. Commun. 2013, 12, 656–667. [Google Scholar] [CrossRef]
Figure 1. Drive diagram of a crusher with various sensors.
Energies 13 00063 g001
Figure 2. Harvest and use of vibratory energy for wireless sensor (WS).
Energies 13 00063 g002
Figure 3. Generic vibration converter model.
Energies 13 00063 g003
Figure 4. The frequency response of the electric power for A   =   0.4   m / s 2 , ω n = 94.2   rad   /   s and m   =   5   g .
Energies 13 00063 g004
Figure 5. Piezoelectric transduction method for harvesting energy from vibration.
Energies 13 00063 g005
Figure 6. Cantilever type piezoelectric transducer (PT).
Energies 13 00063 g006
Figure 7. (a) Star topology wireless sensor network (WSN). (b) WS activities.
Energies 13 00063 g007
Figure 8. (a) The equivalent electrical model of the PT. (b) PT with resistive load.
Energies 13 00063 g008
Figure 9. Schematic diagram of the synchronized switch harvesting on inductor (SSHI) technique. (a) P-SSHI. (b) S-SSHI.
Energies 13 00063 g009
Figure 10. Amplification of the output voltage of the transducer due to the application of the SSHI technique.
Energies 13 00063 g010
Figure 11. A Schematic of self-powered SSHI.
Energies 13 00063 g011
Figure 12. Standard rectifier-capacitor circuit.
Energies 13 00063 g012
Figure 13. Active rectifier-capacitor with battery load.
Energies 13 00063 g013
Figure 14. Optimized piezoelectric micro generator (PMG) by SSHI technique.
Energies 13 00063 g014
Figure 15. Overview of the test locomotive.
Energies 13 00063 g015
Figure 16. Vibration measurement scheme.
Energies 13 00063 g016
Figure 17. (a) and (b) Time response of the measured vibrations. (c) and (d) Frequency distribution of the measured vibrations. (e) and (f) Power spectrum of the measured vibrations.
Energies 13 00063 g017aEnergies 13 00063 g017b
Figure 18. An experimental device for modeling the transducer.
Energies 13 00063 g018
Figure 19. (a) Open circuit voltage. (b) Maximum recoverable power.
Energies 13 00063 g019
Figure 20. Optimization of PT performance by SSHI technique. (a) open circuit voltage. (b) Maximum recoverable power.
Energies 13 00063 g020
Figure 21. WS performance powered by different PMG configurations.
Energies 13 00063 g021
Table 1. Comparison with related work.
RefPTEHCDE *DC **Keys Points
[8] × ×
  • Communication technologies of IWS.
  • Network topologies.
  • Application of Wireless Sensor WSs in the industrial context.
  • Architecture based on Quality of Service QoS.
[40] × × ×
  • Properties of piezoelectric material.
  • Classification of piezoelectric transducer.
[48] × ×
  • Inclusion of three-dimensional effects in the analysis of piezoelectric transducers while considering a one-dimensional model.
  • Analysis of the transducer in the frequency domain.
[49] × ×
  • Analysis of the non-linear behavior of piezoelectric transducers.
  • Nonlinear transducer modeling with experimental validation.
[41] × ×
  • Comparison between electromagnetic and piezoelectric harvesting.
  • Summary of a piezoelectric energy harvester.
  • Hybrid Generator.
[42] × ×
  • Piezoelectric materials.
  • Architectures of the PT.
[43] × ×
  • Micromachining fabrication.
[44] ×
  • The energy conversion efficiency of the PMG.
  • Design guidelines through simulation results.
[19] ×
  • Transducer design equations.
  • Optimal load resistor of the PMG.
[45] ×
  • DC/DC converters for PMG.
[24]
  • Nonlinear Electronic Interfaces and Issues in Small Scale Implementation.
[46] ×
  • Properties of piezoelectric materials.
  • PTs geometry.
  • Performance of recent PT designs.
This paper
  • PT design equation.
  • Analysis of the EHC.
  • Considering the energy need of IWS.
  • Definition of the specifications of the self-powered IWS.
* DE: Design Equations, ** DC: Design Consideration.
Table 2. Used parameters to estimate the energy consumed by the WS.
SymbolDescriptionValues
Packet size
V sup Supply voltage to the sensor2.7 V [70]
d Distance WS to sink 88   m [34]
I sens Required current for sensing activity 25   mA [33]
I read Current: flash reading 1-byte data 6.2   mA [71]
I write Current: flash writing 1-byte data 18.4   mA [71]
T sens Time duration for sensor node sensing 0.5   mS [33]
T read Time duration: flash reading 565   μ S [71]
T writing Time duration: flash writing 12.9   mS [71]
N cyc Number of clock cycles per task 0.97 × 10 6 [72]
I 0 Leakage current 1.196   mA [72]
f Sensor frequency 191.42   MHz [65]
n P Constant depending on the processor21.26 [72]
V t Thermal voltage0.2 V [65]
C avg Average Capacitance switched per cycle 22   pF [70]
E elec Energy dissipation: electronics 50   nJ / bit [37]
ε amp Transmit amplifier for two ray 0.13   pJ / bit / m 4 [37]

