Abstract
In view of the fact that the statistical feature quantity of traditional partial discharge (PD) pattern recognition relies on expert experience and lacks certain generalization, this paper develops PD pattern recognition based on the convolutional neural network (cnn) and long-term short-term memory network (lstm). Firstly, we constructed the cnn-lstm PD pattern recognition model, which combines the advantages of cnn in mining local spatial information of the PD spectrum and the advantages of lstm in mining the PD spectrum time series feature information. Then, the transformer PD UHF (Ultra High Frequency) experiment was carried out. The performance of the constructed cnn-lstm pattern recognition network was tested by using different types of typical PD spectrums. Experimental results show that: (1) for the floating potential defects, the recognition rates of cnn-lstm and cnn are both 100%; (2) cnn-lstm has better recognition ability than cnn for metal protrusion defects, oil paper void defects, and surface discharge defects; and (3) cnn-lstm has better overall recognition accuracy than cnn and lstm.
1. Introduction
As the main core component of the power grid system, the transformer is directly connected to the safety and reliability of the power system. During long-term operation, the insulation system will inevitably deteriorate, resulting in the occurrence of partial discharge (PD) [1,2]. The effective identification of PD defects helps to accurately understand the characteristics of the internal insulation defects, and has important engineering significance for mastering the insulation condition of transformer [3].
At present, the main methods for PD pattern recognition are distance-based pattern classification [3,4], fisher classification [5,6], principal component classification [7,8], neural network classification [9], fuzzy cluster classification [10], Bayesian classification [11,12], support vector machine classification [13,14,15], etc., in which neural network classification and support vector machine classification are the most mature and widely used classification algorithms. However, these algorithms are based on the statistical feature quantity, and the extraction of feature quantity needs to rely on the expert experience, which leads to the lack of certain generalization of these pattern recognition algorithms [16,17,18].
In recent years, with the rapid development of recognition technologies in the research fields such as images, texts, and videos, classification algorithms based on deep learning, for example, dbn (deep belief networks), dnn (deep neural networks), cnn (convolutional neural networks), have gradually begun to be applied in the field of PD pattern recognition [19,20,21]. In 2016, Mingzhe Rong used convolutional neural network for PD pattern recognition. The simulation results show that the recognition accuracy of cnn is better than the Hilbert–Huang transform and wavelet entropy-characterized support vector machine (SVM) [22]. In 2017, Zheng used cnn to identify the pattern of transformer PD. The experimental results show that the recognition rate of cnn is better than the traditional identification method [18]. In 2018, Jiang and Sheng applied cnn to the pattern recognition of GIS PD. The PRPS (phase resolved pulse sequence) map and the whole-period time-domain waveform map were used as input. The research shows that the recognition accuracy of cnn is better than SVM and BP (back propagation) neural network [23,24]. In the same year, Peng used cnn for pattern recognition of cable PD. The results showed that the overall recognition accuracy of cnn increased by 3.71% and 4.06%, respectively, compared with SVM and BP neural network [25]. Nguyen used lstm to identify the partial discharge pattern of GIS (Gis Insulation Switchgear). The experimental results show that the recognition accuracy of lstm is better than SVM [26]. Adam applied lstm to the identification of different PD defect types in insulating oil. The time domain single-pulse electrical signal was used as input. Experimental results show that the recognition accuracy of lstm is slightly lower than the random forest method. However, since the lstm method has the advantage of not requiring human statistical recognition features, it is still recommended by the author [27].
Currently, the display of the on-site power equipment PD online monitoring system is usually in the form of spectrum. As the discharge time increases and the discharge intensity changes, the PD spectrum will change accordingly. If viewed from the time axis perspective, the PD spectrum is a video with local fluctuations over time, with changes in characteristic parameters such as phase, amplitude, and number of discharges, and time series characteristics of characteristic parameters over time. While cnn has excellent local spatial information mining capability, lstm has excellent time series information mining capability. Therefore, if the cnn and lstm can be combined and the local spatial information and time series information of the PD map are extracted at the same time, the recognition accuracy of the PD type with the undulating characteristics will be effectively improved.
2. Cnn-lstm PD Pattern Recognition Network
2.1. Cnn
Cnn has the ability of local perception to extract the details of the local area of the input image. By sharing the network weights, it can greatly reduce the number of variables in the design network, reduce the requirement of network operation on the computing ability of hardware devices, and improve the recognition efficiency. Typical convolutional neural networks usually consist of five layers: input layer, convolution layer, pooling layer, full connection layer, and output layer [28,29,30], as shown in Figure 1.
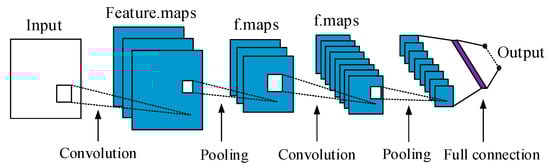
Figure 1.
Typical convolutional neural network.
2.2. Lstm
Long-term and short-term memory network (lstm) is a cyclic neural network with gated structure. It was proposed by German scholar Hochreiter and Swiss scholar Schmidhuber. Gate structure mainly includes three gates: forget gate, input gate, and output gate. Forget gate decides the amount of information discarded, input gate decides the amount of information input, output gate decides the amount of information output [31,32,33]. The gate unit structure of the lstm is shown in Figure 2, which ⊗ is the multiplication of vector elements, ⊕ is the splicing of vectors, xt is the input of current time gated unit, ht−1 is the output of adjacent time gated unit, ct−1 is the state of adjacent time gated unit, and ct is the state of current time gated unit. ht is the output of the current gated unit, σ is the function of sigmoid(·), and tanh is the function of tanh(·).
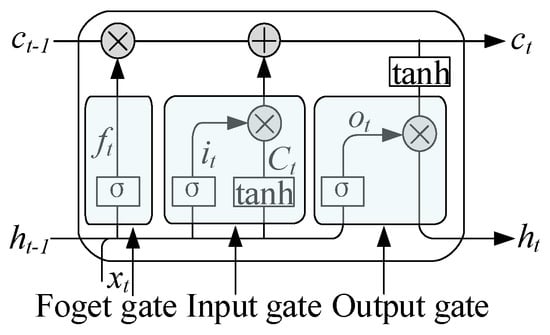
Figure 2.
Gate unit structure of the lstm.
2.3. Cnn-lstm
2.3.1. Cnn-lstm Network Architecture
Cnn-lstm is a combination of convolutional neural network (cnn) and long-term and short-term memory network (lstm), which combines the advantages of both: convolutional neural networks facilitate the extraction of input local spatial features, and long-term memory networks facilitate the extraction of inputs. Additionally there are timing features, and finally pattern recognition by the Softmax classifier. Figure 3 shows the network architecture of the cnn-lstm.
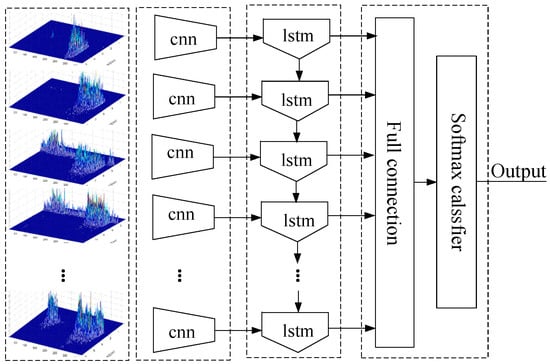
Figure 3.
Cnn-lstm network architecture.
Cnn extracts spatial information of the input spectrum and generates corresponding feature vectors. Suppose n be the number of input PD spectrums. For a single input spectrum, assume that the pixel matrix of the spectrum is , and the size of the convolution kernel is . Use the same method to convolve and fill the periphery of the input spectrum with zero elements. The padding length is , and the size spectrum matrix is expanded from to , so that the dimension of the output and the input result after the convolution operation are unchanged. Let be the pixel value of the ith row and the jth column of the input spectrum after the expansion, and the convolution core domain window matrix which use is as follows:
Convolution operation on window matrix , where and are the weight vector and bias term of the ith convolution layer,
The activation function in the formula (2) is ReLu function.
After completing the convolution operation of the input spectrum, the maximum pooling method is used to pool the output of the convolution layer, obtaining the maximum eigenvalue in the pooling window, and realizing the second optimization of the feature set. Suppose represents the feature spectrum of the nth input spectrum after convolution and pooling, then,
After the feature extraction of all input PD spectrums is completed, the feature matrix extracted by the convolutional neural network layer is:
Suppose that the acquisition time corresponding to the nth input spectrum is t, Rn can be used as the input of the long short-term memory network at the time t, and Rt is used to represent Rn. The corresponding update process of the long short-term memory network is as follows:
where Wf, Wi, and Wo are the weight matrix of the forget gate, the input gate, and the output gate, respectively. bf, bi, and bo are the bias terms of the forget gate, the input gate, and the output gate, respectively; Ct is the state of the input unit, and Wc and bc are the weight matrix and the bias terms of the input unit state, respectively.
2.3.2. Flow of PD Recognition
Cnn-lstm network combines the advantages of cnn and lstm. It can not only extract local spatial features, but also acquire temporal information of different PD spectrum. The PD recognition flow of cnn-lstm network is shown in Figure 4.
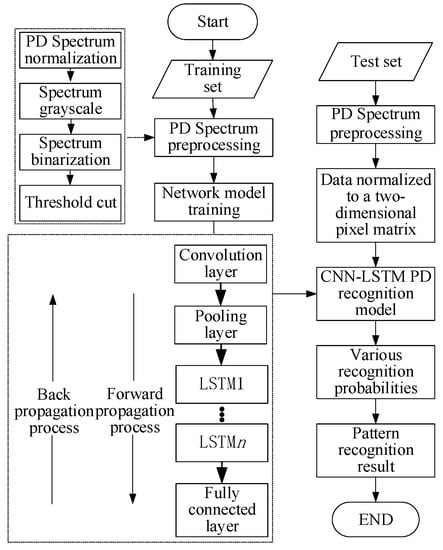
Figure 4.
PD recognition flow of cnn-lstm network.
3. PD Experiment
3.1. Experiment Circuit
The transformer PD UHF (Ultra High Frequency) experimental circuit is shown in Figure 5, where the insulating oil is 25# transformer oil, the sensor is Vivaldi antenna [34], and the detected electromagnetic wave signal is shown in Figure 6.
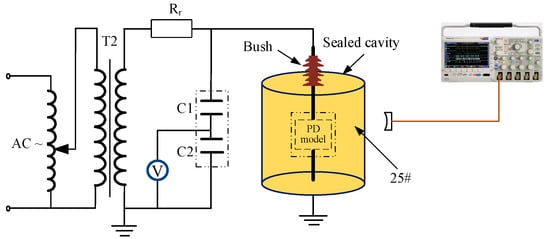
Figure 5.
Transformer partial discharge (PD) experiment circuit.
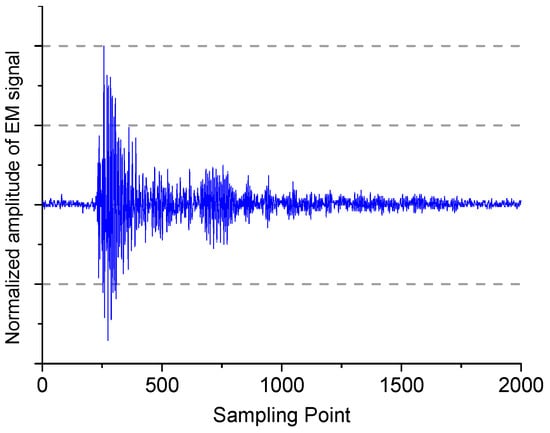
Figure 6.
PD EM (Electromagnetic) wave signal detected by UHF antenna (sampling rate: 10 GHz).
3.2. Construction of Transformer PD Model
For power transformers, according to the operating experience, the parts that are prone to PD include transformer winding turns, outboard insulation board, oil screen, pressure plate, fasteners, oil bubbles, and impurity particles. PD types of power transformers can be summarized as follows: oil gap discharge; PD in oil-paper insulation such as lead and lap wiring; partial breakdown of winding turn insulation; and slip flash discharge along the surface of electrical paper.
In order to verify the PD pattern recognition effect of cnn-lstm network, four typical PD insulation defects of transformer are set up in this paper, which are metal protrusion defect, oil-paper void defect, surface discharge defect, and floating potential defect, as shown in Figure 7.
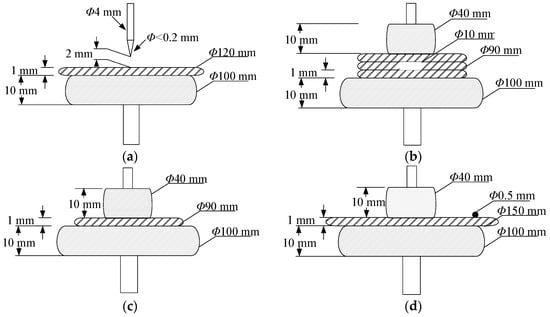
Figure 7.
Four typical transformer PD insulation defect model: (a) metal protrusion defect; (b) oil paper void defect; (c) surface discharge defect; (d) floating potential defect.
The experimental voltage is gradually increased by a step-up method. The initial discharge voltage of PD defect model is and breakdown voltage is , experimental voltage is adjusted to , where:
Keep the experimental voltage stable, use Tek DPO 7000 oscilloscope (Tektronix, Beaverton, OH, USA) to simultaneously acquire the AC phase voltage from the voltage divider capacitor and the high frequency electromagnetic wave signal which is captured by the Vivaldi antenna sensor [34,35]). The sampling rate is 50 MHz, and the positive half-cycle zero-crossing point of the AC voltage signal is used as the trigger signal. 2500 AC cycle PD UHF signals are collected in each sampling process.
3.3. Analysis of Transformer PD UHF Experimental Results
Assuming that the initial sampling time of discharge pulse of insulation defect is t and the whole sampling time of PD pulse signal of each insulation defect is T, the PD maps of four typical insulation defects of power transformer at X, Y, and Z times are shown in Figure 8, Figure 9, Figure 10 and Figure 11.
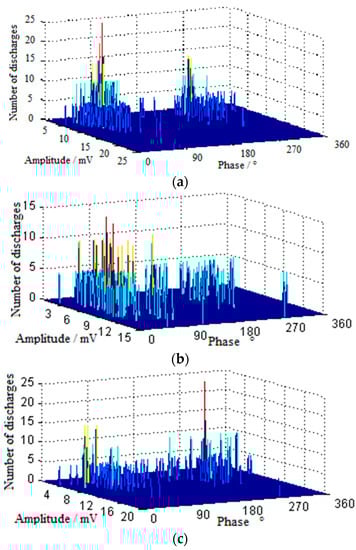
Figure 8.
PD UHF spectrum of metal protrusion defect in transformer oil. (a) PD pulse signal spectrum at time t of metal protrusion defect; (b) PD pulse signal spectrum at time of metal protrusion defect; (c) PD pulse signal spectrum at time of metal protrusion defect.
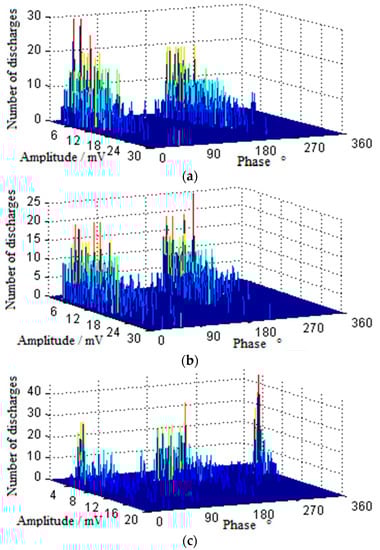
Figure 9.
PD spectrum of oil paper void defect in power transformer oil. (a) PD pulse signal spectrum at time t; (b) PD pulse signal spectrum at time ; (c) PD pulse signal spectrum at time .
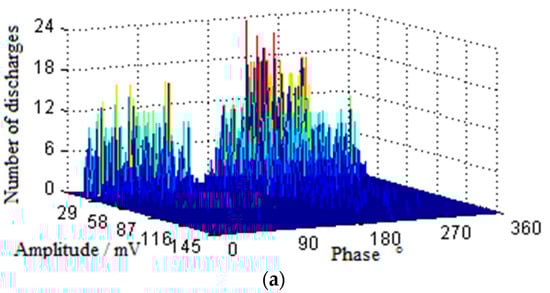
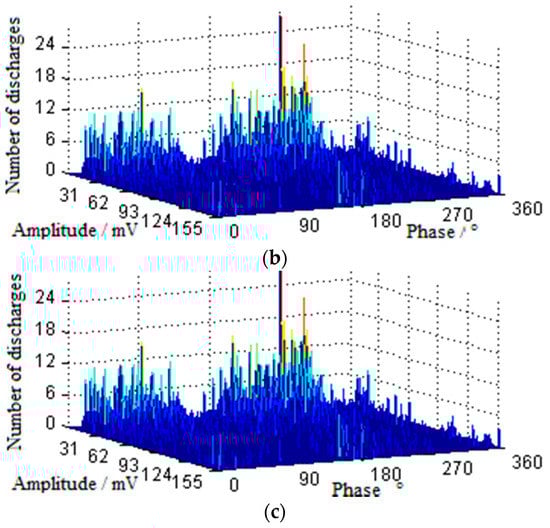
Figure 10.
PD spectrum of surface discharge defect in transformer insulating oil. (a) PD pulse signal spectrum at the time t; (b) PD pulse signal spectrum at the time ; (c) PD pulse signal spectrum at the time .
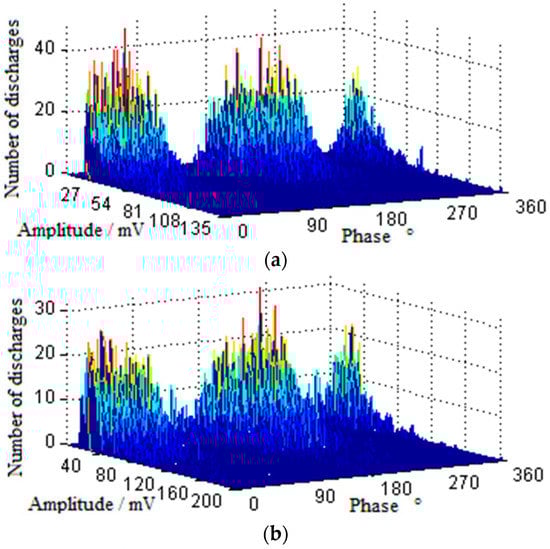
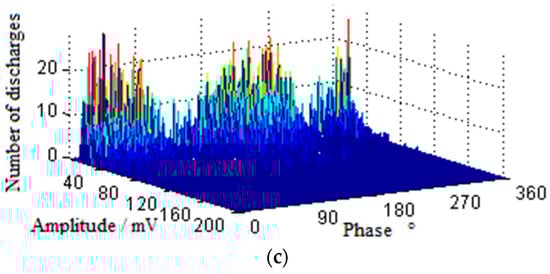
Figure 11.
PD spectrum of floating potential defect in transformer insulating oil. (a) PD pulse signal spectrum at time t; (b) PD pulse signal spectrum at time ; (c) PD pulse signal spectrum at time .
Figure 8 is the PD UHF PRPD (Phase Resolved Partial Discharge) spectrum of metal protrusion insulation defect. It is shown that there is certain fluctuation in the discharge pulse spectrum at different discharge time. The PD spectrum of metal protrusion insulation defect in transformer oil is different from the PD spectrum in air and SF6 insulation environment. In transformer oil insulation environment, the PD pulse signal at the initial sampling time mainly concentrates near the positive half-cycle and negative half-cycle peak of AC phase, and the number of discharge pulses near the positive half-cycle peak is slightly larger than that near the negative half-cycle peak. With the increase of experiment time, the PD spectrum gradually extends to the whole AC phase range. However, in general, the PD pulses of transformer oil metal protrusion mainly distribute near the peak value of positive and negative half-cycle of AC phase. In addition, during the experiment, it was found that the insulation defects of metal protrusions had obvious “cracking” sound before breakdown.
It can be seen from Figure 9 that with the increase of voltage-adding time, the discharge pulse spectrum also has certain fluctuation at different discharge time. At the initial sampling time, the PD pulse mainly concentrates on the positive half-cycle acute angle phase interval and the negative half-cycle acute angle phase interval. With the increase of experiment time, the phase interval of PD pulse distribution increases gradually. In the positive half-cycle of AC phase, the PD pulse expands from the positive half-cycle acute angle phase interval to the positive half-cycle beginning zero-crossing phase interval. In the negative half-cycle of AC phase, the PD pulse expands from the negative half-cycle acute angle phase interval to the negative half-cycle beginning zero-crossing phase interval.
It can be seen in Figure 10 that the stability of the PD pulse along oil-paper surface is not as good as that of metal protrusion defect and void defect. At the initial sampling time, PD pulses are mainly concentrated in the positive half-cycle biased to the acute-angle interval and the negative half-cycle biased to the acute-angle interval. With the increase of the experiment time, the distribution interval of the PD pulse gradually expanded to the zero-crossing point of the positive and negative half cycles of the AC phase. With the further increase of experiment time, the distribution interval of the PD pulse has nearly covered the entire AC phase interval.
Figure 11 is the PD UHF PRPD spectrum of floating potential. The discharge process is stable. With the increase of experiment time, the phase interval of discharge pulse keeps stable and distributes near the zero-crossing point of positive half cycle and the zero-crossing point of negative half cycle.
4. PD Recognition Accuracy of Cnn-lstm
The configuration of the PD pattern recognition device is: Intel i5 processor (2.5 GHz) (Intel, company, Santa Clara, CA, USA), the memory is 8 GB, and the operating environment is Tensorflow (Anaconda). The recognition object is PD spectrum of four transformer typical insulation defects: metal protrusion defect, oil paper void defect, surface discharge defect, and floating potential defect. The input data is PD UHF PRPD spectrum, wherein the training set data accounts for 80% of the data sample set. And the test set data accounts for 20%. The main parameter settings of the cnn-lstm hybrid network are shown in Table 1.

Table 1.
Main parameter settings of cnn-lstm hybrid network.
According to Table 1, the single-channel matrix data of the gray-scale PD spectrum are input into the network for training and recognition, and the recognition rate P is used as the evaluation parameter of the pattern recognition ability of cnn-lstm network. The calculation of Pr is
where is the number of samples that the cnn-lstm network can accurately predict, and is the total number of samples.
The recognition results of cnn-lstm network for different types of typical insulation defects are shown in Table 2. It can be seen from the table that cnn-lstm has the highest recognition rate for floating potential defect, the recognition rate reaches 100%, and the recognition rate for surface discharge defect is the lowest, but it also reaches 89%.
Table 2.
Identification results of different types of typical insulation defects in cnn-lstm hybrid network.
Then, the same PD spectrum data is input to the cnn network and the lstm network, respectively, wherein the parameter settings of the cnn network and the lstm network are the same as the cnn-lstm network settings. Compared with cnn-lstm network, cnn network, and lstm network, the pattern recognition result of transformer typical PD insulation is shown in Table 3.
Table 3.
Pattern recognition result of transformer typical PD insulation with cnn, lstm, and cnn-lstm.
From Table 3, it can be seen that the pattern recognition rate of cnn-lstm network is more accurate than that of cnn network and lstm network for metal protrusion defect, oil-paper void defect, and surface discharge defect, but for floating potential defect, the recognition effect of cnn-lstm network is the same as cnn network, which is 100%. This is because the stability of floating potential defect discharge spectrum is obviously better than that of other types of discharge spectrum, while the advantage of lstm network is the extraction of time series feature information. So when the cnn-lstm network recognizes the types of floating potential defects, the lstm network does not provide much help, but for metal protrusion defects, oil paper void defects, and surface discharge defects, with the increase of experiment time under constant voltage, the corresponding discharge patterns of these three kinds of defects fluctuate obviously. At this time, the advantages of lstm network in extracting temporal feature information of spectrum are embodied, which improves the recognition accuracy of cnn network for these defect types.
5. Conclusions
This paper constructs a PD pattern recognition algorithm of transformer based on cnn-lstm hybrid network, which combines the advantages of cnn in mining local spatial information of PD spectrum and lstm in mining temporal feature information of PD spectrum, and solves the problem that the traditional partial discharge pattern recognition algorithm lacks generality. Through the research, the following conclusions are obtained:
(1) The cnn-lstm hybrid network PD pattern recognition architecture is constructed. The local spatial feature information of the PD map information is extracted by the convolutional layer and the pooled layer, and then the extracted feature information is input to the lstm network to extract all the information including the timing feature information. The PD spectrum identifies the feature information, and finally realizes the pattern recognition of the PD insulation defect through the fully connected layer and the Softmax classifier.
(2) Four typical insulation defect models of oil-immersed power transformer are constructed, and the spectrum information of different insulation defects under different experiment time is obtained. Experimental results show that cnn and cnn-lstm have 100% recognition accuracy for floating potential defect with stable PD spectrum, but the recognition accuracy of cnn-lstm is better than that of cnn and lstm for metal protrusion defect, oil-paper void defect, and surface discharge defect.
Author Contributions
Conceptualization, X.Z. (Xiaoxing Zhang); Methodology, G.Z.; Validation, X.Z. (Xiu Zhou), P.D., X.W., X.L. and N.H.; Investigation, X.Z. (Xiu Zhou), P.D., X.W., X.L. and N.H.; Writing-Original Draft Preparation, G.Z.
Funding
This research received no external funding.
Conflicts of Interest
The authors declare no conflict of interest.
References
- Pan, C.; Tang, J.; Zhang, Y.; Luo, X.; Li, X. Variation of Discharge Characteristics with Temperature in Moving Transformer Oil Contaminated by Metallic Particles. IEEE Access 2018, 6, 40050–40058. [Google Scholar] [CrossRef]
- Mondal, M.; Kumbhar, G.B.; Kulkarni, S.V. Localization of Partial Discharges inside a Transformer Winding Using a Ladder Network Constructed from Terminal Measurements. IEEE Trans. Power Deliv. 2018, 33, 1035–1043. [Google Scholar] [CrossRef]
- Gao, J.; Zhu, Y.; Jia, Y.; Zheng, Y.; Liu, S. Pattern Recognition of Unknown Types of Partial Discharge Based on Improved SVDD Algorithm and Mahalanobis Distance. Trans. China Electrotech. Soc. 2018, 33, 3510–3517. [Google Scholar]
- Gao, J.; Zhu, Y.; Jia, Y. Pattern recognition of unknown partial discharge based on improved SVDD. IET Sci. Meas. Technol. 2018, 12, 907–916. [Google Scholar] [CrossRef]
- Ding, D.; Gao, W.; Liu, W. Insulation Defects Discrimination in GIS by Fisher Discriminant Analysis of Partial Discharge. High Volt. Eng. 2013, 39, 805–812. [Google Scholar]
- Yang, L.; Liao, R.; Sun, C.; Liang, S.; Cheng, H. Identifying Different Aging Stages of Oil-Paper Based on Fisher Discriminant Method. Trans. China Electrotech. Soc. 2005, 20, 33–37. [Google Scholar]
- Firuzi, K.; Vakilian, M.; Darabad, V.P.; Phung, B.T.; Blackburn, T.R. A novel method for differentiating and clustering multiple partial discharge sources using S transform and bag of words feature. IEEE Trans. Dielectr. Electr. Insul. 2017, 24, 3694–3702. [Google Scholar] [CrossRef]
- Liao, R.; Yang, L.; Sun, C.; Li, J. Aging Condition Assessment of Oil-paper Based on Principal Component and Factor Analysis of Partial Discharge. Proc. CSEE 2006, 26, 114–119. [Google Scholar]
- Lv, F.; Xie, J.; Li, M.; Wang, Y.; Liu, X.; Fan, X. A Partial Discharge Recognition Method on Sparse Decomposition. Proc. CSEE 2016, 36, 2836–2845. [Google Scholar]
- Wang, K.; Liao, R.; Wang, J.; Yang, L.; Li, J. Time-Frequency Features Extraction and Clustering Analysis of Partial Discharge UHF Pulses. Trans. China Electrotech. Soc. 2015, 30, 211–219. [Google Scholar] [CrossRef]
- Dai, J.; Teng, Y.; Zhang, Z.; Yu, Z.; Sheng, G.; Jiang, X. A Data Maching Method of Partial Discharge Data Based on Autoencoding Variational Bayes. Proc. CSEE 2018, 38, 5869–5877. [Google Scholar]
- Darabad, V.P.; Vakilian, M.; Phung, B.T.; Blackburn, T.R. An efficient diagnosis method for data mining on single PD pulses of transformer insulation defect models. IEEE Trans. Dielectr. Electr. Insul. 2013, 20, 2061–2072. [Google Scholar] [CrossRef]
- Yang, Q.; Zhao, H.; Sima, W.; Han, R.; Chen, Y. Identification method of Grid Measured Over-voltage Based on Threshold Judgment and Support Vector Machine. High Volt. Eng. 2016, 42, 3188–3198. [Google Scholar]
- Long, J.; Wang, X.; Dai, D.; Tian, M.; Zhu, G.; Huang, Y. Feature Extraction and Classification of UHF PD Signals Based on Improved S—Transform. Hign Volt. Eng. 2018, 44, 3649–3656. [Google Scholar]
- Li, S.; Si, W.; Li, Q. Partition and recognition of partial discharge development stages in oil-pressboard insulation with needle-plate electrodes under combined AC-DC voltage stress. IEEE Trans. Dielectr. Electr. Insul. 2017, 24, 1781–1793. [Google Scholar] [CrossRef]
- Zhang, Q.; Song, H.; Jiang, Y.; Chen, Y.; Sheng, G.; Jiang, X. Partial Discharge Pattern Recognition of Transformer Based on OS-ELM. High Volt. Eng. 2018, 44, 1122–1130. [Google Scholar]
- Basharan, V.; Maria Siluvairaj, W.I.; Ramasamy Velayutham, M. Recognition of multiple partial discharge patterns by multi-class support vector machine using fractal image processing technique. IET Sci. Meas. Technol. 2018, 12, 1031–1038. [Google Scholar] [CrossRef]
- Liu, B.; Zheng, J. Partial Discharge Pattern Recognition in Power Transformers Based on Convolutional Neural Networks. High Volt. Appar. 2017, 53, 70–74. [Google Scholar]
- Zhang, Q.; Lin, J.; Song, H.; Sheng, G. Fault Identification Based on PD Ultrasonic Signal Using RNN, DNN and CNN. In Proceedings of the 2018 Condition Monitoring and Diagnosis (CMD), Perth, WA, Australia, 23–26 September 2018; pp. 1–6. [Google Scholar]
- Banno, K.; Nakamura, Y.; Fujii, Y.; Takano, T. Partial Discharge Source Classification for Switchgears with Transient Earth Voltage Sensor Using Convolutional Neural Network. In Proceedings of the 2018 Condition Monitoring and Diagnosis (CMD), Perth, WA, Australia, 23–26 September 2018; pp. 1–5. [Google Scholar]
- Song, H.; Dai, J.; Zhang, W.; Bi, K.; Luo, L.; Sheng, G.; Jiang, X. Partial Discharge Pattern Recognition Based on Deep Convolutional Neural Network Under Complex Data Sourecs. High Volt. Eng. 2018, 44, 3625–3633. [Google Scholar]
- Li, G.; Rong, M.; Wang, X.; Li, X.; Li, Y. Partial discharge patterns recognition with deep Convolutional Neural Networks. In Proceedings of the 2016 International Conference on Condition Monitoring and Diagnosis (CMD), Xi′an, China, 25–28 September 2016; pp. 324–327. [Google Scholar]
- Wan, X.; Song, H.; Luo, L.; Li, Z.; Sheng, G.; Jiang, X. Pattern Recognition of Partial Discharge Image Based on One-dimensional Convolutional Neural Network. In Proceedings of the 2018 Condition Monitoring and Diagnosis (CMD), Perth, WA, Australia, 23–26 September 2018; pp. 1–4. [Google Scholar]
- Wan, X.; Song, H.; Luo, L.; Li, Z.; Sheng, G.; Jiang, X. Application of Convolutional Neural Networks in Pattern Recognition of Partial Discharge Image. Power Syst. Technol. 2019, 43, 2219–2226. [Google Scholar]
- Yang, F.; Wang, G.; Peng, X.; Wen, J.; Chen, Q.; Yang, G.; Li, C. Partial Discharge pattern recognition of high-voltage cables based on convolutional neural network. Electr. Power Autom. Equip. 2018, 38, 123–128. [Google Scholar]
- Nguyen, M.T.; Nguyen, V.H.; Yun, S.J.; Kim, Y.H. Recurrent Neural Network for Partial Discharge Diagnosis in Gas-Insulated Switchgear. Energies 2018, 11, 1202. [Google Scholar] [CrossRef]
- Adam, B.; Tenbohlen, S. Classification of multiple PD Sources by Signal Features and LSTM Networks. In Proceedings of the 2018 IEEE International Conference on High Voltage Engineering and Application (ICHVE), Athens, Greece, 10–13 September 2018; pp. 1–4. [Google Scholar]
- LeCun, Y.; Bottou, L.; Bengio, Y.; Haffner, P. Gradient-based learning applied to document recognition. Proc. IEEE 1998, 86, 2278–2324. [Google Scholar] [CrossRef]
- Li, Y.; Zhang, T.; Shan, C.; Liu, Z. Deep Learning: Mastering Convolutional Neural Network from Beginner; China Machine Press: Beijing, China, 2018. [Google Scholar]
- WIKIPEDIA. Convolutional Neural Network—Wikipedia[EB/OL]. Available online: https://en.wikipedia.org/wiki/Convolutional_neural_network (accessed on 18 February 2019).
- Hochreiter, S.; Schmidhuber, J. Long short-term memory. Neural Comput. 1997, 9, 1735–1780. [Google Scholar] [CrossRef]
- Gers, F.A.; Schraudolph, N.N.; Schmidhuber, J. Learning Precise Timing with LSTM Recurrent Network. J. Mach. Learn. Res. 2003, 3, 115–143. [Google Scholar]
- Sundermeyer, M.; Ney, H.; Schlüter, R. From Feedforward to Recurrent LSTM Neural Networks for Language Modeling. IEEE/ACM Trans. Audio Speech Lang. Process. 2015, 23, 517–529. [Google Scholar] [CrossRef]
- Zhang, G.; Zhang, X.; Tang, J.; Cheng, H. Study on localization of transformer partial discharge source with planar arrangement UHF sensors based on singular value elimination. AIP Adv. 2018, 8, 1–11. [Google Scholar] [CrossRef]
- Zhang, G.; Zhang, X.; Cheng, H.; Tang, J. Ladder-Wise calculation method for z-coordinate of transformer PD source based on planar layout UHF antenna sensors. IEEJ Trans. Electr. Electr. Eng. 2019, 1–6. [Google Scholar] [CrossRef]


© 2019 by the authors. Licensee MDPI, Basel, Switzerland. This article is an open access article distributed under the terms and conditions of the Creative Commons Attribution (CC BY) license (http://creativecommons.org/licenses/by/4.0/).