Abstract
A horizontal well with hydraulic fractures is key to forming a fracture network in oil shale for the generated hydrocarbon flows. By considering the influence of anisotropic strength, a prediction model is proposed for fracture initiation by studying different fracture initiation modes (FIMs) in oil shale: failure of the intact rock matrix and of the bedding planes. Through a case study on Nong’an oil shale, the influences of wellbore trajectory and bedding planes on the fracture initiation pressure (FIP), location (FIL), and FIM were analyzed and the induced changes in wellbore trajectory design were concluded. The preferred angle between the wellbore axis and the minimum horizontal principal stress was the same of 90° or 270°, when the lowest required FIP corresponded to the failure of the intact rock matrix. However, when the angle corresponded to the failure of the bedding planes, the preferred direction of the wellbore axis was away from the fixed direction and not corresponding to the lowest required FIP due to the fracture morphology. The error between the theoretical and experimental results ranges from 7% to 9%. This research provides a framework for the design of horizontal wellbore trajectories in oil shale, for easier fracture initiation and more complex fracture networks.
1. Introduction
Hydraulic fracturing in the horizontal well is a promising approach to form the fracture network for the generated hydrocarbon flow in the in-situ retorting process [1]. Since the wellbore trajectory and many other factors, such as the in-situ stress regime, rock fabric and its physical properties, perforation parameters and so on [2,3,4,5,6,7], affect the fracture initiation and patterns together, and eventually influence the stimulated reservoir volume (SRV), the change of wellbore trajectory design due to the different fracture initiation mechanism in oil shale should be worked out. For oil shale, the shear slippage along the bedding planes and induced bedding fractures [8,9,10,11,12] indicates that its anisotropic strength contributes mostly to the fracture initiation, and thus changes the design of wellbore trajectory.
The research on the initiation and extension of hydraulic fracture began in the 1950s. Based on the hydraulic fracturing model [13], which was proposed for the prediction of longitudinal fracture initiation, the fracture initiation models [14,15,16,17] for different fracture patterns were improved with regard to the tensile strength, fluid seepage and fracture toughness. Besides, the change in the fracture initiation with well type, the in-situ stress regime, multiple fractures and perforation parameters had been analysed deeply [4,18,19,20,21,22,23]. Hossain et al. [3] estimated the fracture initiation location (FIL) and the orientation and location on the wellbore by developing a generic model for arbitrarily oriented wells. Meanwhile, Crosby et al. [24] modified the Drucker–Prager criterion for single hydraulic fracture initiation to analyse the initiation of transverse fractures in horizontal wells, and verified its accuracy based on experimental results. Liu et al. [20] analysed the fracture initiation mechanism using the tensile failure criterion and determined the laws influencing wellbore location and perforation parameters. These studies were carried out based on the improvement in the fracture initiation model, but it was assumed that the rock was an elastic isotropic medium. This is contrary to the fact that the real rock is anisotropic, as the existence of bedding planes and laminations for sedimentary rocks, foliation and cleavage for metamorphic rocks, and even natural fractures will result in anisotropic strength [25]. Since oil shale is a typical sedimentary rock [9], it is required to establish the fracture initiation model by considering the influence of the anisotropic strength.
Compared with the case of isotropic rocks, the anisotropic strength will influence the changes in the fracture initiation with well type, in-situ stress conditions, and other parameters, which are supported by experiments and analytical models [25,26,27,28]. The change in failure plane due to the anisotropic strength was the first to be analysed by developing two generalisations of the Coulomb–Navier criterion [29]. Then, the change in the fracture initiation pressure (FIP) in shale was carried out by using tensile failure criterion and it was found that the drilling direction of a horizontal well had a higher impact on the FIP than the degree of rock anisotropy (Young’s modulus and Poisson’s ratio) [30]. Tensile failure criterion was also used in the analytical model developed by Zhu et al. [31], to examine the effects of in-situ stress, tensile strength, the degree of rock anisotropy and perforation parameters on fracture initiation. This research revealed that perforation angle had the largest effect on the FIP, followed by in-situ stress, and degree of anisotropy. Further, the numerical model considering the anisotropic elastic deformation and pore hydro-mechanical coupling effects also used tensile failure criterion to optimise the perforation azimuth for complex fracture morphology and study the effects of the degree of anisotropy (Poisson’s ratio and Young’s modulus), different perforation parameters and the in-situ stress on the FIP [32]. Thereafter, an analytical model based on linear fracture mechanics theory with mode I stress intensity was established for a 2D FEDEM (finite element-discrete element method) simulation, which investigated the initiation fracture pattern changing with different perforation geometries and well deviations for both elastic isotropic and anisotropic formations [33]. Previous studies focused on the influence of the degree of anisotropy, but the dip angle and direction of bedding planes were not taken into consideration. In addition, these fracture initiation models lacked the determination in the fracture initiation mode (FIM) and could not estimate the form of bedding fractures, which was unfavored in the stage of fracture initiation for higher SRV [34] as the bedding planes greatly influence the propagation direction of hydraulic fractures [35,36]. Therefore, a fracture initiation model for oil shale should be established to analyse the changes in the FIP, FIL and FIM and the changes in the wellbore trajectory design due to the influence of bedding planes (dip direction and dip angle) for easier hydraulic fracture initiation and fracture complexity.
By considering the bedding planes of oil shale, a fracture initiation model for the horizontal wells was developed to analyse the different wellbore trajectory design due to the influence of bedding planes on the FIP, FIL and FIM. Compared with previous research, Mogi–Coulomb criterion was selected for the failure of the intact rock matrix, with Mohr–Coulomb criterion for shear slippage along the bedding planes and tensile failure criterion for tensile failure across the bedding planes, as discussed in Section 2. Through a case study on Nong’an oil shale in Jilin Province, the influence of bedding planes’ dip angle and direction on the fracture initiation was concluded, and the FIP, FIL, FIM and the initial fracture morphology corresponding to different wellbore trajectories were confirmed. In addition, experiments were carried out on Nong’an oil shale to validate the accuracy of this fracture initiation model.
2. Stress State Around a Horizontal Wellbore in Oil Shale
Oil shales in Jilin Province, China are characterised by shallow buried depths and small thicknesses. The horizontal well is superior on account of its more workable seam and is thus conducive to lowering the production cost. Consequently, this research has focused on the stress state around the horizontal wellbore to analyse hydraulic fracture initiation in horizontal wells of oil shales. With the anisotropic strength of oil shale being induced by its bedding planes, it is first necessary to establish a hydraulic fracturing model of a horizontal well in oil shale. The simplified hydraulic fracturing model is shown in Figure 1, which is developed by ignoring the existence of natural fractures and other factors, and assuming that bedding planes with the same spacing, dip direction and dip angle are distributed in the oil shale. The X-Y-Z coordinate system in this figure refers to the in-situ stress coordinate system, in which (along X) represents the minimum horizontal principal stress, (along Y) represents the maximum horizontal principal stress and (along Z) represents the overburden pressure.
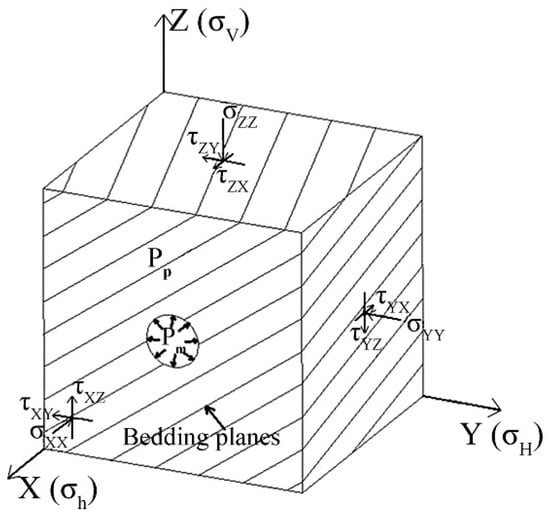
Figure 1.
Hydraulic fracturing model of a horizontal well in the oil shale.
2.1. Failure Mechanism of the Intact Rock Matrix
This study has analysed the failure of oil shales through a comparison of the failures of the intact rock matrix and bedding planes. Through such comparative analysis, the change in the FIM of oil shale with horizontal wellbore trajectory (the drilling direction of a horizontal well) under different bedding planes (dip direction and dip angle) was determined, as well as the FIP and FIL. Consequently, different failure criteria were chosen for different FIMs in the computational formulas for different fracture initiations in oil shale.
2.1.1. Failure Criteria
Based on the lithology of oil shales and previous researches, the appropriate failure criterion for the intact rock matrix was determined. Colmenares and Zoback [37] verified the degree of fitting between the previous polyaxial test data (for Dunham dolomite, Solenhofen limestone, Shirahama Sandstone, Yuubari shale and Amphibolite from the KTB site) and seven different failure criteria, which included Mohr-Coulomb criterion, Mogi–Coulomb criterion, Drucker–Prager failure criterion and so on. Al-Ajmi and Zimmerman [38] estimated the collapse pressure and fracture pressure of Dunham Dolomite and Solenhofen Limestone with Mohr–Coulomb criterion, Mogi–Coulomb criterion and Drucker–Prager failure criterion and carried out a comparative analysis between the calculation results and experimental data. Hashemi et al. [39] also compared the calculation results of the three failure criteria with the results of a self-designed thick-walled hollow cylinder test. According to the above researches, the Mogi–Coulomb criterion proposed by Al-Ajmi and Zimmerman [40] was chosen for the failure of the intact rock matrix, as expressed by Equation (1):
where is the octahedral shear stress and is the mean normal stress, which are defined as:
where the parameters a and b are defined as:
in which and are the cohesion and the angle of internal friction of the intact rock matrix, respectively, and , , and represent the first, second and third principal stresses, respectively.
2.1.2. Stress Analysis
In order to analyse the hydraulic fracture initiation of the intact rock matrix, it is first necessary to confirm the stress distribution around the horizontal wellbore. Therefore, we introduced the in-situ stress coordinate system (ICS) and horizontal borehole coordinate system (HCS) to calculate the stress components for the failure criterion of the intact rock matrix. It is assumed that , , are along the North, East and down directions of the global coordinate system (GCS), respectively; thus, we have ignored the difference between the GCS and the ICS for simplified calculation.
In order to determine the stress state around the horizontal wellbore (), the stress state in the ICS is transformed into that in the HCS, as shown in Figure 2. It is assumed that the ICS is defined such that the X axis is along the direction of the minimum horizontal principal stress (), the Y axis is along the direction of the maximum horizontal principal stress () and the Z axis is along the direction of the overburden pressure (). With the angle of being measured from the Z axis to the ZH axis, which is aligned with the axis of the wellbore, and the angle being measured between the X axis and the projection of the XH axis on the X-Y plane, the configuration of the wellbore with respect to the ICS has been defined. Here, refers to the angle between the drilling direction and the minimum horizontal principal stress, and also represents the wellbore trajectory of the horizontal well. The rotation matrix for the transformation of the stress components from the ICS to the HCS is derived by rotating the axes (X-Y-Z) of the ICS by an angle of about the Z axis and by an angle of about the YH axis, as expressed in the following formula:
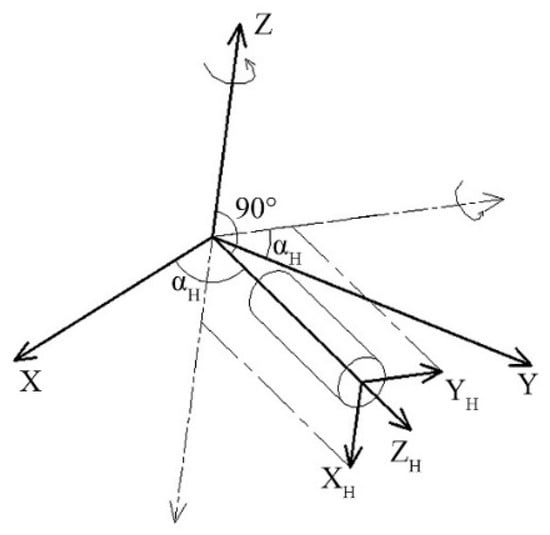
Figure 2.
Transformation of the stress state between the in-situ stress and horizontal borehole coordinate systems.
Figure 2 shows the relationship between the ICS and the HCS, which is used to calculate the stress distribution around a horizontal wellbore. The stress components acting on the horizontal wellbore in the polar coordinate system are calculated using Equation (7), which is stated by Bradely [41] for elastic and homogeneous formations:
where , and are the radial, tangential and axial stresses, respectively; , and are the shear stresses; is the injected hydraulic pressure; is the formation pore-pressure; is Biot’s parameter of the formation; and is Poisson’s ratio of the rock.
By substituting Equation (6), the stress components acting on the horizontal wellbore can be expressed by:
By calculating the eigenvalues of , the principal stresses , and acting at any point on the wellbore have already been confirmed. Further, Zhang et al. [9] and Wang [10] showed that the oil shale in Jilin Province was under the normal faulting stress regime. As this research mainly investigates the Nong’an oil shale in Jilin, , , and can be expressed by:
By using the principal stresses calculated from Equation (9) and the Mogi-Coulomb failure criterion presented in Equation (1), the fracture initiation from the wellbore of the intact rock matrix can be evaluated.
2.2. Failure Mechanism of the Bedding Planes
2.2.1. Failure Criteria
Two failure modes of oil shales are failure of the intact rock matrix and failure of the bedding planes. Therefore, it is necessary to analyse the failure mechanism of the bedding planes. Failure of the bedding planes can be divided into shear slippage along the bedding planes and tensile failure across the bedding planes. The Mohr–Coulomb criterion was selected to describe the shear slippage along the bedding planes, as expressed by Equation (10):
where and are the shear stress and normal stress projected onto the surface of the bedding planes, is the shear strength or cohesion of the bedding planes, and is the coefficient of internal friction of the bedding planes, where:
where is the internal friction angle of the bedding planes, and , are the two shear stress components obtained by projecting onto the surface of the bedding planes.
Meanwhile, the tensile failure criterion was selected for the tensile failure across the bedding planes, which meant that tensile failure occurred when the normal stress on the bedding planes was larger than its tensile strength, as expressed in Equation (12):
where is the tensile strength of the bedding planes.
2.2.2. Stress Analysis
For fractures to initiate from the horizontal wellbore when failure of the bedding planes occurs, it is necessary to transform the stresses acting on the wellbore to stress components which are projected onto the surface of the bedding planes. According to the coordinate system settings of Lee et al. [42], we introduced the bedding plane coordinate system (BCS) and polar coordinate system (PCS). This paper assumes that the GCS completely coincides with the ICS, which makes no difference to the calculation of the stress components acting on the bedding planes [42].
Figure 3 was drawn to show the transformation of the stress components acting on the wellbore in the PCS to the stress components in the corresponding rectangular HCS.
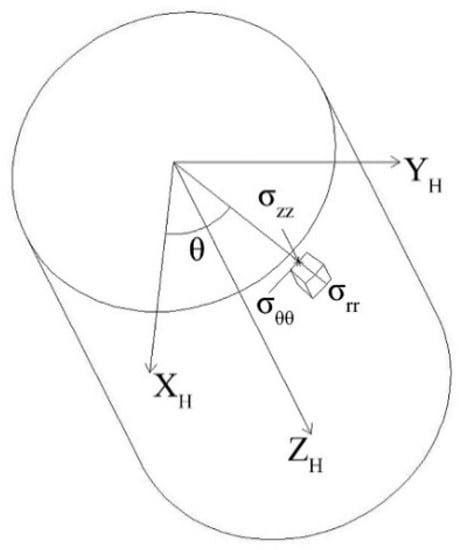
Figure 3.
The stress components acting on the wellbore.
In Section 2.1.2, Figure 2 shows the relationship between the HCS and the ICS. For the stress components acting on the bedding planes, the relationship of the stress components between the BCS and the ICS has to be established, as shown in Figure 4. With the angle () being measured from the X axis to the projection of the XB axis on the horizontal plane and the angle being measured from the XB axis to the horizontal plane, the normal direction in line with the XB axis has been confirmed, as well as the bedding planes. The rotation matrix for the transformation of the stress components from the ICS to the BCS is derived by rotating the axes (X-Y-Z) of the ICS by an angle of about the Z axis and then rotating the axes (X’-YB-Z) by an angle of about the YB axis, which can be expressed by:
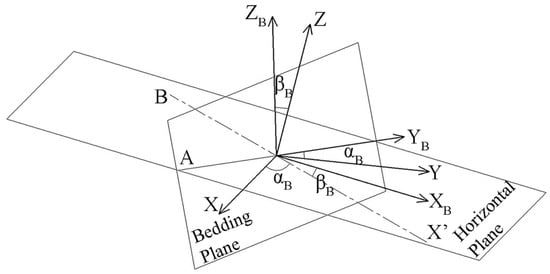
Figure 4.
Relationship between the bedding plane and in-situ stress coordinate systems.
From Equations (6), (14), and (16), the shear stress and normal stress projected onto the surface of the bedding planes can be expressed in the form of Equations (17) and (18):
Then, by using the failure criteria for shear failure along the bedding planes and tensile failure across the bedding planes, the fracture initiation of the bedding planes from the wellbore can be evaluated.
3. Hydraulic Fracture Initiation Analysis of a Horizontal Well in Nong’an Oil Shale
It is well-known that oil shales in Jilin Province show the prominent feature of shallow buried depth, such as the oil shale 70 m underground in Nong’an and the oil shale 400 m underground in Fu’yu. From 2013 to 2015, Jilin University carried out geological investigation, hydraulic fracturing and in-situ exploration pilot tests on Nong’an oil shale. Based on these researches, the conditions of occurrence and mechanical parameters of Nong’an oil shale have been obtained, as shown in Table 1 [9,10].

Table 1.
Physical and mechanical properties of Nong’an oil shale.
By considering the fracture initiation model developed in the Section 2, an example checking calculation about Nong’an oil shale was conducted, to record the FIP and FIL when failure of the intact rock matrix or bedding planes occurred. By setting different bedding planes (different and ), the influence of bedding planes on the hydraulic fracture initiation, which included the changes in the FIP, FIL, and FIM, was concluded, and the optimum horizontal wellbore trajectory for lower FIP and better initial fracture morphology was discussed.
3.1. Fracture Initiation of the Intact Rock Matrix
Combining Equations (1) and (9), the FIP at every point of a horizontal wellbore can be calculated when failure of the intact rock matrix occurs; this can be used to analyse the changes in the FIP and FIL as the drilling direction () varies. As can be seen from Equation (8), the stress distribution on the wellbore has a direct relation with the angle , which represents the location on the wellbore. At the point or on the wellbore, the tangential and axial stresses reach the minimum values, whereas they are maximum at the point or . Consequently, with the increase in the injected hydraulic pressure (), () decreases gradually, and eventually exceeds the ultimate strength of the rock. Thus, failure of the intact rock matrix is observed in the form of hydraulic fracturing.
By analysing the formula used for predicting the failure of the intact rock matrix, the angle () between the drilling direction of the horizontal well and the minimum horizontal principal stress was found to be the main factor, which was irrelevant in the case of the bedding planes. Consequently, Figure 5 was drawn with the FIP at every point on the wellbore under different drilling directions when failure of the intact rock matrix occurred.
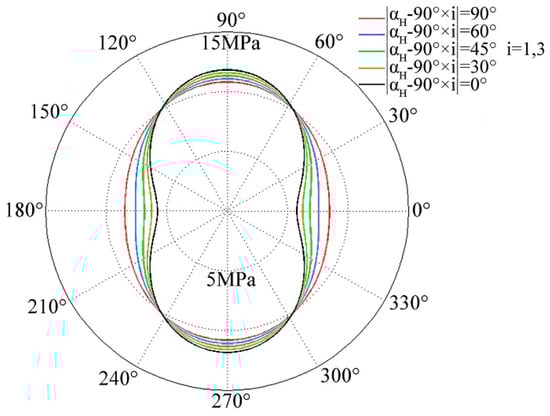
Figure 5.
Fracture initiation pressures around the wellbore of the intact rock matrix for different horizontal wellbore drilling directions. The different colors (red, violet, green, dark yellow and black) represent different drilling directions (, , , and ), respectively.
In Figure 5, the points (,) in the curves correspond to the point on the wellbore at which the FIP of the intact rock matrix is equal to MPa. The FIPs on the wellbore are minimum at the point or , irrespective of the value of . In other words, the change in the drilling direction only influenced the FIP, and not the FIL, as the FIL was at or on the wellbore. When () was kept the same, which meant that the angle between the drilling direction and the minimum horizontal principal stress was constant, the FIP curves on the wellbore were identical. With the decrease in , the FIP at or decreased, while the fracture initiation region increased, as shown in Figure 5.
Because the FIL of the intact rock matrix was at the point or , Figure 6 was drawn for the FIP at or for different drilling directions. This figure shows that the FIP of the intact rock matrix reaches the maximum value () for or and the minimum value () for or . Consequently, with the decrease in the angle between the drilling direction of the horizontal well and the maximum horizontal principal stress, the FIP of the intact rock matrix decreased.
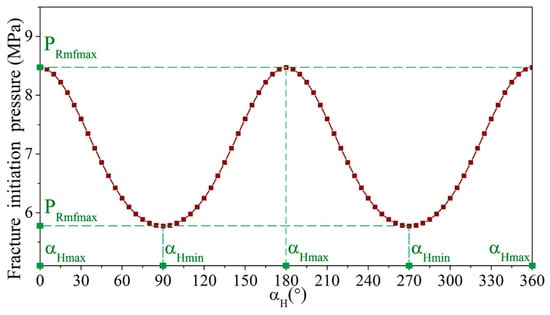
Figure 6.
Variation in fracture initiation pressure at the point θ = 0° or 180° on the wellbore of the intact rock matrix with drilling direction.
3.2. Fracture Initiation of the Bedding Planes
The existence of bedding planes suggests that there are two different FIMs (failures of the intact rock matrix and bedding planes). Further, failure of the bedding planes implies shear failure along the bedding planes and tensile failure across the bedding planes. In this section, the FIP and FIL of the bedding planes have been calculated, as discussed in Section 2 with Mohr–Coulomb criterion for shear failure along the bedding planes and tensile failure criterion for tensile failure across the bedding planes.
The change in the FIP at every point of the wellbore was drawn to simplify the fracture initiation analysis. Figure 7 displays the FIPs on the wellbore () of the bedding planes with , or and . In Figure 7a, the point A (50, 8.880) corresponds to that the FIP at the point on the wellbore is equal to 8.880 MPa with , and . Besides, the lowest point of each curve in Figure 7 represents the FIP and FIL of the bedding planes.
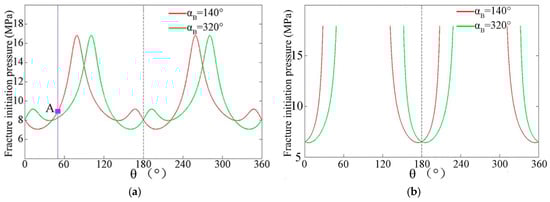
Figure 7.
Fracture initiation pressure of the bedding planes with = 20°, = 140° or 320°, = 10° for (a) shear slippage along the bedding planes and (b) tensile failure of the bedding planes.
(1) Based on analysis of the curve, Figure 7 reveals that the FIPs on the wellbore apparently exhibit periodic characteristics. The FIP at the point is equal to that at the point . Consequently, there are two lowest points ((, ) and (, )) for each curve, which means that there are two FILs on the wellbore with the FIP of . As a result, this study only analysed the FILs in the range −90–90° on the wellbore.
(2) In order to simplify the range of the influencing parameters, specific bedding planes were taken into consideration in Figure 7, which showed that the FIP curves on the wellbore of and were symmetrical and axisymmetric about the axis . The planes share the same FIP and the sum of FILs is equal to . Irrespective of the value of , the FIP curves on the wellbore of and are the same as those of and . Consequently, for fracture initiation analysis of the bedding planes, it was assumed that ranged from to , ranged from to and ranged from to .
3.2.1. FIP of the Bedding Planes
Figure 8 was drawn by utilising the different FIP curves on the wellbore with different , and , to analyse the changes in the FIP of the bedding planes with drilling direction () for different bedding planes. In Figure 8, seven images for different dip angles have been presented in different colors, which represent different , and in different line styles representing different FIMs.
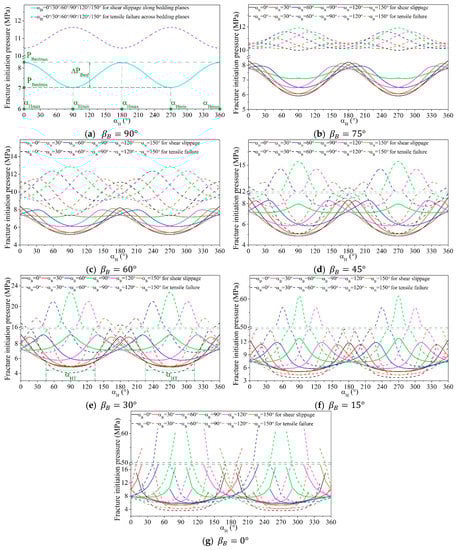
Figure 8.
Variation in fracture initiation pressure of the bedding planes with drilling direction for different bedding planes for the dip angle of (a) 0°, (b) 15°, (c) 30°, (d) 45°, (e) 60°, (f) 75°, (g) 90°. The different colors (black, red, blue, green, magenta and dark yellow) represent different conditions corresponding to = 0°, = 30°, = 60°, = 90°, = 120° and = 150°, respectively. The different line styles (solid and dashed lines) represent the two different fracture initiation modes (shear slippage along the bedding planes and tensile failure across the bedding planes, respectively). Besides, the colors (cyan and violet) represent shear slippage along the bedding planes and tensile failure across the bedding planes when the change of makes no difference to the FIP.
First, the special cases were examined, in which the dip angle of the bedding planes was or . Figure 8a showed that the change in made no difference to the change in the FIP with when the dip angle was equal to (). This was because the bedding planes were parallel to the horizontal plane of the wellbore for , which meant that the spatial relationship between the locations of the bedding planes and horizontal wellbore was not affected by ; therefore, no effect of the change in was observed on the stress state of the bedding planes. For tensile failure across the bedding planes, the FIP reached the maximum value () for or and the minimum value () for or . For shear slippage along the bedding planes, the FIP reached for or and for or . Besides, it was shear slippage which occurred, as its FIP was smaller. Figure 8g revealed that failure of the bedding planes did not occur when was equal to or with . This was because the normal direction of the bedding planes was parallel to the axis of the horizontal wellbore, which meant that the normal stress projected onto the surface of the bedding planes was unable to induce failure of the bedding planes. In Wang’s numerical simulation research, this phenomenon can be seen that when the wellbore passes through the weak surface vertically, the bedding planes has very little influence on the FIP [43]. Consequently, failure of the intact rock matrix occurred at the intersection of the bedding planes and horizontal wellbore, which resulted in transverse fractures in this case.
From Figure 8b to Figure 8f ( or ), the change in the FIP with was analysed. When ranged from to , moved outward from or (right for and left for ). The smaller the values of and , the larger would be the extent of the movement. On the other hand, when was equal to , for shear slippage was equal to or with small (such as ). For tensile failure, when was equal to or , and remained constant, irrespective of the value of . When decreased from to , changed (decreased for and increased for ) less than and changed (decreased for and increased for ) less than with the decrease in . Moreover, the changes in and were concentrated in the range of . In other words, the trend of the variation in the FIP with for tensile failure was mainly affected by . The change in had little influence on the trend, and the smaller the , the lower would be its influence. For shear slippage, when was equal to , and remained constant, irrespective of the value of . When ranged from to , changed (increased for and decreased for ) less than and changed (increased for and decreased for ) less than with the decrease in . The larger the and the smaller the , the lower would be the change in and . However, when was equal to , turned from or to or (sudden change), whereas changed from or to or (gradual change), with the decrease in . Consequently, the trend of the variation in the FIP with for shear slippage was also mainly affected by and the smaller the , the lower would be its influence. Moreover, the trend was affected by ; the larger the , the greater would be its influence. Particularly, when was small enough and large, the trend was more controlled by , which led to the sudden change in and gradual change in . It can be concluded that for fracture initiation analysis of the bedding planes, the drilling direction () corresponding to the minimum FIP is mainly affected by the dip direction of the bedding planes, while the dip angle has little influence. On the other hand, when the normal direction of the bedding planes is nearly parallel to the maximum horizontal principal stress and the dip angle is quite small, the drilling direction corresponding to the minimum FIP is more influenced by the dip angle.
Bedding planes not only change the trend of the variation in the FIP with , but also influence the FIP. Consequently, and mainly contribute to the differences in and , while and are the main factors influencing the FIP. The previous research, which found the angle of a horizontal well with the principal stresses had a higher impact on the FIP than the rock anisotropy [30], and the experimental research about the influence of bedding plane angle on the FIP [44] also proved this observation. In Figure 8, the difference between and () changed much more with than with . When changed from 7 to 1, the FIP of shear slippage ranged from 5–9 MPa to 5–14 MPa, while that of tensile failure ranged from 9–12 MPa to 3–70 MPa. It was obvious that influenced the FIP of the bedding planes more than and that tensile failure across the bedding planes was more sensitive. For tensile failure, when ranged from to , increased with the increase in and . When decreased, increased with the increase in and decrease in . For shear slippage, was affected by more than by , and gradually increased with the decrease in . With the decrease in , gradually decreased when was quite large, which decreased first and then increased when was quite small. Meanwhile, was affected more by than by , and gradually increased with the decrease in . With the decrease in , gradually decreased when was quite large, which decreased first and then increased when was quite small.
The influence of the bedding planes on both the trend of the variation in the FIP with and its minimum and maximum values led to changes in the FIM with . For Nong’an oil shale, the change in the FIM with of the bedding planes is shown in Figure 8. When was large enough (from Figure 8a to Figure 8d), shear failure along the bedding planes occurred, irrespective of the values of and . When became smaller (from Figure 8e to Figure 8g), there were cases with ( was around ), in which tensile failure occurred with the increase in the injected hydraulic pressure. Moreover, with the decrease in , the range of decreased. However, the existence of an inflection point (), which could be seen in Figure 8e, suggested that when was less than , there were no cases with . Meanwhile, increased with the decrease in . It can be concluded that has a greater influence than on the FIM of the bedding planes and should therefore be the priority factor in FIM analysis. The influence of reveals that the closer the normal direction of the bedding planes and the direction of minimum horizontal principal stress, the smaller would be the range of , with the precondition that is small enough.
3.2.2. Fracture Initiation Location of the Bedding Planes
When failure of the intact rock matrix occurred, the FIL was at the point or on the wellbore, as discussed in Section 3.1. This section analyses the change in the FIL when failure of the bedding planes occurs. Figure 9 shows the change in the FIL (from to ) with for different bedding planes.
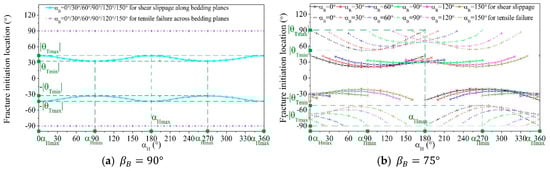
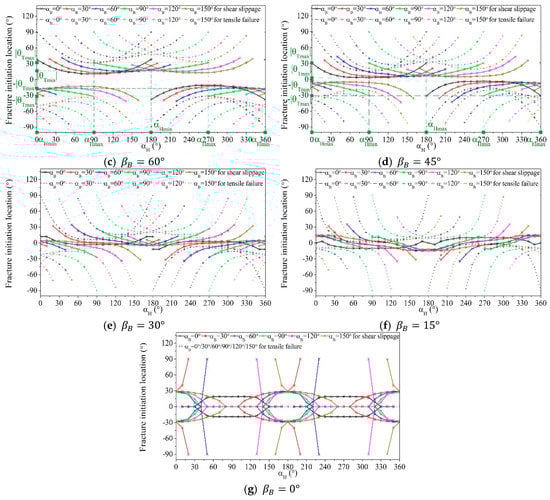
Figure 9.
Variation in fracture initiation location (−90°–90°) of the bedding planes with drilling direction for different bedding planes for the dip angle of (a) 0°, (b) 15°, (c) 30°, (d) 45°, (e) 60°, (f) 75°, (g) 90°. The different colors (black, red, blue, green, magenta and dark yellow) represent different conditions corresponding to = 0°, = 30°, = 60°, = 90°, = 120° and = 150°, respectively. The different line styles (solid and dotted lines) represent different fracture initiation modes (shear slippage along the bedding planes and tensile failure across the bedding planes, respectively). Besides, the colors (cyan and violet) represent shear slippage along the bedding planes and tensile failure across the bedding planes when the change of makes no difference to the FIL.
Figure 9 shows the FILs of both tensile failure across the bedding planes and shear slippage along the bedding planes. For tensile failure, when was equal to , made no difference to the FIL (). When was not equal to or , the absolute value of the FIL () reached the maximum of with , and reached the minimum of with , as shown in Figure 9b. The smaller the and the larger the , the smaller would be () and the larger would be the range of the FIL (). When was equal to , the FIL remained the same as or . Consequently, the FIL of tensile failure was in the range and on the wellbore. With the increase in and decrease in , the range of the FIL gradually shrank with or as the centre. Further, there were only two initiation points, which in general deviated from or in the cases with . For shear slippage, when was equal to , made no difference to the FIL (), and four initiation points was on the wellbore, as shown in Figure 9a. When was equal to , the change in the FIL was so great that was equal to , while was equal to , except for the case with . Further, when was not equal to or , there were four initiation points. When was not equal to or , with the decrease in , and gradually decreased until . reached the maximum of with four initiation points when was equal to , as shown in Figure 9d. The and mentioned above referred to those in Figure 8 corresponding to and . Particularly, when was equal to , there exhibited with or and with or , as shown in Figure 9c. In Section 3.2.1, it was revealed that when was equal to , of shear slippage changed from or to or with the decrease in . Consequently, the influence of on the FIP was larger than that on the FIL, as the corresponding to and displayed no change with the decrease in when was equal to .
Bedding planes change the phenomenon that the FIL of hydraulic fracturing is at the point or on the wellbore. This phenomenon could be observed in Hou’s experimental researches, in which there is a deflection of the FIL away from the points or [45]. Moreover, for shear slippage along the bedding planes, there is a proper drilling direction which changes the number of initiation points for the FIL from two to four. The trend of the variation in the FIL with is mainly influenced by . Further, the change in also contributes to the difference in the trend of the variation in the FIL with , though the influence is smaller than that on the trend of the variation in the FIP with . The larger the , the greater is the deviation in the FIL from or . Generally, the dip angle is the main factor influencing the deviation in the FIL from or .
3.3. Fracture Initiation and Horizontal Wellbore Design for Nong’an Oil Shale
3.3.1. Influence of the Bedding Planes on Fracture Initiation
Hydraulic fracture initiation in oil shale has two different modes: failure of the intact rock matrix and failure of the bedding planes, and three different failure criteria are used to evaluate the FIP of the intact rock matrix, tensile failure across the bedding planes and shear slippage along the bedding planes. When the hydraulic pressure reaches the minimum FIP of the three FIMs, hydraulic fracture initiates. Consequently, through fracture initiation analysis of the intact rock matrix and bedding planes in Section 3.2, the influences of (), () and () on FIP were studied, as reported in the following sections. Figure 10 was plotted to confirm the relative priorities of the three FIMs for different bedding planes of Nong’an oil shale.
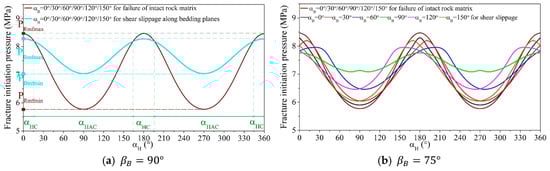
Figure 10.
Variation in fracture initiation pressure of Nong’an oil shale with drilling direction for different bedding planes for the dip angle of (a) 0°, (b) 15°, (c) 30°, (d) 45°, (e) 60°, (f) 75°, (g) 90°. The wine solid line represents failure of the intact rock matrix. The two different line styles (solid and dashed lines) with different colors (black, red, blue, green, magenta and dark yellow) represent shear slippage along the bedding planes and tensile failure across the bedding planes with = 0°, = 30°, = 60°, = 90°, = 120° and = 150°, respectively. Besides, the color cyan represents shear slippage along the bedding planes when the change of makes no difference to the FIP.
From previous discussion, it was obvious that the FIP of the intact rock matrix did not exhibit any relationship with the bedding planes and that the FIP of the bedding planes would not be affected by for . Figure 10 displays the FIP of the intact rock matrix in the form of black solid lines, and the different line styles (solid and dashed lines) with different colors (red, green, blue, orange, magenta and dark yellow) represent shear slippage along the bedding planes and tensile failure across the bedding planes for different . In Figure 10g, the excessively large calculation results of the FIPs were ignored for better observation.
At the moment the increasing hydraulic pressure reaches the minimum FIP, hydraulic fracture initiates. As shown in Figure 10a, fracture initiation of the bedding planes occurs for , while that of the intact rock matrix occurs for . Moreover, the possibility of shear slippage along the bedding planes was higher for Nong’an oil shale when failure of the bedding planes occurred. With the decrease in , tensile failure across the bedding planes gradually occurred, as observed in Figure 10 in the form of dashed lines. Moreover, when decreased, the range of (for which tensile failure across the bedding planes occurred) decreased as well. For better analysis of the change in the FIM, the FIP relationship between the intact rock matrix and the bedding planes was divided into four types, based on the variations in their maximum and minimum FIPs (, , and ) with : (I): and ; (II): and ; (III): and ; (IV): and .
(1) Four different FIP relationships for different FIMs with different bedding planes and drilling directions
In the cases with any in Figure 10a,b, or in Figure 10c,d, the FIP relationship belonged to type I. The distribution of was centred on or only for or . With the decrease in (), the centre point of the distribution was closer to or and the distribution range would be smaller. Besides, with the decrease in , the distribution range became larger. In particular, the change in the FIP with for different FIMs showed the same trend in Figure 10a, leading to the result that the distribution of was centred on or .
In the cases with or in Figure 10c and in Figure 10d, the FIP relationship belonged to type II. revealed two different distributions. One was that varied from to , which meant that failure of the bedding planes occurred in any drilling direction. The other was that was distributed on both sides of (corresponding to ) of the bedding planes. This was because with the decrease in , of the bedding planes showed the tendency to move outward from or , which led to the possibility that around of the bedding planes, the FIP of the intact rock matrix was lower. Consequently, the smaller the values of and , the more likely would be the occurrence of the second distribution with a wider distribution of .
In the cases with in Figure 10d, or in Figure 10e–g, the FIP relationship belonged to type III. The distribution of exhibited a similar trend as the second distribution of type II. In other words, was distributed on both sides of of the bedding planes. The distribution range of increased with the decrease in and .
In the cases with or in Figure 10e–g, the FIP relationship belonged to type IV. The distribution of was centred on or only for . With the decrease in (), the centre point of the distribution was closer to or , and the distribution range was smaller. Moreover, the distribution range of increased with the decrease in and increase in .
(2) Influence of bedding planes on the FIP, FIL and FIM of oil shale
The existence of proves that bedding planes greatly change the FIP of oil shale. Without the bedding planes, the FIP of the intact rock matrix reached the maximum for or and the minimum for or . Besides, fracture initiated at the point or on the wellbore. However, when the influence of bedding planes is considered, hydraulic fractures can initiate through two different modes (failure of the intact rock matrix and failure of the bedding planes). The change in the FIP with drilling direction becomes different from the rock without regard to the bedding planes, as does the change in the FIL. When was equal to , failure of the bedding planes occurred, with lower FIPs and different FILs, which did not correspond to or , as shown in Figure 9 and Figure 10. The distribution range and interval length of were controlled by the relationship between , , , and . Consequently, bedding planes not only reduce the FIP, but also change the FIL.
The influence of bedding planes on FIP is mainly determined by the effect of and on the trend of the variation in the FIP with the drilling direction, which leads to the difference in the relationships between , , and . Consequently, the distributions of and change for different bedding planes (different and ). From an analysis of the FIP curves, it was found that irrespective of the value of , was larger than for small . However, when was large enough, was larger than first and then lesser than with the decrease in . Consequently, there existed an inflection point . It was for , which changed from to for as decreased with the decrease in .
In the cases with , the FIP relationship was type I and type IV. The transformation between two FIP relationships was mainly attributed to the influence of on . As increased with the decrease in , the relationship changed from to . Consequently, there was an inflection point . It was for and for . With the decrease in , the inflection point decreased. The distribution of in the cases of type I and type IV was around or . Therefore, the relationship between and had a small effect on the distribution of , and mainly affected the interval length.
In the cases with , the FIP relationship was type I, type II and type III. The transformation from type I to type II was mainly attributed to the change in , which decreased with the decrease in and eventually became lower than . In the cases of type I, was mainly distributed around or , with affecting the central point of its distribution and changing its interval length. In the cases of type II, mainly distributed around of the bedding planes, with affecting the central point of its distribution and changing its interval length. The distributions of and almost interchanged in this transformation. The transformation from type II to type III was mainly attributed to the change in , which increased with the decrease in , varying from to . There also existed an inflection point . It was for and for . With the decrease in , the inflection point decreased. In the cases of type II and type III, was mainly distributed around of the bedding planes. For cases with some specific bedding planes, failure of the bedding planes occurred in any drilling direction, such as the case with or in Figure 10c. In this transformation, mainly a change in the interval length was observed. Consequently, the two transformations revealed that the relationship between and was the main reason for the change in the distribution, which was controlled by and . According to FIP analysis of the bedding planes in the earlier section, it was found that was more affected by , while was more affected by . Consequently, was the main factor influencing the distribution of . In the analysis on oil shale hydraulic fracturing, the dip direction is the first parameter to confirm the main region of and , and the dip angle mainly controls the interval length.
3.3.2. Influence of the Bedding Planes on the Design of Horizontal Wellbore Trajectory
Bedding planes changed the trend of the variation in the FIP with drilling direction, as well as the maximum and minimum FIPs and the corresponding FIMs. Consequently, for hydraulic fracturing in oil shale with different bedding planes, the drilling direction and FIM which corresponded to the minimum FIP were different, and the horizontal wellbore trajectory design also needed to be changed. In this section, it was found that the influence of bedding planes on the distribution of and , as well as on the maximum and minimum FIPs, was mainly attributed to the influence on the relationship between , , and , which led to different optimum drilling directions. Consequently, it was necessary to determine the FIP relationship between different FIMs in order to analyse the optimum drilling direction.
For the bedding planes which ensured that the FIP relationship belonged to type I or type IV, the FIP of oil shale reached the minimum value () for or , which referred to of the intact rock matrix. When the drilling direction of the horizontal well corresponded to or , the hydraulic pressure required was the easiest to achieve. In these cases, fractures tended to initiate across the intact rock matrix and extend with the increase in the hydraulic pressure; the preferred initial fracture morphology was transverse fractures.
For the bedding planes which ensured that the FIP relationship belonged to type II or type III, the distribution range of was much more than that of , which meant that the drilling directions for the failure of the bedding planes were much more than those for the failure of the intact rock matrix. Moreover, there were cases with specific bedding planes, in which the failure of the bedding planes occurred in any drilling direction. The decrease in induced an increase in , which gradually became larger than , thus leading to the wider distribution of . The FIP of oil shale reached the minimum value , which referred to of the bedding planes, for (the drilling direction corresponding to ). Moreover, with the decrease in , failure of the bedding planes gradually changed from shear slippage along the bedding planes to tensile failure across the bedding planes, and the larger the the more probable would be tensile failure. Consequently, when the drilling direction of the horizontal well corresponded to (the drilling direction corresponding to ), the hydraulic pressure required was the easiest to achieve. In these cases, fractures tended to initiate along the bedding planes and extend with the increase in the hydraulic pressure; the preferred initial fracture morphology was bedding fractures.
It is well known that hydraulic fractures prefer to activate the weak planes in the propagation of hydraulic fractures, due to their much lower tensile and shear strength [46,47,48]. This could lead to a complex fracture network. However, in the stage of hydraulic fracture initiation, the activation of the bedding planes is unfavored to the complex fracture network and better simulated reservoir volume [24,34]. For the bedding planes which ensure that the FIP relationship belongs to type II or type III, the drilling direction, which corresponds to the minimum FIP (), is more conducive to the formation of bedding fractures than transverse fractures. Consequently, the horizontal well drilling direction needs to be changed for the preferred fracture morphology, which leads to the different optimal directions. If only hydraulic pressure is required, for the bedding planes which ensure that the FIP relationship belongs to type I or type IV, the optimal drilling direction should correspond to or . For the bedding planes which ensure that the FIP relationship belongs to type II or type III, the optimal drilling direction should correspond to (the drilling direction corresponding to ). However, if the transverse fractures are also required, the optimal drilling direction should be kept the same as that for the former cases but changed to that corresponding to the minimum FIP of the intact rock matrix for the latter cases. In the latter cases, the drilling direction was the boundary of the distribution range.
It is worth noting that, although the research above targets Nong’an oil shale, the developed fracture initiation model has broader applicability for the other sedimentary rocks, which shares the same assumptions stated in the first paragraph of the Section 2. As the hydraulic fracture initiates when the injected water pressure reaches the minimum FIP, by calculating the FIPs of different FIMs, the FIP, FIL, FIM, and the initial fracture morphology can be estimated. If we can obtain the accurate physical parameters in Table 1 of the target formation, the hydraulic fracture initiation laws in the formations, as well as the influence of bedding planes, can be analysed as well.
3.4. Experimental Validation
To validate the developed fracture initiation model, experiments on Nong’an oil shale were carried out. In this section, the experimental equipment, the preparation of samples and the test procedure are explained briefly.
3.4.1. Experimental Setup and Sample Preparation
The experimental equipment in Figure 11 is used to simulate the hydraulic fracturing in reservoir, consisting of four parts (the true tri-axial assembly, hydraulic pressure unit, high-pressure water pump, and data processing and control system). Cubic blocks of 200 mm are positioned in between the pressurized pistons, which simulate the in-situ stresses in three different directions. These pistons are controlled by the hydraulic cylinders in the tri-axial assembly and powered by the hydraulic pressure unit. In addition, the high-pressure water pump is used to inject the hydraulic fluid into the sealed wellbore to induce the fracture initiation in samples. Via the pressure sensors, the fluctuations in the tri-axial pressure and fluid pressure are recorded in real time by the data processing and control system.

Figure 11.
Hydraulic fracturing experimental equipment.
The 200 mm cube samples were prepared using the pre-prepared cement and Nong’an oil shale of 100 200 200 mm, as shown in Figure 12. A 120 mm hole of φ 12 mm was drilled at the centre of the samples, and the upper section of the hole (80 mm) was enlarged to φ 16 mm. High-strength adhesive glue was used to seal the simulated wellbore of 14 mm diameter. In addition, in Figure 12 corresponded to that in the fracture initiation model and was set as the variable of , , and in the experiments. The dip direction of bedding planes was set the same of , and the physical and mechanical properties of the oil shale samples were presented in Table 1.
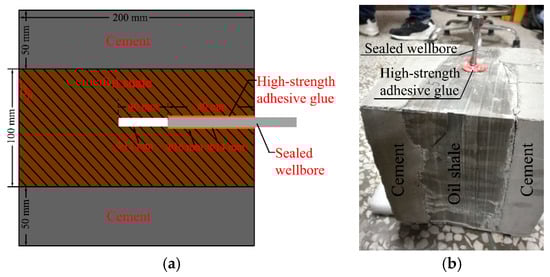
Figure 12.
Samples of oil shale with (a) schematic diagram and (b) real photo.
3.4.2. Test Procedure
Experiments were conducted with the in-situ stresses of MPa, MPa, MPa. Additionally, the simulated wellbore was set in the direction of the maximum horizontal principal stress, which meant that the drilling direction of the horizontal wellbore was along the maximum horizontal principal stress (). The fracturing fluid with a viscosity of 5 mPa/s was pumped into the sealed wellbore at an injection rate of 10 mL/min until a fracture initiated and propagated. The hydraulic pressure was recorded, and the sample was split open along the fracture plane to observe the fracture morphology after the experiments.
3.4.3. Experimental Results
In the calculation of fracture initiation pressure corresponding to the experiments, was set as , and corresponding to the experiments, with the conditions of MPa, MPa, MPa, , , MPa. The theoretical results and the experimental results were shown in Figure 13.
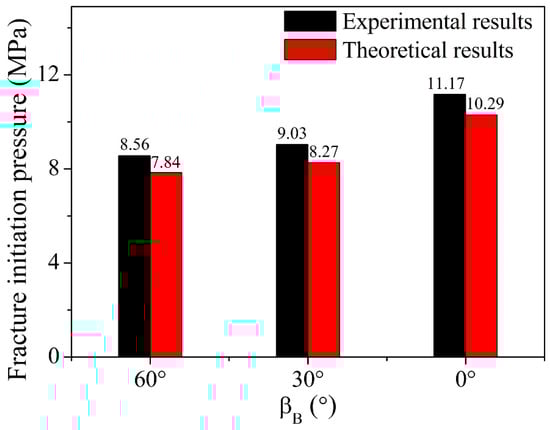
Figure 13.
The comparison between experimental and theoretical results.
Figure 13 presents the theoretical and experimental results of the FIPs under the giving conditions. The error between the theoretical results and the experimental results ranges from 7% to 9%. Since the FIP will increases as the viscosity and injection rate increase when they are at relatively low values [11,48,49], the errors of 7% to 9% may attribute to the giving conditions in the experiments (viscosity of 5 mPa/s and injection rate of 10 mL/min). By comparing the theoretical and experimental results, it can be found that this developed fracture initiation model can predict the fracture initiation pressure in oil shale well. In addition, since the main fracture morphology observed around the sealed wellbore in these experiments was bedding fractures, the fracture morphology for was taken as an example in Figure 14. Figure 14 shows the main fracture plane along bedding planes and the secondary fracture induced by natural fracture. The theoretical results showed that shear slippage along bedding planes occurred under these experimental conditions, which corresponded to the main fracture morphology observed. Although the fracture initiation position in the experiments is hard to be confirmed by observing the fracture morphology, the estimation of the fracture initiation model in the fracture morphology can be validated to some extent.
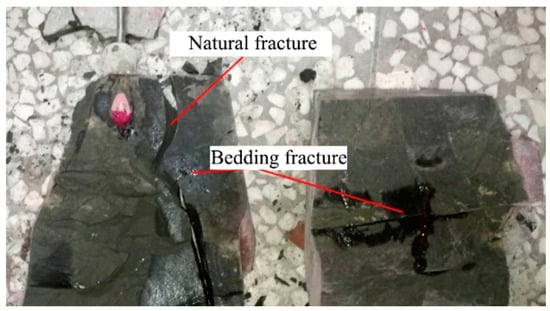
Figure 14.
The observed fracture morphology for .
3.5. Research Prospect
As discussed above, the horizontal wellbore trajectory design in oil shale need to consider the influence of bedding planes, which affects the FIP, FIL and FIM. However, nature fractures distributed in oil shale would make the fracture initiation more complex than what considers in this paper and would make great difference on the fracture propagation as well. In addition, in real world cases, the undulation of wellbore and the local variations in dip in oil shale are inevitable, which require additional optimization on the wellbore trajectory, as the intersection between the bedding planes and the wellbore will be changed. By simplifying the undulation of horizontal wellbore to the intersection change, the calculation results of the preferred wellbore trajectory range for several major bedding planes need to be integrated for fracture complexity and easier fracture initiation. The final wellbore trajectory will induce the multiple fracture initiation, as the injected water pressure is higher than the minimum FIP required for most well sections. Therefore, future work needs to consider the influence of stress shadow effects on the local stress distribution [50] and the influence of natural fractures on the fracture propagation [51,52].
4. Conclusions
This study set different failure criteria for different FIMs of oil shales: failure of the intact rock matrix and failure of the bedding planes (shear slippage along the bedding planes and tensile failure across the bedding planes) to analyse the variation in the FIP and FIL for different FIMs. With a case study on Nong’an oil shale, the changes in the FIP, FIL, FIM, and the wellbore trajectory design due to the influence of bedding planes were discussed. In addition, experiments for the validation of the fracture initiation model were conducted. Through this research, the following conclusions were drawn.
(1) A fracture initiation model, which considers the anisotropic strength induced by bedding planes, has been developed for horizontal wells in oil shale. The error between the theoretical and experimental results for the fracture initiation pressure in Nong’an oil shale ranges from 7% to 9%.
(2) When failure of the intact rock matrix occurred, the FIP reached the minimum value () with the angle between the drilling direction and the minimum horizontal principal stress of or ( or ). When failure of the bedding planes occurred, the trend of the FIP changing with drilling direction was mainly controlled by bedding planes’ dip direction (represented by the angle between the normal direction of the bedding planes and the minimum horizontal principal stress, ), with little effect of dip angle (). The smaller the , the lesser was its influence. Particularly, for small and large , the trend of shear slippage was more affected by . Moreover, both and affected the maximum and minimum FIPs, and was the main influencing factor to which tensile failure was sensitive. Consequently, and were the main factors influencing the FIP, and the optimal design of the horizontal wellbore trajectory in oil shale should take the change in the bedding planes into consideration.
(3) When failure of the intact rock matrix occurred, the FIL was at the point or on the wellbore. On the other hand, when failure of the bedding planes occurred, it was away from the point or . Moreover, the dip direction of the bedding planes was the main factor affecting the trend of the variation in the FIL changing with drilling direction, and the dip angle mainly controlled the degree of deviation. Particularly, when shear slippage along the bedding planes occurred, there existed which turned the two initiation points to four on the wellbore. Consequently, for the anisotropic rock-like oil shale, the FIL changes with the FIM, and is not fixed at or .
(4) For Nong’an oil shale, the bedding planes made a difference to the changes in the FIP, FIL and FIM with drilling direction. Failure of the bedding planes occurred for , while failure of the intact rock matrix occurred for . The optimal design of the horizontal wellbore trajectory revealed two different directions, depending on the purpose. If only hydraulic pressure was required, the optimal drilling direction corresponded to or for the cases with the minimum FIP corresponding to failure of the intact rock matrix, whereas it was (the drilling direction corresponding to ) for the cases with the minimum FIP corresponding to failure of the bedding planes. However, if transverse fractures were also required, the optimal drilling direction was kept the same for the former cases and changed to that corresponding to the minimum FIP of the intact rock matrix, which was the boundary of the distribution range, for the latter cases.
In this paper, we mainly completed the research about the change in the design of wellbore trajectory due to the influence of bedding planes on the fracture initiation and calculated the minimum required FIP for different bedding planes and wellbore trajectories. The further researches need to consider the influence of stress shadow effects and natural fractures on the local stress distribution and fracture propagation in oil shale.
Author Contributions
Y.Z. (Ying Zhu) conceived and wrote the paper; H.Z. and D.P. analysed the data; L.Z. and Y.Z. (Ying Zhang) contributed analysis tools; S.G. designed the experiments and analysed the experimental data; C.C. proposed the theory. All authors have read and agreed to the published version of the manuscript.
Funding
This work was supported by the Chinese National Natural Science Foundation (No. 41876218 and No. 41672361), the Ministry of Land and Resources of China (No. 201311041), the Scientific and Technological Development Program of Jilin Province (No. 20170414044GH and No. 20160204011SF), the Provincial and School Co-construction project (No. SXGJSF2017-5) and the Program for JLU Science and Technology Innovative Research Team (No. 2017TD-24).
Acknowledgments
The authors also thank Pavel Talalay and anonymous reviewers for fruitful discussion and useful comments.
Conflicts of Interest
The authors declare no conflicts of interest.
Nomenclature
| the minimum horizontal principal stress, MPa (X, Y and Z) | |
| the maximum horizontal principal stress, MPa (X, Y and Z) | |
| the overburden pressure, MPa (X, Y and Z) | |
| the octahedral shear stress, MPa | |
| the mean normal stress, MPa | |
| the first principal stresses, MPa | |
| the second principal stresses, MPa | |
| the third principal stresses, MPa | |
| the cohesion of the intact rock matrix, MPa | |
| the angle of internal friction of the intact rock matrix, ° | |
| the angle between the drilling direction and the minimum horizontal principal stress, ° | |
| , , , , , | normal and shear stresses in the horizontal borehole coordinate system, MPa (XH, YH and ZH) |
| , , | the radial, tangential and axial stresses in the polar coordinate system, MPa (r, θ and z) |
| , , | the shear stresses in the polar coordinate system, MPa (r, θ and z) |
| the injected hydraulic pressure, MPa | |
| the formation pore-pressure, MPa | |
| Biot’s parameter | |
| Poisson’s ratio | |
| , | the shear stress and normal stress projected onto the surface of the bedding planes, MPa |
| the shear strength or cohesion of the bedding planes, MPa | |
| the coefficient of internal friction of the bedding planes | |
| the internal friction angle of the bedding planes, ° | |
| the angle between the projection of the normal direction of the bedding planes on the – plane and the minimum horizontal principal stress, ° | |
| the angle between the normal direction of the bedding planes and the – plane, ° | |
| , , , , , | normal and shear stresses in the bedding plane coordinate system, MPa (XB, YB and ZB) |
| the tensile strength of the bedding planes, MPa | |
| the location on the wellbore, ° |
References
- Mukherjee, H.; Economides, M.J. A Parametric Comparison of Horizontal and Vertical Well Performance. SPE Form. Eval. 1991, 6, 209–216. [Google Scholar] [CrossRef]
- Fallahzadeh, S.H.; Rasouli, V.; Sarmadivaleh, M. An Investigation of Hydraulic Fracturing Initiation and Near-Wellbore Propagation from Perforated Boreholes in Tight Formations. Rock Mech. Rock Eng. 2014, 48, 573–584. [Google Scholar] [CrossRef]
- Hossain, M.M.; Rahman, M.K.; Rahman, S.S. Hydraulic fracture initiation and propagation: Roles of wellbore trajectory, perforation and stress regimes. J. Pet. Sci. Eng. 2000, 27, 129–149. [Google Scholar] [CrossRef]
- Zhu, H.; Deng, J.; Jin, X.; Hu, L.; Luo, B. Hydraulic Fracture Initiation and Propagation from Wellbore with Oriented Perforation. Rock Mech. Rock Eng. 2014, 48, 585–601. [Google Scholar] [CrossRef]
- Lei, X.; Zhang, S.; Xu, G.; Zou, Y. Impact of Perforation on Hydraulic Fracture Initiation and Extension in Tight Natural Gas Reservoirs. Energy Technol. 2015, 3, 618–624. [Google Scholar] [CrossRef]
- Zhao, X.; Ju, Y.; Yang, Y.; Su, S.; Gong, W. Impact of hydraulic perforation on fracture initiation and propagation in shale rocks. Sci. China Technol. Sci. 2016, 59, 756–762. [Google Scholar] [CrossRef]
- Guo, T.; Liu, B.; Qu, Z.; Gong, D.; Xin, L. Study on Initiation Mechanisms of Hydraulic Fracture Guided by Vertical Multi-radial Boreholes. Rock Mech. Rock Eng. 2017, 50, 1767–1785. [Google Scholar] [CrossRef]
- Carpenter, H.C. Fracturing oil shale for in situ retorting experiments. AIChE J. 1976, 72, 1–13. [Google Scholar]
- Zhang, Q.; Chen, C.; Yan, X.C.; Liu, X.P. Physical And Mechanical Parameters Of Borehole Hydraulic Mining Of Nong’an Oil Shale. Oil Shale 2012, 29, 237. [Google Scholar]
- Wang, W. Numerical Simulation and Experimental Research on the Oil Shale Hydraulic Fracturing. Ph.D. Thesis, Jilin University, Changchun, China, 2014. [Google Scholar]
- Gao, S. Study on Crack and Extension Mechanism of Oil Shale Hydraulic Fracturing in Horizontal Well. Ph.D. Thesis, Jilin University, Changchun, China, 2017. [Google Scholar]
- Chen, C.; Gao, S.; Sun, Y.; Guo, W.; Li, Q. Research on Underground Dynamic Fluid Pressure Balance in the Process of Oil Shale In-Situ Fracturing-Nitrogen Injection Exploitation. J. Energy Resour. Technol. 2017, 139, 032908. [Google Scholar] [CrossRef]
- Hubbert, M.K.; Willis, D.G. Mechanics of Hydraulic Fracturing. Pet. Trans. AIME 1957, 210, 153–166. [Google Scholar]
- Anderson, R.A.; Ingram, D.S.; Zanier, A.M. Determining Fracture Pressure Gradients from Well Logs. J. Pet. Technol. 1973, 25, 1259–1268. [Google Scholar] [CrossRef]
- Daines, S.R. Prediction of Fracture Pressures for Wildcat Wells. Int. J. Rock Mech. Min. Sci. Geomech. Abstr. 1982, 34, 863–872. [Google Scholar] [CrossRef]
- Eaton, B.A. Fracture Gradient Prediction and Its Application in Oilfield Operations. J. Pet. Technol. 1969, 21, 1353–1360. [Google Scholar] [CrossRef]
- Mathews, W.R.; Kelly, J. How to predict formation pressure and fracture gradient from electric and sonic logs. Oil Gas J. 1967, 65, 92–106. [Google Scholar]
- Huang, J.; Griffiths, D.V.; Wong, S.-W. Initiation pressure, location and orientation of hydraulic fracture. Int. J. Rock Mech. Min. Sci. 2012, 49, 59–67. [Google Scholar] [CrossRef]
- Lecampion, B.; Desroches, J. Simultaneous initiation and growth of multiple radial hydraulic fractures from a horizontal wellbore. J. Mech. Phys. Solids 2015, 82, 235–258. [Google Scholar] [CrossRef]
- Liu, H.; Lan, Z.; Wang, S.; Xu, J.; Zhao, C. Hydraulic fracture initiation mechanism in the definite plane perforating technology of horizontal well. Pet. Explor. Dev. 2015, 42, 869–875. [Google Scholar] [CrossRef]
- Lv, Z.; He, S.; Gu, D.; Zhang, H. Hydraulic Fracture Initiation while Staged Fracturing for Horizontal Wells. In Proceedings of the 6th International Petroleum Technology Conference (IPTC 6), Beijing, China, 26–28 March 2013. [Google Scholar]
- Zeng, F.; Cheng, X.; Guo, J.; Chen, Z.; Xiang, J. Investigation of the initiation pressure and fracture geometry of fractured deviated wells. J. Pet. Sci. Eng. 2018, 165, 412–427. [Google Scholar] [CrossRef]
- Zhao, J.; Chen, X.; Li, Y.; Fu, B. Simulation of simultaneous propagation of multiple hydraulic fractures in horizontal wells. J. Pet. Sci. Eng. 2016, 147, 788–800. [Google Scholar] [CrossRef]
- Crosby, D.G.; Rahman, M.M.; Rahman, M.K.; Rahman, S.S. Single and multiple transverse fracture initiation from horizontal wells. Journal of Petroleum Science and Engineering. J. Pet. Sci. Eng. 2002, 35, 191–204. [Google Scholar] [CrossRef]
- Ismael, M.A.; Imam, H.F.; El-Shayeb, Y. A simplified approach to directly consider intact rock anisotropy in Hoek–Brown failure criterion. J. Rock Mech. Geotech. Eng. 2014, 6, 486–492. [Google Scholar] [CrossRef]
- Bagheripour, M.H.; Rahgozar, R.; Pashnesaz, H.; Malekinejad, M. A complement to Hoek-Brown failure criterion for strength prediction in anisotropic rock. Geomech. Eng. 2011, 3, 61–81. [Google Scholar] [CrossRef]
- Hou, B.; Chen, M.; Wang, Z.; Yuan, J.; Liu, M. Hydraulic fracture initiation theory for a horizontal well in a coal seam. Pet. Sci. 2013, 10, 219–225. [Google Scholar] [CrossRef]
- Lee, Y.-K.; Pietruszczak, S. Application of critical plane approach to the prediction of strength anisotropy in transversely isotropic rock masses. Int. J. Rock Mech. Min. Sci. 2008, 45, 513–523. [Google Scholar] [CrossRef]
- Jaeger, J.C. Shear Failure of Anistropic Rocks. Geol. Mag. 1960, 97, 65–72. [Google Scholar] [CrossRef]
- Serajian, V. A Study of Hydraulic Fracturing Initiation in Transversely Isotropic Rocks. Ph.D. Thesis, Texas A&M University, College Station, TX, USA, 2011. [Google Scholar]
- Zhu, H.; Guo, J.; Zhao, X.; Lu, Q.; Luo, B.; Feng, Y.C. Hydraulic fracture initiation pressure of anisotropic shale gas reservoirs. Geomech. Eng. 2014, 7, 403–430. [Google Scholar] [CrossRef]
- Li, Y.; Liu, G.; Li, J.; Yu, L.; Zhang, T.; Lu, J. Improving fracture initiation predictions of a horizontal wellbore in laminated anisotropy shales. J. Nat. Gas Sci. Eng. 2015, 24, 390–399. [Google Scholar] [CrossRef]
- Li, H.; Zou, Y.S.; Liu, S.; Liu, G.Q.; Jing, Y.Z.; Ehlig-Economides, C.A. Prediction of Fracture Initiation Pressure and Fracture Geometries in Elastic Isotropic and Anisotropic Formations. Rock Mech. Rock Eng. 2016, 50, 705–717. [Google Scholar] [CrossRef]
- Fan, T.; Zhang, G.; Cui, J. The impact of cleats on hydraulic fracture initiation and propagation in coal seams. Pet. Sci. 2014, 11, 532–539. [Google Scholar] [CrossRef]
- Taleghani, A.D.; Gonzalez-Chavez, M.; Yu, H.; Asala, H. Numerical simulation of hydraulic fracture propagation in naturally fractured formations using the cohesive zone model. J. Pet. Sci. Eng. 2018, 165, 42–57. [Google Scholar] [CrossRef]
- Zhou, J.; Jin, Y.; Chen, M. Experimental investigation of hydraulic fracturing in random naturally fractured blocks. Int. J. Rock Mech. Min. Sci. 2010, 47, 1193–1199. [Google Scholar] [CrossRef]
- Colmenares, L.B.; Zoback, M. A statistical evaluation of rock failure criteria constrained by polyaxial test data for five different rocks. Int. J. Rock Mech. Min. Sci. 2002, 39, 695–729. [Google Scholar] [CrossRef]
- Al-Ajmi, A.M.; Zimmerman, R.W. Stability analysis of vertical boreholes using the Mogi–Coulomb failure criterion. Int. J. Rock Mech. Min. Sci. 2006, 43, 1200–1211. [Google Scholar] [CrossRef]
- Hashemi, S.S.; Taheri, A.; Melkoumian, N. Shear failure analysis of a shallow depth unsupported borehole drilled through poorly cemented granular rock. Eng. Geol. 2014, 183, 39–52. [Google Scholar] [CrossRef]
- Al-Ajmi, A.M.; Zimmerman, R.W. Relation between the Mogi and the Coulomb failure criteria. Int. J. Rock Mech. Min. Sci. 2005, 42, 431–439. [Google Scholar] [CrossRef]
- Bradely, W.B. Failure of Inclined Boreholes. J. Energy Resour. Technol. 1979, 101, 232. [Google Scholar] [CrossRef]
- Lee, H.; Ong, S.H.; Azeemuddin, M.; Goodman, H. A wellbore stability model for formations with anisotropic rock strengths. J. Pet. Sci. Eng. 2012, 96–97, 109–119. [Google Scholar] [CrossRef]
- Wang, Y.; Liu, X.; Liang, L. The three-dimensional numerical simulation for the effect ofbedding plane and wellbore azimuth on hydraulic fracturing ofhorizontal wells. In Proceedings of the International Field Exploration and Development Conference 2018 (IFEDC 2018), Xi’an, China, 18–20 September 2018. [Google Scholar]
- Lin, C.; He, J.; Li, X.; Wan, X.; Zheng, B. An Experimental Investigation into the Effects of the Anisotropy of Shale on Hydraulic Fracture Propagation. Rock Mech. Rock Eng. 2016, 50, 543–554. [Google Scholar] [CrossRef]
- Hou, B.; Chen, M.; Li, Z.; Wang, Y.; Diao, C. Propagation area evaluation of hydraulic fracture networks in shale gas reservoirs. Pet. Explor. Dev. 2014, 41, 833–838. [Google Scholar] [CrossRef]
- Behnia, M.; Goshtasbi, K.; Marji, M.F.; Golshani, A. Numerical simulation of crack propagation in layered formations. Arab. J. Geosci. 2013, 7, 2729–2737. [Google Scholar] [CrossRef]
- Peng, C. Mechanism of Interaction between Hydraulic Fractures and Weak Plane in Layered Shale. Pet. Drill. Tech. 2014, 84, 181–196. [Google Scholar]
- Ning, L.; Shicheng, Z.; Yushi, Z.; Xinfang, M.; Shan, W.; Yinuo, Z. Experimental Analysis of Hydraulic Fracture Growth and Acoustic Emission Response in a Layered Formation. Rock Mech. Rock Eng. 2017, 51, 1047–1062. [Google Scholar] [CrossRef]
- Zhang, R.; Hou, B.; Han, H.; Fan, M.; Chen, M. Experimental investigation on fracture morphology in laminated shale formation by hydraulic fracturing. J. Pet. Sci. Eng. 2019, 177, 442–451. [Google Scholar] [CrossRef]
- Siddhamshetty, P.; Wu, K.; Kwon, J.S.-I. Modeling and Control of Proppant Distribution of Multistage Hydraulic Fracturing in Horizontal Shale Wells. Ind. Eng. Chem. Res. 2019, 58, 3159–3169. [Google Scholar] [CrossRef]
- Li, J.; Dong, S.; Hua, W.; Li, X.; Pan, X. Numerical Investigation of Hydraulic Fracture Propagation Based on Cohesive Zone Model in Naturally Fractured Formations. Processes 2019, 7, 28. [Google Scholar] [CrossRef]
- Shrivastava, K.; Sharma, M.M. Mechanisms for the Formation of Complex Fracture Networks in Naturally Fractured Rocks. In Proceedings of the SPE Hydraulic Fracturing Technology Conference and Exhibition, The Woodlands, TX, USA, 23–25 January 2018. [Google Scholar]


© 2020 by the authors. Licensee MDPI, Basel, Switzerland. This article is an open access article distributed under the terms and conditions of the Creative Commons Attribution (CC BY) license (http://creativecommons.org/licenses/by/4.0/).