1. Introduction
Climate change due to emission of CO
2 from fossil resources, together with a possible shortage of fossil reserves, has stimulated research on the production of renewable resources for fuels and chemicals. Lignocellulosic biomass, such as wheat straw, forestry residues and grass, is considered as a sustainable resource as it contains renewable carbon, which can be recycled by green plants on earth. Full utilization of such materials can at least partially replace fossil based crude oil and derivatives [
1]. However, as biomass has a low energy density compared to crude oil derivatives, is usually scattered, making collection costly and is structurally and compositionally very diverse, efficient methods for densification of biomass to increase its energy density so as to decrease the cost of transportation is highly imperative [
2].
Fast pyrolysis is a promising technology to convert solid biomass to liquid energy carriers, known as pyrolysis liquids, bio-oil, pyrolysis oils or bio-crude (PO). In the process, small biomass particles (<2 mm) are rapidly heated (>100 °C/s) in the absence of air [
3]. Hot vapors are generated along with a non-condensable gas phase and char. The vapor phase is quickly quenched (1–2 s) to suppress secondary reactions, which reduce the liquid product yields [
4].
Lignocellulosic biomass generally consists of three main building blocks, i.e., cellulose, hemicellulose and lignin [
5]. After pyrolysis and condensation, the lower molecular weight oxygenates are obtained as a complex mixture with sugar and lignin oligomers, together with monomeric compounds such as acids, alcohols, aldehydes, ketones, carbohydrates and phenolics [
3,
6]. The large amounts of these reactive oxygenated components have a negative effect on the product properties of the PO, and limit its direct application as for example a transportation fuel. More specifically, the acids result in a low pH of around 2–3, which causes corrosion in pipe lines and injector for combustion engines [
7]. The presence of reactive oxygenated compounds such as low molecular weight aldehydes and ketones result in reduced storage stability [
8] and coke formation upon heating due to polymerization of mainly the carbonyl-containing components such as the sugars [
2,
9]. Associated with this is an increase in molecular weight (MW) and viscosity upon standing [
10]. Upgrading is required to improve properties, and specifically a catalytic hydrotreatment has shown to be a very attractive approach, leading to a product oil with improved product properties and as such a much broader range of possible applications [
11,
12,
13]. The prime objective for hydrotreatment is to remove a substantial amount of bound oxygen from the feed. The exact amount depends on the application, namely, close to quantitative removal when aiming for biofuels in the form of diesel/gasoline substitutes or to a level of about 10% when aiming for co-feeding in an FCC unit. This catalytic processing requires elevated temperatures (80–450 °C), high H
2 pressure (up to 250 bar) and an effective catalyst [
13,
14,
15,
16].
Three distinct classes of catalysts have been reported for the catalytic hydrotreatment of PO. The first group of catalyst comprises of conventional sulfided NiMo and CoMo, usually on γ-Al
2O
3, catalysts, which are also widely used in hydrodesulfurization of crude oil and abundantly available. The second class involves noble based catalysts (Pt, Pd, Ru and Rh on metal oxides and activated carbon), which are known to be efficient and industrially used hydrogenation catalysts. Generally, these catalysts allow operation at low temperature and pressure [
17]. Ru/C showed best performance in terms of oil yield (up to 60 wt.%) and deoxygenation level (up to 90 wt.%) [
15]. However, the high cost of noble metal makes them less attractive. In addition, excessive fouling of the catalyst due to char formation occurs and this leads to plugging of packed bed reactors after a few tens to hundreds of hours [
2,
14]. The last group comprises of non-sulfided B and P promoted catalyst such as Co-Mo-B and Ni-Mo-B catalysts and Ni, Fe, Mo, Co and W based phosphides. Until now, only model compound studies are reported, e.g., hydrodeoxygenation of phenol and cyclopentanone using Ni-Mo-B or Co-Mo-B [
18,
19,
20,
21] and hydro-deoxygenation of guaiacol using metal phosphides [
22], though almost full deoxygenation can be obtained using such catalysts [
14,
23].
Recently, as a further extension on the third group, novel Ni based catalysts, referred to as Picula catalyst, were developed for hydrotreating of PO [
24]. The catalysts are characterized by high metal loadings of nickel (38 to 57 wt.%), promoted with Cu, Pd, Mo and/or a combination thereof and supported on SiO
2 or combination of SiO
2 with other materials (SiO
2-ZrO
2, SiO
2-ZrO
2-La
2O
3 or SiO
2-Al
2O
3). These catalysts showed very good activity and stability for PO hydrotreatment compared to the benchmark Ru/C, merely as polymerization of thermal liable components was suppressed significantly [
25]. However, the molecular composition of PO is very complex and typically sugars based products in the PO react different than the pyrolytic lignins; thus, such catalysts may show different activity for the PS and PL fraction separately. PS and PL fractions are obtained by water addition to the PO, resulting in a water soluble and water insoluble phase. Excess water in the water soluble phase can easily be evaporated, thereby also removing a small amount of the light oxygenates, e.g., formic acid, acetic acid, methanol and acetol. The resulting syrup-like viscous liquid is known as PS. It mainly consists of decomposition fragments of cellulose and hemicellulose, such as anhydro-sugar monomers, e.g., levoglucosan and glucose, sugar oligomers, together with some low molecular weight acids, alcohols, aldehydes and ketones. The organic and thus water insoluble fraction is referred to as PL [
26]. PL contains the oligomeric molecules from cracking of lignin during fast pyrolysis. It consists of aromatic structures with mainly C-C linkages (β-1 and β-5 linkages, as well as stilbenes, phenyl coumarans) [
27].
In this study, the catalytic performance of a series of Ni based catalysts of the Picula family is reported for the catalytic hydrotreatment of the PS and PL fractions of PO at 350 °C and 120 bar H2 (initial pressure at room temperature) in a batch autoclave. The primary objective of this study is to gain insight into the performance of such Ni based catalysts for catalytic hydrotreatment of individual PS and PL fractions, and mainly to assess the effects of different promoters on the hydro(deoxy)-genation activity. Both feed fractions and the product oils were analyzed by, amongst others, elemental analysis, GPC, TGA, HSQC-NMR and GC × GC-FID. The product properties were used to evaluate the hydrodeoxygenation activity of the different catalysts for the PS and PL fractions. The reactivity of the PS and PL fractions was evaluated based on the molecular composition before and after catalytic hydrotreatment by means of HSQC and GC × GC. Various techniques, including elemental analysis, powder X-Ray diffraction (XRD) and high resolution transmission electron microscopy (HRTEM) were also used for characterization of the catalysts used in this study before and after reaction to gain insights into morphology changes.
2. Experimental Section
2.1. Materials
PS and PL were supplied by the Biomass Technology Group (BTG, Enschede, the Netherlands). They were isolated from PO by water addition, separation of the formed two layers, followed by evaporation; see
Scheme 1 for details.
The water content of the thus obtained PS was reduced by evaporation in a film evaporator at around 80 °C and reduced pressures (100–150 mbar). Although some lighter organic molecules, such as acetic acid, formic acid, methanol and acetol, were co-evaporated as well, their loss was negligible. The isolated yields were about 65 for PS and 35 wt.% for PL (dry basis). Hydrogen, nitrogen and helium were obtained from Linde and were all of analytical grade (>99.99%). Reference gas containing H2, CH4, ethylene, ethane, propylene, propane, CO and CO2 with known composition for gas phase calibration was purchased from Westfalen AG, Münster, Germany. Ru/C (5 wt.% metal loading) was purchased from KaiDa Technology Limited, UK.
2.2. Catalyst Composition
All the catalysts used in this study were of the Picula catalyst family and obtained from batches earlier used for PO hydrotreatment studies [
25]. The catalysts compositions (in oxidized state) are shown in
Table 1. Prior to the experiments, the catalysts were crushed to 25–75 μm and reduced in situ at 350 °C for Ru/C, Ni, Ni-Cu and Ni-Pd catalysts, and 400 °C for Ni-Mo catalyst (see details in
Section 2.3).
2.3. Experimental Procedures
2.3.1. Catalytic Hydrotreatment of the PS and PL Fractions in a Batch Autoclave
Experiments were performed in a Parr autoclave (100 mL). The reactor was loaded with 1.25 g of catalyst (5 wt.% on feed). The catalyst was pre-reduced for 1 h using 20–30 bar H2 at 350 °C (400 °C for Ni-Mo/SiO2-Al2O3, Ni-Mo-Cu/SiO2-Al2O3). The reactor was cooled to 20 °C and 25.0 g of a PS or PL fraction was injected into the reactor using a separate feed vessel. The reactor was flushed with hydrogen gas (10 bar, three times) at room temperature to remove air, and was subsequently pressurized to 120 bar. To start the reaction, the reactor was heated to 350 °C (heating rate of around 10 °C/min). The reactor was kept at 350 °C for 4 h, where after the reactor was cooled to 20 °C. The pressure in the reactor was logged and the gas phase was collected in a gas bag (3 L). The reactor content was transferred to a centrifuge tube and weighed. The liquid product consisted of an aqueous phase and an organic phase. The organic phase was on top of the aqueous phase for experiments using PS over the Ni-Pd, Ni-Pd-Cu and Ni-Mo catalysts. In all other cases, the organic products were the bottom phase. The liquid phases were centrifuged (4500 rpm, 30 min) and the individual phases were weighted. The reactor was thoroughly rinsed with acetone. The acetone was removed by evaporation in dry air, and the product was weighted and added to the organic phase. The solid residues were filtered over a paper filter, washed with acetone and dried at 100 °C until constant weight was reached. The amount of char formed during an experiment was taken as the amounts of solid residue minus the original catalyst intake. The amount of gas phase formed was determined using the ideal gas law by taking the pressure difference in the reactor before and after reaction.
2.3.2. Product Analysis
GC-TCD. The concentrations of H2, CH4, CO, CO2, ethylene, ethane, propylene and propane in the gas phase were quantified using a Hewlett Packard 5890 Series II GC with a CP Porablot Q Al2O3/Na2SO4 column (50 m × 0.5 mm, film thickness 10 μm) and a CP-Molsieve 5 A column (25 m × 0.53 mm, film thickness 50 μm). He was used as the carrier gas. The injector was set at 150 °C, the detector at 90 °C. The following oven temperature profile was used: 40 °C for 2 min, followed by heated to 90 °C with a temperature ramp of 20 °C/min, and finally, 90 °C for 2 min. Before analyzing a gas sample, a reference gas containing H2, CH4, CO, CO2, ethylene, ethane, propylene and propane with known composition was analyzed for peak identification and quantification.
Elemental Analysis for liquids. The C, H, N content of the feeds (PS, PL) and product oils were analyzed using an EuroVector EA3400 Series CHNS-O with acetanilide as the reference. The O content was calculated by the difference. All samples were analyzed in duplicate and the average value is reported.
Heteronuclear Single Quantum Coherence (HSQC) NMR. Spectra were recorded at 25 °C on a Bruker NMR spectrometer (600 MHz). For sample preparation, approximately 150 mg of the feeds (PL, PS) and product oils were dissolved in dimethylsulfoxide-d6 (DMSO, 0.6 mL). 1H-13C HSQC spectra were acquired using a standard pulse sequence with a spectral width of 160 ppm. Sixteen scans with 256 increments in the F1 dimension were recorded. The data were processed using the MestReNova software.
Water Content. The water content of the feeds (PL, PS) and product oils was determined by Karl-Fischer titration using a Metrohm 702 SM Titrino titration set-up. The sample (0.01 g) was injected in the glass chamber containing Hydranal solvent (Riedel de Haen). Hydranal titrant 5 (Riedel de Haen) was used as the titrant, Mili-Q water was used to calibrate device. All analyses were carried out in triplicate and the average value is reported.
Gel Permeation Chromatography (GPC). Molecular weight distributions of feeds and product oils were determined using an Agilent HPLC 1100 system equipped with three mixed type E columns in series (length 300 mm, internal diameter 7.5 mm) and a refractive index detector. Tetrahydrofuran (THF) was used as the mobile phase. Before analysis, the sample (0.05 g) was dissolved in THF (5 mL, 10 mg/mL), toluene (2 drops) was added to serve as a flow marker and subsequently the sample was filtered (syringe filter, pore size 0.2 µm) before injection. Polystyrene standards with different molecular weights were used for calibration.
Thermogravimetric Analysis (TGA). Thermal stability of feeds (PL, PS) and product oils were determined by TGA (TGA 7 from Perkin-Elmer). The samples were heated from 20 to 900 °C under N2 with a temperature ramp of 10 °C/min. The TG residue was defined as the residue obtained after heating the sample to 900 °C.
Two-Dimensional Gas Chromatography (GC × GC). Product oils from PL experiments were analyzed using GC × GC-FID. Analyses were performed using a trace GC × GC from Interscience equipped with a cryogenic trap system, an FID detector and two columns (RTX-1701 capillary column (30 m × 0.25 mm i.d. and a 0.25 μm film) connected to a Rxi-5Sil MS column (120 cm × 0.15 mm i.d. and a 0.15 μm film). A dual jet modulator using carbon dioxide was used to trap the samples. He was used as the carrier gas at a flow of 0.6 mL min
−1. The injector and FID temperature were set at 250 °C. The following oven temperature profile was used: 40 °C for 5 min, heating to 250 °C at a rate of 3 °C min
−1. The pressure was set at 70 kPa (40 °C), the modulation time was 6 s. The samples were diluted with tetrahydrofuran (THF) before injection. Di-n-butyl ether (DBE, 500 ppm) was used as an internal standard. Detailed calibration and quantification procedures are given in References [
28,
29,
30].
2.4. Catalyst Characterization
Three typical catalysts include Ni monometallic, Ni-Cu and Ni-Mo before and after reaction, were characterized using a wide range of techniques. The properties of the spent catalysts after hydrotreating the PS and PL fraction were compared with spent catalysts obtained from the hydrotreatment of PO [
25].
In situ XRD analysis. The catalysts were analyzed both in the oxidized form and after an in situ reduction in a high temperature chamber (XRK-900, Anton Paar, Austria). Reduction was carried out in a flow of pure H
2 (30 cm
3/min). The sample was heated at a rate of 12 °C/min up to the temperature used in actual hydrotreatment experiments (350 °C for Ni/SiO
2-ZrO
2, Ni-Cu/SiO
2-ZrO
2 and 400 °C for Ni-Mo/SiO
2-Al
2O
3, see details in
Section 2.2). The samples were cooled to room temperature under a continuous H
2 flow, after which the XRD patterns were recorded.
Elemental analysis for coke. The elemental composition of the coke deposits on spent catalysts were determined using an Elemental Vario EL Cube analyzer (Elementar Analysen systeme GmbH, Germany). All measurements were carried out at least in triplicate. Prior to analysis, each catalyst was heated in a He flow (99,999% grade, 200 cm3/min) up to 350 °C (400 °C for Ni-Mo catalyst) to remove adsorbed organic species.
Powder X-Ray diffraction (XRD). XRD patterns were recorded on a Bruker D8 Advance (Bruker, Germany) powder diffractometer equipped with a Lynexeye (1D) linear detector. A step scan mode (2θ of 0.05°) with an accumulation time of 5 s using monochromatic CuKα radiation (λ = 1.5418 Å) was applied.
High Resolution Transmission Electron Microscopy (HRTEM). High resolution transmission electron microscope (HRTEM) images were obtained using a JEM-2010 (JEOL Ltd., Japan, lattice-fringe resolution 0.14 nm) and JEM-2200FS (JEOL Ltd., Japan, lattice-fringe resolution 0.1 nm) electron microscopes operated at an accelerating voltage of 200 kV. The STEM HAADF (Scanning Transmission Electron Microscopy with High Angle Annular Dark Field) and BF/HRTEM (Bright Field HRTEM) modes were employed. The samples for the HRTEM study were prepared on a holey carbon film mounted on an aluminum grid.
3. Results and Discussions
The PS fraction, derived from the cellulose and hemicellulose fraction of biomass, is rich in sugar (derived) monomers and oligomers [
26]. The amounts of monomers were determined by HPLC, while the oligomers were first hydrolyzed, and then analyzed by HPLC. The PS fraction contains sugars such as levoglucosan, glucose, mannose/xylose and arabinose. The total amount of detectable C5 and C6 sugars is as high as 33.4 wt.%. Other abundant components detected by HPLC and GC-MS are glycolaldehyde (around 11 wt.%) and small carboxylic acids as acetic acid and propanoic acid (2.5 wt.%). A small amount of ketones (1.4 wt.%) and phenolics (0.4 wt.%) were detected as well, while the water content is around 14.5 wt.% (Karl-Fisher titration). Further details regarding the composition of the PS fraction are given in Reference [
31].
PL contains mainly lignin derived monomers and oligomers [
27]. The main monomers detected by GC × GC-FID [
28,
29,
30,
32,
33] are given in
Table 2.
The total amount of monomers detected by GC is limited (about 10 wt.%), the remainder is of higher molecular weight and non-GC detectable (vide infra).
The elemental composition of the two fractions is given in
Table 3. The PS is more oxygenated and has lower carbon content, due to the presence of highly oxygenated sugar-based compounds.
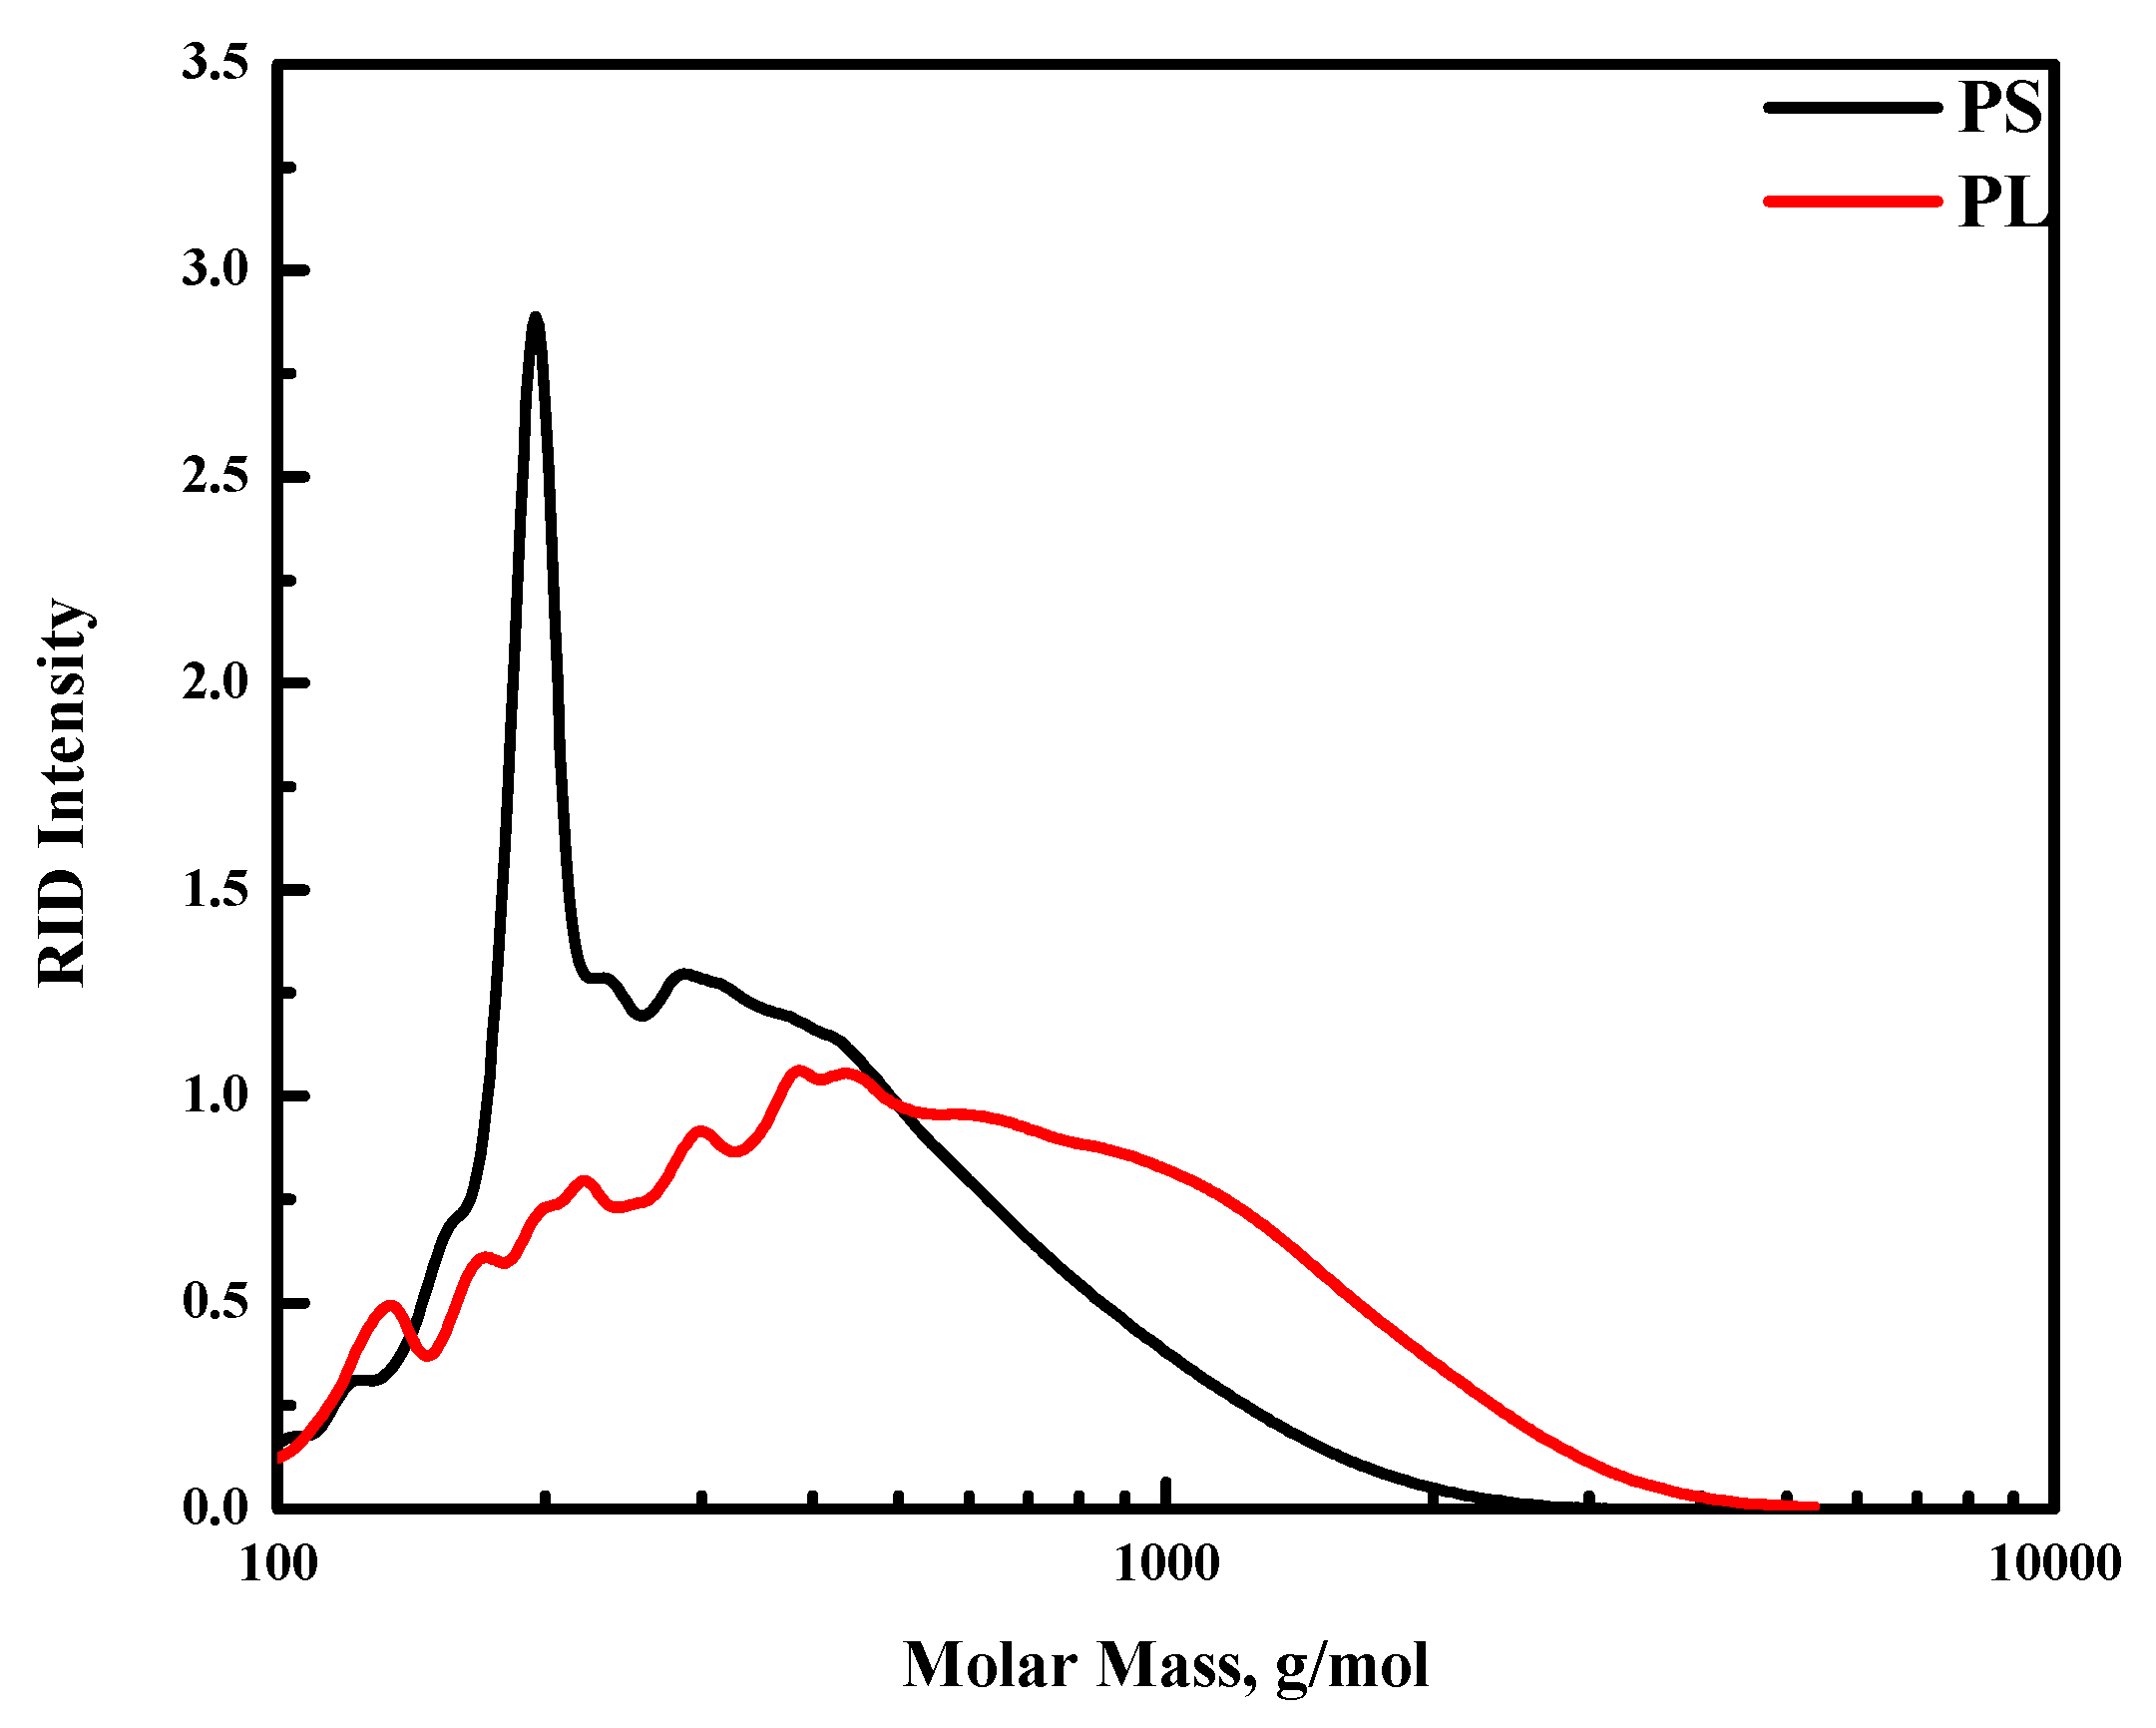
GPC analysis of both fractions confirms the HPLC and GC measurements and shows that the fractions contain large amounts of higher molecular weight fragments (
Figure 1). The average MW of the PS is 425 g/mol, while the PL fraction is considerably higher and about 720 g/mol.
Clear differences between the GPC traces of PS (black line) and PL (red line) are visible. The PS contains a sharp peak at around 200 g/mol, which is assigned to levoglucosan [
34,
35,
36,
37]. In addition, the larger molecular weight tail of this fraction is less extended than that of the PL fraction, indicating that the PS fraction is in general of lower molecular weight than the PL fraction. As such, catalysts for the PL fraction need to have a higher hydrocracking ability than those for the PS fraction.
3.1. Catalytic Hydrotreatment of the PS and PL Fractions
3.1.1. Product Distribution during Catalytic Hydrotreatment of PS and PL Fractions
After the catalytic hydrotreatment, typically four product phases are obtained, a gas phase, two liquid phases (organic and aqueous phase) and a solid phase (spent catalyst with some char). The amounts of the different phases and the composition of the gas phase for all the experiments are tabulated in
Table 4 and
Table 5. Overall, the mass balance closures are up to 80% for PS fraction and 94–97% for PL. Quantitative closure is not achieved, probably due to an error in the determination of the amount of gas phase after reaction and an underestimation of the amounts of C
4 alkanes formed due to analytical issues, hampering quantification of this fraction. In all experiments, less than 1 wt.% of char is formed. Hydrogen consumptions between 240–320 NL/kg feed were observed for both the PS and PL. For all reactions, the gas phase product still contains up than 40 mol.% of hydrogen after reaction, proofing that the reactions were carried out at an excess of hydrogen.
The yields of the organic phase when using PS as the feed is in the range of 36 to 45 wt.%, which is considerably lower than for PL (66 to 74 wt.%). The yields of the aqueous phase are substantially higher for PS compared to PL. This is due to a considerable higher reduction of the oxygen content of the PS feed and product (from 42.8 to 10–15 wt.%) than for PL (from 26.8 to 10–15 wt.% for PL).
The amounts of permanent gases formed during hydrotreatment is slightly higher for PS (7–11 wt.%) compared to that of PL (5–8 wt.%). This is likely due to cracking/hydrocracking reactions of small molecules like acids, aldehydes, ketones, which are present in the PS in significant amounts.
The Ni based catalysts gave slightly higher yields of organic product phases compared to benchmark Ru/C catalyst for the catalytic hydrotreating of PS. For PL, similar products yields were obtained for all catalysts, with a minor preference for the Ni based, Pd promoted catalysts, which showed a slightly high organic yield and a relatively low H2 consumption (probably due to a relatively low methanation activity).
3.1.2. Elemental Composition of the Organic Product Phases
The elemental composition in terms of H/C and O/C ratios (on dry basis) of all organic product phases and the PS, and PL feeds are provided in a so-called Van Krevelen plot, see
Figure 2 for details. The O/C and H/C ratio for the PS feed are considerably higher than for the PL feed. However, after catalytic hydrotreatment, the O/C molar ratio of all the product oils is in a very close range (0.10 to 0.15), indicating that bound oxygen removal for PS is by far higher than for PL, also in line with the amounts of water formed after reaction (vide supra). The data also suggest that an O/C ratio lower than 0.1 is not possible with these catalysts under the prevailing reaction conditions.
Of interest is the general trend that the H/C molar ratio of the product oils from PL is higher than that of the PL feed, indicative for the net addition of hydrogen to the products, for example by hydrogenation reactions. This is not the case for PS, and even a reduction of H/C ratio is found for some catalysts, for example, the product oils from Ni-Pd, Ni-Mo-Cu, Ni-Mo, Ni-Pd-Cu have higher H/C molar ratios, while Ru/C, Ni monometallic and Ni-Cu yielded lower H/C ratio product oils compared to PS feed. This suggests the occurrence of dehydration reactions to a significant extent during hydrotreatment of the PS fraction, whereas the hydrogenation reactions occur with a lower rate. The observations made for PS are in line with those obtained for the catalytic hydrotreatment of PO [
25]: the monometallic Ni catalyst yielded a product oil with lowest H/C ratio and improvements were seen for Cu and Pd promotion. The latter is likely due to the fact that Pd is a good hydrogenation catalyst [
38]. Ni-Mo shows to be the most active catalyst when considering the H/C ratio as an indicator for catalysis [
25]. In contrast, all H/C values of PL products are in a narrow range (1.35 to 1.39), thus differences in catalyst performance of the various catalysts for the PL fraction is limited (
Figure 2c).
3.1.3. Molecular Weight Distribution by GPC
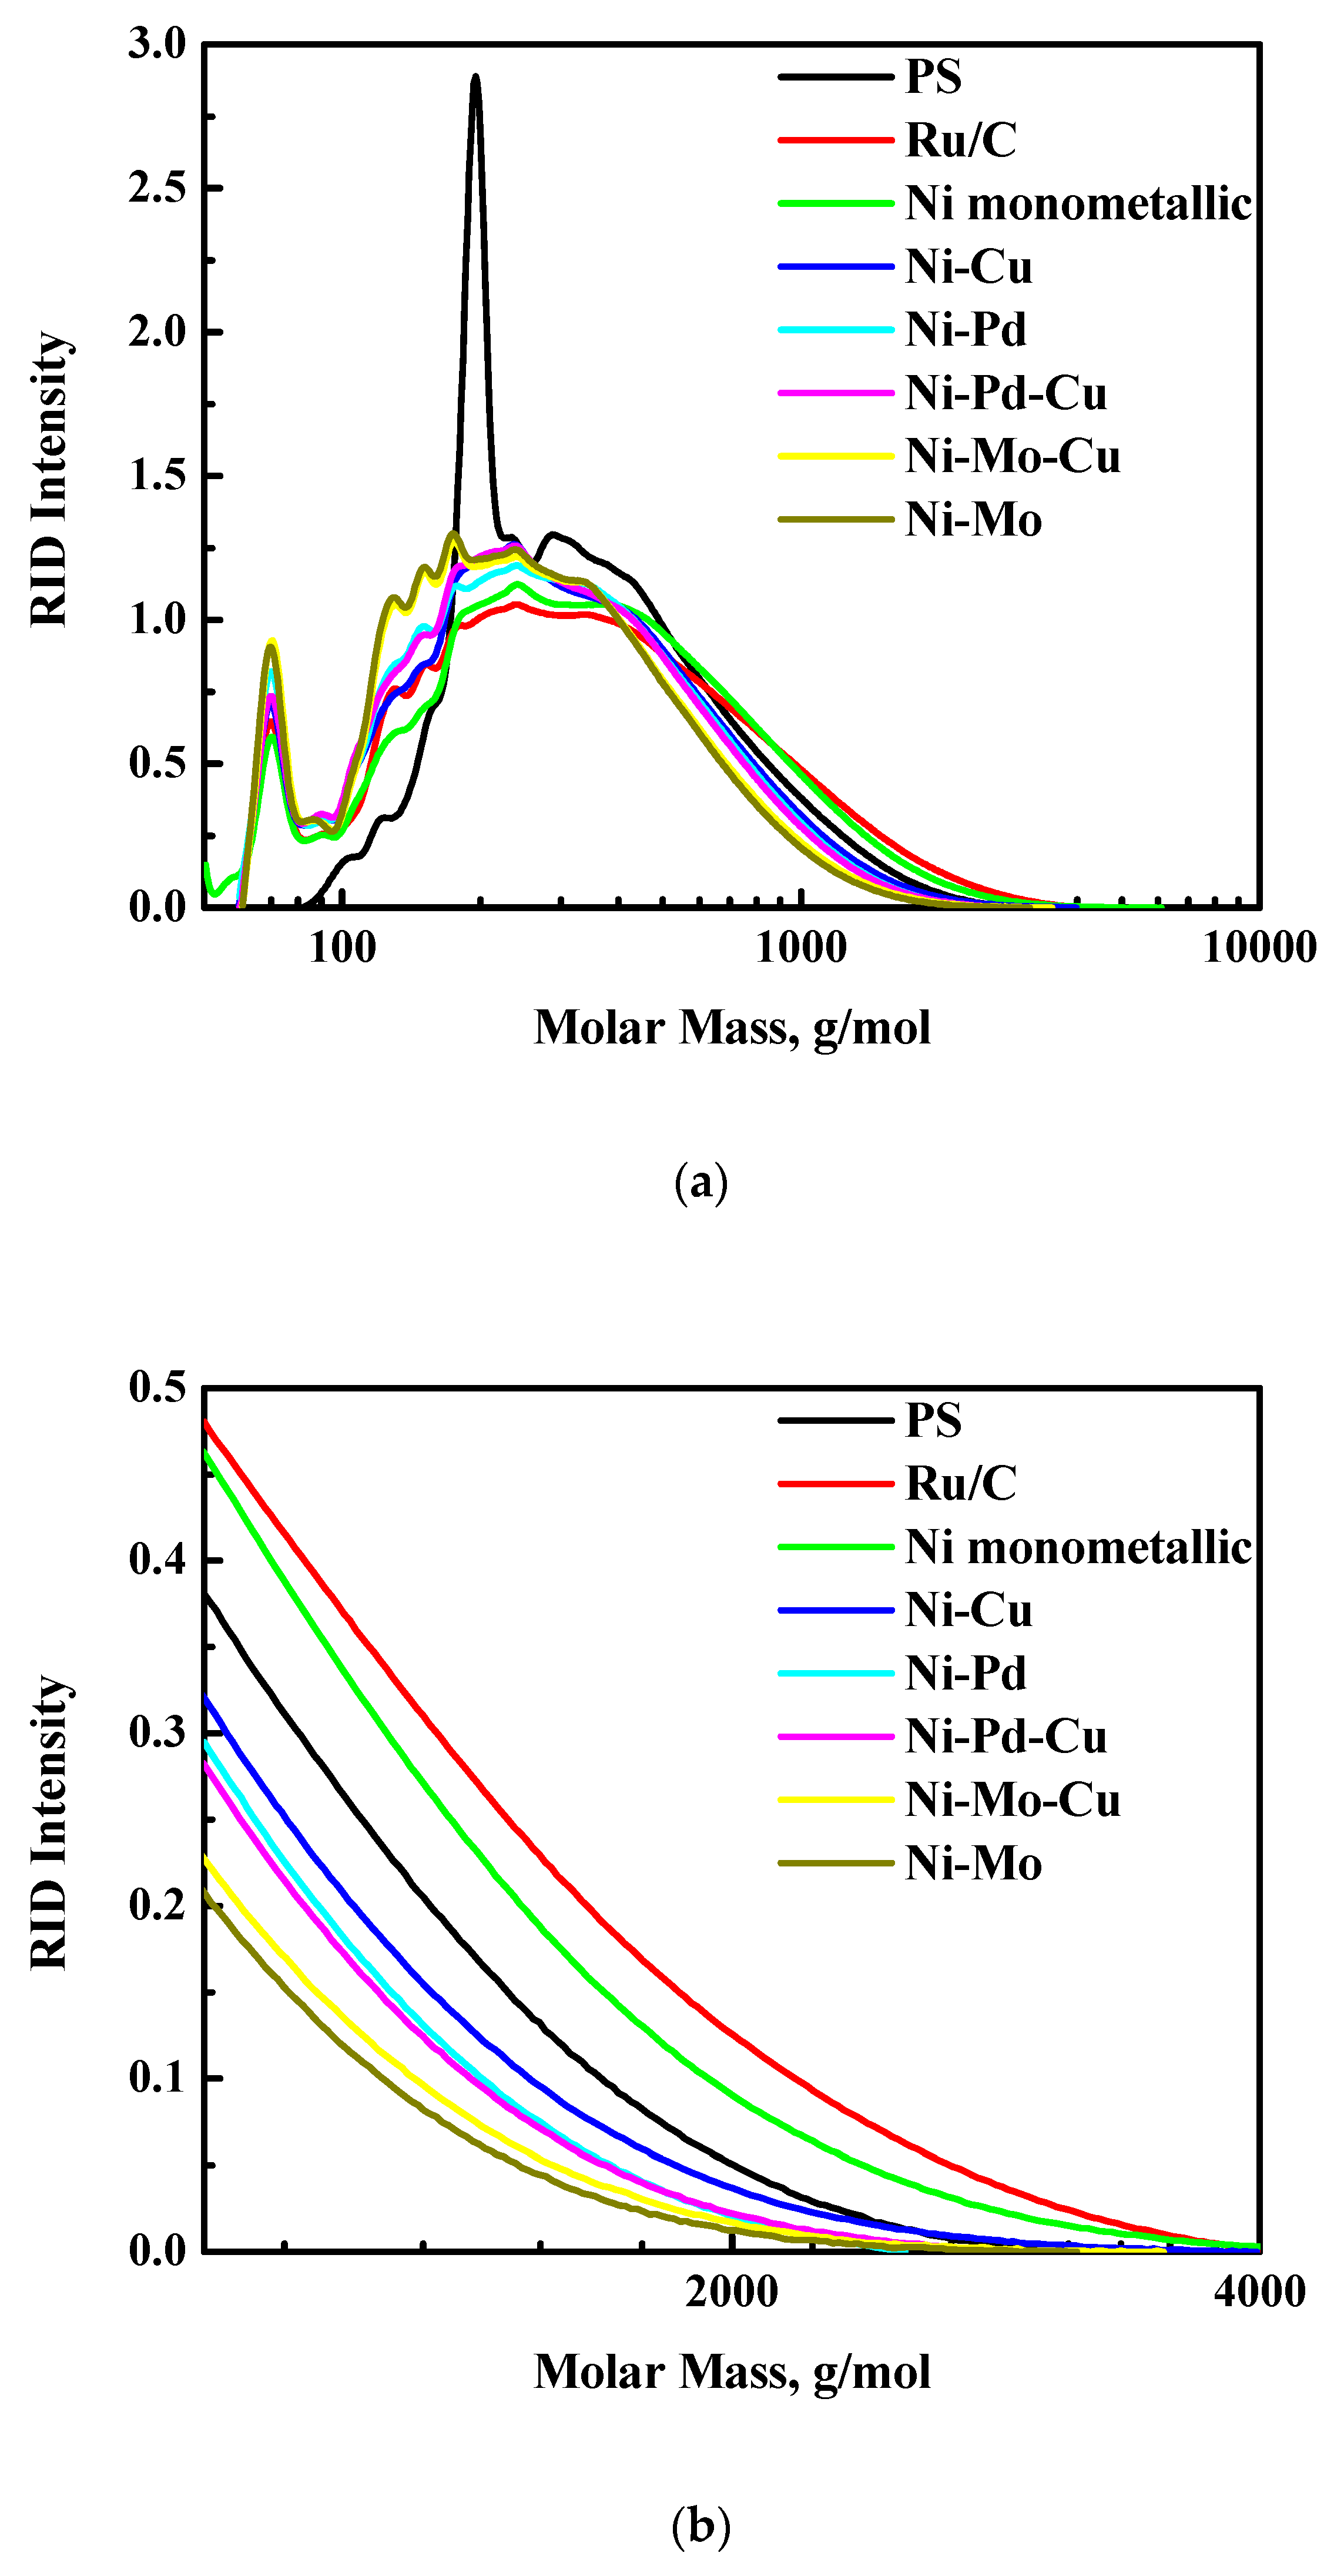
The molecular weight distributions of the PS and PL feed and all product oils obtained from the different catalysts are plotted in
Figure 3.
The average MW of product oils from PS is around 325–450 g/mol; some of them are higher, others are lower than the PS feed (425 g/mol, as shown in
Figure 3a), as evidenced by higher molecular weight tails (
Figure 3b). These results confirm the hypothesis that the PS fraction in the PO undergoes thermal/non-catalytic polymerization and hydrogenation in a parallel mode at low temperatures (e.g., 180 °C) [
31], while hydrocracking reaction leads to low molecular weight compounds formation at high temperatures, see
Figure A1 for details. Such repolymerization reactions result in an increase of the MW of the product oil, as observed for some of the catalysts, the exact amount depending on the rate of polymerisation (thermal, limited effects of catalysts) and catalyst hydro-(deoxy)genation activity (different for each catalyst). For example, for Ru/C and the monometallic Ni catalysts, the molecular weight tails of the product oils are higher than for the PS feed, indicating that the rate of hydrogenation activity is lower than the thermal/non-catalytic polymerization reaction (
Figure 3b). Of interest is also the observation that the original sharp and strong peak of levoglucosan in the GPC traces is absent after a catalytic hydrotreatment at 350 °C for 4 h. It is likely that hydrogenation of levoglucosan to sugar alcohols, mainly sorbitol [
39], occurs, followed by hydrogenolysis to ethylene glycol, propanediols, etc. [
40].
In contrast to PS derived oils, product oils from the PL fraction show rather similar molecular weight distributions. Furthermore, the MW of the product oils are much lower than the PL feed (390–450 versus 720 g/mol), as shown in
Figure 3c, indicative for the occurrence of hydrocracking reactions. Thus, compared to PS, the PL fraction is less prone to repolymerization reactions, even when using the least active Ru/C and monometallic Ni catalysts.
3.1.4. Charring Tendency by TGA
The charring tendency of the product oils is an important aspect to be considered when performing catalytic hydrotreatment of bio-liquids. A higher charring tendency increases the chance for deposition of char on the catalyst surface, ultimately leading to catalyst deactivation. TGA is typically used to determine and quantify charring tendency, and it is considered as a suitable alternative method for the well-known MCRT test widely used in the refinery and petrochemical industry. The TGA results of all product oils are plotted in
Figure 4. The TGA residue at 900 °C is a good indicator for charring and a lower residue is preferred. It is clear from
Figure 4 that the residue of all product oils is lower than those of the PS and PL feed (
Figure 4a,b), implying that the charring tendency of the products is significantly lower than the feeds.
A clear difference in TGA curves for the individual product oils obtained from the PS feed with different catalysts is observed. It appears that the volatility of the product oils from Ru/C and the monometallic Ni catalyst is always lower at a given temperature than the oils obtained from the bi- and trimetallic catalysts. This is probably due to repolymerization of the PS feed with these catalysts, in line with the MW data as shown in
Figure 3a.
The TG residue of the product oils from the PS feed nicely correlates with the H/C ratio (
Figure 4c) and a higher H/C ratio corresponds to a lower TG residue. Again, the Mo promoted catalyst gave the best results and a product oil with the lowest TG residue.
In contrast, the TG curves for PL derived product oils are rather similar even with the least active Ru/C and monometallic Ni catalysts (
Figure 4b). This strong similarity suggests that the Ni based catalysts and Ru/C are equally active in hydrocracking and hydrodeoxygenation. It also implies that repolymerization is not a major issue when hydrotreating the PL fraction.
3.2. Reaction Pathways of the PS and PL Feeds during Catalytic Hydrotreatment
To gain a better understanding regarding the chemistry occurring during the catalytic hydrotreatment of PS and PL, the product oils obtained from reactions using a Ni-Mo catalyst were analyzed by
1H-
13C-HSQC, and GC × GC-FID and the results were compared with the feeds. The assignments of different functional groups in HSQC were made based on either spiking of pure compounds or available literature [
41,
42,
43,
44].
Figure 5 shows the HSQC spectrums derived from PS, PL and the product oils derived over Ni-Mo/SiO
2-Al
2O
3.
The NMR data for PS show the presence of anhydrosugars (e.g., levoglucosan) and carbonyl compounds, as well as some aromatic structures. The latter are likely due to incomplete separation of the PL. For the PL feed, the expected aromatic C-H bonds (i.e., guaiacyl structure) and methoxy groups were observed. After catalytic hydrotreatment of PS, the intensity of aliphatic C-H groups considerably increases at the expense of anhydrosugars and carbonyls. For the PL fraction, a strong reduction in the methoxy group intensities is observed, whereas the intensity and the position of certain peaks in the aliphatic C-H domain changes. These results indicate that PS indeed is very reactive, and is fully converted at 350 °C in 4 h, while the PL is less reactive.
The PL feed and the product oils from PL were analyzed by GC × GC-FID as well, allowing identification and quantification of the various organic product classes (
Figure 6).
Both the PL feed and the product oils consisted mainly of monomeric phenolics (alkylphenols, catechols, guaiacols), aromatic components and hydrocarbons (alkanes and cyclohexanes). The total GC detectable components increased from 10 wt.% for the PL feed to around 20–37 wt.% for the product oils after catalytic hydrotreatment. Details about the composition are shown in
Table 6 and
Figure 7.
The increase in GC detectables upon the catalytic hydrotreatment indicates that part of the PL is converted to low molecular weight GC detectable, in line with the GPC data. It implies that hydrocracking reactions occur to a significant extent, leading to the formation of monomeric compounds. The best catalyst regarding hydrocracking is the Mo promoted Ni catalyst, giving up to 37% of GC detectable. The monomeric fraction consists mainly of alkylphenolics, which are interesting biobased building blocks. As such, it indicates that this catalyst is a promising catalyst for the conversion of PL (and possibly also technical lignins) to alkylphenolics.
3.3. Catalysts Characterization
Three typical spent catalysts (monometallic Ni, Ni-Cu and Ni-Mo) used for the catalytic hydrotreatments of the PS and PL fractions were characterized before and after reaction and compared with the spent catalysts from catalytic hydrotreatments of pure PO under similar conditions. Detailed characterizations of the fresh catalysts are given in Reference [
25]. It was shown that highly dispersed NiO particles are present in the Mo promoted catalyst, while a bimodal size distribution of the NiO particles in both the Ni and Ni-Cu samples was observed. Upon reduction, the NiO species in the Ni-Mo catalyst are reduced to highly dispersed Ni particles.
3.3.1. Coke Deposition on the Catalyst
The catalysts were separated from the liquid phase after the reaction, then washed and dried (
Section 2.3). Subsequently, low molecular weight organics on the solids were removed as much as possible by treating the spent catalysts at elevated temperatures in a flow of inert gas (He) (
Section 2.4). The remaining material (catalysts with coke) was then analyzed by elemental analysis (
Table 7). The data imply that coke formation of the catalyst is highest for PS, intermediate for PO and the lowest for PL. This implies that the PS fraction is most prone to form coke on the catalyst, due to the presence of reactive components such as aldehydes, ketones and carbohydrates, which tend to polymerize under thermal treatment [
45]. The PL is less reactive, though also leads to some coke formation on the catalyst. This could be due to repolymerization of low molecular weight alkylphenolics on the catalyst surface.
Minor differences for the three catalysts were observed. The monometallic Ni catalyst shows a slightly higher coke content after reaction compared to the Ni-Cu and Ni-Mo catalysts, suggesting a positive effect of Cu and Mo promotion regarding coke formation on the catalyst.
3.3.2. X-Ray Diffraction
Fresh catalysts XRD studies were performed for the catalysts in their initial oxidized state followed by analysis after in situ reduction in a diffractometer chamber at conditions specified in
Section 2.4. Data are given in
Table 8 and
Figure 8. The data show that the reduction extent of catalysts decreases in the order Ni-Cu > Ni > Ni-Mo. It is in good agreement with TPR studies [
25]. As such, the Ni-Cu system is more easily reduced compared to the monometallic Ni catalyst. In the case of bimetallic Ni-Cu and Ni-Mo catalysts, the Ni is present mainly in Ni-based solid solutions (Ni*), indicating strong interactions between the two metals in the catalyst formulations.
The decrease of the NiO CSD sizes (based on 111 reflection) for both Ni and Ni-Cu samples after reduction is most likely indicative of a bimodal size distribution of the NiO particles in the catalyst. Thus, the reduction of larger NiO particles into metallic Ni species takes place, whereas the highly dispersed NiO particles remain preserved in the catalyst structure. For the Ni-Mo catalyst, NiO CSD size does not change after reduction. This is an additional evidence that only highly dispersed NiO particles are presented in this catalyst (no bimodal distribution), which was discussed in detail previously [
25].
The XRD patterns of the catalysts recovered after the hydrotreatment reaction with the three different feeds (PO, PS, PL) are given in
Figure 8. The catalysts were washed (acetone) and dried before analysis. It was shown that Ni in the monometallic Ni and bimetallic Ni-Cu catalyst is fully reduced to the metallic state during the hydrotreatment process. Similar observations were made in a previous study [
24], and it is attributed to the promotion of Ni reduction due to the presence of organic species. For the Ni-Mo catalyst, full Ni reduction is not observed and low intensity reflections of unreduced NiO are still present. A possible explanation is the presence of strong Ni-Mo interactions, and close contact between the oxide forms of these metals results in less easy reduction of Ni evidenced as well in our recent studies [
47].
In the case of bimetallic Ni-Cu and Ni-Mo systems, these peaks correspond to Ni-based solid solutions (Ni*) as was observed for the fresh reduced samples (
Table 8). The lattice parameters of metallic Ni for the spent monometallic Ni catalyst is close to that of the fresh reduced one. For the bimetallic Ni-Cu and Ni-Mo catalyst, the Ni lattice parameters are much higher than the reference 3.523 Å [PDF # 040850] for Ni, pointing out the incorporation of Cu and Mo atoms into the nickel lattice and the formation of a solid solution.
Of interest is also the observation that the CSD sizes of metallic Ni is higher for all spent catalysts compared to the fresh reduced ones, indicative for agglomeration of Ni nanoparticles. Interestingly, the level of agglomeration is a function of the feed. For example, the Ni CSD sizes are the lowest for the samples used with PL and the highest when using the PS feed. Apparently, the composition of the feed affects the level of agglomeration of the Ni particles during hydrotreatment. In addition, the support structure changes during the hydrotreatment reaction. The XRD patterns of spent Ni and Ni-Cu catalysts used with PS as the feed (
Figure 8) reveal reflections corresponding to SiO
2 (quartz), ZrO
2 and ZrSiO
4, which are absent in the fresh reduced catalysts. These results indicate that irreversible transformations take place within the catalysts supports, likely due to a negative effect from some specific molecules in the sugar fraction of PO.
The best result regarding catalyst integrity was observed for the bimetallic Ni-Mo catalyst. The average size of metallic Ni* particles was the lowest for this catalyst if compared with Ni monometallic and Ni-Cu systems in the experiments with the corresponding types of feeds. Additionally, changes in the support of the Ni-Mo catalyst after the reaction were minimal, indicating that this catalyst is likely very stable and is a candidate catalyst for further studies in continuous set-ups to study long term catalyst stability.
3.3.3. High Resolution Transmission Electron Microscopy
TEM micrographs were recorded for the freshly reduced and spent samples obtained from hydrotreatment experiments with the PS feed. This feed was selected as the effects of this feed on catalyst structure and morphology were most severe based on the XRD data.
Figure 9 shows TEM images of fresh and spent NiCu/SiO
2-ZrO
2 and NiMo/SiO
2-Al
2O
3 catalysts. For the monometallic Ni/SiO
2-ZrO
2 catalyst the morphology was similar to that of the Ni-Cu catalyst; therefore, it is not presented in
Figure 9 for brevity. A number of TEM images (
Figure 9A–C,E–G) were recorded in a bright field, while micrographs
Figure 9D,H were obtained in a dark field regime.
TEM images of fresh reduced NiCu/SiO
2-ZrO
2 and NiMo/SiO
2-Al
2O
3 catalysts (
Figure 9A,B,E,F) demonstrate the presence of well-defined metallic nickel and NiO particles, in good agreement with the XRD results. For the Ni-Mo catalyst, the Ni nanoparticles have sizes of 2–5 nm, which is in good agreement with the CSD sizes according to XRD (
Table 8). The metallic nickel particles in the fresh reduced Ni-Cu system have larger sizes than found for Ni-Mo. This effect might be associated with Cu induced reduction of nickel as discussed previously [
24].
The TEM images of the spent Ni-Cu and Ni-Mo catalysts reveal that the morphology of the catalysts changes markedly after the hydrotreatment reaction with PS. Well-defined lamellar structures were present in the spent NiCu/SiO2-ZrO2 catalysts, which were absent in the fresh reduced catalyst. TEM-EDX supported by XRD suggest that these structures correspond to ZrO2 and ZrSiO4 phases. Their formation is very likely the result of structural rearrangements taking place in the catalyst support under the impact of reactive feed components (e.g., water, aldehydes, ketones).
In addition, the metallic nanoparticle dispersion changes during reaction. For the Ni-Cu catalyst, the formation of large metallic agglomerates (hundreds nm sizes) was observed due to agglomeration. This is clearly evident from the lower resolution images (
Figure 9C,D) and is in good agreement with the CSD sizes from XRD data (see
Table 8). The use of a dark field (
Figure 9D) revealed the presence of a large number of well-dispersed metallic nanoparticles with sizes less than 5 nm in spent Ni-Cu catalyst, which were not visible in the bright field images (
Figure 9C). All data suggest that the fresh Ni-Cu catalyst has a bimodal size distribution of NiO particles with small and large metal nanoparticles. After reductive activation the NiO particles of larger sizes are reduced to the metallic state, and during the reaction with pyrolytic sugars they further agglomerate. At the same time, highly dispersed small NiO nanoparticles are preserved in the catalyst structure after reductive activation due to their strong interaction with the silica matrix. During hydrotreatment, these nanoparticles are likely reduced into well-dispersed metallic particles visible in the dark field images.
The picture is somewhat different in the case of the spent Ni-Mo catalyst. Here, the majority of the metallic nanoparticles have sizes of about 5 nm, though low resolution images (
Figure 9G,H), show also some larger metallic particles of more than 100 nm size. These findings are also in line with the XRD patterns of spent Ni-Mo catalyst (
Figure 8), showing sharp reflections from larger metallic Ni particles combined with a broad peak from smaller metallic particles (
Figure 9H).
The TEM data (
Figure 9) reveal that the NiMo/SiO
2-Al
2O
3 catalyst shows a lower tendency for nanoparticle agglomeration compared to the NiCu catalyst. This assumption is additionally confirmed by the EDX mapping for the spent NiCu/SiO
2-ZrO
2 and NiMo/SiO
2-Al
2O
3 catalysts (
Figure 10 and
Figure 11, respectively). As is evident from
Figure 11, Mo is uniformly distributed throughout the catalyst, and clearly not localized in Ni rich areas. Localization of Cu in the NiCu/SiO
2-ZrO
2 sample is not possible and thus not provided in
Figure 10, since all catalysts in this study were mounted on copper grids. Nonetheless, the difference between these two catalysts is obvious with respect to the Ni distribution. In the case of the NiCu catalyst, Ni is mainly concentrated in large metallic aggregates, while this is not the case for the NiMo catalyst, where a large amount of Ni is in a well-dispersed state after the reaction.
4. Conclusions
We here report on the catalytic hydrotreatment of the two main fractions of PO (PS and PL) using six Ni based catalysts from the Picula family, promoted by Cu, Pd, Mo or combinations thereof. Remarkable differences in reactivity for the two fractions were observed. The PS fractions is by far more reactive, and thermally rather labile components such as aldehydes, ketones and sugars are converted to the corresponding alcohols, followed by a reduction to hydrocarbons via hydrodeoxygenation reactions. Meanwhile, thermal polymerization also occurs to some extent as a parallel reaction, especially for the least active catalysts, resulting in the formation of higher molecular weight compounds and char deposition on the catalysts. In contrast, hydrotreatment of the PL fraction mainly leads to (hydro-) cracking reactions and the formation of monomeric phenolics and aromatics. Thermal polymerization reactions are hardly observed, implying that the PL fraction is less prone to such reactions compared to the PS fraction.
When considering catalysts performance, it appears that the Mo promoted catalyst performs best for the catalytic hydrotreatment of the PS fraction. This is evident from the product properties of the final product, for example highest H/C ratio and lowest charring tendency. This catalyst also outperformed the performance of the well-known Ru/C catalyst. For the PL fraction, catalyst performance does not differ considerably, even for the least active monometallic Ni and Ru/C, likely due to similar hydrocracking and hydrodeoxygenation activity for all catalysts studied.
The integrity of the monometallic Ni, Ni-Cu and Ni-Mo catalysts after hydrotreatment of the PS fraction was explored in detail. The Mo promoted Ni catalysts showed the lowest amount of coke deposits and the lowest tendency for Ni nanoparticle agglomeration compared to the monometallic Ni and bimetallic Ni-Cu catalysts. These findings are a first indication for long term catalyst stability. However, further studies in continuous set-ups will be required to draw sound conclusions regarding catalyst stability. It is possible that the phenomena observed here (coking, agglomeration) at short batch times are not decisive for continuous operation. It is well known for heterogeneous catalytic processes that an initial stabilization period is required for the catalyst to perform at stationary conditions (equilibrium catalyst) without significant changes in performance.


