Abstract
The growing popularity of buildings with integrated sub-systems requires a review of methods to optimize the preheating of ventilation air. An integrated system permits using geothermal heat storage parallel to the direct outdoor air intake with additional treatment in the mechanical room as a part of building an automatic control system. The earth–air heat exchanger (EAHX) has many advantages but also has many unanswered questions. Some of the drawbacks are: A possible entry of radon gas, high humidity in the shoulder seasons, and the need for two different air intake sources with a choice that depends on the actual weather conditions. In winter the EAHX may be used continuously to ensure thermal comfort, while in other seasons its operation must be automatically controlled. To generate missing information about EAHX technology we examined two nearly identical EAHX systems, one placed in the ground next to a building and the other under the basement slab. In another project, we reinforced the ground storage action by having a heat exchanger placed on the return pipes of the hydronic heating system. The information provided in this paper shows advantages of merging both these approaches, while the EAHX could be placed under the house or near the basement foundation that is using an exterior basement insulation.
1. Introduction
As the fraction of buildings with integrated heating/cooling, solar, and geothermal sub-systems in the market steadily grows, the sub-system integration changes the economics of traditional solutions. In this paper, we are focused on preheating of outdoor ventilation air, specifically on the design and performance of the earth–air heat exchanger (EAHX). Recent information on the optimal design with two different air intake sources [1] and automatic control systems [2], warrants a broader review of EAHX technology.
Nevertheless, when a risk of radon gas exists, one may use a hydronic heating system and ventilation air that is preheated in the heat exchanger on the return of heating water [3,4]. Despite several papers on EAHX technology, not much is known about optimization of their field performance in either summer or winter climates. To fill this knowledge gap, this paper reviews a demonstration project in Cracow, Poland, where two nearly identical EAHX systems were examined and in Syracuse, NY, USA where an integrated hydronic and mechanical ventilation system was built. In both cases the evaluation lasted for one year of occupancy.
2. Literature Review
It is now standard practice to heat or cool fresh air between the point of intake and entry to the room with mechanical services [5]. This can be done with an earth–air heat exchanger (EAHX) [6,7]. The use of earth for cooling air was already known in historic Greece and Persia [8,9], yet it recently became popular namely for energy conservation.
A number of publications on this topic exist. Some researchers [6,10] looked at the average yearly EAHX performance, others analyzed the design of EAHX to maximize yearly performance, including the dynamic interactions between EAHX and the environment [11]. These works were based on laboratory work [12] or computational fluid dynamic calculations [13]. The literature includes a review [14] of various designs and life cycle analysis of EAHX [15].
While different papers deal with the interaction of EAHX with surrounding soil, and benefits or risks in design, only a handful papers deal with the annual cycles of field performance [16,17,18]. As we do not have any concise guidance for integration of EAHX with other subsystems in the building, an objective of the Cracow University project and of the following paper was to develop a basis for such guidance. As discussed below, the design of EHAX included two cases deemed to be identical and representative of typical European systems designed for cold climates.
3. Experimental Set Up
The experimental set up used in Cracow’s project includes a direct intake of outdoor air though a wall and two remote intakes, both placed next to each other. One EAHX system was placed under the building and had the pipe slope ascending with the drainage down pipe in ¾ distance to the mechanical room, while the other was placed outside the building and had the slope descending with the drainage down pipe in the middle of the length.
Each EAHX was provided with temperature and humidity sensors connected to the data logger. Measurements of earth temperatures were performed in two ranges (a) −25 °C to 0 °C with precision of ± 0.3 °C and (b) from 0 °C to 40 °C with precision of ± 0.1°C. Relative humidity was measured in the range of 10%–90% with precision of ± 3%. Measurements were recorded every 5 min. One of these ground heat exchangers was located under the building (EAHX 1) and the other outside the building (EAHX 2, see the schematic shown in Figure 1).
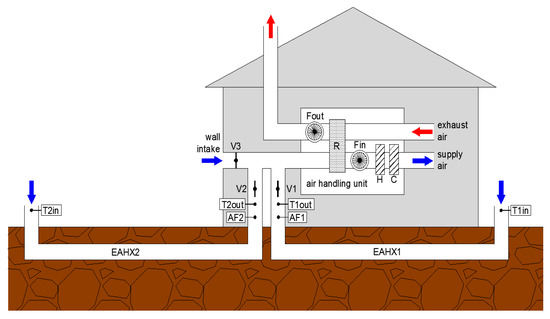
Figure 1.
An experimental set up with two earth–air heat exchangers (EAHX) connected to the air handling unit. EAHX 1 is placed under the building, EAHX 2 is a nearly identical system but placed outside the building. (From Romanska–Zapala [1]). Symbols used in this Figure: V1, V2, and V3 are the air valves with actuators. T1in and T2in are the air temperature sensors on inlets. T1out and T2out are the air temperature sensors on outlets. AF1 and AF2 are the air flow meters. Air handling unit’s elements: Fin is the supply fan; Fout is the exhaust fan; R is recuperation; H is water heater; and C is the water cooler.
The symbols used in this Figure: V1, V2, V3—are the air valves with actuators, T1in, T2in—are the air temperature sensors on inlets, T1out, T2out—the same on outlets, AF1, AF2—air flow meters; air handling unit’s elements: Fin—supply fan, Fout—exhaust fan, R—recuperation, H—water heater, C—water cooler.
The mechanical room has a rotational heat exchanger with 1850 m3/h flow and 80% efficiency, heating coil 3.25 kW and water cooling with 4.22 kW power. The experiments were performed with air flow measured to be 400 m3/h on average and air speed in the EHAX pipe with an internal diameter of 185 mm, about 4.1 m/s. Temperature was measured with 25 sensors within the system and 72 in the soil adjacent to the EAHX. The building automatic control (BAC) system was designed and built at the university, based on the study “Assumptions and requirements for the measurement system; the architectural and construction design of the Malopolska Energy Efficient Building Laboratory”. The heat exchangers were 60 and 59 m long with a 200 mm diameter PVC pipe, and started at a depth of either 1.6 m with a downward 2% slope to a depth of 2.5 m or the opposite, starting at a depth of 2.5 m and ascending to 1.6 m. Water drainage wells were installed in some distance from the end.
Both air inlets were on the north side of the building. An exhaust for air was located on the roof. As the selected technical characteristics of EAHX represent a typical case, this allowed us to focus the analysis on efficiency of the EAHX solution and means of control and steering. The automatic control is necessary for the EQM (Environmental Quality Management) technology as the exterior temperature changes combined with the thermal mass of the building may cause more frequent switches between heating and cooling modes [19].
Figure 2 shows the lay out of the pipes in both EAHXs with simultaneous temperature and humidity measurements, to highlight how instantaneous measurements may vary. Figure 2 also shows where the vertical profiles of soil temperature were made. One may observe that outlets of both EAHXs are placed next to each other. Furthermore, positioning of the measurement points shown in Figure 2, permits the observation of the effect of EAHX pipes on soil temperatures.
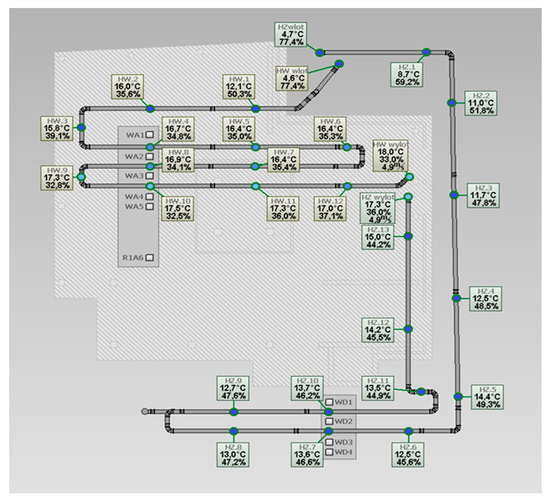
Figure 2.
Schematic lay out of two EAHX systems against the plan of the building. The temperature and relative humidity measurements in the EAHX pipes and their codes (HZ) are shown. Also shown are soil temperature profiles under the building (WA) and outside the building (WD).
Not shown in Figure 2 is the soil temperature profile called R1A6 that is measured far away from the building and represents undisturbed soil temperature.
4. Reference Temperature Profiles in the Soil
Figure 3a shows a vertical cross section through an insulated slab. Figure 3b shows locations of vertical temperature measuring points versus the EAHX pipe as well as positions of the measurement points on the undisturbed soil temperature profile.
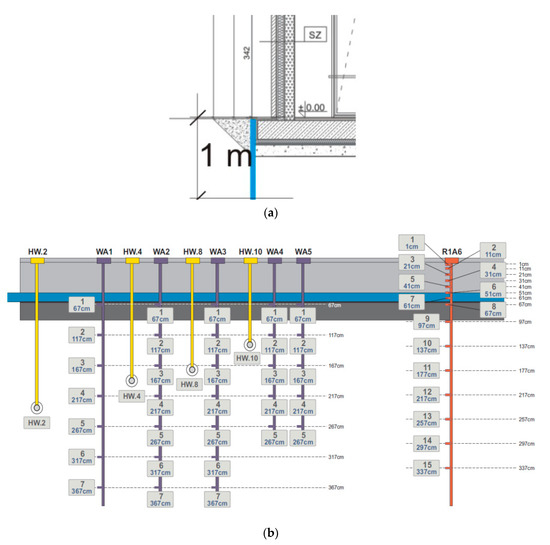
Figure 3.
(a) Vertical cross section through an insulated slab. (b) Locations of vertical temperature measuring points vs the EAHX 1 pipes as well as positions of the measurement points on the reference soil temperature line.
The slab on ground has a total thickness of 1020 mm and is comprised of the following layers:
- Ceramic plates, 30 mm;
- Concrete finishing layer, 40 mm;
- Slab on the ground with reinforced concrete, 500 mm (placed on protective film covering);
- High-density extruded polystyrene (XPS), 150 mm (placed on water resistant barrier);
- Light-weight concrete, 300 mm.
Furthermore, to eliminate heat flow from the building to the EHX2 which was placed in the vicinity of the building, a 1000 mm wide and 150 mm vertical layer of extruded polystyrene thermal insulation was added.
One can observe that the first meter of soil significantly assisted the provision of a stable and slowly varying temperature in the summer—much lower than the air temperature. Differences between the three lowest curves in Figure 4 are small, indicating that any advantage of deeper placement of the EAHX pipe may not be justified by an increased cost of the deeper installation.
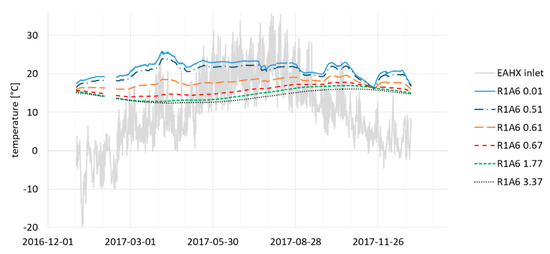
Figure 4.
Schematic of the air and undisturbed soil temperature field during a one-year period. Measurement points are located at depths of 10, 510, 610, 670, 1770 and 3370 mm. The recording of the measurements was interrupted for a few days for technical reasons.
5. Temperature in the EAHX Pipe versus the Reference Temperatures
Having established the reference temperature curves, one may compare temperatures of the EAHX with those in the soil at similar depths under the building. This is shown in Figure 5.
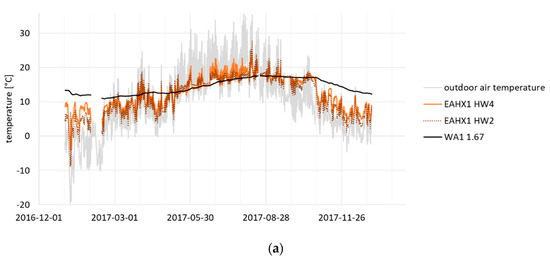
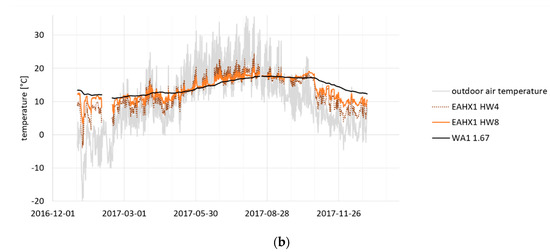
Figure 5.
(a) Temperatures at the beginning of the EAHX pipe with reference temperatures on two levels and air temperature (gray background). The recording of the measurements lasted one year but was interrupted for a few days for technical reasons. (b) Temperatures in the middle of the EAHX pipe with the reference temperatures on two levels and air temperature (gray background). The recording of the measurements lasted one year but was interrupted for a few days for technical reasons.
Figure 5b shows that temperatures in the middle of the EAHX are much closer to the soil reference level than in the beginning of the heat exchanger pipe. Yet, all air temperatures in the EAHX pipe show oscillations, perhaps small, but still large enough to indicate that only a partial modification of air temperature took place. Yet, one often forgets that temperature field under the building varies in three dimensions, two of them being the distance from the edge of the building and the third being depth below the slab.
To highlight this point, Figure 5b shows the temperature profile at similar depths but at a different distance from the building’s edge.
Figure 6 shows the temperature profile in the soil surrounding the EAHX pipes, which shows a multidirectional temperature field and a small but visible temperature change as a function of the distance from the building’s edge. Furthermore, temperature variations inside the EAHX pipes were reflected by the temperature of the soils and only at a certain distance (curve f) the effect of the EAHX pipe disappeared, leaving the smooth curve of the soil temperature changes. These factors must be taken into consideration when evaluating the optimum length of the EAHX pipe.
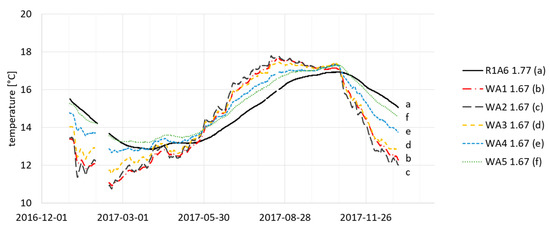
Figure 6.
Measurements on the axis WA (as shown under the house in Figure 2) show the variation on the first three measurement profiles coming closer to the reference temperature at some distance. The recording of the measurements lasted one year but was interrupted for a few days for technical reasons.
6. EAHX Length with Multibranch Pipe Arrangement
Amanowicz [17] analyzed EAHX with a few low diameter pipes and found the influence of geometrical parameters on flow characteristics and on total pressure losses in particular.
His sensitivity analysis considered a variable number of parallel pipes, pipe length, and main pipe diameter. He showed that if the main pipe diameter is 40% larger than that of the parallel pipes, a significant reduction of total pressure losses and improved airflow uniformity is obtained. Branch-pipe length affects the air flow uniformity but also increases resistance. These observations are in agreement with our experimental observations (Figure 7).
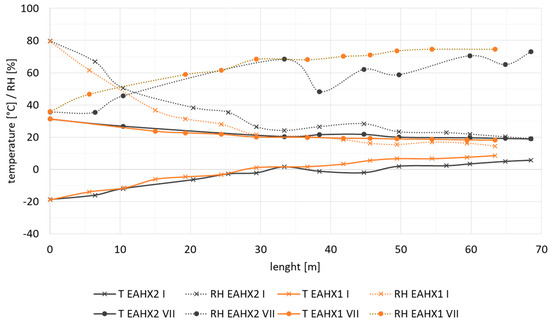
Figure 7.
Effect of distance from the inlet measured every 5 m on temperature and relative humidity of air in the EAHX pipe measures at Cracow TU. The graph shows these relations measured on 20 July, 2017 (filled circles) and on 7 January, 2017, and values for both EAHX were tested (marked with x).
Figure 7 shows the whole length of the EAHX from ground level to the ground level that exceeds 60 m. This figure explains some differences reported previously, namely the differences between measured values of temperature and relative humidity in the EAHX pipes. System 1 placed under the building has more uniform soil conditions than System 2 which is exposed to the exterior climate.
In the summer, there appeared to be no difference in temperature measured by both heat exchangers, which dropped from the initial 30 °C to 20 °C over the first 30 m of the path. Finally, even though one may observe slow changes of temperature over the whole 60 m of the EAHX length, the change over the first 30 m was much higher than on the second 30 m. For both summer and winter, there was about 75%–80% change in the first 30 m distance. Thus, we may conclude that in the studied case the length of 30 m was sufficient for the design purposes.
Yet the requirement for the EAHX length cannot be answered without addressing the floor area that the studied case relates to. When considering the reduction of air speed to a typical 2 m/s from the current 4.1 m/s, where the current floor area is 423 m2 and the air change rate is 0.35 ACH (minimum air change rate for health purposes) with a room height of 2.7 m, one obtains a measurement of about 225 m2 floor area.
7. Comparing Performance of EAHX 1 with EAHX 2
Figure 8 shows temperature and relative humidity in the outdoor air as well as in the two EAHX systems during one week of January 2017.
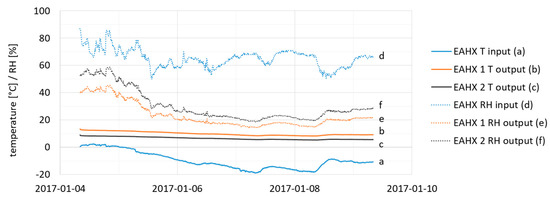
Figure 8.
Temperature and relative humidity in the outdoor air (EAHX input, color blue) as well as the output from the EAHX1 (color orange) and EAHX2 (color black) during five days in January 2017.
One may observe that with the outdoor temperature falling from near zero to −19 °C, there was a slight decrease of the temperature in the EAHX pipes. The absolute humidity appears to be constant and relative humidity follows the temperature changes in the EAHX pipes. The temperature of the EAHX 1 under the building was somewhat higher in the winter.
8. Calculating Performance of the EAHX
In this section we will calculate the ability to provide the heating or cooling energy by EAHX 1 and 2 on the base of measured temperature and humidity and mean air velocity of the air coming and leaving the EAHX.
In these calculations φ is the relative humidity of air, p is the atmospheric pressure of air [Pa], x is the absolute humidity of air [kg/m3], T is the air temperature [°C] (Tinlet is the on inlet to EAHX and Toutlet is the on exit from EAHX), M is the rate of the air mass flow [kg/s], V is the mean flux [m3/s] here 0.11111m3/s that corresponds to 400 m3/h, I is the enthalpy [kJ/kg] (Iinlet is on the inlet to EAHX and Ioutlet is on the exit from EAHX), and P is power [kW]. The following equations were used:
where
where
x = 0.622 ((φ ps)/(p − φ ps)),
ps = 611.2 e^((17.58T)/(241.2T)),
I = 1.0049T + (2486.5 + 1.905T − 0.0016T2) x,
P = (Ioutlet − Iinlet) M,
M = Vp/(287.05 ((Tinlet + Toutlet)/2 + 273.15)).
Figure 9 shows the calculated capabilities of both EAHX 1 and 2 showing that EAHX 1 located under the building produced more heating energy in winter and cooling in summer than EAHX2 which was located in the ground adjacent to the building. We have called it heating index because from March through September we may observe that both the heating and cooling capability should be used and as previously discussed by Romanska–Zapala [1], one needs to employ an automatic steering for either heating or cooling and selection of outdoor inlet or EAHX.
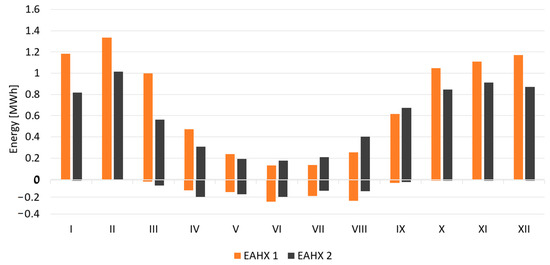
Figure 9.
Monthly calculation of heating (+) and cooling (−) capability (indexes) of each of the tested EAHXs.
9. Discussion on Performance of EAXH1 and EAHX 2
The above presented permit drawing a few conclusions. The exit temperature of both heat exchangers varied throughout the year. During the spring temperature steadily increased, reaching from 17 to 19 °C in the summer, while in the autumn it decreased and reached 6–7 °C in the winter. The differences in construction of two tested heat exchangers were small, namely two 45° connectors instead of two with 90° angles and ascending EAHX 1 versus descending EAHX 2. However, the differences in performance between both persisted through all seasons. As EAHX System 1 (located under the house) showed better performance than System 2 (located outside the house), one may conclude the main reason was due to use of 150 mm thick, high-performance thermal insulation. Looking at the variation of performance between different parallel segments of the EHAX 1 pipes (under the house) one may also observe that they were located too close to each other.
Finally, one may observe that placing the EAHX under the layer of thermal resistance of Rsi, about 5 [m2k]/W or U-value 0.2 K/[m2K], was comparable with the effect of the deeper placement of the EAHX. This is shown in Figure 10 on temperature profiles measured on the D axis (open soil) with depths of 2.67 and 3.67 m.
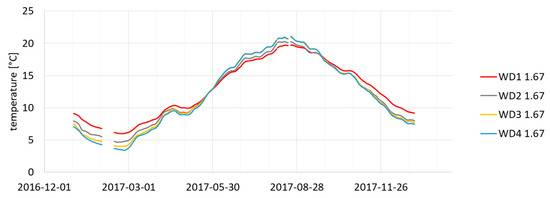
Figure 10.
Measurements on the axis WD (outside the house, as shown in Figure 2) show a smaller variation between different temperature profiles but much larger differences between winter and summer than measured on the axis WA. The recording of the measurements lasted one year but was interrupted for a few days for technical reasons.
One can observe in Figure 11 that deeper placement of the EAHX slightly increased the thermal lag and flattened the yearly temperature oscillation to the amplitude displayed by EAHX 1 (i.e., it came closer to optimal comfort conditions).
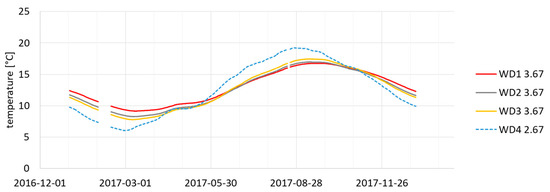
Figure 11.
Temperature measured on the axis WD outside the building. The recording of the measurements lasted one year but was interrupted for a few days for technical reasons.
10. Discussion on Air Preheat Technology
If there is no soil gas (radon), an EAHX can be placed directly under the insulated concrete slab placed on ground or in the basement floor. Figure 8 shows that during the winter, air temperature coming from EAHX number 1 is significantly warmer than that coming from EAHX number 2. Figure 10 and Figure 11 show that a depth of 2 m or more is needed to fully benefit from EAHX being placed in uninsulated ground, yet the same performance is achieved with 0.7 m depth under the basement of the building (Figure 4 and Figure 5). If EAHX is placed under the building it should be located as much as possible in the central area of the basement slab. Effect of the distance from the building edge is shown in Figure 6.
If placement under the building is not possible, placement next to the drainage pipe at the foundation is the preferred location. In the latter case, the traditional practice is insulating the basement wall on the first 60 cm below ground and placing a nearly horizontal 1.2 m strip of 50 mm thick, extruded polystyrene (with a slope of 2%–3%). Instead of extruded polystyrene, any water-resistant thermal insulation with a similar U-value can be used.
The length of the EAHX pipe should be at least 25–30 m. Figure 7 supports literature findings [17] and shows that a 30 m length provided a sufficient reduction of air temperature variation. The length of EAHX may further be shortened if one uses a wide collecting pipe with two to four much smaller branches. For instance, in one New York demonstration house [18], a 3 m pipe with a 100 mm diameter and two 45° dividers, collected four 10 m long 25 mm diameter PVC pipes placed 200 mm apart.
In another New York demonstration project [3,4] where no drainage was needed on three sides of a building that was located on a slope, the underground pipe was very short and the bulk of the preheat was achieved on an interior heat exchanger built on the return pipe connectors from the hydronic heating. This type of solution can also be used in retrofitting buildings without a basement. In case of water seepage through the basement wall, one must excavate soil next to the building to locate exterior thermal insulation and drainage [19] and this facilitates either water or an earth–air heat exchanger.
Use of EAHX has an obvious appeal: They can reduce the energy needed for air conditioning. Yet EAHX requires a bypass taking air directly from the outside, and to select the source of fresh air requires a control system. This could be based on differential temperature sensors with a motorized valve to control the mixing of air coming from two sources. This valve should also have a manual override. The other devices in the mechanical room are a dehumidifier and dust particle removal, both to improve air quality.
Figure 9 shows that during six months for EAHX 1 and eight months for EHAX 2, one needs both heating and cooling. This indicates the need for switching between the two air sources. The power available from the EAHX1 in Figure 9 is calculated per hour and showed variability from 4 kW to zero, while the fan operation took 75 W. Therefore, the control system must include two elements: (a) fraction of time when fresh air is delivered, and (b) the mixing ratio between air delivered from the EAHX and air delivered from the direct air intake. One must remember that the ventilation air is added to the unplanned air flow (UAF or air infiltration ratio) which means that in ideal case, the UAF is experimentally determined for each specific building.
Elsewhere [20], we have discussed what criterion of air-tightness should be set to permit a significant role of natural (uncontrolled) air infiltration to the building. This will obviously depend on the setting of the criteria for (a) and (b) as much as cost of installation and operation versus potential to save electrical energy. One should also remember that using EAHX in cold climates requires equipment that does freeze up in the winter which requires costly maintenance, and air filters typically need cleaning or replacing every 6–12 months.
The advantage of EAHX technology is that it is able to increase the amount of ventilation air during periods when the temperature of the outdoor air is within a few degrees of the desired room temperature. Experience form the state of California indicates that over ventilation of dwellings with outdoor air has multiple positive effects: It replaces night cleaning of the dwellings, improves feelings of thermal comfort, and reduces the need to open windows when the weather is not suitable for it. Since integrated hydronic heating or cooling systems always come with a water buffer tank, placing an air coil in each of them for some preconditioning intake air broadens the range of air temperatures in which the occupant may use the over ventilation feature.
Finally, there is another consideration with importance related to the size of the building—namely the complexity of the ventilation system. While making a central mechanical ventilation with a controlled supply and uncontrolled exhaust is easy for a small building, it is not easy for a multi-story residential building and may require use of neural network models [21].
11. Concluding Remarks
With growing requirements on indoor air quality dehumidification and dust removal, the selection of air from different air intake sources (EAHX or direct outdoor supply) with an advanced control system becomes a part of the building design [22,23]. This paper provides a basic understanding of factors affecting the field performance of EAHX and gives some examples of practical solutions that can be used in the future design of preheating for air ventilation.
As the modern hydronic heating system becomes the main means of thermal energy delivery, an increased role of air recirculation in indoor spaces integrate a modern, computerized system of outdoor air delivery. Computer-based informatics has recently joined building science to respond jointly with the need of holistic evaluation of building energy performance.
Author Contributions
Formal analysis was performed by A.R.-Z. and M.B.; funding acquisition for building the laboratory, M.F.-C. and M.F.; investigation, M.D. and M.F.-C.; methodology, M.B.; resources, M.F.; software, A.R.-Z. and M.D.; supervision, A.R.-Z.; visualization, M.D.; writing the submission copy, M.B. All authors have read and agreed to the published version of the manuscript.
Funding
This research received no external funding.
Conflicts of Interest
The authors declare no conflict of interest.
References
- Romańska-Zapała, A.; Bomberg, M.; Fedorczak-Cisak, M.; Furtak, M.; Yarbrough, D.; Dechnik, M. Buildings with environmental quality management (EQM), Part 2: Integration of hydronic heating/cooling with thermal mass. J. Build. Phys. 2018, 41, 397–417. [Google Scholar] [CrossRef]
- Dechnik, M.; Moskwa, S. Smart House—Intelligent building—The idea of the future (in Polish). Przegląd Elektrotechniczny 2017, 9, 1–10. [Google Scholar]
- Bomberg, M.; Terry, B.; Hugh, H.; Kevin, S.; Adam, W.; Jianshun, Z. High Environmental Performance (HEP)—residential housing for NY state. Unpublished work. 2009. [Google Scholar]
- Brennan, T.; Henderson, H.; Stack, K.; Bomberg, M. Quality Assurance and Commissioning Process in High Environmental Performance (HEP) House in NY State. Unpublished work. 2008. [Google Scholar]
- Romańska-Zapała, A.; Furtak, M.; Fedorczak-Cisak, M.; Dechnik, M. The Need for Automatic Bypass Control to Improve the Energy Efficiency of a Building Through the Cooperation of a Horizontal Ground Heat Exchanger with a Ventilation Unit During Transitional Seasons: A Case Study. In IOP Conference Series: Materials Science and Engineering; IOP Publishing: Bristol, UK, 2018. [Google Scholar]
- Wojtkowiak, J.; Szymański, M. Analiza całorocznej pracy rurowego gruntowego wymiennika ciepła RGWC w układzie wentylacji mechanicznej budynku mieszkalnego. Ciepłownictwo Ogrzewnictwo Wentylacja 2008, 39, 36–38. [Google Scholar]
- Mirosław, Ż. Assessment of Potential Applicability of Ground Air Heat Exchanger in Białystok. Ciepłownictwo Ogrzewnictwo Wentylacja 2012, 8, 323–346. (In Polish) [Google Scholar]
- Peretti, C.; Zarrella, A.; De Carli, M.; Zecchin, R. The design and environmental evaluation of earth-to-air heat exchangers, A literature review. Renew. Sustain. Energy Rev. 2013, 28, 107–116. [Google Scholar] [CrossRef]
- Ionescu, C.; Baracu, T.; Vlad, G.-E.; Necula, H.; Badea, A. The historical evolution of the energy efficient buildings. Renew. Sustain. Energy Rev. 2015, 49, 243. [Google Scholar] [CrossRef]
- Pfafferott, J. Evaluation of earth-to-air heat exchangers with a standardized method to calculate energy efficiency. Energy Build. 2013, 35, 971. [Google Scholar] [CrossRef]
- Gan, G. Dynamic interactions between the ground heat exchanger and environments in earth–air tunnel ventilation of buildings. Energy Build. 2014, 85, 12–22. [Google Scholar] [CrossRef]
- Skotnicka-Siepsiak, A.M. Wesołowski, M. Wydajność rurowego gruntowego powietrznego wymiennika ciepła w świetle laboratoryjnych danych pomiarowych w okresie zimowym. Ciepłownictwo Ogrzewnictwo Wentylacja 2016, 47, 71–75. [Google Scholar]
- Congedo, P.M.; Lorusso, C.; De Giorgi, M.G.; Marti, R.; D’Agostino, D. Horizontal Air-Ground Heat Exchanger Performance and Humidity Simulation by Computational Fluid Dynamic Analysis. Energies 2016, 9, 930. [Google Scholar] [CrossRef]
- Kaushal, M. Geothermal cooling/heating using ground heat exchanger for various experimental and analytical studies: Comprehensive review. Energy Build. 2017, 139, 634. [Google Scholar] [CrossRef]
- Uddin, M.S.; Ahmed, R.; Rahman, M. Performance evaluation and life cycle analysis of earth to air heat exchanger in a developing country. Energy Build. 2016, 128, 254–261. [Google Scholar] [CrossRef]
- Flaga-Maryanczyk, A.; Schnotale, J.; Radon, J.; Was, K. Experimental measurements and CFD simulation of a ground source heat exchanger operating at a cold climate for a passive house ventilation system. Energy Build. 2014, 68, 562–570. [Google Scholar] [CrossRef]
- Amanowicz, Ł. Influence of geometrical parameters on the flow characteristics of multi-pipe earth-to-air heat exchangers—Experimental and CFD investigations. Appl. Energy 2018, 226, 849–861. [Google Scholar] [CrossRef]
- Lowell, L. Highlights from the Geo-Solar Test (GEST) house evaluation. In Proceedings of the Building Innovation Symposium, Washington, DC, USA, 7 April 2020. [Google Scholar]
- Bomberg, M.; Kisilewicz, T.; Mattock, C. Methods of Building Physics; Cracow University: Kraków, Poland, 2017; pp. 1–301. [Google Scholar]
- Bomberg, M.; Kisilewicz, T.; Nowak, K. Is there an optimum range of airtightness for a building? J. Build. Phys. 2016, 39, 395–421. [Google Scholar] [CrossRef]
- Dudzik, M.; Tomczyk, K.; Sieja, M. Optimal dynamic error formula for charge output accelerometer obtained by the neural network. In Proceedings of the 2018 International Symposium on Electrical Machines (SME), Andrychów, Poland, 10–13 June 2018. [Google Scholar] [CrossRef]
- Romanska-Zapala, A.; Bomberg, M.; Yarbrough, D.W. Buildings with environmental quality management (EQM), part 4: A path to the future NZEB. J. Build. Phys. 2018, 43, 3–21. [Google Scholar]
- Bomberg, M.; Furtak, M.; Yarbrough, D.W. Buildings with environmental quality management: Part 1: Designing multifunctional construction materials. J. Build. Phys. 2017, 41, 193–208. [Google Scholar] [CrossRef]


© 2019 by the authors. Licensee MDPI, Basel, Switzerland. This article is an open access article distributed under the terms and conditions of the Creative Commons Attribution (CC BY) license (http://creativecommons.org/licenses/by/4.0/).