Abstract
The uncertainty regarding the capacity of photovoltaics to generate adequate renewable power remains problematic due to very high temperatures in countries experiencing extreme climates. This study analyses the potential of heat pipes as a passive cooling mechanism for solar photovoltaic panels in the Ecohouse of the Higher Colleges of Technology, Oman, using computational fluid dynamics (CFD). A baseline model has been set-up comprised of 20 units, 20 mm diameter water-filled heat pipes, with a length of 992 mm attached to a photovoltaic panel measuring 1956 mm × 992 mm. Using the source temperature of 64.5 °C (337.65 K), the findings of this work have established that a temperature reduction in the range of up to 9 °C is achievable when integrating heat pipes into photovoltaic panels. An optimum spacing of 50 mm (2.5 times the diameter of the heat pipe) was determined through this work, which is also a proof-of-concept towards the use of heat pipe technology for passive cooling of photovoltaic panels in hot climates.
1. Introduction
The potential of using photovoltaic (PV) panels operating in areas with hot and dry climates, such as Oman, is vast due to the abundance of solar radiation. However, despite this advantage, the uncertainty regarding PV panels to generate adequate renewable power is still a problem due to extreme temperatures. High temperatures lead to a reduction in the open circuit voltage of a PV system, thus lowering the power output [1,2,3,4]. According to Al-Waeli et al. [5], the PV cell temperature increase has two consequences: the reduction of the generated electrical energy and the thermal fatigue due to the significant temperature of the PV panel during the day.
Energy demand in Oman is on the rise, and the country has had a 5% energy consumption rise since 2015 according to Al-Mabsali et al. [6], who presented his work in the Oman Annual Report for 2016. The increase in energy demand is a challenge and the present study aims to optimise the renewable solar photovoltaic technology by increasing its operative range, which could contribute towards meeting the 5% energy consumption increase. The present study is also consistent with the vision of Higher Colleges of Technology (HCT) in the contribution to the national socio-economic development of the country through diversification to non-oil industries. Nasir and Al-Jabri [7] cited the Oman policy document “Vision 2020”, which stated that industrial diversification can achieve the development targets, which included the increase in the contribution of the non-oil sectors and non-oil exports to 13% of the GDP by 2020.
In Muscat, the capital city of Oman, the hottest month is June where the average daytime temperature is around 40 °C (313.15 K), while in July and August, cloud banks brought by the Southwest monsoon can slightly lower the daytime temperature to 38 °C (311.15 K) in July and to 36 °C (309.15 K) in August. In an earlier experiment carried out by the research team (Al-Mabsali et al.) [6], which was set up in the HCT Muscat Eco house, an average solar irradiation of 911 W/m2 was observed in the months of June to July, 2017. Even during testing in a cooler period of the year such as October (testing period between 15th to 21st October 2017) (Table 1 and Figure 1), it was noted that the maximum nominal operating cell temperature (NOCT) was 64.5 °C (337.65 K) at an ambient temperature of 38.5 °C (311.65 K). The effect of this result was a decrease in performance efficiency of the PV panels by 2.19%. A maximum efficiency of 54.8% was recorded during the testing period, clearly indicating the adverse effect of hot arid climates on PV performance. This efficiency decline was in-line with the studies conducted by Al-Waeli et al. and Jouhara et al. [5,8] which show a significant drawback on the effectiveness of PV panels operating in hot arid climates.

Table 1.
Experimental observation using data loggers.
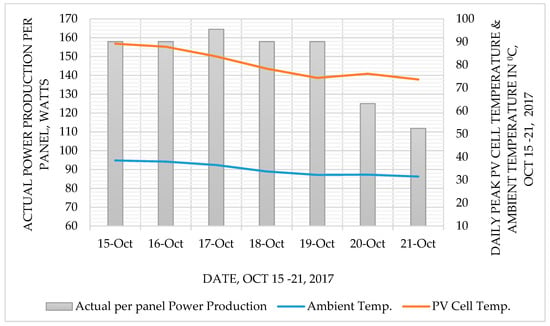
Figure 1.
Actual photovoltaic (PV) power production at various daily peak PV cells and ambient temperatures.
In order to improve the power generation performance of PV panels, cell surface temperatures must be decreased to bring them closer to the ambient conditions; therefore, this study introduces a heat pipe heat exchanger (HPHE) technology as a passive cooling mechanism to be integrated within PV terminals.
Previous research carried out by Chaudhry [9] revealed that heat pipes incorporated with sorption phenomenon display greater heat transfer capacity and tubular heat pipes have the highest working range on average with the maximum operating temperature from all compared systems being 180 °C (453 K). To maintain the sustainable working mode, it is imperative that heat pipes use water as a natural refrigerant in comparison to artificial refrigerants [9].
In this work, an investigation has been carried out using a heat pipe heat exchanger (HPHE) system as a retrofit mechanism for passively cooling PV panels. Computational fluid dynamics (CFD) is used to determine the optimum arrangement of heat pipes integrated with PV panels. The study uses the existing HCT Ecohouse as a case study where the PV panels are uniformly installed in a configuration of seventy-six (76) single PV panels of size 1956 × 992 mm, with a total PV array area of 147.44 m2, delivering a direct current rating maximum power capacity of 22,800 Watts. The HPHE mechanism was arranged in a series of possible spanwise installations to discover the most functional design.
2. Literature Review
Previous studies have investigated various heat pipe systems for passive cooling duties in ventilation works and power electronics, which are summarized in this section. Peng et al. [10] investigated the practical effects of solar PV surface temperature efficiency based on its output performance. The experimental works were carried out under different radiation conditions and explored the variation of the output voltage, current, output power, and efficiency. The cooling test resulted in an efficiency increase of 47% for the PV panels. The system performance and life cycle assessment suggested that the annual PV electric output efficiencies could increase by up to 35%, and the annual total system energy efficiency, including electrical output and hot water energy output can increase by up to 107%.
Bahaidarah, Baloch, and Gandhidasan [11] carried out a review that highlighted the importance of uniform PV cooling. An experimental case study was presented for comparison between uniform and non-uniform cooling methods. The work explored and analyzed the possible causes and effects of non-uniformity using the cooling techniques with low average cell temperatures and uniform temperature distributions. One of these techniques was the utilization of heat pipes on PV systems that resulted in the reduction of the temperature down to 32 °C, with the best-case temperature non-uniformity of 3 °C.
Bahaidarah et al. [12] conducted a comprehensive study on the state-of-the-art applications, materials, performance of current heat pipe devices and future developments in the field, the current limitations of heat pipes, and the reasons that it cannot be implemented in more aspects of our lives due to its operational boundaries, cost concerns, and the lack of detailed theoretical and simulation analysis. The limitations resulting from their review provided the opportunity to find fresh solutions which opened up the possibilities of adopting the heat pipe technology to its feasible and fruitful utilization and thus used as the basis to achieve the objective of this study.
Jouhara et al. [13] experimented with PV efficiency caused by the water cooling effect using a numerical model, EES (Engineering Equation Solver), which predicted electrical and thermal parameters affecting its performance. A heat exchanger, as a cooling panel, was incorporated in the rear surface of the PV module as an experiment. The results of the numerical model were found in good agreement with the experimental measurements performed for the climate of Dhahran, Saudi Arabia. With active water cooling, the module temperature dropped significantly to about 20% and that increased the PV panel efficiency by 9%.
Theoretical modelling was carried out by Chaudhry et al. [14] using water as the liquid medium for ventilation works and utilizing a water flow rate of 0.25 m/s. The study used various spacing from 1D to 4D with a maximum of 80 mm down to 20 mm. The spacing range consideration of 1D to 2D, 20mm to 40 mm was subject to an international patent application (PCT/GB2014/052263). The 2D to 4D, 40 to 80 mm was a novel observation applied to a heat pipe installed in a duct as PV cooling device. Furthermore, citing Reference [9], findings on a systematic design of a high conductivity cooling system revealed that heat pipes incorporated with sorption phenomenon displayed greater heat transfer capacity, and tubular heat pipes arrangements have the highest working range on average, with the maximum operating temperature from all compared systems being 180 °C (453 K).
Tripathy et al. [15] conducted a study on building integrated photovoltaic (BIPV) thermal technology using an air duct, provided below, on the PV panels to serve as a structural element. The contribution of the air flow was to increase both the electrical and thermal efficiencies. The study utilized the energy equilibrium equation for developing the mathematical model of BIPV thermal system using the HDKR (Hay, Davies, Klucher, Reindl) model based on insolation, corresponding to the optimum tilt angle of the panel. The room temperature of the BIPV thermal system had a mass flow rate of 1 kg/s through the duct on the respective optimum tilt angle.
Further investigation by Chaudhry et al. [14] included optimization of the heat pipe arrangement for natural ventilation using CFD and the wind tunnel method. The airflow and temperature profiles were numerically predicted, the findings of which were quantitatively validated using wind tunnel experimentation. Using a source temperature of 41 °C and an inlet velocity of 2.3 m/s, the stream wise distance-to-pipe diameter ratio varied from 1.0 to 2.0 and the emergent cooling capacities were established to comprehend the optimum arrangement. The results of this investigation indicated that the heat pipes operated at their maximum efficiency when the streamwise distance was identical to the diameter of the pipe as this formation allowed for the incoming airstream to achieve the maximum contact time with the surface of the pipes. The technology presented was subjected to an international patent application (PCT/GB2014/052263). Therefore, Chaudhry et al. [14] works were used as a benchmark methodology for the current study.
3. Research Methodology
Computational fluid dynamics (CFD) was used as the primary research method in this study by modelling the entire heat pipe integrated PV panel, made up of 20 units of HPHE installed below the 1956 × 992 mm PV surface. Three models of heat pipe arrangement within the HPHE were simulated and spaced at 60, 50, and 40 mm apart at a spanwise distance measured equally between the center of the heat pipes. A flow rate of 0.25 m/s was considered in the determination of the optimum configuration of the heat pipe. ANSYS Fluent (v14.5, ANSYS, Canonsburg, PA, USA) was used to perform the numerical simulations. Furthermore, the HPHE models were tested using both the single-sided and the double-sided condenser direction and were evaluated by shifting the locations from the top, middle, and bottom sections of the rectangular duct.
3.1. Physical Domain
For the heat pipe physical domain, two spacing methodologies were considered: streamwise and spanwise. The design installation in the streamwise direction was not efficient because of the long evaporator pipe length, which led to space restriction on the site. The spanwise heat pipe installation was selected to be studied. The HPHE were installed inside a duct with the same length of the PV panel. There were two HPHE design installations, which were classified into the single side condenser direction shown in Figure 2 and Figure 3, and double side condenser direction of the PV panel shown in Figure 4 and Figure 5.
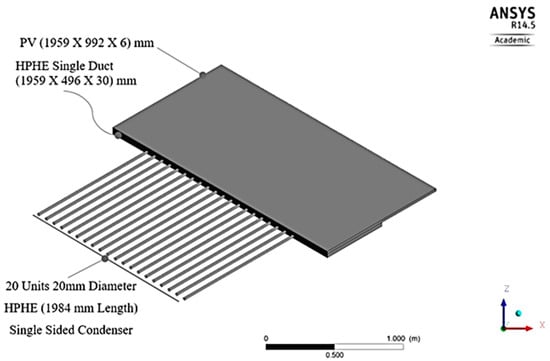
Figure 2.
PV-HPHE spanwise with 50 mm spacing on the middle arrangement, single design isometric model.
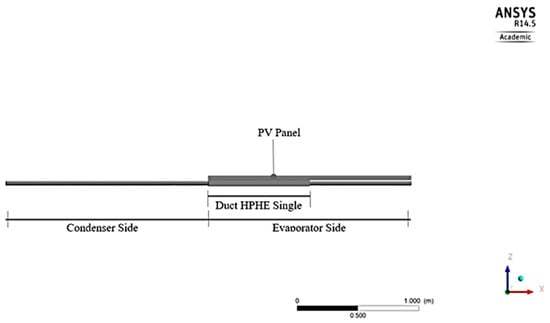
Figure 3.
PV-HPHE spanwise with 50 mm spacing on the middle arrangement, single design side view model.
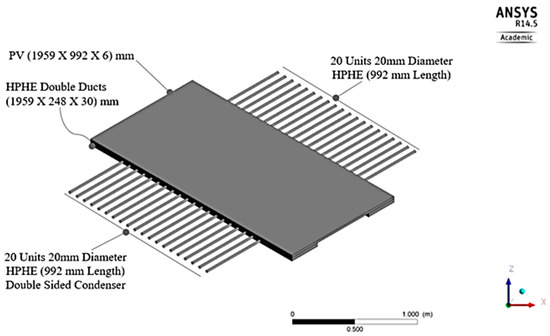
Figure 4.
PV-HPHE spanwise with 50 mm spacing on the middle arrangement, double design isometric model.
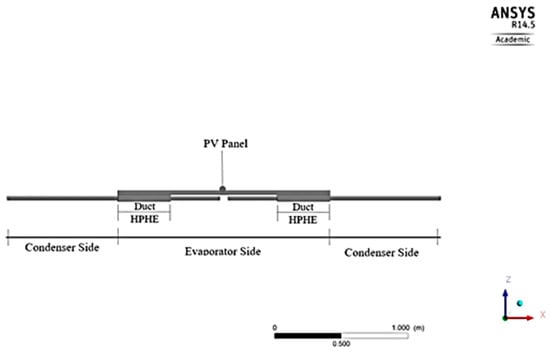
Figure 5.
PV-HPHE spanwise with 50 mm spacing on the middle arrangement, double design side view model.
The review findings of Jouhara et al. and Tan and Zhang [12,16], which included controlled factors such as pipe diameter, pipe thickness, and liquid medium, were adopted in this study. The independent variables were identified as flow rate, heat pipe (HP) spacing, and design installations and are shown in Table 2. All heat pipe parameters, which include diameter, working fluid, and operating temperature, were taken from the previous works of Chaudhry et al. [9,14], as part of the research team’s earlier works. The dependent variables were PV temperature and energy efficiency. The relationships of the variables such as pipe spacing to temperature, flow rate to temperature, and HP direction (spanwise and streamwise) to temperature were analyzed using CFD. The single side and double side arrangements (Figure 3, Figure 4, Figure 5 and Figure 6) were made through the top, middle, and bottom installations of the PV panel. A duct, regardless of the material composition shown in Figure 3, Figure 4, Figure 5 and Figure 6, was installed below the PV panel and collected the high temperature to be absorbed by the evaporator section of the HPHE and had a negligible effect on the temperature, as proven by the solar collectors of Amp et al. [17].
Table 2.
Summary of the recommended heat pipe heat exchanger (HPHE) system specifications and liquid medium as controlled variables.
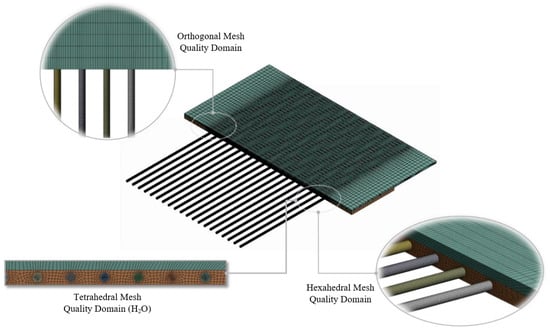
Figure 6.
Mesh quality for the physical domain.
3.2. Mesh Generation and Boundary Conditions
A hexahedral mesh with nodes ranging between 703,507–1,135,505 and a maximum of 992,612 elements was applied to the different models in this simulation. The mesh orthogonal quality ranged from 0 to 1 with a minimum orthogonal quality equal to 7.12915 × 10⁻² and a minimum aspect ratio equal to 9.59399 × 10 for a middle arrangement with spacing equal to 50 mm. The standard (k-e) k-epsilon turbulence model was applied with the standard wall function. In CFD, k-epsilon is a model used to simulate mean flow characteristics for turbulent flow conditions. The standard wall function was used to determine the laminar or turbulent flow of fluid material in the near wall using boundary conditions. Water was used as the working fluid inside the heat pipes. The mesh details are shown in Figure 6. The mesh quality results are shown below in Table 3.
Table 3.
Mesh quality according to the heat pipe (HP) arrangement and spacing.
The solution method used a simple pressure velocity-coupling scheme. The spatial discretization was set to the following conditions: A gradient used the least square cell based, a standard pressure on fluid material, a momentum used second order upwind, a turbulent kinetic energy used first order upwind, a turbulent dissipation rate of first order upwind, and an energy was set using second order upwind. The reference values are shown in Table 4.
Table 4.
Solution control variables.
The inlet temperature of liquid water in the HPHE was 45 °C (318.15 K). The top face of the PV panel models was assigned the source temperature of 64.5 °C (337.65 K) with an ambient temperature of 38.5 °C (311.65 K) taken from the July 2017 experimentally recorded data. The data revealed a decrease of 2.19% in performance efficiency of the PV panels, which was addressed by the passive cooling mechanism of the HPHE. This condition was in anticipation of the expected maximum surface temperature that was recorded during the experiments conducted earlier (presented in Table 1). The simulation of the flow of water within the pipe was done, the pipe inlet was assigned to the presumed evaporator end with the factors of mass flow rate set, and the range was 0.05 m/s as the minimum and 0.25 m/s as the maximum flow rate.
For simulation purposes, the temperature profile on the back surface of the PV panel was studied, and the results were translated to have a consequent effect affecting the top surface of the panel due to the thin layer of the PV panel. A simulation of the heat pipe liquid flow, with the use of CFD, ANSYS R14.5 was made. This approach allowed for relative properties, which have been applied as boundary conditions, as shown in Table 4. However, the HPHE system specifications and liquid medium, as controlled variables in Table 2, was focused on the decrease in temperature of working fluid, which stimulated the heat transfer from the photovoltaic panel to the evaporator section of the heat pipe, went through the condenser section, and achieved was through passive cooling. This allowed for a thorough observation of the passive cooling process of the HPHE design installation, which decreased the PV panel temperature from 2 to 5 °C. Additionally, for such an expected temperature reduction of the photovoltaic panel to have resulted, the consequent restoration in the loss of energy efficiency was 2.19%, which regained reliable power generation to the maximum available.
4. Results and Discussion
This section presents the findings from this work to determine the optimum heat pipe spanwise spacing using the numerical models shown in Section 3. Figure 7 displays the area weighted average temperatures on each of the simulated models. The minimum temperature in the HPHE evaporator section of 55.32 °C (328.47 K) was recorded on the HP middle model, which had a spacing of 50 mm (2.5 times the diameter of the HP or 2.5D). The highest temperature formation was observed for a heat pipe spacing of 40 mm or 2D in the HP top configuration. This result confirmed that having heat pipes spaced 2.5D apart from each other offers the highest passive cooling potential.
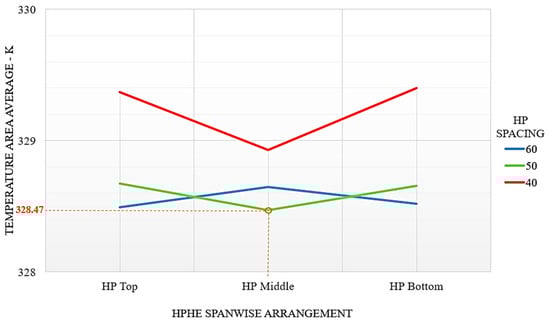
Figure 7.
Temperature area average—K in the HPHE single duct.
The modelling set-up of the HPHE was done using a 40, 50, and 60 mm spacing on the centers with the same 20 units of HP installed in a rectangular duct, as shown in Figure 8, Figure 9 and Figure 10. The installation caused the coverage of the cooling area of PV panel to slightly shrink, which resulted in varying results. For the 60 mm spacing, it resulted in 55.34 °C (328.49 K) at the top, 55.5 °C (328.65 K) in middle, and 55.37 °C (328.5 K) at the bottom, as shown in Figure 8.
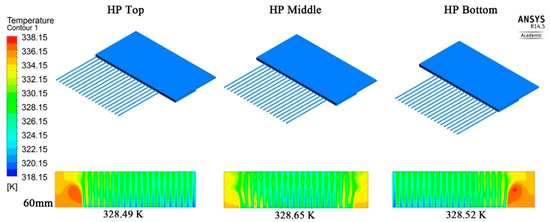
Figure 8.
One sided condenser direction HPHE model, spacing = 60 mm, installation on PV panel.
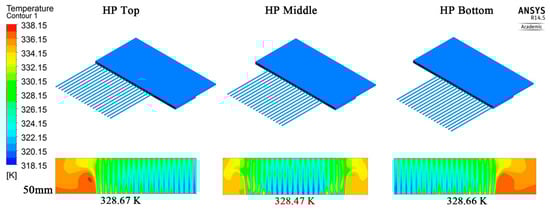
Figure 9.
One sided condenser direction HPHE model, spacing = 50 mm, installation on PV panel.
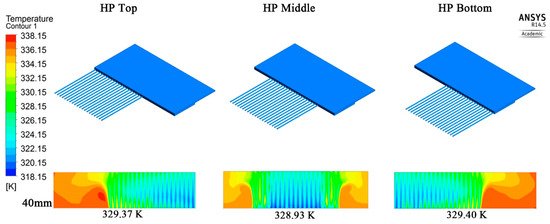
Figure 10.
One sided condenser direction HPHE model, spacing = 40 mm, installation on PV panel.
The same HPHE installation with the use of 50 and 40 mm spacing’s on the centers show 55.52 °C (328.67 K) at the top, 55.32 °C (328.47 K) in the middle, and 55.51 °C (328.66 K) at the bottom. For the 40 mm spacing 56.22 °C (329.37 K) at the top, 55.78 °C (328.93 K) in the middle, and 55.25 °C (328.40K) at the bottom were observed, as shown in Figure 9 and Figure 10.
The three distinct HPHE design arrangements, which were made through the top, middle, and bottom installations of the PV panel, yielded theoretical results from ANSYS. The results showed that the average temperatures were 55.4 °C (328.55 K) for 60 mm HPHE spacing, 55.45 °C (328.60 K) for 50 mm HPHE spacing, and 56.08 °C (329.23 K) for 40 mm HPHE spacing. The results of the 50 mm HPHE spacing was selected for the reason that it yielded the lowest temperature of 55.32 °C (328.47 K).
The results of the 60 mm HPHE spacing gained the most uniform result. However, the problem was the middle section, which was the concentration of irradiation absorption for a long period of PV operation and experienced the highest temperature. The findings of the effect of air flow rate on the photovoltaic temperature is shown in Figure 11. Using variable values for the flow rate, which was ranged from 0.05 m/s to 0.25 m/s, the findings indicated an inverse relationship between the two parameters, as the heat pipe temperature decreased, the flow rate of the fluid increased. This was understandable because having a high airflow rate indicates a low contact time between the air and the heat pipe working fluid, thus providing lower cooling potential.
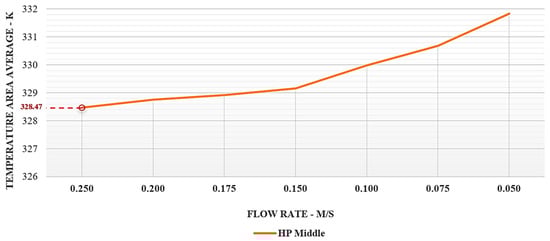
Figure 11.
Variations of temperature results in relation to flow rate.
Temperature contour levels on the HPHE are shown in Figure 12, which were taken from the middle installation of the evaporator duct attached to the PV panel, as shown in Figure 4 and Figure 5. The results of the optimum configuration yielded a minimum temperature of 54 °C (327.15 K) within the duct section.
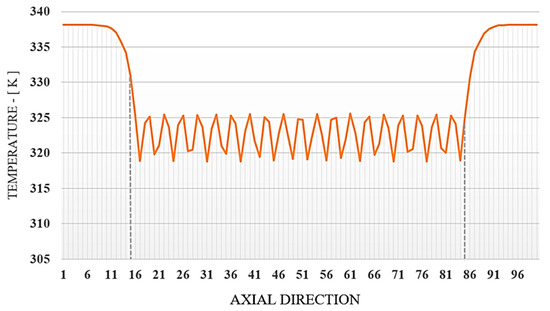
Figure 12.
Temperature result of HPHE double sided condenser design.
The temperature of the heat pipe internal section inserted inside the duct of the HPHE was taken between the axial direction of 15 and 85, as shown in Figure 12. A maximum of 52.43 °C (325.58 K) and a minimum of 45.61 °C (318.76 K) were recorded as the range in temperature variations of the heat pipes that contained water and were inserted in the duct. The temperature was lower in relation to the duct section of the HPHE, which was 54 °C (327.15 K) and did not contain water. These results proved that the water inside the heat pipes acted as a conductor that transferred the warm temperature difference of 1.57 °C from the evaporator to the condenser section of the HPHE than the junction box, which caused the lowering of temperature below the PV panel, as shown in Figure 13.
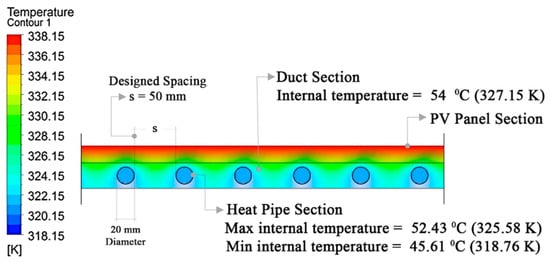
Figure 13.
HPHE cross section with HP middle installation of the evaporator duct, spacing = 50 mm.
The findings from the three modelling set-ups made for the HPHE in the duct resulted in the selection of the best design and the conclusion is given in Table 5 below.
Table 5.
Recommended HPHE design installation of the optimum configuration from CFD analysis.
As part of a qualitative visualization, the full-scale HPHE rig was fabricated using a double-sided condenser model, middle section installation, and 90 ° spanwise orientation, and is shown in Figure 14 and Figure 15. This has been commissioned at the eco-house project location, at the HCT site in Muscat, Oman. The HPHE apparatus is currently undergoing experimental testing and data observation to validate the CFD results. All dimensions and specifications of the HPHE apparatus followed the experimental arrangement similar to the numerical model.
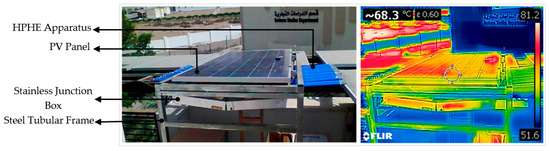
Figure 14.
PV-HPHE apparatus isometric model (left) and captured infrared image (right) taken from the top surface assembled in the eco-house, Higher Colleges of Technology (HCT), Muscat, Oman.
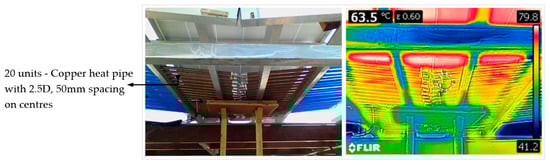
Figure 15.
PV-HPHE apparatus isometric model (left) and captured infrared image (right) taken from the bottom surface.
The commissioning of the apparatus shown in Figure 14 and Figure 15 was carried out to experimentally validate the CFD results in order to prove the consistency of the modelling. The top surface temperature of PV-HPHE apparatus, last recorded 1st August 2019 at 12:52 h, was 69.84 °C and the bottom surface temperature was 64.98 °C. The difference in temperature between the top and bottom surface was 4.86 °C with the ambient temperature of 45.70 °C, which was in good agreement with the model. Overall, the simulation focused on heat transfer from the PV panel to the evaporator section of the heat pipe, through to the condenser section to exhaust the heat to the surroundings. The thorough observation of the passive cooling process of the HPHE design helped to decrease the PV panel temperature from 2 to 5 °C on average, which was confirmed from the actual installation.
5. Conclusions
The potential of PVs in hot and arid climates, although promising, may be adversely affected by the high intensity of solar radiation and high temperatures. This study carried out an investigation using a heat pipe heat exchanger (HPHE) system as a retrofit mechanism for passively cooling PV panels. Computational fluid dynamics (CFD) was used to determine the optimum spanwise arrangement of heat pipes integrated with PV panels.
The work undertaken analyzed the temperature formations on the PV panels using a range of heat pipe spacing combinations. The work has identified that the HPHE has the capacity to provide the required cooling of the photovoltaic panels installed in the HCT Ecohouse in Oman, which are usually exposed to a maximum temperature of 64.5 °C (337.65). The major finding from this study indicates that the 50 mm HPHE spacing (2.5D or 2.5 times the diameter of the pipe) has the greatest potential to decrease panel temperature, with a maximum reduction down to 55.32 °C (328.47 K) or approximately 9 °C. The recommended HPHE design installation is expected to be made of a double-sided condenser, having a middle section installation with a 90° spanwise orientation towards the PV panel. Current experimental testing has indicated a temperature drop between 2 to 5 °C, which is lower than the numerically predicted results.
This paper provided a proof-of-concept towards integrating heat pipes within PV panels to increase efficiency by 2.19% in order to restore the design power capacity specified in the previous design of the HCT Ecohouse, especially for PV panels operating in hot arid climates such as Oman. Furthermore, having heat pipes operating with water as the working fluid, as opposed to artificial refrigerants, underlines the suitability of this technology towards the development of sustainable solar energy in hot countries.
Author Contributions
Conceptualization, S.A.A.-M. and H.N.C.; methodology, S.A.A.-M., H.N.C. and M.S.G.; software, S.A.A.-M.; validation, S.A.A.-M.; formal analysis, S.A.A.-M.; investigation, H.N.C. and M.S.G.; resources, S.A.A.-M.; data curation, S.A.A.-M.; writing—original draft preparation, S.A.A.-M.; writing—review and editing, H.N.C. and M.S.G.; visualization, S.A.A.-M., H.N.C. and M.S.G.; supervision, H.N.C. and M.S.G.; project administration, H.N.C.; funding acquisition, S.A.A.-M.
Funding
This research received no external funding.
Acknowledgments
The authors would like to thank Heriot-Watt University and Higher Colleges of Technology, Oman for providing computational and experimental resources to carry out this research.
Conflicts of Interest
The authors declare no conflict of interest.
Nomenclature
| T | Temperature |
| °C | Degrees Celsius |
| K | Temperature Kelvin |
| Tcell | PV cell temperature |
| Tair | Ambient temperature |
| Pa | Pressure in Pascal, N/m2 |
| m2 | Square meter |
| k-e | k-epsilon |
| Kg/m3 | Density, Kilogram per cubic meter |
| m/s | Meter per second |
| mm | Millimeter |
| NOCT | Nominal operating cell temperature |
| S | Insolation level = 1 W/m2; ECO-House = 911 W/m2 |
| Sd/D | Streamwise distance-to-pipe diameter |
| D | Diameter, mm |
| kg/s | Kilogram per second |
| Watts/m2 | Watts per square meter |
| Kg/m-s | Viscosity, Kilogram per meter- second |
Abbreviations
| CFD | Computational Fluid Dynamics |
| PV | Photo Voltaic |
| EES | Engineering Equation Solver |
| HCT | Higher College of Technology |
| HPHE | Heat Pipe Heat Exchanger |
| HP | Heat Pipe |
References
- Kazem, H.A.; Chaichan, M.T. The effect of dust accumulation and cleaning methods on PV panels’ outcomes based on an experimental study of six locations in Northern Oman. Solar Energy 2019, 187, 30–38. [Google Scholar] [CrossRef]
- Gasparin, F.P.; Bühler, A.J.; Rampinelli, G.A.; Krenzinger, A. Statistical analysis of I–V curve parameters from photovoltaic modules. Solar Energy 2016, 131, 30–38. [Google Scholar] [CrossRef]
- Kapsalis, V.; Karamanis, D. On the effect of roof added photovoltaics on building’s energy demand. Energy Build. 2015, 108, 195–204. [Google Scholar] [CrossRef]
- Al-Sabounchi, A.; Yalyali, S.A.; Al-Thani, H. Design and performance evaluation of a photovoltaic grid-connected system in hot weather conditions. Renew. Energy 2013, 53, 71–78. [Google Scholar] [CrossRef]
- Al-Waeli, A.H.; Sopian, K.; Kazem, H.A.; Chaichan, M.T. Photovoltaic/Thermal (PV/T) systems: Status and future prospects. Renew. Sustain. Energy Rev. 2017, 77 (Suppl. C), 109–130. [Google Scholar] [CrossRef]
- Al-Mabsali, S.A.; Chaudhry, H.N.; Candido, J. Increasing the passive energy capacity of residential buildings with rooftop photovoltaic modules in hot and arid climates. In Proceedings of the 1st National Conference on Civil and Architectural Engineering, Sultan Qaboos University, Muscat, Oman, 26–28 March 2018. [Google Scholar]
- Nasir, S.; Al-Jabri, K. Mineral Industry in Oman: In Country Value. In Proceedings of the 5th Fujairah International Industrial Rocks and Mining Forum, Fujairah, UAE, 18–20 April 2017. [Google Scholar]
- Jouhara, H.; Milko, J.; Danielewicz, J.; Sayegh, M.A.; Szulgowska-Zgrzywa, M.; Ramos, J.B.; Lester, S.P. The performance of a novel flat heat pipe based thermal and PV/T (photovoltaic and thermal systems) solar collector that can be used as an energy-active building envelope material. Energy 2016, 108 (Suppl. C), 148–154. [Google Scholar] [CrossRef]
- Chaudhry, H.N. A study on optimising heat pipe geometrical parameters for sustainable passive cooling within the built environment. Appl. Therm. Eng. 2016, 93, 486–499. [Google Scholar] [CrossRef]
- Peng, Z.; Herfatmanesh, M.R.; Liu, Y. Cooled solar PV panels for output energy efficiency optimisation. Energy Convers. Manag. 2017, 150, 949–955. [Google Scholar] [CrossRef]
- Bahaidarah, H.M.S.; Baloch, A.A.B.; Gandhidasan, P. Uniform cooling of photovoltaic panels: A review. Renew. Sustain. Energy Rev. 2016, 57, 1520–1544. [Google Scholar] [CrossRef]
- Jouhara, H.; Chauhan, A.; Nannou, T.; Almahmoud, S.; Delpech, B.; Wrobel, L.C. Heat pipe based systems—Advances and applications. Energy 2017, 128, 729. [Google Scholar] [CrossRef]
- Bahaidarah, H.; Subhan, A.; Gandhidasan, P.; Rehman, S. Performance evaluation of a PV (photovoltaic) module by back surface water cooling for hot climatic conditions. Energy 2013, 59, 445–453. [Google Scholar] [CrossRef]
- Chaudhry, H.N.; Calautit, J.K.; Hughes, B.R. Optimisation and analysis of a heat pipe assisted low-energy passive cooling system. Energy Build. 2017, 143, 220–233. [Google Scholar] [CrossRef]
- Tripathy, M.; Yadav, S.; Panda, S.K.; Sadhu, P.K. Performance of building integrated photovoltaic thermal systems for the panels installed at optimum tilt angle. Renew. Energy 2017, 113, 1056–1069. [Google Scholar] [CrossRef]
- Tan, R.; Zhang, Z. Heat pipe structure on heat transfer and energy saving performance of the wall implanted with heat pipes during the heating season. Appl. Therm. Eng. 2016, 102, 633–640. [Google Scholar] [CrossRef]
- O’Hegarty, R.; Kinnane, O.; McCormack, S.J. Concrete solar collectors for façade integration: An experimental and numerical investigation. Appl. Energy 2017, 206, 1040–1061. [Google Scholar]


© 2019 by the authors. Licensee MDPI, Basel, Switzerland. This article is an open access article distributed under the terms and conditions of the Creative Commons Attribution (CC BY) license (http://creativecommons.org/licenses/by/4.0/).