Article

Empirical Modeling of the Viscosity of Supercritical Carbon Dioxide Foam Fracturing Fluid under Different Downhole Conditions

by
Shehzad Ahmed
1,*,
Khaled Abdalla Elraies
1,
Muhammad Rehan Hashmet
2 and
Mohamad Sahban Alnarabiji
3
1
Department of Petroleum Engineering, Universiti Teknologi PETRONAS, Seri Iskandar 32610, Perak, Malaysia
2
Department of Petroleum Engineering, The Petroleum Institute, Khalifa University of Science and Technology, 2533 Abu Dhabi, United Arab Emirate
3
Department of Chemical Engineering, Universiti Teknologi PETRONAS, Seri Iskandar 32610, Perak, Malaysia
*
Author to whom correspondence should be addressed.
Energies 2018, 11(4), 782; https://doi.org/10.3390/en11040782
Submission received: 12 January 2018 / Revised: 6 March 2018 / Accepted: 21 March 2018 / Published: 29 March 2018
(This article belongs to the Special Issue Unconventional Natural Gas (UNG) Recoveries 2018)

Abstract

:
High-quality supercritical CO2 (sCO2) foam as a fracturing fluid is considered ideal for fracturing shale gas reservoirs. The apparent viscosity of the fracturing fluid holds an important role and governs the efficiency of the fracturing process. In this study, the viscosity of sCO2 foam and its empirical correlations are presented as a function of temperature, pressure, and shear rate. A series of experiments were performed to investigate the effect of temperature, pressure, and shear rate on the apparent viscosity of sCO2 foam generated by a widely used mixed surfactant system. An advanced high pressure, high temperature (HPHT) foam rheometer was used to measure the apparent viscosity of the foam over a wide range of reservoir temperatures (40–120 °C), pressures (1000–2500 psi), and shear rates (10–500 s−1). A well-known power law model was modified to accommodate the individual and combined effect of temperature, pressure, and shear rate on the apparent viscosity of the foam. Flow indices of the power law were found to be a function of temperature, pressure, and shear rate. Nonlinear regression was also performed on the foam apparent viscosity data to develop these correlations. The newly developed correlations provide an accurate prediction of the foam’s apparent viscosity under different fracturing conditions. These correlations can be helpful for evaluating foam-fracturing efficiency by incorporating them into a fracturing simulator.

1. Introduction

Unconventional shales that contain huge amounts of stored reserves are difficult to produce due to their low permeability [1,2]. Enhanced recovery techniques, such as hydraulic fracturing, have been widely preferred to ease the gas flow. However, some complexities are still encountered during its application. Shales, as unconventional reservoirs, possess significant amounts of stored reserves that have drawn great attention. Hydraulic fracturing of shales is a technique that is widely known to unlock these stored reserves [3] and the fracturing fluids that are commonly used are polymer-based aqueous solutions. However, the application of polymers can plug the nanopores, which becomes a crucial issue [4,5,6,7,8,9]. Moreover, the fracturing process requires a high amount of fresh water during its application, it is susceptible to formation damage in water-sensitive regions, and it provides a reduction in liquid recovery [7,9]. Other methods have been considered as alternatives to enhancing gas production from shales: gas fracking or pneumatic fracking. This application has several advantages that can overcome the issues of water flowback, clay swelling, formation damage, and high water requirements [7,10,11]. The use of gas in the fracturing process also provides better performance in liquid phase recovery after use due to the expansion property of gas [11]. It will be more beneficial when the gas used has a relatively high ability to adsorb—as compared to CH4, for instance—CO2, leading to successful underground carbon sequestration [3,7,12,13,14,15,16,17].
However, the application of sCO2 as a fracturing fluid should be associated with other components that can reduce the effect of low CO2 viscosity and the limited ability in carrying proppant [8]. The generation of foam using CO2 and small amounts of liquid containing surfactant is highly advantageous in overcoming the limitations of individual gas fracturing applications. CO2 foam can provide high viscosity, good thermal stability, and better transport of proppant, maximize cleanup of proppant packed, reduce polymer loading, become an alternative to polymers and crosslinking gel utilization, control fractures, reduce fresh water usage, and it contains less health hazardous chemical additives [6,18,19]. It is of utmost importance that the generated foam during the fracturing process has high viscosity under reservoir design and operating conditions in order to complete the fracturing operation efficiently.
Foam flows as a train of gas bubbles separated by a thin film called a lamella, which increases the effective viscosity of the gaseous phase [20,21]. According to Bretherton’s theory of bubble flow in a capillary, lamellas in the foam are responsible for promoting resistance to the flow of gas [22]. Foam texture is a key parameter that controls the effective viscosity of the gas phase. A finer texture foam contains a larger number of lamellas, providing high resistance to the gas flow [23,24]. However, the foam flow in porous media is not solely controlled by foam texture as it is also impacted by pore throat and pore geometry [25]. There are different pore-level mechanisms of lamella creation and destruction that are responsible for the variation of foam texture within porous media and which results in foam bubble generation and coalescence [20,25,26,27].
The apparent viscosity of foam is determined by the contribution of (1) the amount of liquid between the bubbles, (2) the resistance to bubble deformation while passing through a capillary, (3) the surface tension gradient resulting in the surfactant active materials being swept from the bubble front and accumulating at the plateau border [21].
Some studies have identified methods to predict foam flow behavior in reservoirs according to implemented models that are able to account for the foam texture parameters, including the calibrated steady-state implicit texture model [25]. The model has provided a method for elucidating the scaling of foam flow parameters with respect to porous media properties [25]. Mezdour et al. quantified the individual effects of interface rheology and surface tension kinetics on the structure of the foam and presented models that can predict bubble size [28]. Investigations on foam rheology are very complex, as they need to initially consider the flow behavior of different types of fluids, liquids, and gases, in this case, prior to identifying foam flow resistance. Finding the relationship between macroscopic rheological behaviors, primarily the viscosity of the fluid mixture and the microstructure properties of the fluid, is considered a critical task. Due to the importance of providing an understanding of the rheological properties of a fluid mixture, a study has been conducted on the relation between the effective viscosity of a fluid and its microstructure. The effective viscosity averaging formula was derived, which provides some information regarding the microstructure of a mixture [29].
The focus of this study, however, was directed to identifying the effect of crucial factors—i.e., temperature, pressure, and shear rate—on the apparent viscosity of foam in a capillary as a method to provide an understanding on foam rheology under different fracturing scenarios. An insight of foam rheological behavior in bulk is crucial in the initial attempts to optimize the foam formulations and predict the foam’s performance at different reservoir conditions. The output can be further analyzed and the findings can be considered for further study in specific reservoir conditions, considering the porous media characteristics.
Foam rheology is considered as a complex task; foam flow behavior is challenging to predict [11]. The rheology of the foam has a significant effect on the performance of foam fracturing and the process efficiency is reliant on the non-Newtonian behavior of foam [30,31]. There are different models to describe the flow behavior of foam. The most widely used model is Ostwald–de Waele or power law model [5,30,32,33,34,35,36,37] and it is mathematically represented by Equation (1):
μ = K γ n 1
where K is the flow consistency index, γ is the shear rate, n is the flow behavior index, and µ is the foam viscosity.
The apparent viscosity of foam is a strong function of various process variables, which include reservoir temperature, reservoir pressure, foam quality, salinity, shear rate, and chemical additives and their concentrations [5,30,31], and it is important to conduct controlled experiments in order to study the effect of each process variable.
A metastable foam system undergoes spontaneous coarsening and collapse due to the liquid drainage from the foam lamella and plateau border [38]. Foam is more stable when the viscosity of the foaming solution is high [39]. Due to temperature increases, thermal thinning and foam film thickening occur, which quickly drains liquid in the lamellas [40]. At elevated temperatures, foam lamella drainage and bubble coalescence are fast, which causes a significant drop in foam viscosity [5,40,41,42]. Besides this, high fluctuations in temperature cause holes in the lamella because the foam undergoes high lamella rupture and bubble coalescence occurs [42]. Therefore, the apparent viscosity of sCO2 foam is expected to decrease with rising temperature [5,33].
As the pressure increases, the foam bubbles become smaller and smaller while the foam film becomes larger and thinner, resulting in slow drainage [39]. Therefore, at high pressure, foams are more stable and have high apparent viscosity [5]; however, extremely high pressure may break the foam bubbles and lamellas [39].
The aims of this study were to investigate the effect of temperature, pressure, and shear rate on the apparent viscosity of sCO2 foam and to present an empirical model for foam apparent viscosity as a function of temperature, pressure, and shear rate. For this purpose, foam generation was performed using the widely used alpha olefin sulfonate (AOS) and a foam stabilizer (i.e., betaine) and foam viscosity was measured using a high pressure, high temperature foam rheometer. A series of experiments were performed and a wide range of temperatures (40–120 °C), pressures (1000–2500 psi), and shear rates (10–500 s−1) were considered.

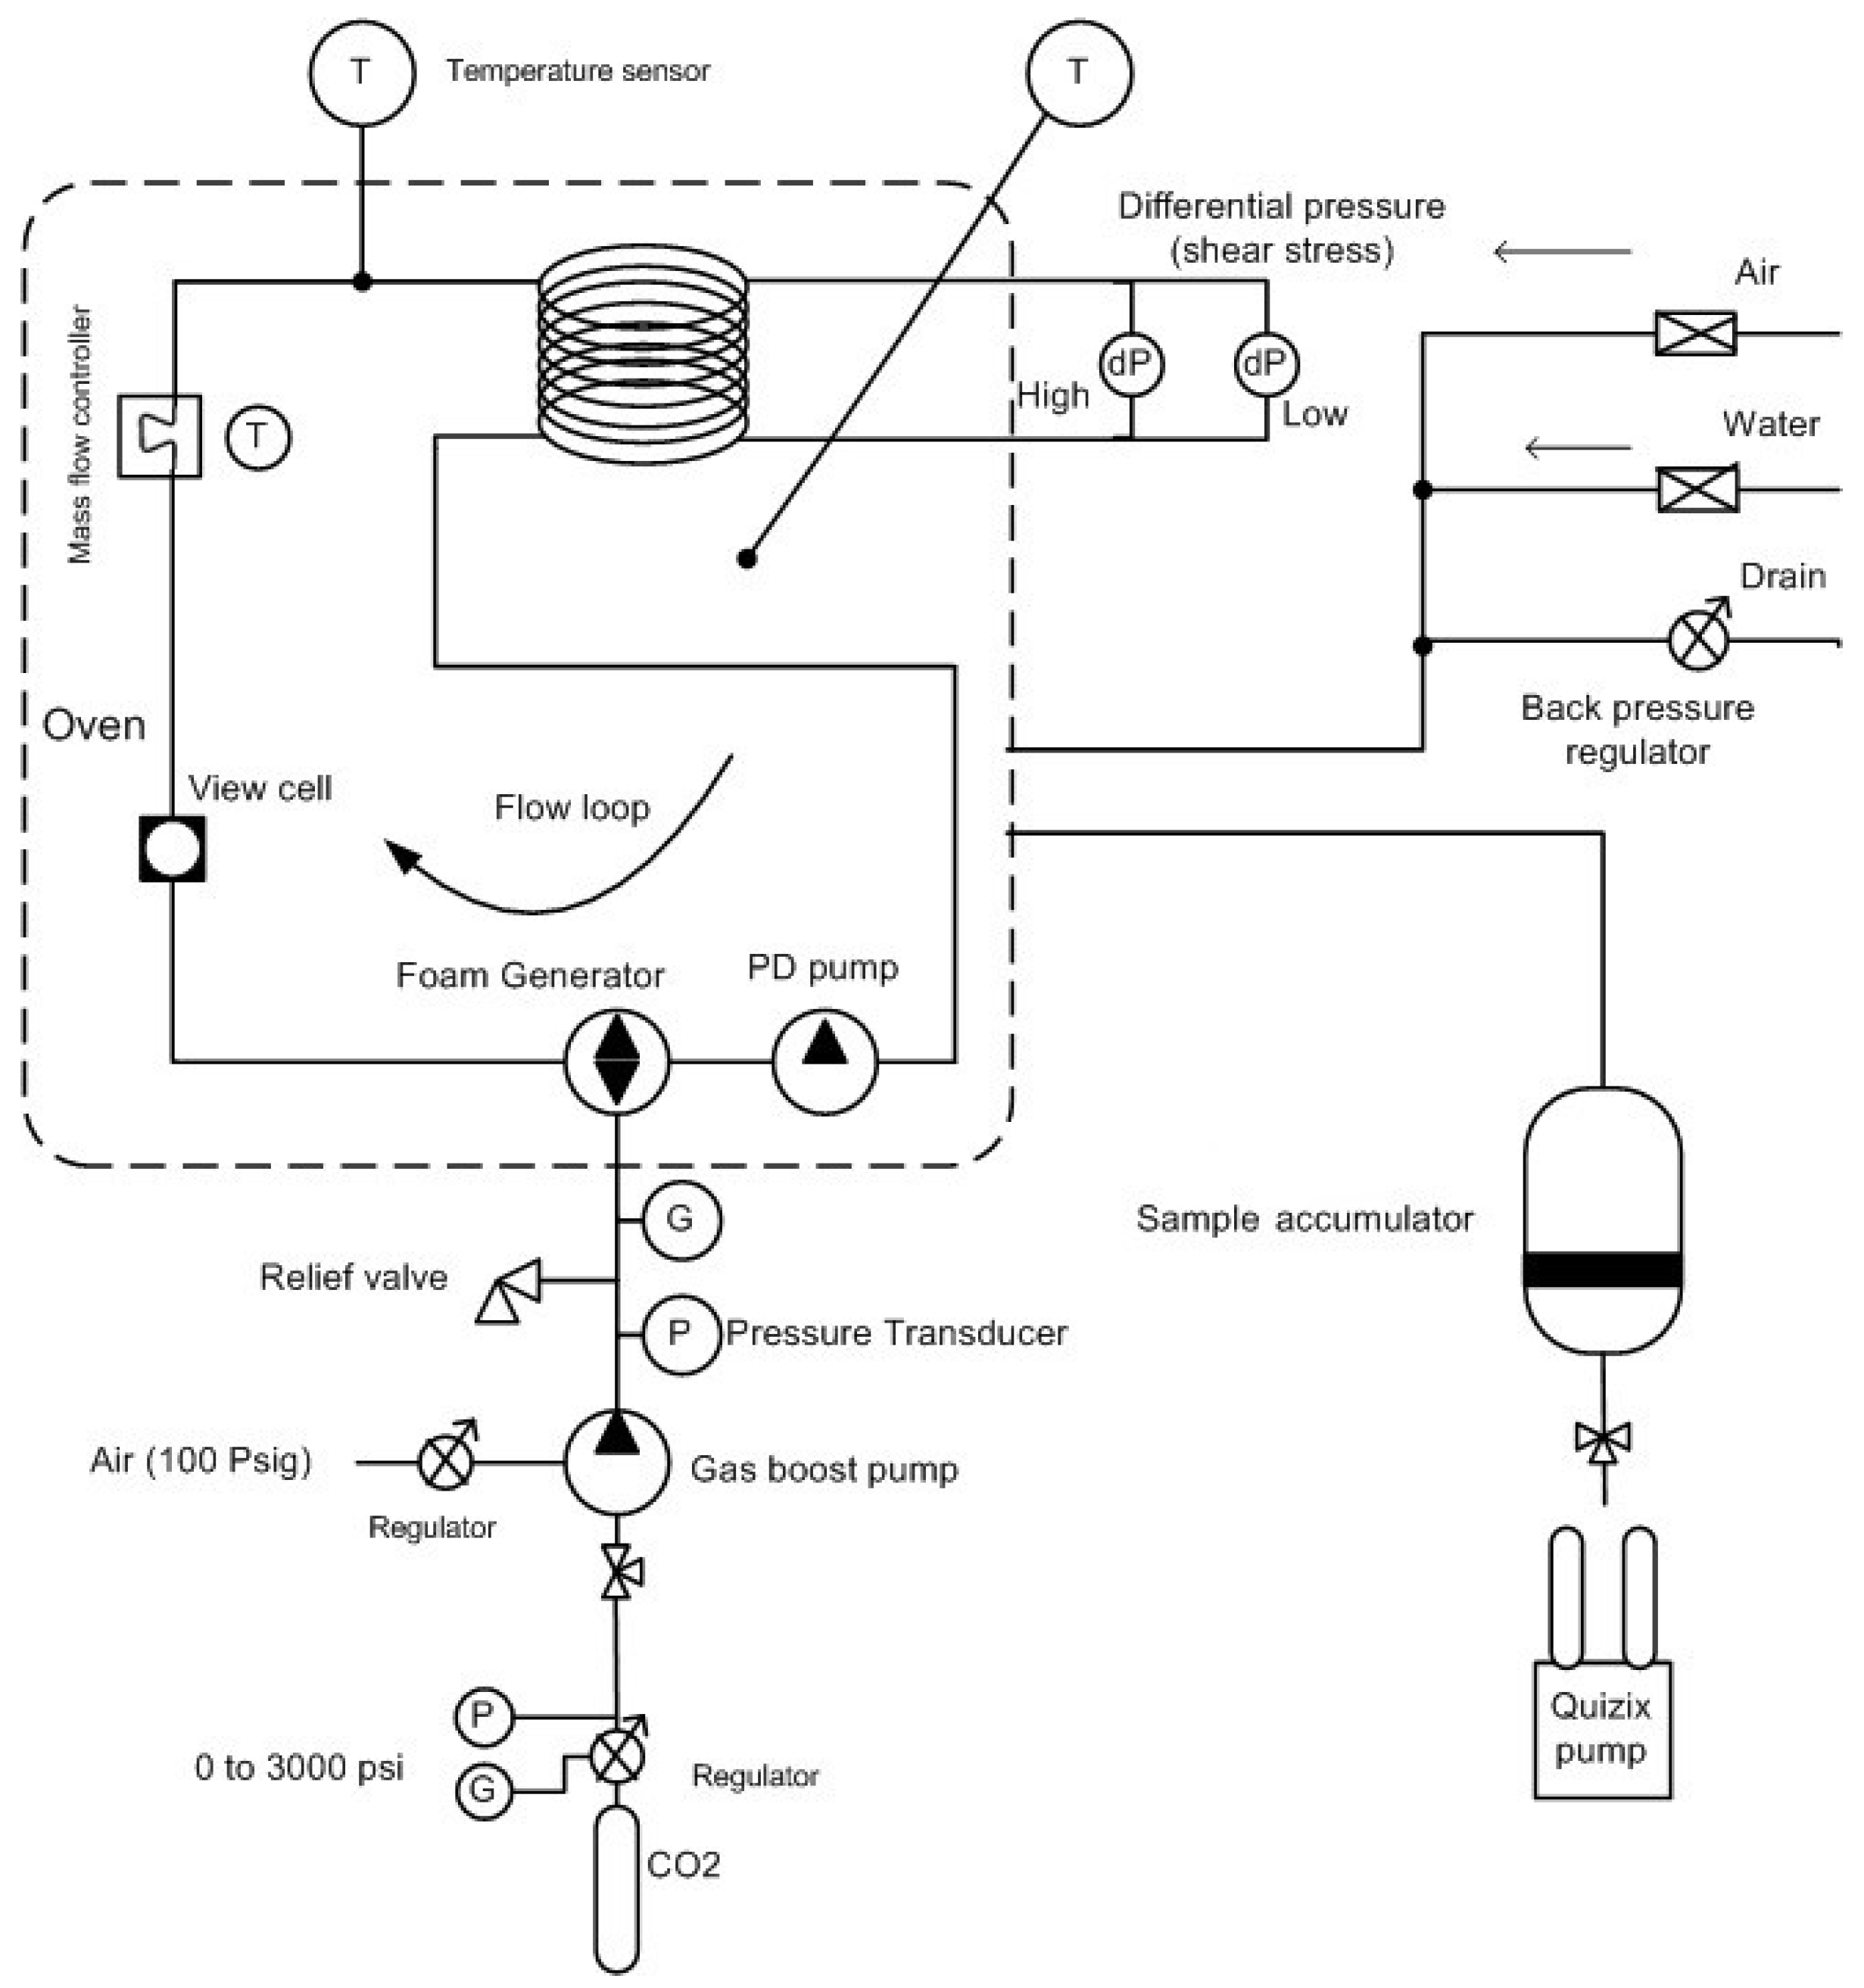
2. Experimental Methodology

In this research, the main agents used for foam generation were alpha olefin sulfonate (AOS) and betaine. AOS is currently the most widely used commercial anionic foam. It was supplied by Akzonobel (Amsterdam, Netherlands) and its commercial name is Witconate AOS. Betaine was used to stabilize the foam and it was supplied by Evonik Industries (Essen, Germany) with the commercial name TEGO Betaine C 60. The percentage purity of AOS and betaine was 39% and 32.6%, respectively. The concentration of both agents (i.e., AOS and betaine) was fixed to 0.5 wt % so the concentration ratio was 1:1. All the surfactant solutions were prepared in 3 wt % NaCl.
A wide range of reservoir temperatures (i.e., 40 °C to 120 °C) and pressures (1000 to 2500 psi) conditions were considered in this study. The gas phase utilized was purified carbon dioxide (i.e., 99.99% pure). At the experimental conditions, CO2 is in a supercritical form where it shows unique physical properties and holds both diffusivity of gas as well as solvating power of liquids [18,30].
In this research, an automated high pressure, high temperature equipment—i.e., a pressurized foam rheometer (Ametak Chandler Engineering)—was used to measure the rheology of foam over a wide range of shear rates, temperatures, and pressures. It had a recirculating loop made of a small diameter and length for flowing foam during which pressure drop over the length was recorded. The pressure drop values were used to compute foam apparent viscosity. The foam loop was fixed in an oven where the foam was subjected to elevated temperatures at high pressure. The system was equipped with several devices including a CCD camera attached to the high pressure and high temperature view cell, Coriolis mass flow meter, positive displacement (PD) pump, foam generator, pressure and temperature sensors, gas booster pump, backpressure regulator, and Hastelloy C276 tubing as the test section. The length and internal diameter of the test section was 304.8 cm and 0.775 cm. A general system diagram of a pressurized foam rheometer is shown in Figure 1.
The test procedure included the following steps.
  • Test was started with a clean, empty, and properly vacuumed loop. The backpressure regulator was ensured to be in a closed position. Oven was set to testing temperature.
  • A Quizex pump was used to displace foaming fluids from the accumulator to the loop until the desired pressure was reached.
  • The PD pump was then operated at 500 s−1 and the foam generator attached was opened at 50 to 100% of its speed.
  • The needle valve was opened and the liquid in the loop was gradually discharged into a graduated cylinder.
  • While discharging the liquid, the loop pressure was maintained to the testing pressure by injecting CO2. A gas booster was used to reach the higher pressure. This step generated the desired foam quality that was fixed to 80% in all the tests performed [43].
  • Foam circulation was continued at any testing shear rate until a stable density foam with uniform texture appeared.
  • The system software recorded the differential pressure reading at each shear rate tested and calculated the foam apparent viscosity using Equation (2).
  • Foam circulation was continued at any testing shear rate until a stable density foam with uniform texture appeared.
The equation governing the viscometric measurements is as follow in Equation (2) [23,44]:
μ a = ( D Δ P 4 L ) / ( 8 υ D )
where υ is the velocity (cm/s), D is the tube inside diameter (cm), L is the tubing length (cm), ΔP is the differential pressure between the test sections (psi), and µa is the fluid apparent viscosity (cP).
9.
The equipment stored all the data that was used for generating the required apparent viscosity plots presented in the next section.

3. Results and Discussion

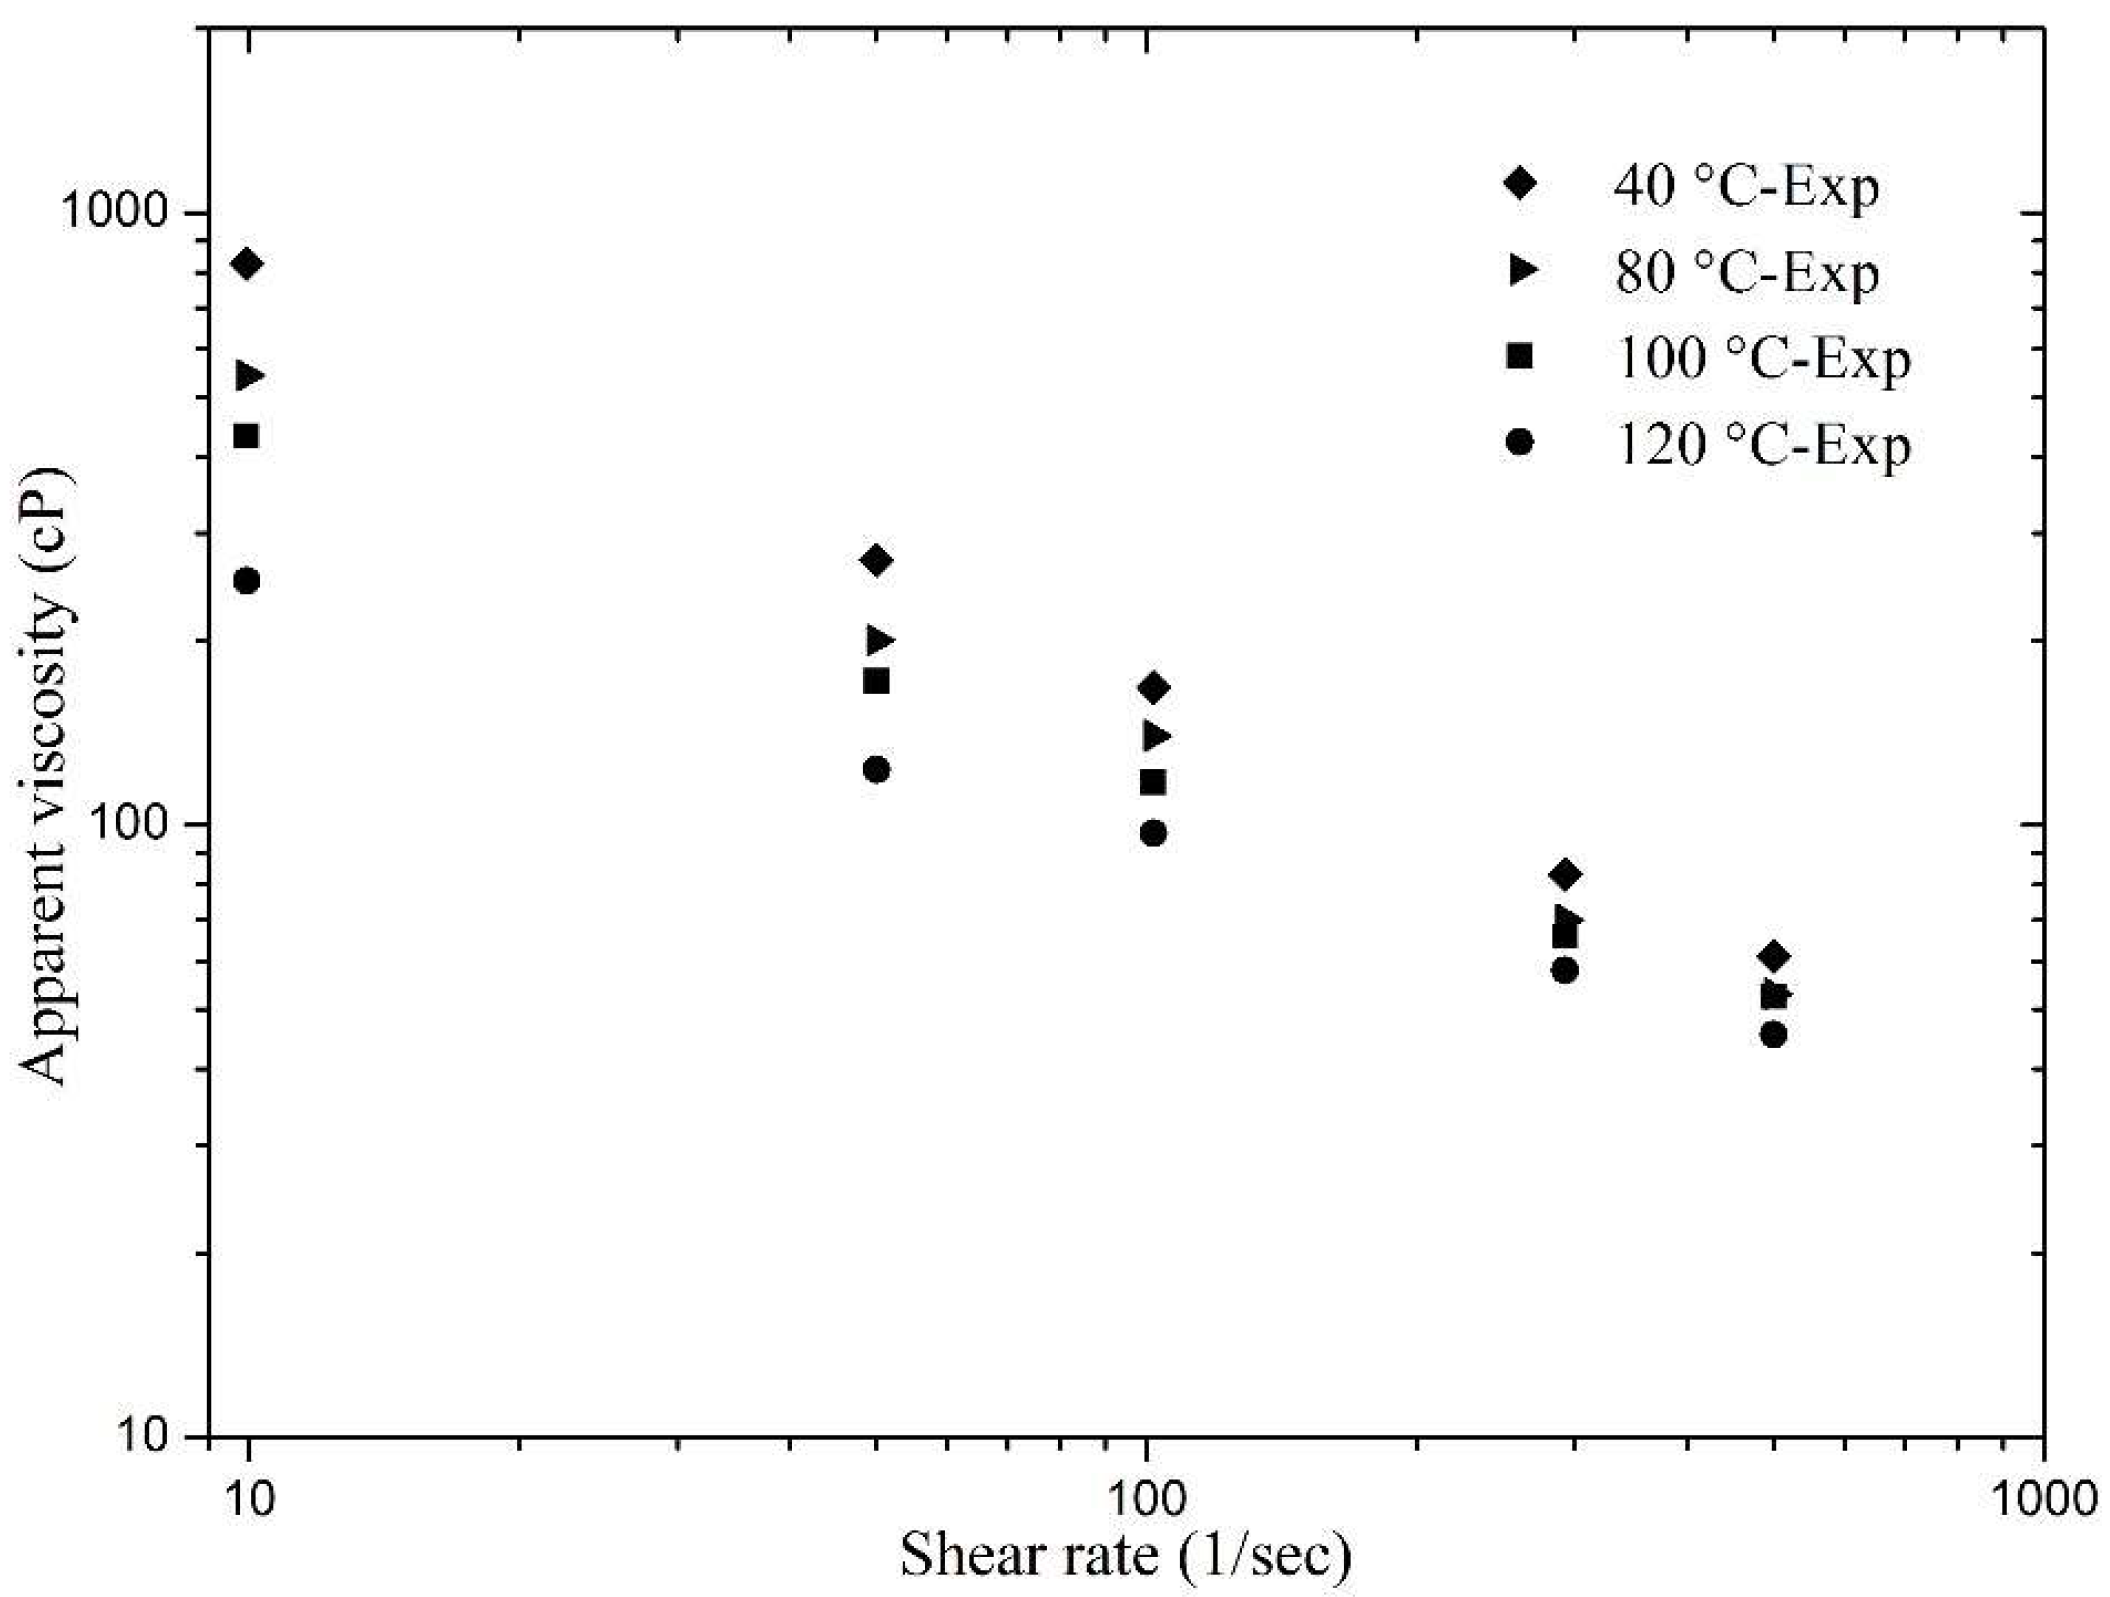
3.1. Effect of Shear Rate

Initially, the variation in sCO2 foam apparent viscosity was studied as a function of shear rate under HPHT conditions. Figure 1 and Figure 2 present the foam viscosity at different shear rates. The viscosity changes due to shear rate variation were modeled using a famous power law model. All the foams showed a typical shear thinning behavior in the tested shear rate range, i.e., 10 s−1 to 500 s−1. The trend of shear rate versus viscosity was found to be a straight line on a logarithmic plot having a negative slope. Foam apparent viscosity varies as a function of temperature and pressure. These two factors cause a change in foam bubble geometry and arrangement. Coarse and non-uniform foam bubbles that appear at high foam quality provide high resistance to flow, resulting in an increased apparent viscosity [23,24,45,46].
Different datasets varying the temperature and pressure shown in Table 1 were obtained from the viscometric tests and the power law model was fitted on the experimental data. Nonlinear regression analysis was performed on the obtained data, which appears to be a straight line. The parametric estimates (i.e., K and n) found by power law model fitting (shown in Equation (1)) are presented in Table 1. This table also includes R2 values, also known as the coefficient of determination. This coefficient was found to be close to unity in all of the cases, which indicates good fitting of the power law.

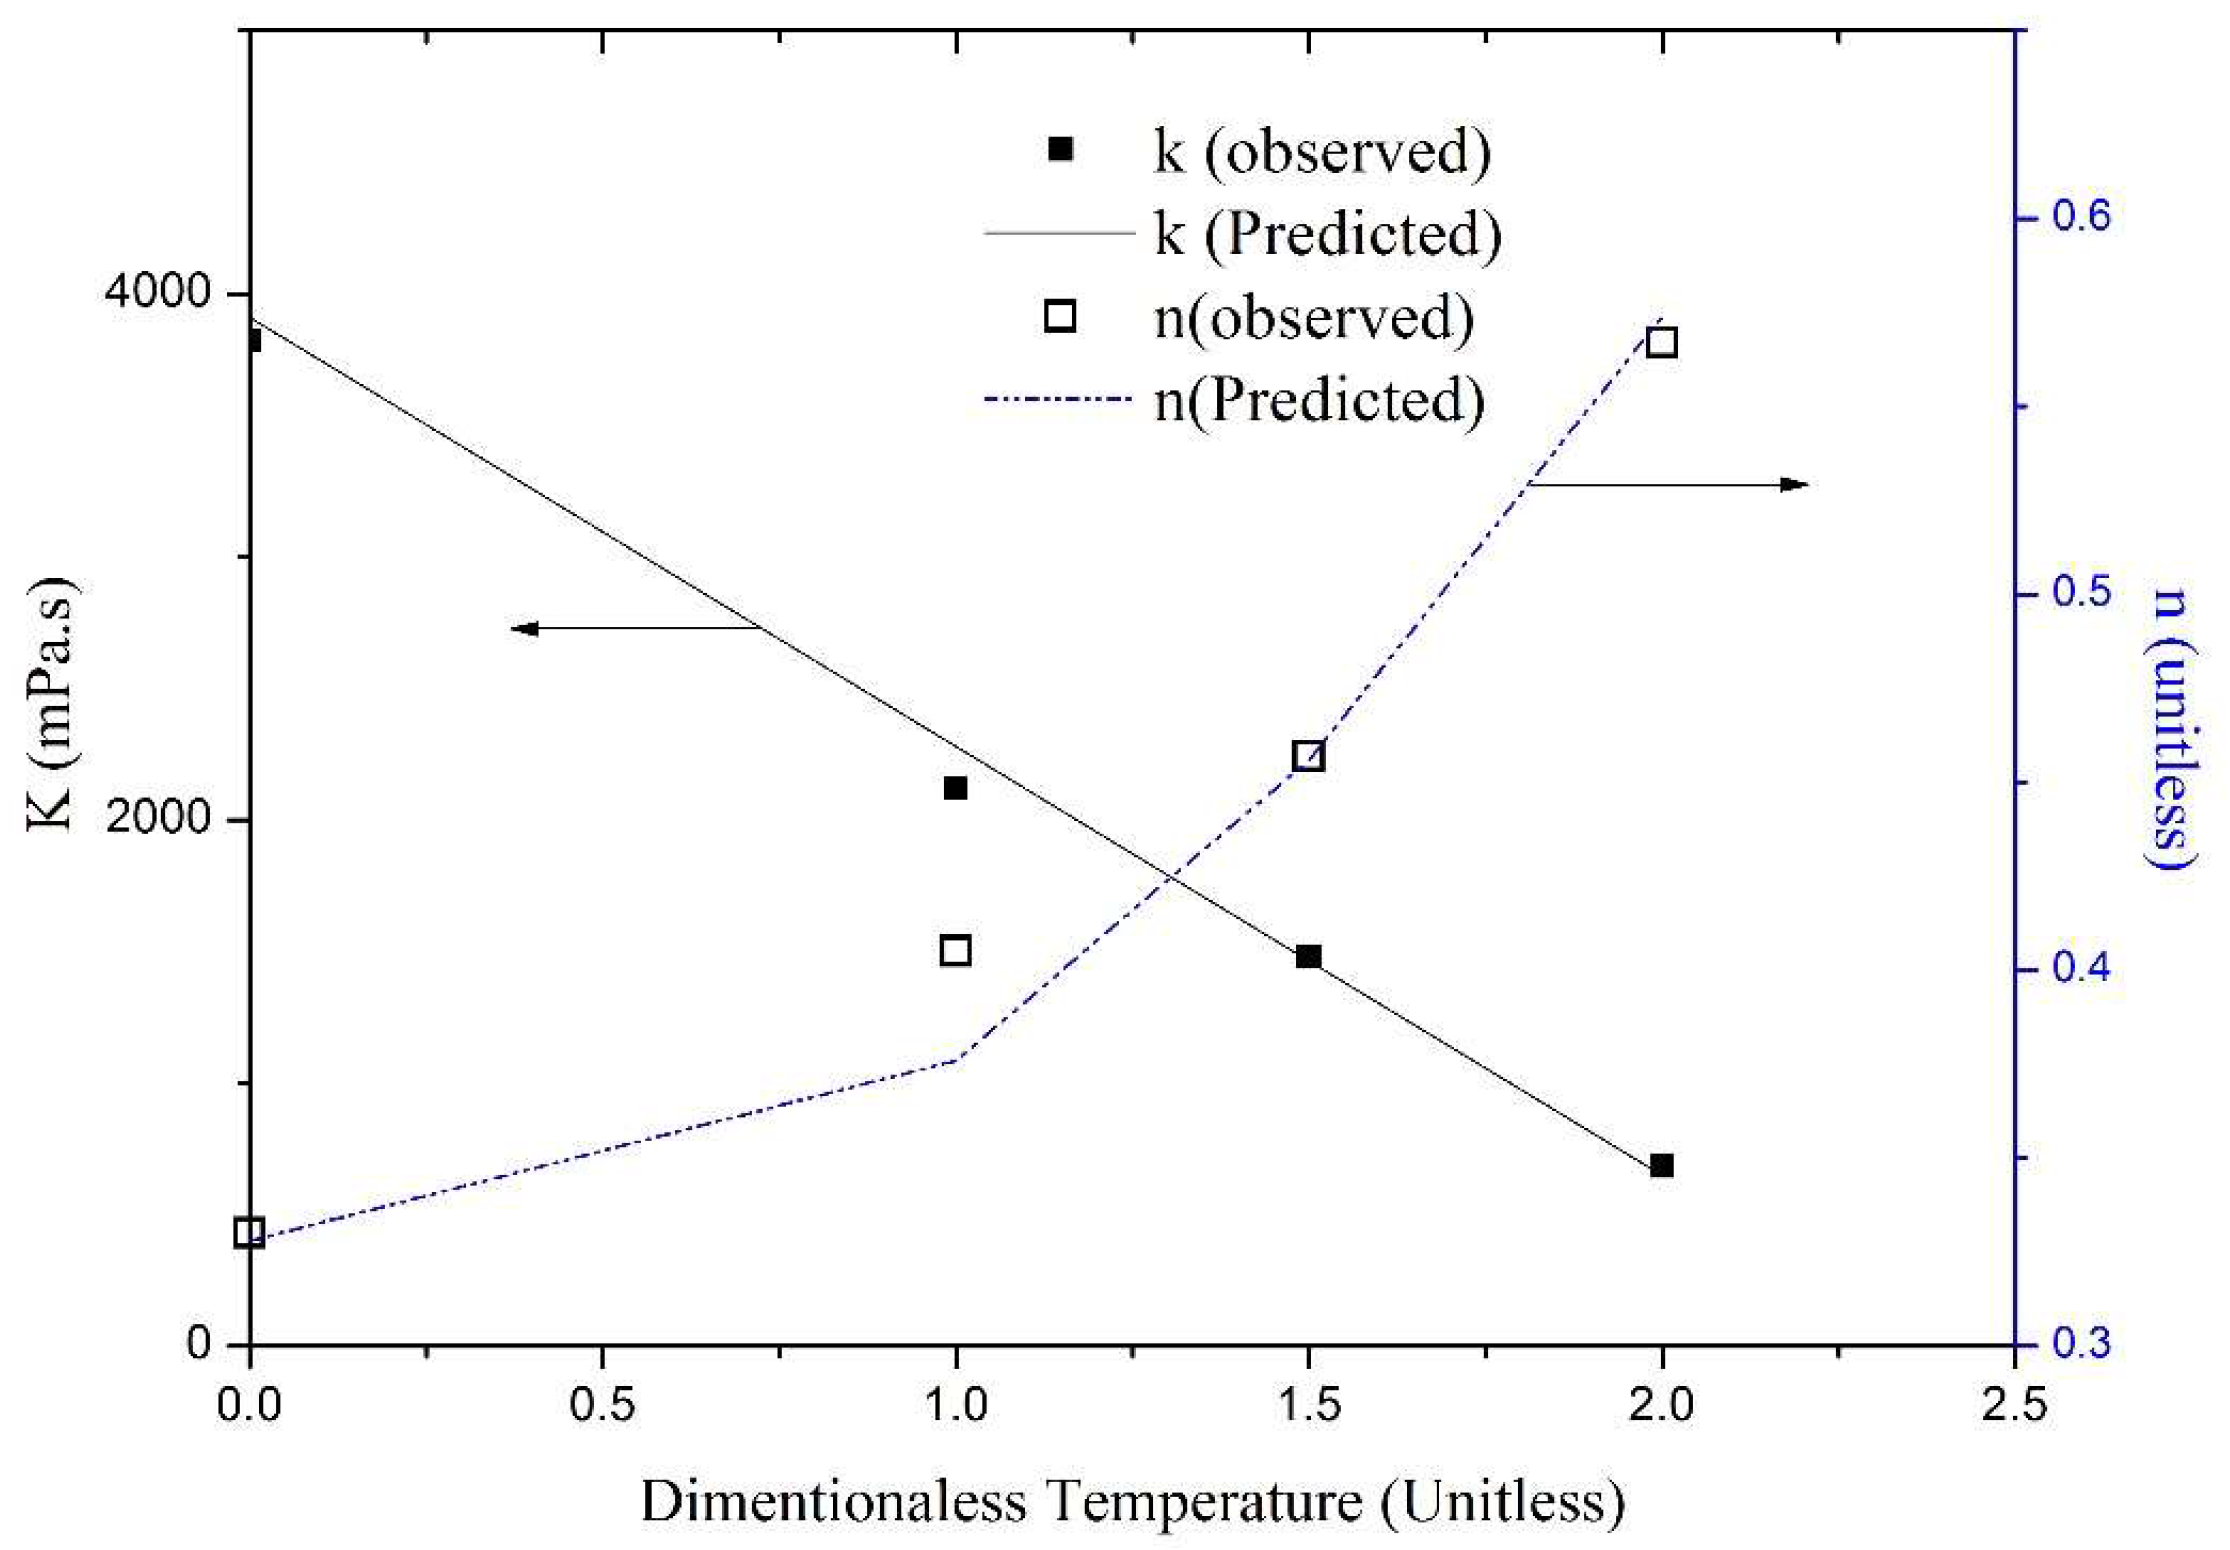
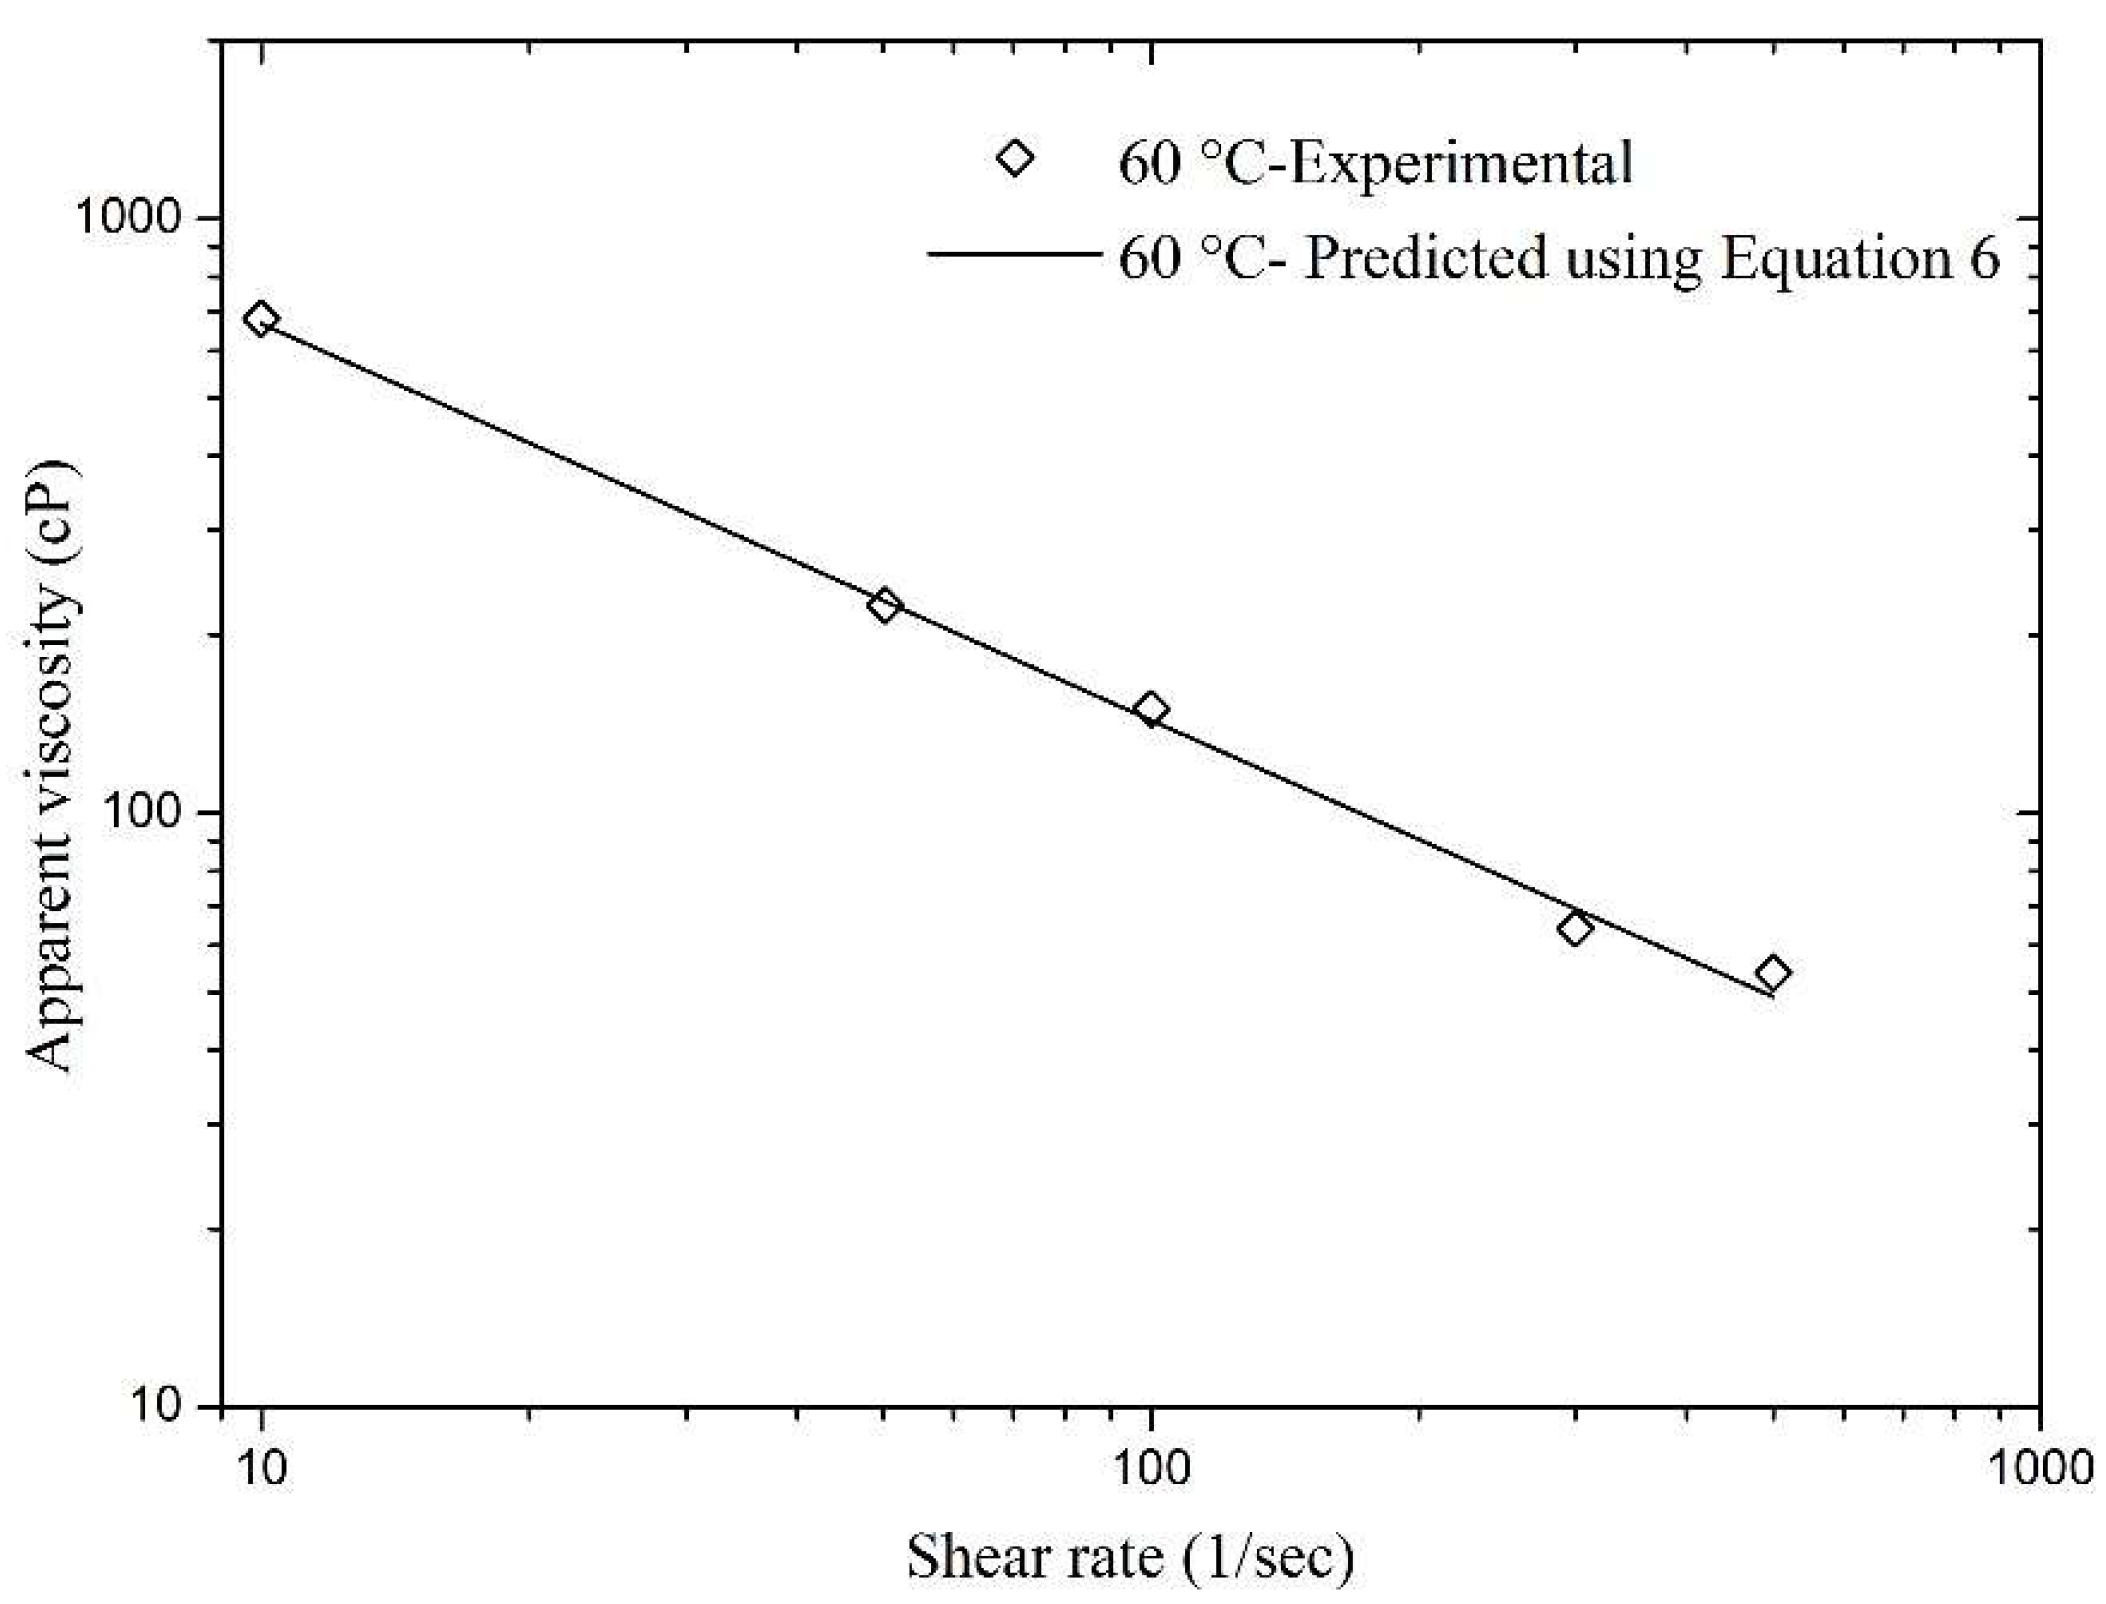
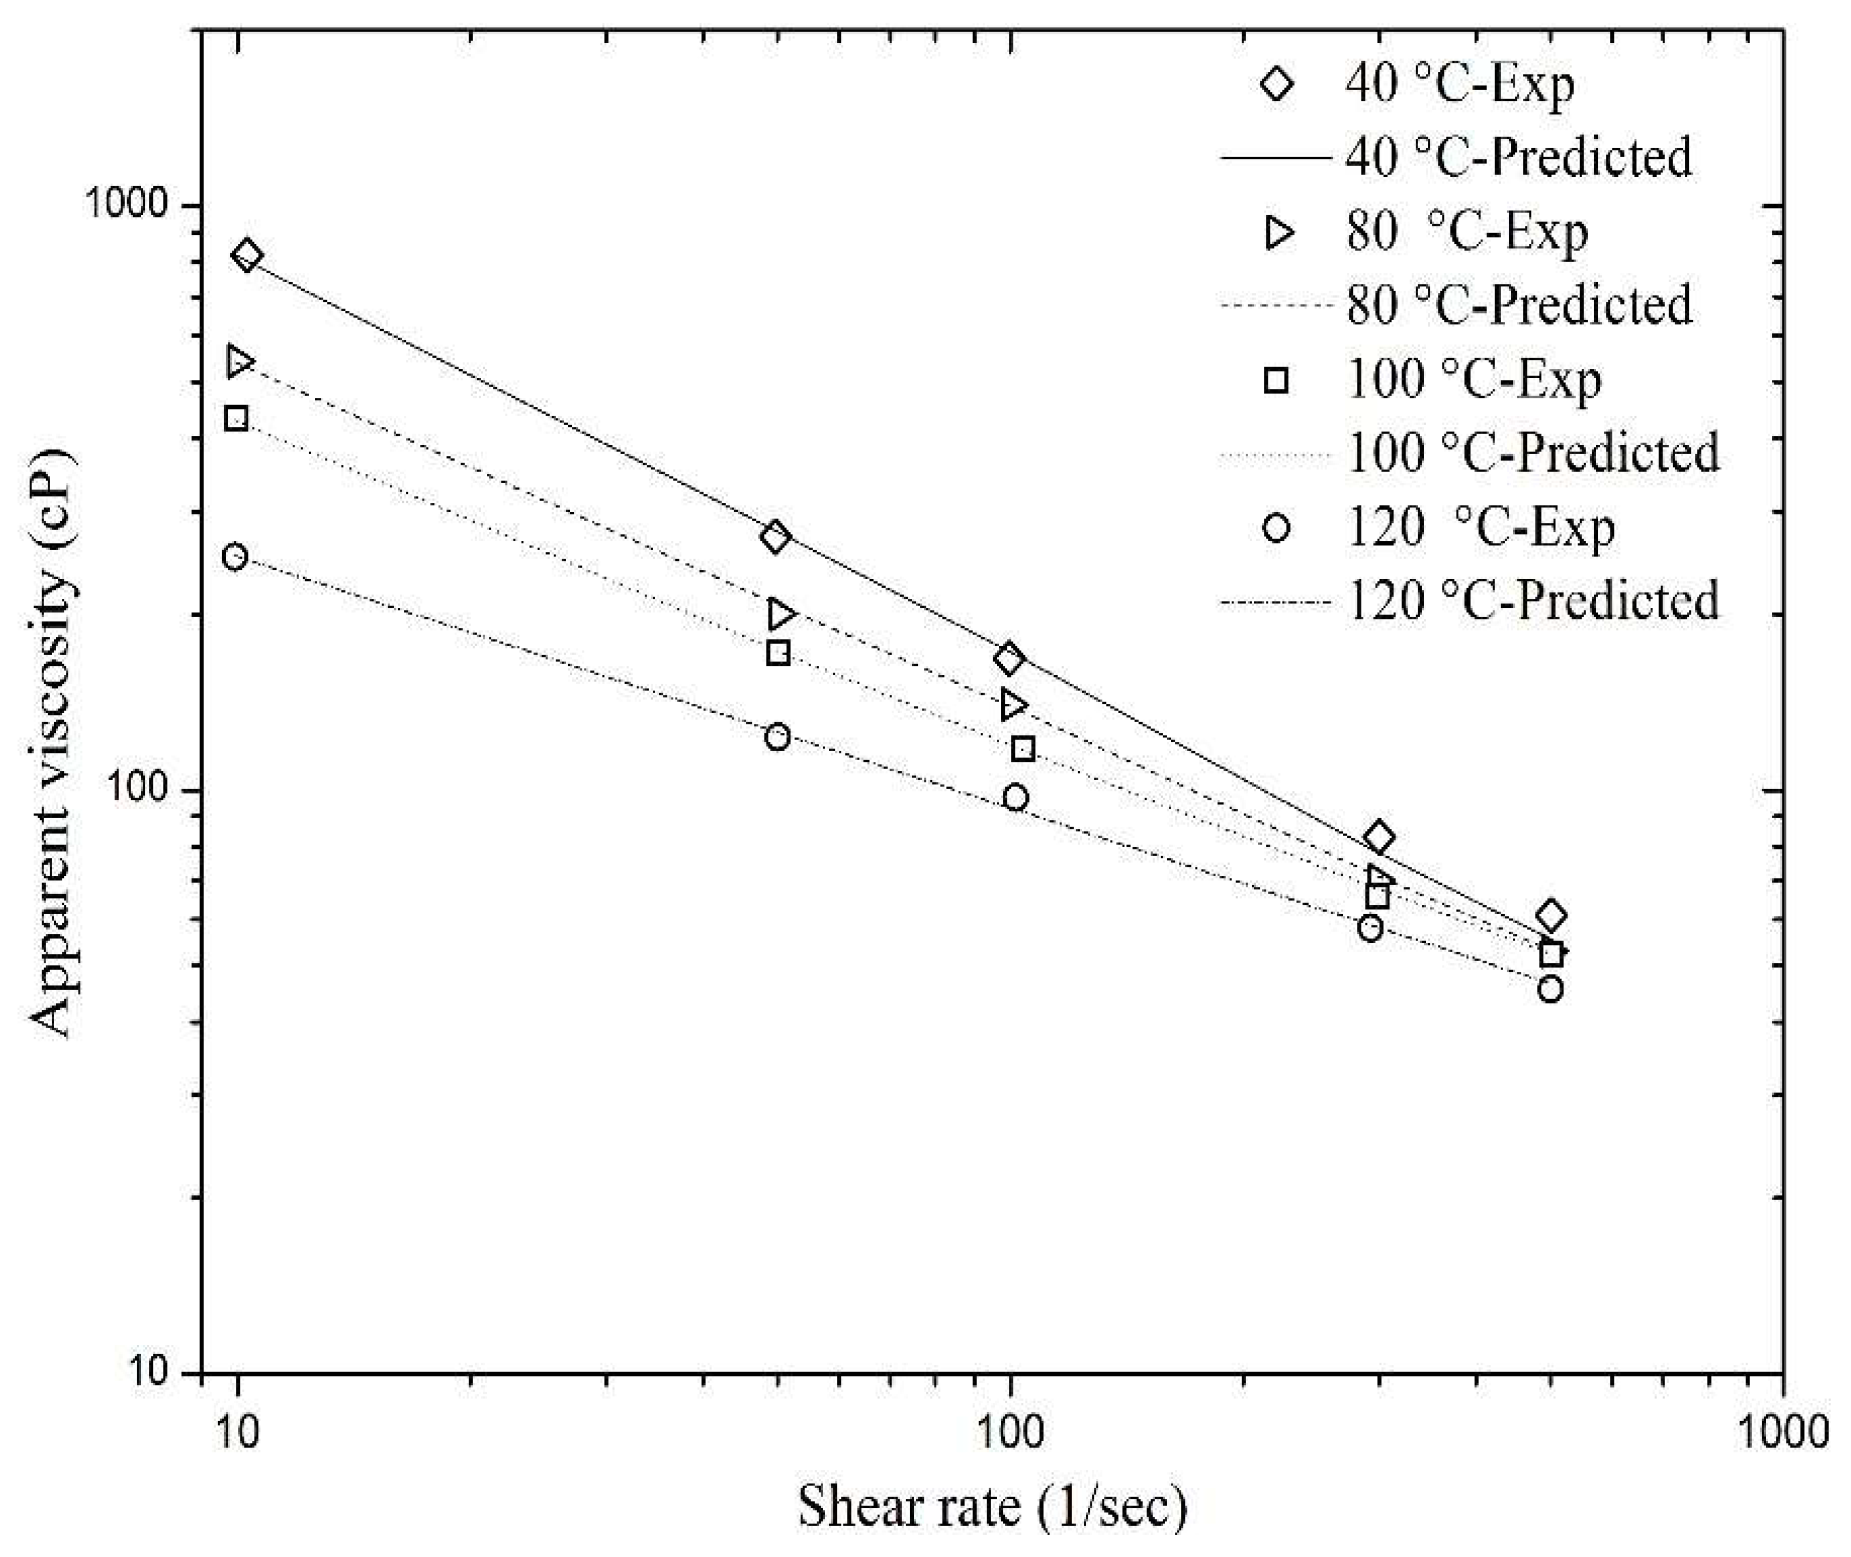
3.2. Effect of Temperature

Reservoir temperature influences the performance of sCO2 foam. A wide range of reservoir temperatures (40 °C to 120 °C) was considered and the change in the behavior of foam apparent viscosity is presented. Four solutions with a mixed surfactant system (i.e., 0.5 wt % AOS and 0.5 wt % betaine) were considered and the experiments were performed at a fixed pressure of 1500 psi. The testing conditions chosen for Set A are listed in Table 1.
Figure 2 shows the apparent viscosity of sCO2 foam with increasing temperature and shear rate. The highest foam apparent viscosity was found at 40 °C and a remarkable increase in viscosity was noticed at low shear rates. A temperature increase assists in foam destabilization [40]. This is due to thermal thinning of the foam film with a temperature increase, which quickly drains away foam lamella and drops the foam viscosity resulting in weak foam [40,47]. Structural changes that include lamella rupture and bubble coalescence occur more rapidly in foam bubbles as the foam film becomes thin due to the increment in temperature [5,40,41,42]. The effect of temperature on foam viscosity was more prominent at low shear rates. This is due to decreased shear heat at a low shear rate, which has a minimal effect on foam apparent viscosity [48]. At a high shear rate, the shear heat also increases and its influence on foam apparent viscosity also increases [48]. It is also noticed that the decreasing trend of apparent viscosity with the increase in temperature at any particular fixed shear rate is linear.
A dimensionless parameter Tref has been introduced in this paper that defines the base temperature and as temperature changes, it quantifies vertical as well as horizontal shift. It is defined as [49]:
T D = ( T T r e f ) T r e f
where TD is a dimensionless temperature (unitless), T is the testing temperature (°C), and Tref is the reference temperature (°C). In this study, 40 °C was selected as the reference temperature.
By keeping all other parameters fixed and generating foam at different temperatures, the viscometric analysis depicts that the values of K and n in the power law model change. The parameter K was found to change linearly with respect to dimensionless temperature as shown in Figure 3, and Equation (4) (i.e., a linear equation) was fitted to the experimental data. The curve estimation shows that the power law index “n” varied quadratically with the change in dimensionless temperature, as presented in Equation (5). Figure 3 presents a plot of K and n together with their predicted values (using Equations (4) and (5), respectively). It is clear that the matches between predicted and observed values are good and acceptable. Therefore, the proposed power law model where the value of K and n can be represented as a function of dimensionless temperature is given by Equations (4) and (5), respectively:
K = a 1 T D + a 2
n = b 1 T D 2 + b 2 T D + b 3
The power law model that has been modified to present the relation between dimensionless temperature and shear rate is shown in Equation (6):
μ = ( a 1 T D + a 2 ) γ ( b 1 T D 2 + b 2 T D + b 3 ) 1
where a1, a2, b1, b2, and b3 are the parameter coefficients that were estimated by performing nonlinear regression on the experimental data of foam viscosity (shown in Figure 2), considering a modified power law model, i.e., Equation (6). The parametric estimates given by this equation are presented in Table 2. An R2 value for this case was 0.999, representing Equation (6) as a good model for the experimental data. The Pearson Chi-square test was performed to check the goodness of fit of the predicted values using Equation (6) and the experimental data. The Pearson Chi-square value obtained was 4.658 and the model was checked within 95% confidence interval. The value of p was found to be 0.999, which indicates a good fit of the experimental data. The matches obtained using viscometric data of sCO2 foam and the viscosity values predicted using Equation (6) are shown in Figure 4. It is clear that the viscosity prediction is quite good and the predicted and observed values overlap, showing an excellent match.
Validation of this modified model (Equation (6)) was also performed and shown in Figure 5. This experimental data was not employed in nonlinear regression to estimate the values of equation parameters. The maximum relative error was calculated, which was less than 9.09%, indicating Equation (6) to be a good predictor of sCO2 foam apparent viscosity.

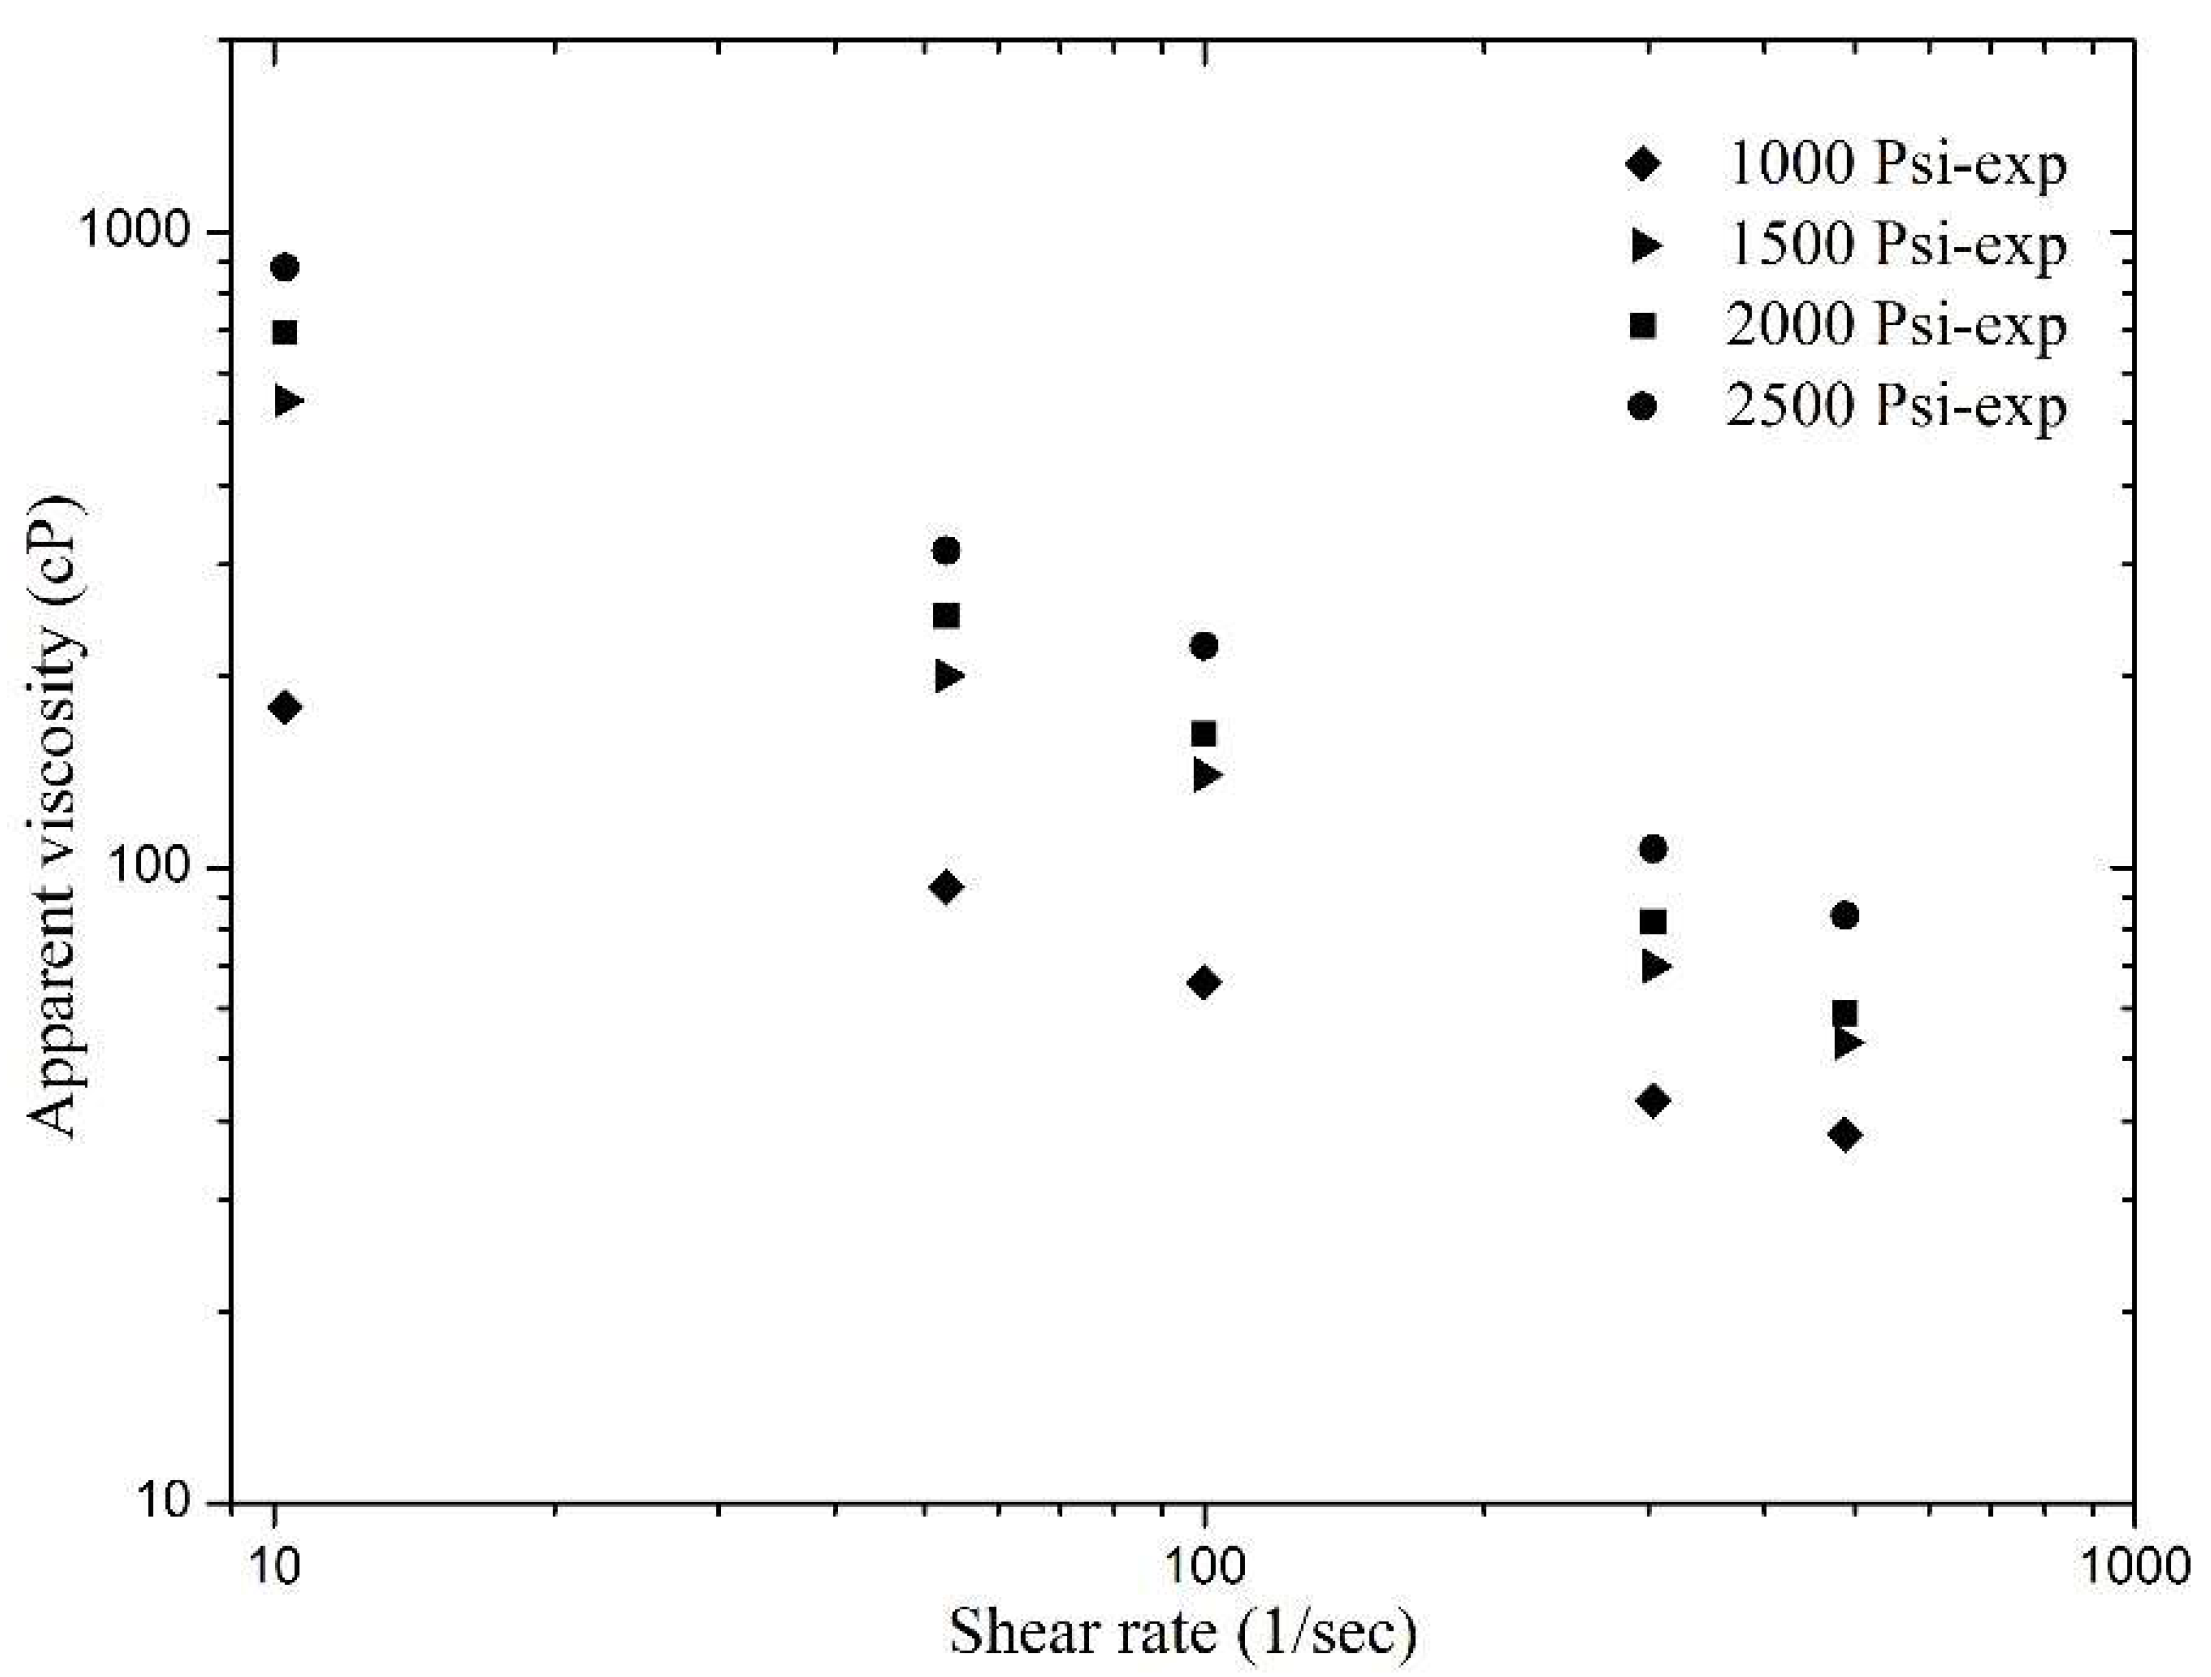
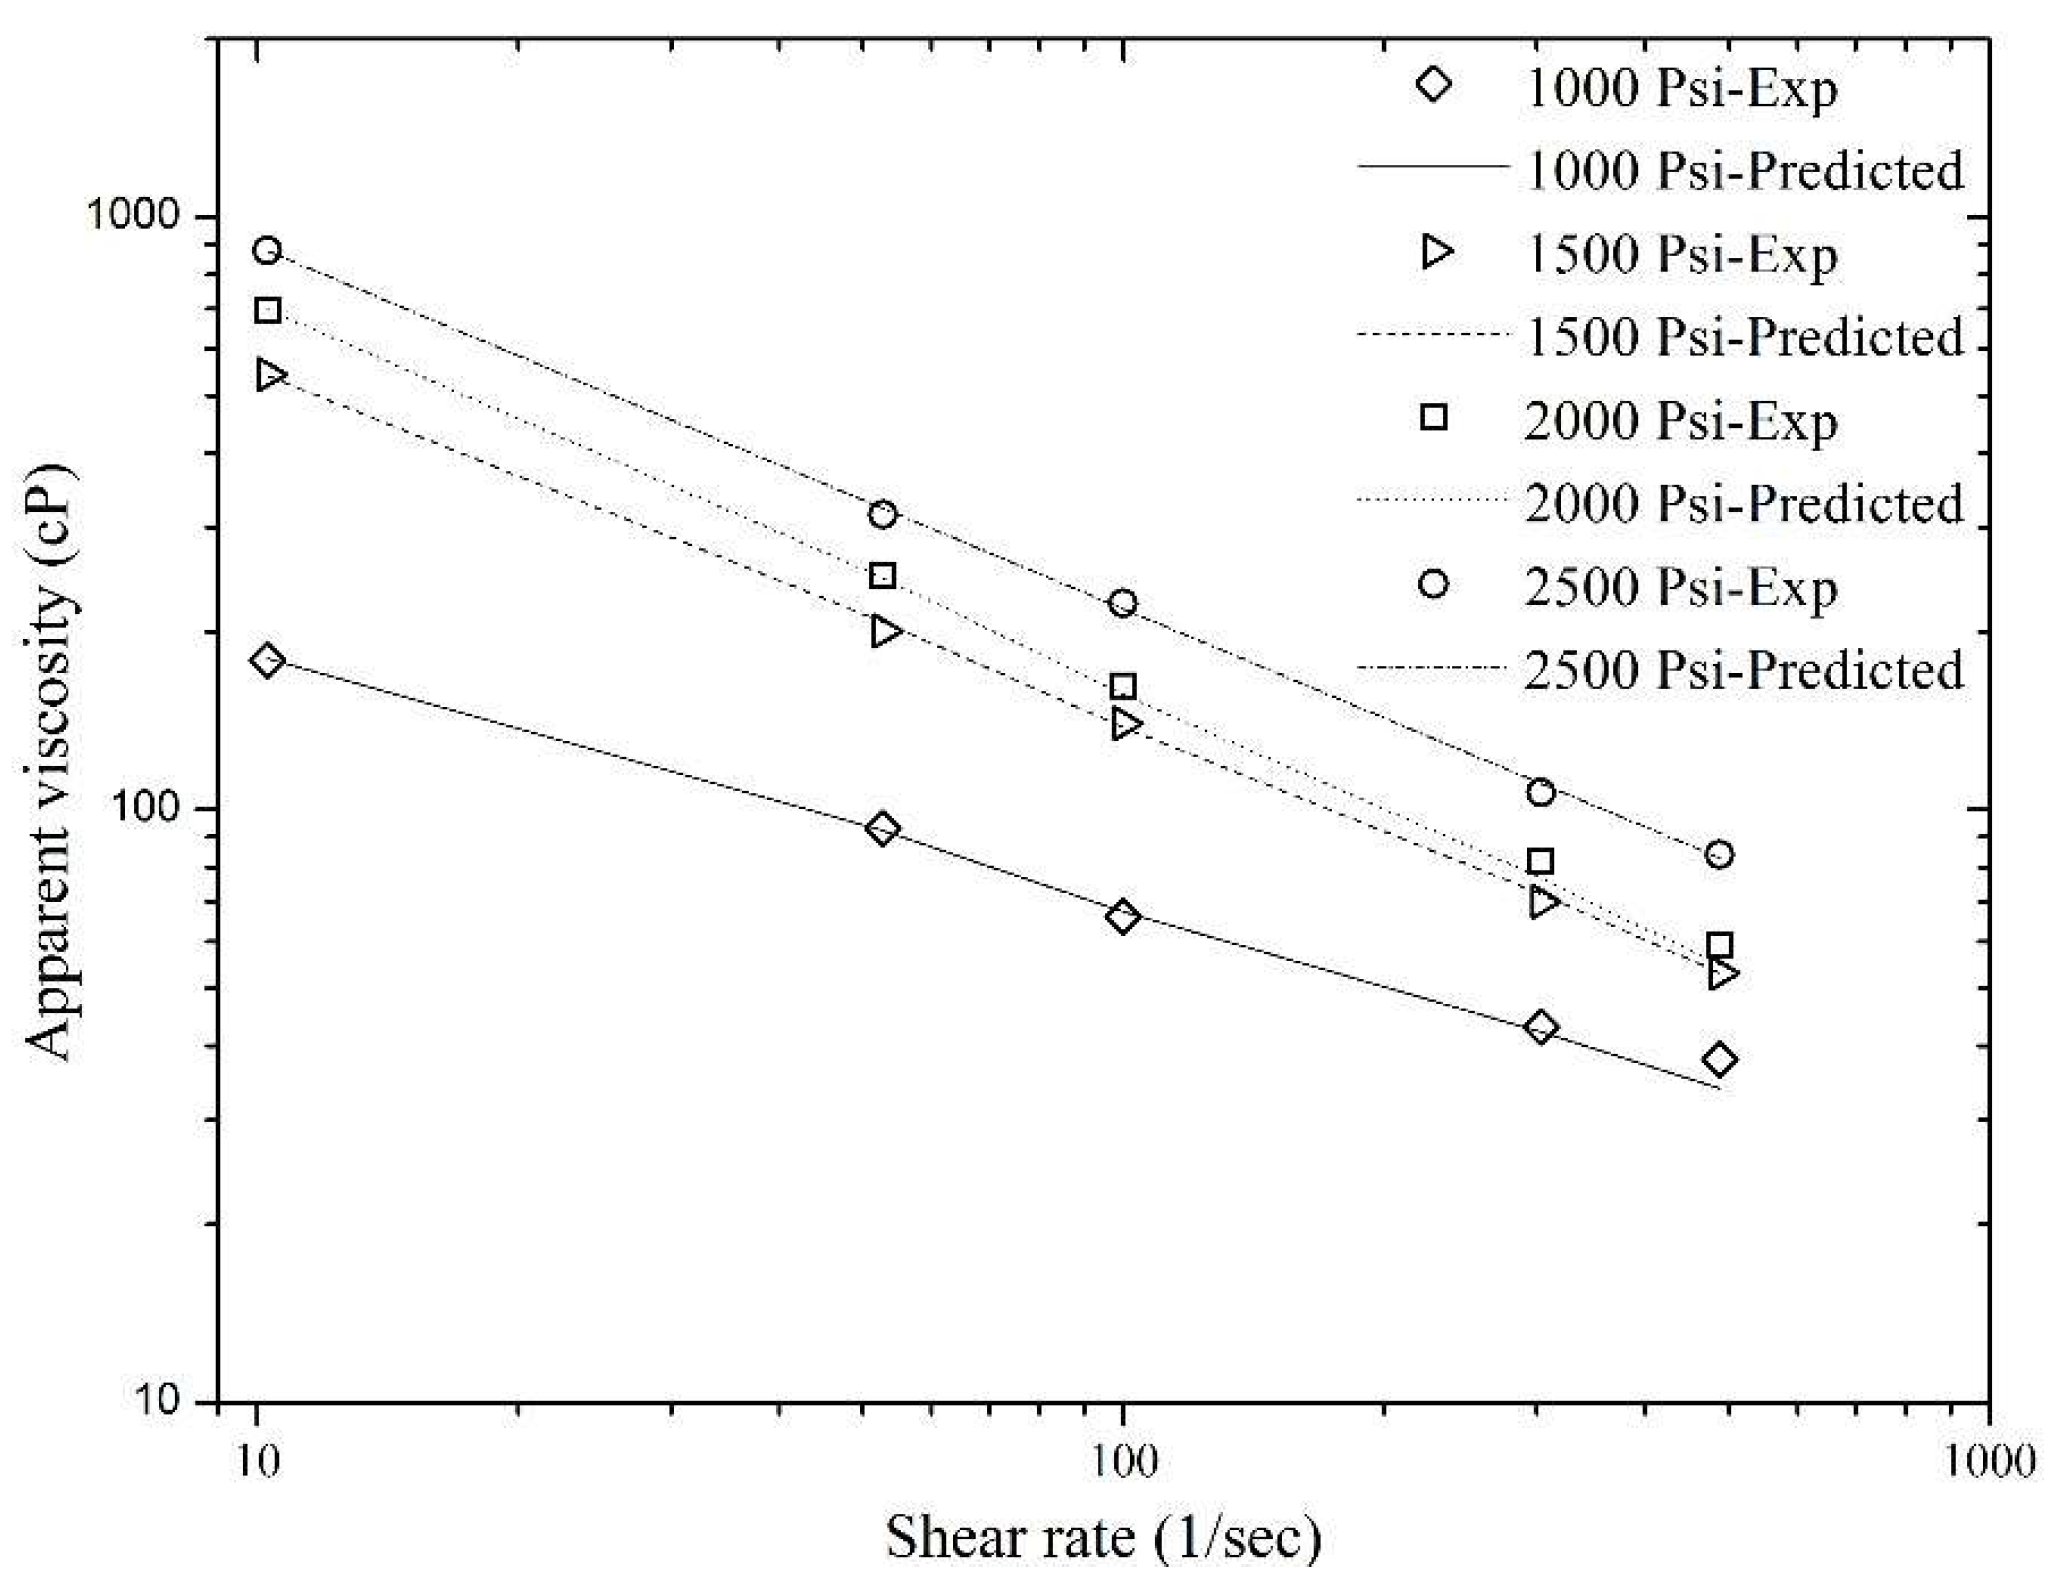
3.2.1. Effect of Pressure

Reservoir pressure has a large influence on the apparent viscosity of sCO2 foam. A wide range of reservoir pressures (1000 to 2500 psi) was considered and foam rheological behavior has been presented as a function of shear rate and pressure. Keeping all the other parameters fixed, sCO2 foam was generated inside the recirculation loop at different pressures and the foam was sheared over a range of 10 to 500 s−1. A clear shear thinning behavior was observed at different pressures. Figure 6 presents the foam apparent viscosity data obtained from this set of experiments. It was noticed that the foam apparent viscosity increased as the pressure increased. The highest foam apparent viscosity was achieved at the highest tested pressure, i.e., 2500 psi, within the entire tested range. Increasing the pressure changes the foam texture (which mainly controls the foam viscosity at high qualities), gas density, and gives a slight increase in gas phase viscosity. Here, at all of the tested pressures, shear rate versus pressure gave a straight line with a negative slope and the power law can be used to model the foam behavior.
A dimensionless parameter, i.e., dimensionless pressure, was introduced and it is defined as:
P D = ( P P r e f ) P r e f
where P is the testing pressure (psi), Pref is the reference pressure (psi), and PD is dimensionless pressure (unitless). The reference pressure or base case considered was 1000 psi.
By keeping all the other parameters fixed, the foam consistency index (K) and exponent (n) in the power law model (Equation (1)) varied as a function of dimensionless pressure. Based on individual investigations of these parameters, it was found that both indices K and n are quadratically related to dimensionless pressure as shown in Equations (8) and (9). Figure 7 presents a plot of both measured and predicted values of indices K and n versus dimensionless pressure. The match obtained between the observed and predicted values was quite acceptable. The developed model for K and n are presented below:
K = c 1 P D 2 + c 2 P D + c 3
n = d 1 P D 2 + d 2 P D + d 3
A modified power law model that incorporates the effect of shear rate and dimensionless pressure was obtained by substituting K and n values, given in the equation below:
μ = ( c 1 P D 2 + c 2 P D + c 3 ) γ ( d 1 P D 2 + d 2 P D + d 3 ) 1
where c1, c2, c3, d1, d2, and d3 are the parameter coefficients whose values can be obtained by applying nonlinear regression based on the measured viscometric data shown in Figure 6 using Equation (10). Table 3 includes the parameter estimates of this equation. The calculated R2 value, which was equal to unity, indicates that Equation (10) can precisely model the experimental data. The Pearson Chi-square test was also conducted to validate the model further and to know the goodness of fit. The Chi-square value was 2.18 and the model was tested within the confidence interval of 95%. The p-value from this test was 0.999, which indicates a good fit of the model. The matches between the experimental data of the foam apparent viscosity and the viscosity data predicted by the modified power law model (Equation (10)) are shown in Figure 8. Figure 8 depicts that the experimental data of the foam apparent viscosity is in good agreement with the predicted values using Equation (10).
Validation of the modified power law model is shown in Figure 9. The data for this test was not used for parameter estimation in nonlinear regression analysis. A good match was found with 8.7% as the maximum relative error, which is within the acceptable range.

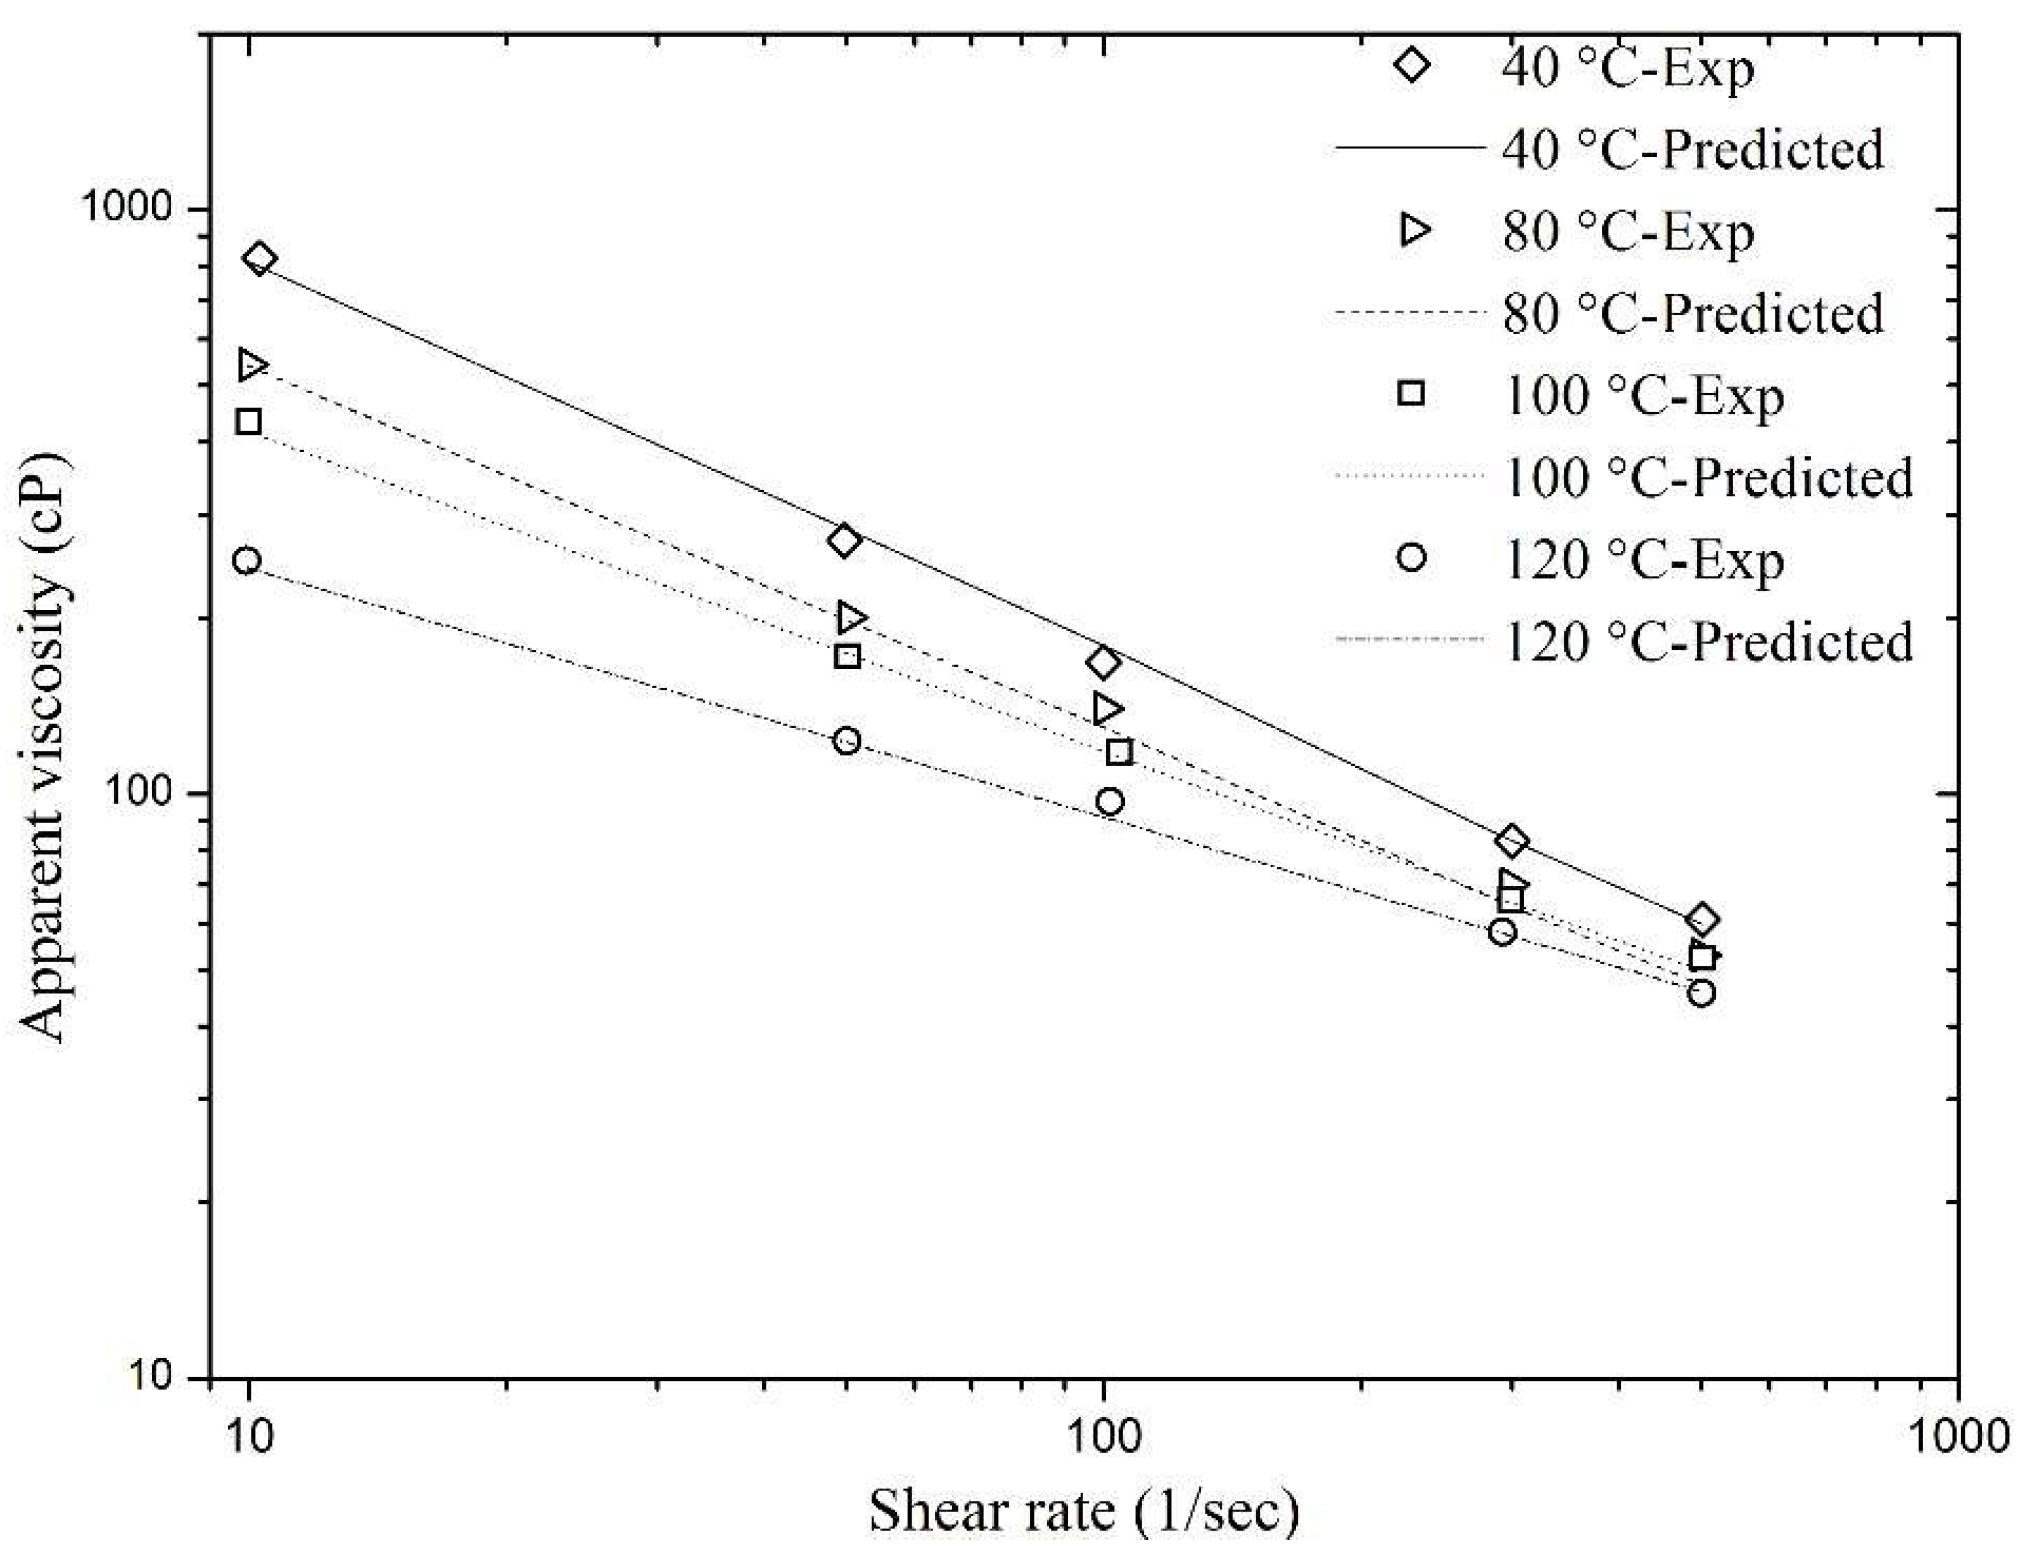
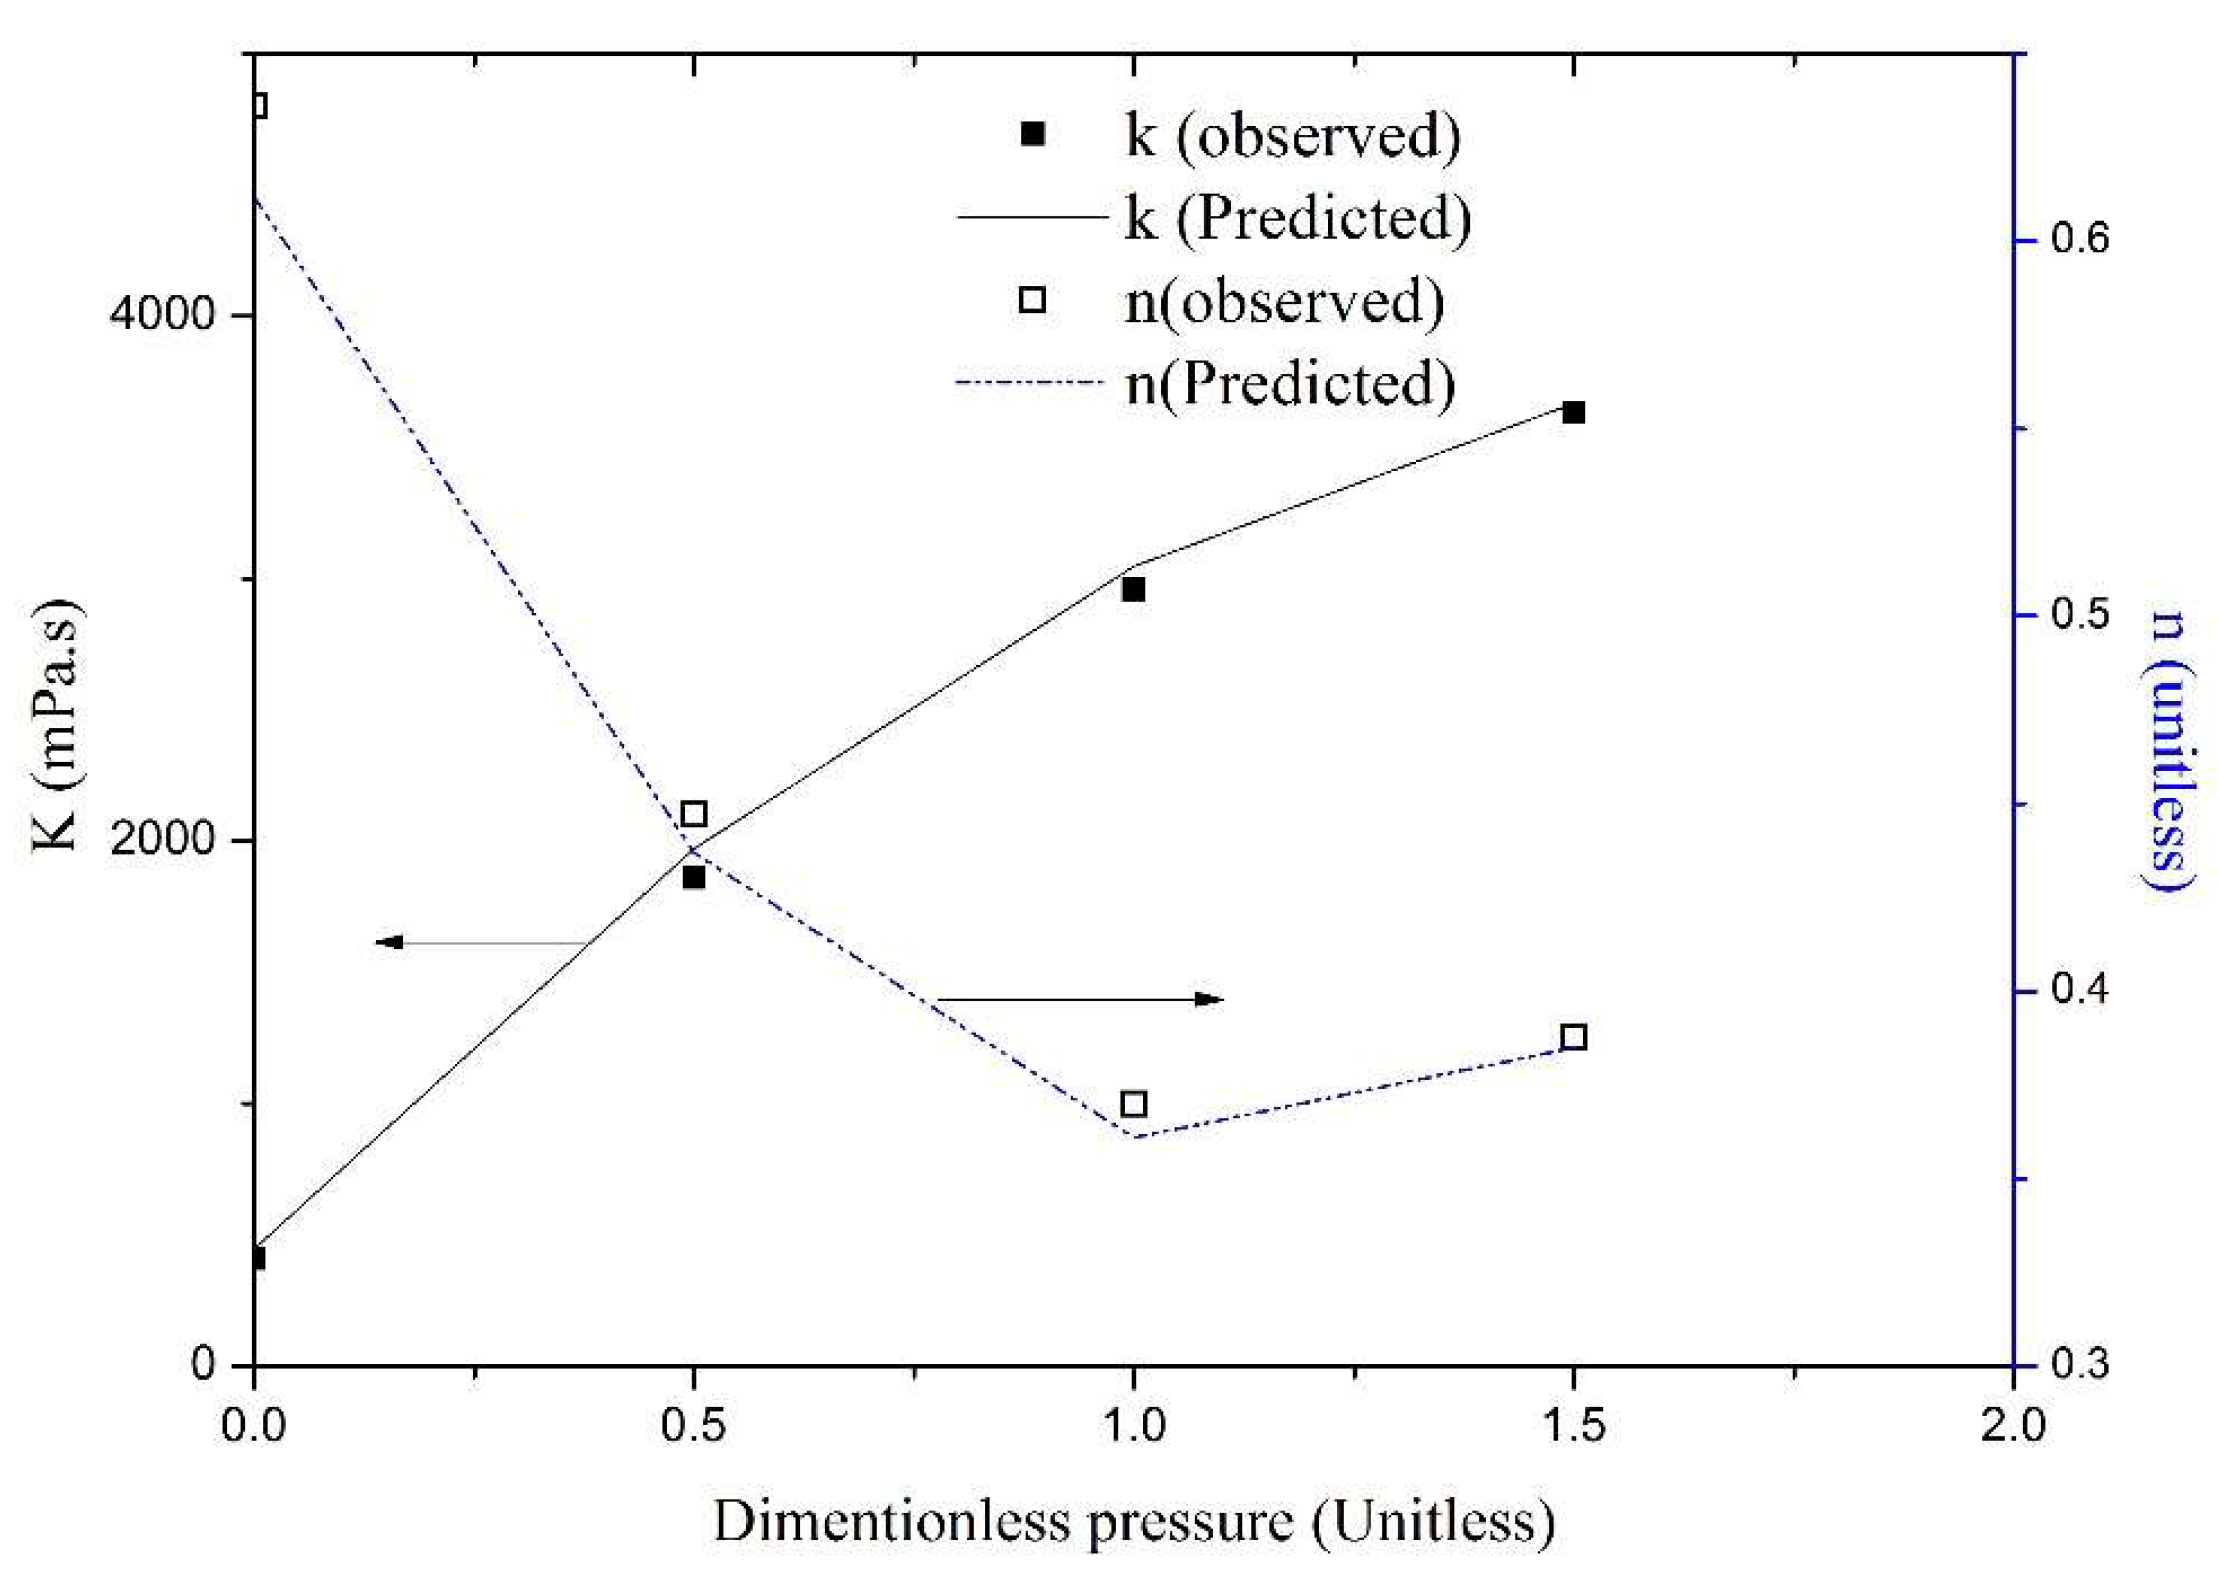
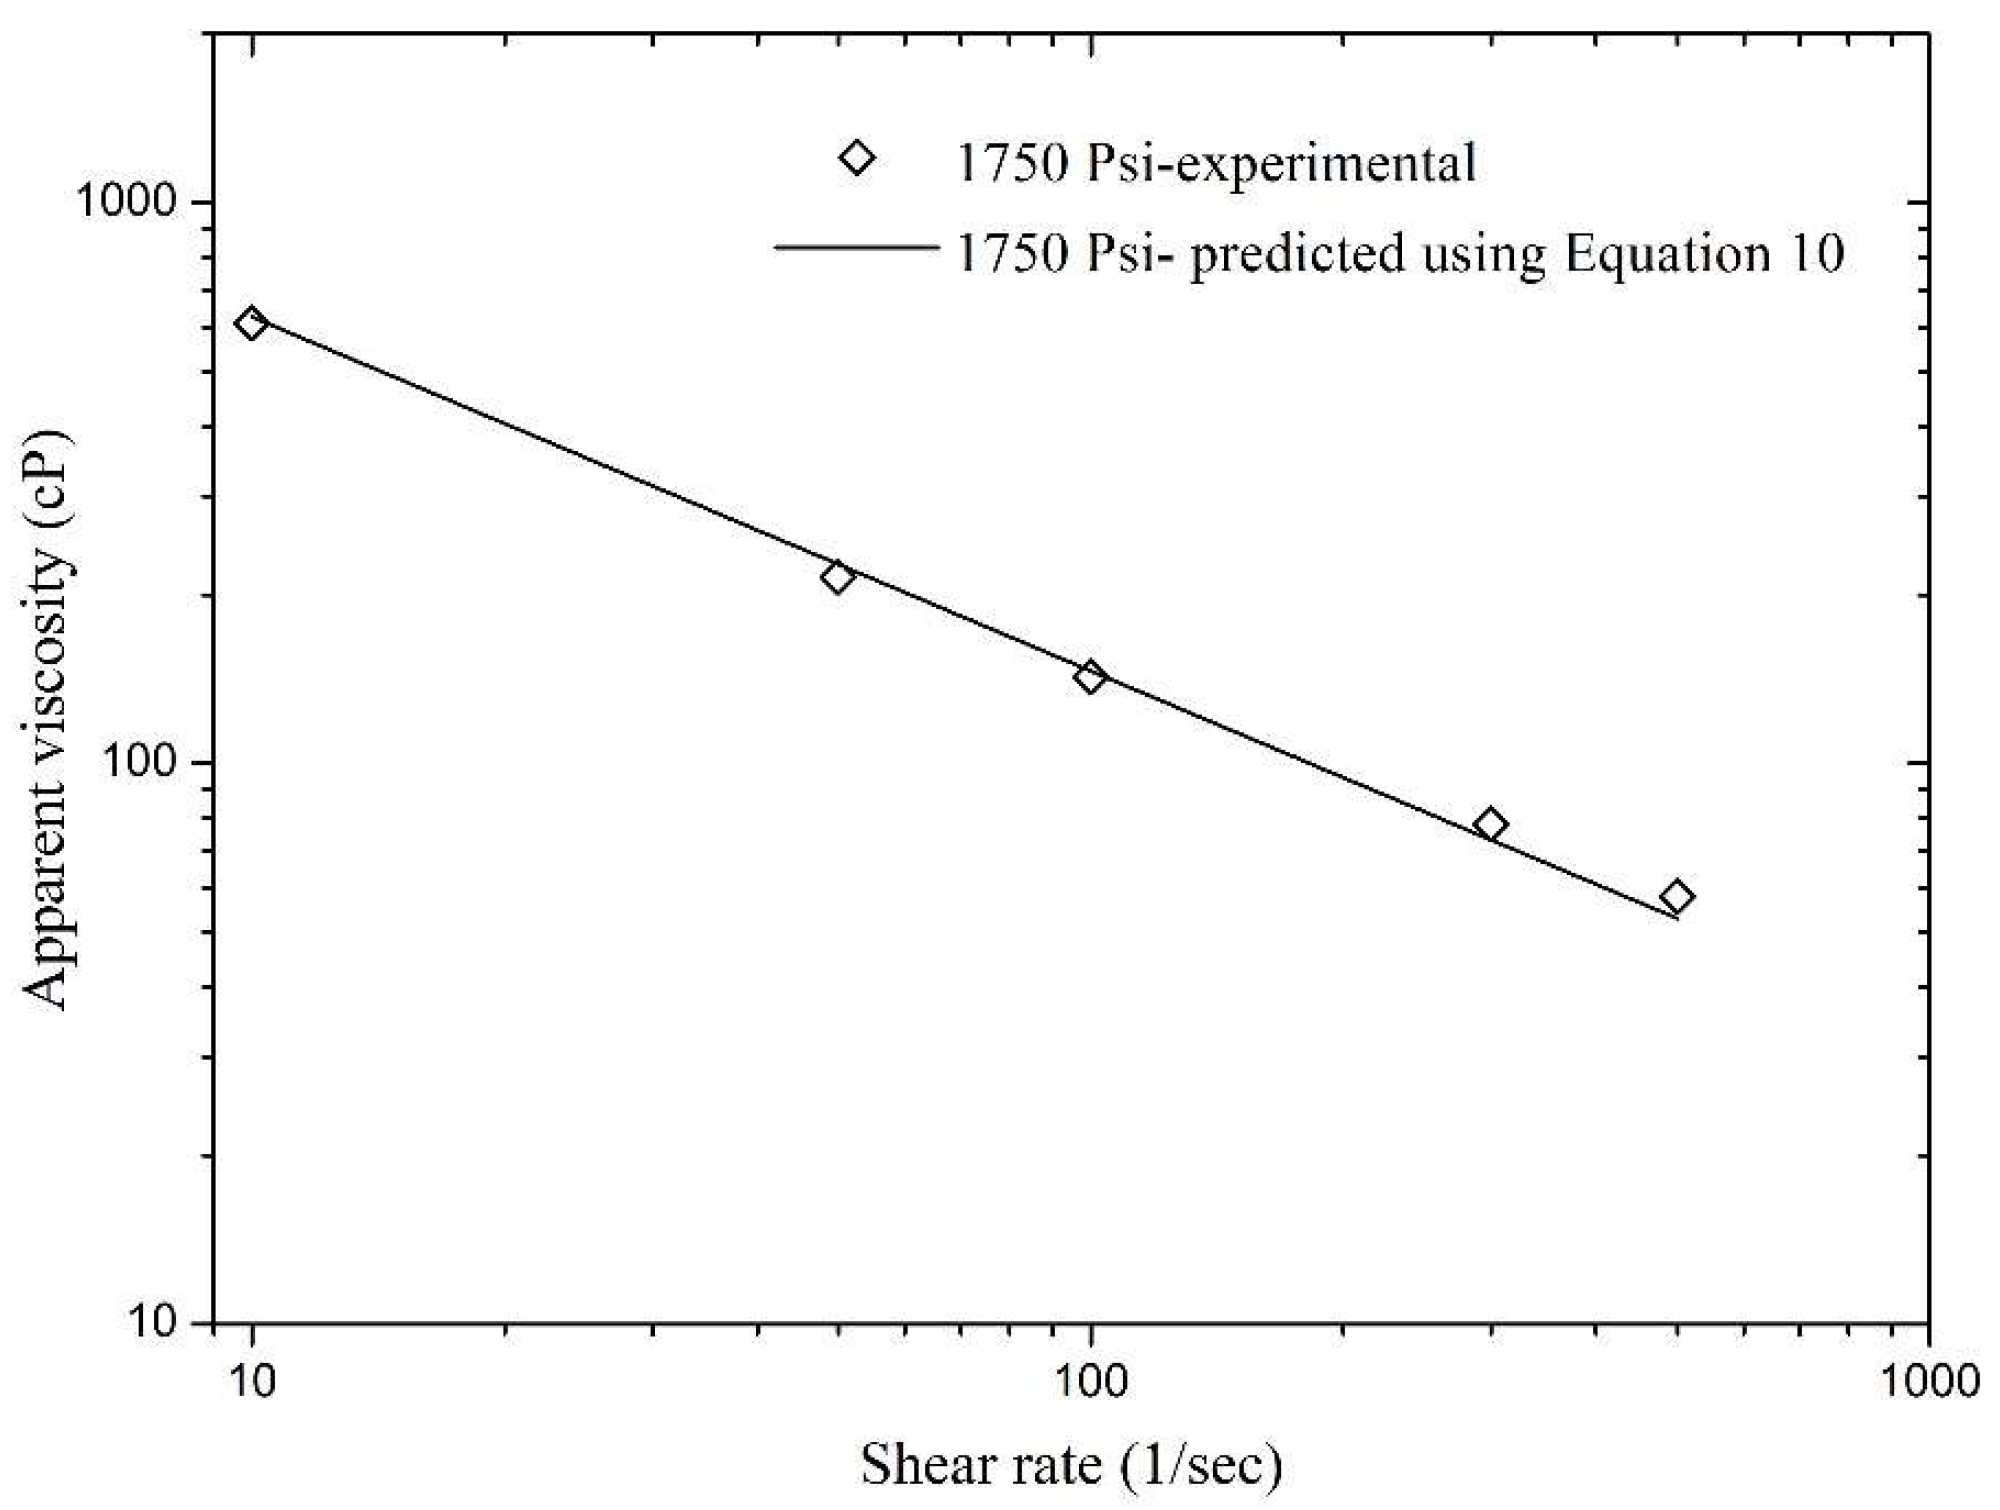
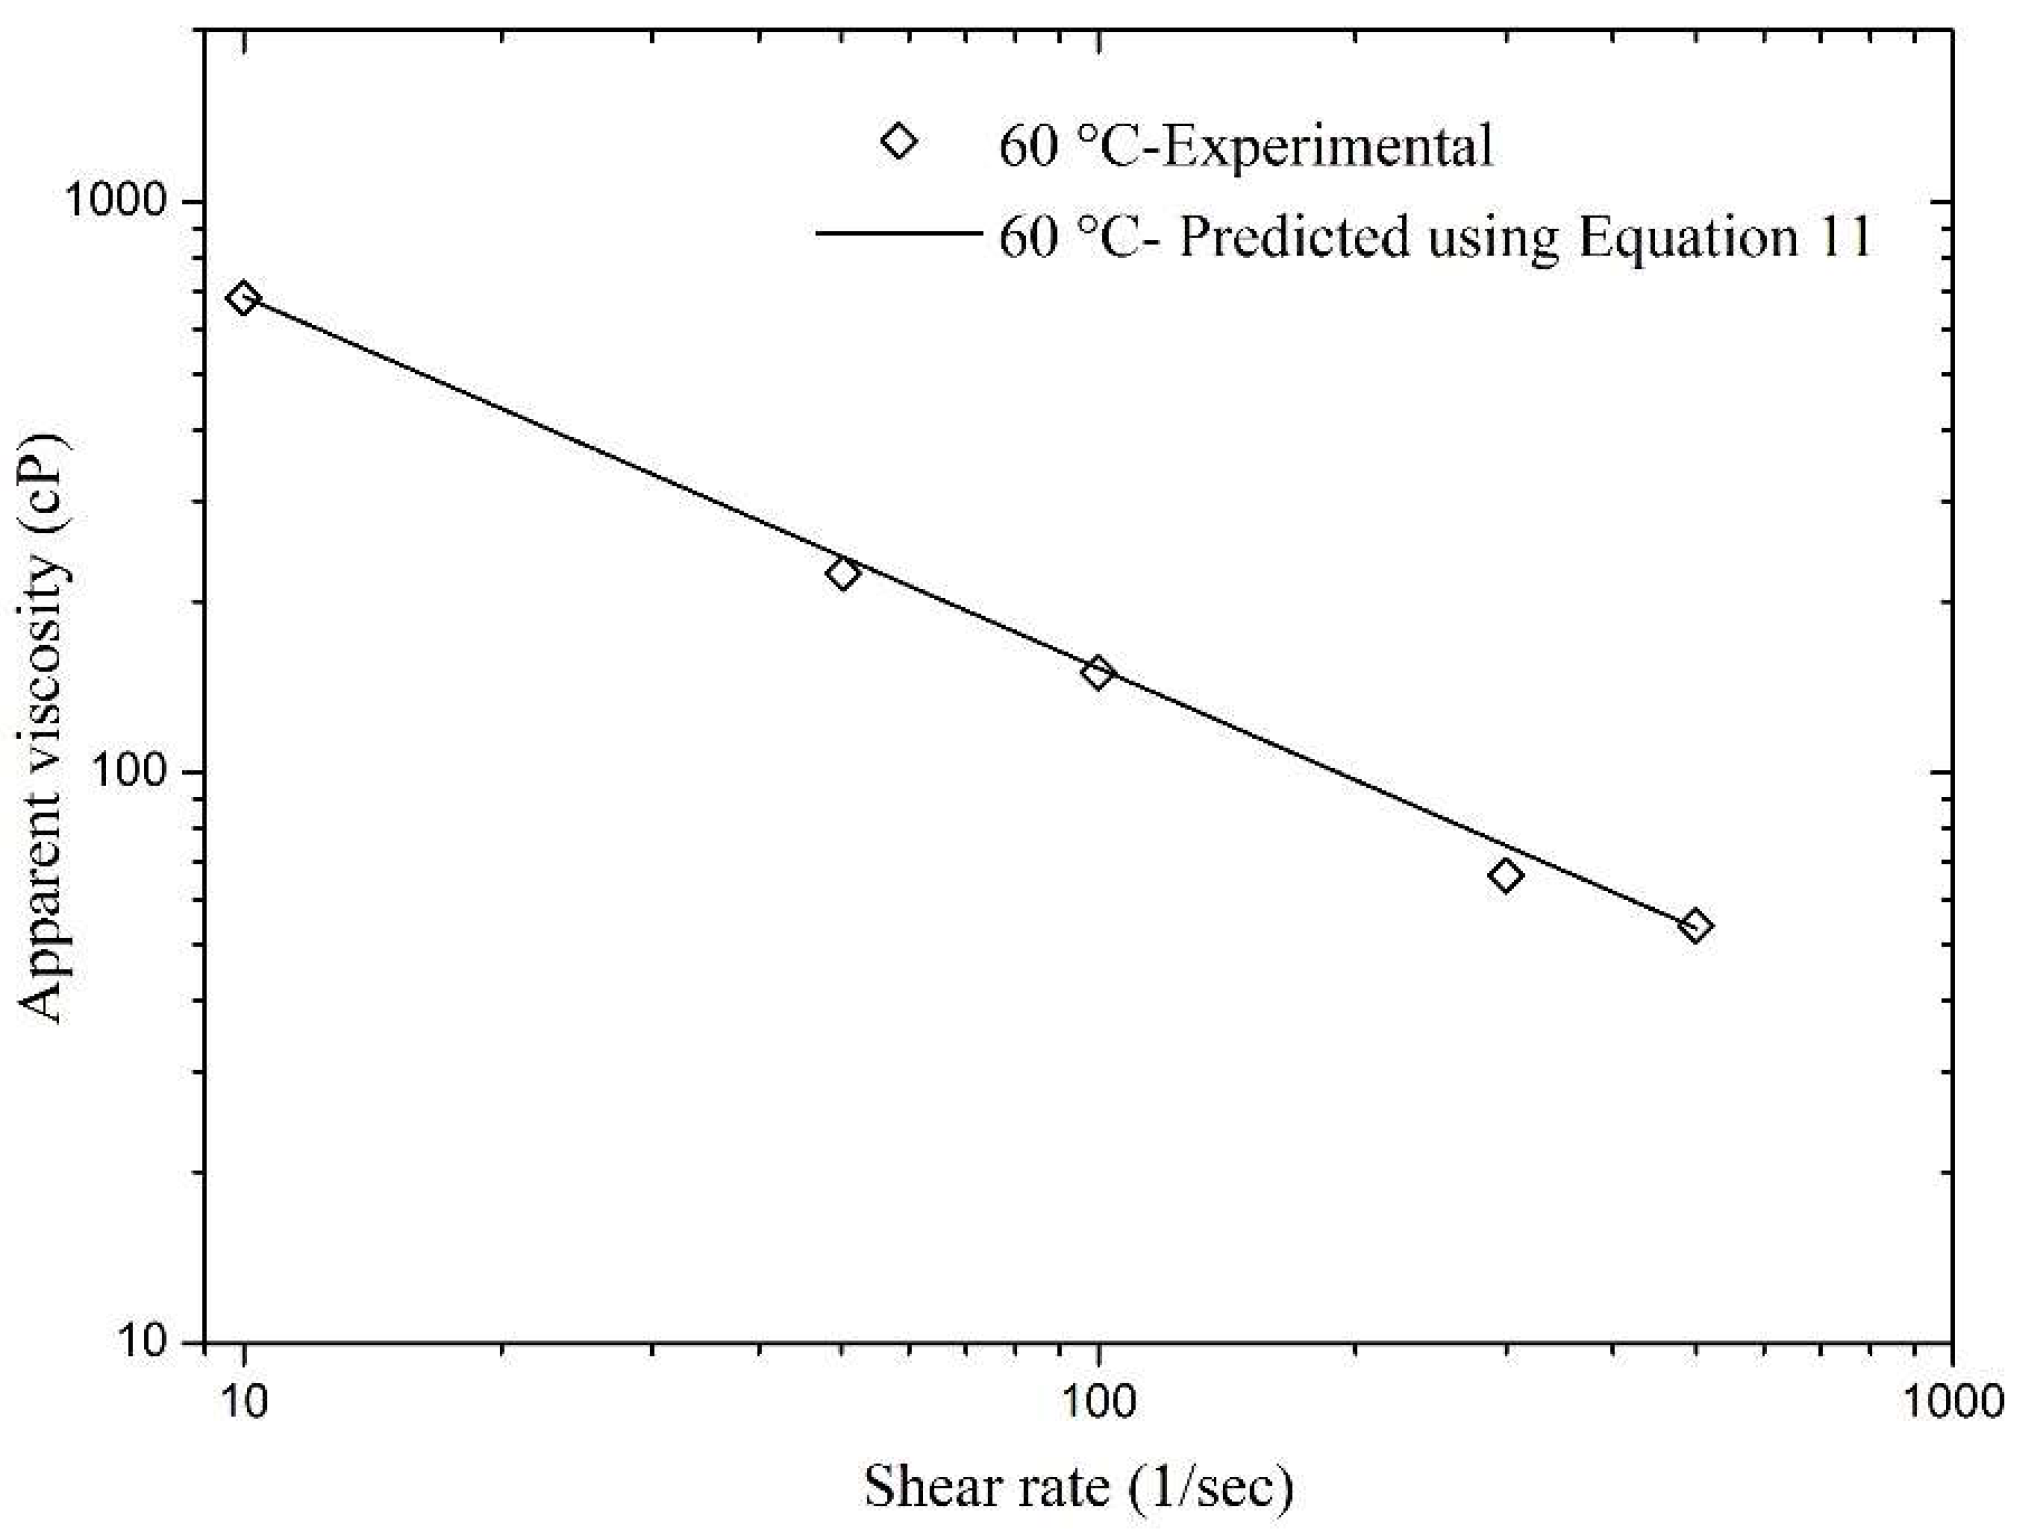
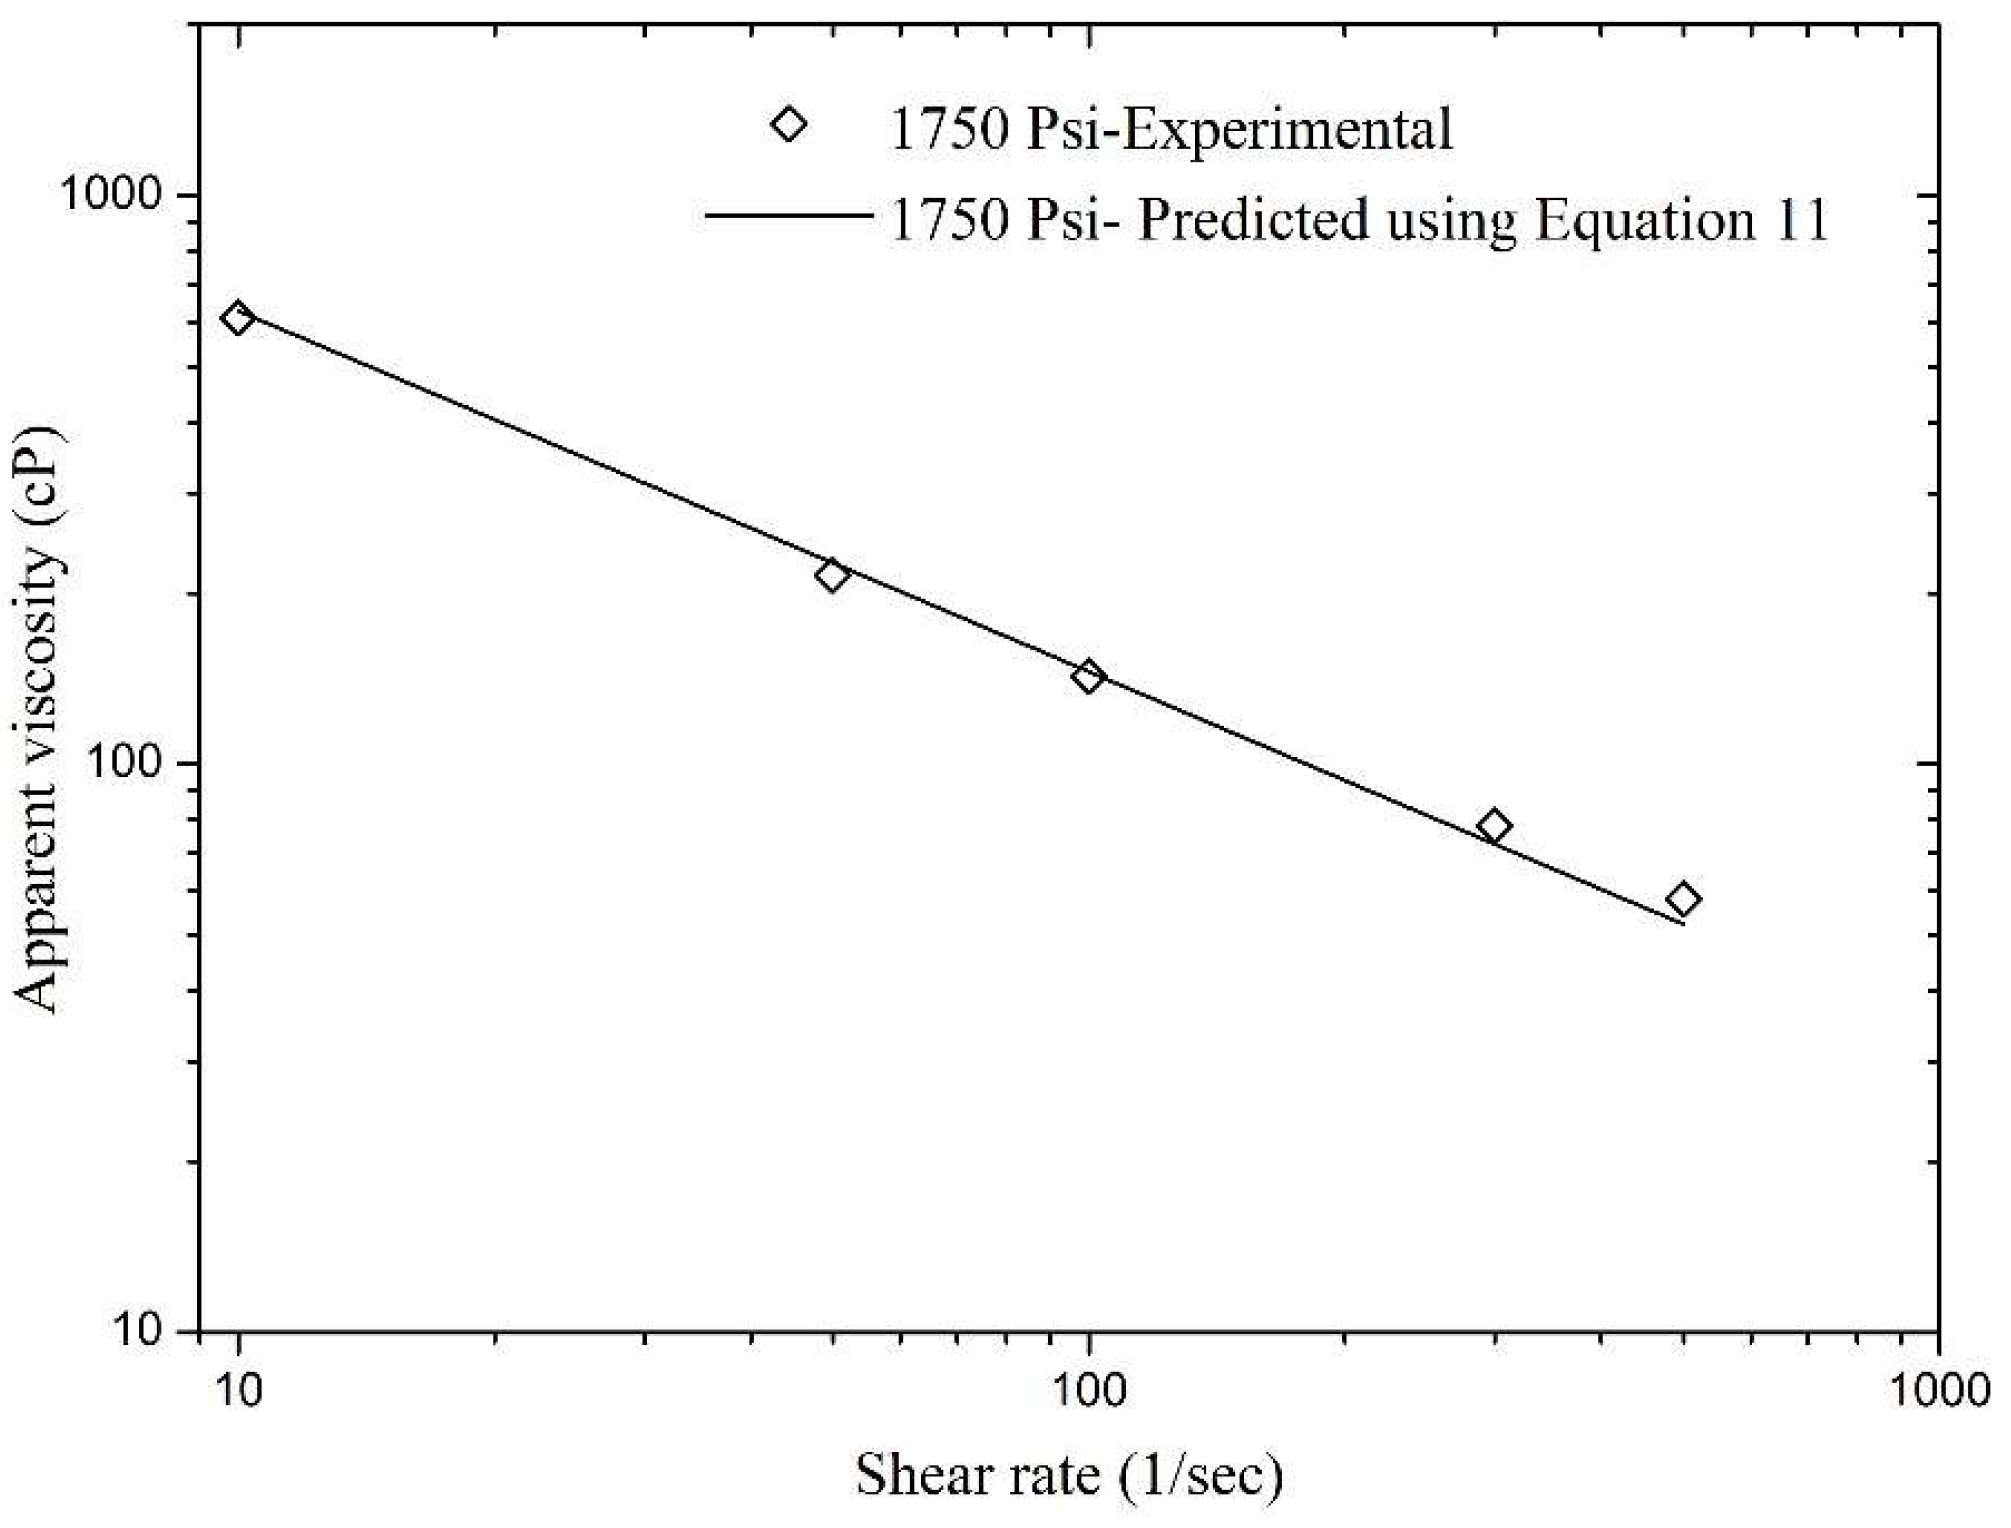
3.2.2. Combined Effect of Temperature, Pressure, and Shear Rate

The combined effect of three parameters, i.e., temperature, pressure, and shear rate, was studied in this section and nonlinear regression analysis was performed on the experimental data and is shown in Table 4. These three parameters have been incorporated in Equation (1) and based on individual analysis a modified power law was developed as shown in Equation (11). This new equation presents a combined effect of temperature, pressure, and shear rate:
μ = ( e 1 P D 2 + e 2 P D + e 3 T D 2 + e 4 T D + e 5 ) γ ( f 1 P D 2 + f 2 P D + f 3 T D 2 + f 4 T D + f 5 ) 1
where e1, e2, e3, e4, e5, f1, f2, f3, f4, and f5 are the coefficients that can be determined by nonlinear regression analysis on foam viscosity data, which appeared as a straight line. Table 4 presents the parameter estimates and R2 value of this equation. The R2 value appeared to be unity, which shows that the model is excellent for the experimental data. The Pearson Chi-square test was also conducted to know the goodness of fit. The Chi-square value was found to be 2.304 and the p-value was 0.999, which indicates a good fit of the model. Furthermore, a good agreement was found between experimental viscometric data and the predicted values of viscosity (using Equation (11)), as presented in Figure 10 and Figure 11.
In addition, model validation was also carried out using the hidden experimental data, i.e., the data that was not used in nonlinear regression analysis during the model development phase. Figure 12 and Figure 13 present a validation of Equation (11) and the relative errors for these matches were found to be very low. The maximum relative errors in Figure 12 and Figure 13 were found to be 13.04% and 9.9%, respectively. This concludes that Equation (11) is an excellent model for the experimental data that can help in good prediction of foam apparent viscosity at different reservoir conditions.
The models presented in this paper (Equations (6), (10) and (11)) are valid for foam flow in pipes or wellbores; however, it would be difficult to extrapolate these results inside porous media due to different pore-level mechanisms. Apart from fracturing treatment design and fracture simulation studies, these models can also be used as a quick screening tool for optimization of surfactant formulation at different reservoir conditions, which may provide information about surfactant performance for foam generation. If a surfactant fails to generate foam with a particular strength in the rheometer, it cannot generate foam in porous media in the presence of crude oil. Therefore, the set of equations are also helpful in reducing the number of porous media experiments, which are quite time consuming.

4. Conclusions

In this experimental study, polymer-free fracturing sCO2 foam was generated using a high pressure, high temperature foam rheometer and a wide range of pressures, temperatures, and shear rates were tested. The modified power law models for sCO2 foam made from AOS and betaine were presented as a function of three crucial parameters: temperature, pressure, and shear rate.
All the sCO2 foams that were tested at various temperatures and pressures exhibited a clear shear thinning behavior. The apparent viscosity of the foam decreased as the temperature increased, whereas an increase in pressure stabilized the lamella and increased foam viscosity. At all of the testing conditions, the power law behavior of the foam was noticed within the tested shear range (i.e., 10 to 500 s−1).
Nonlinear regression was performed on experimental data to generate modified models. Power law indices were found to be the function of temperature and pressure. The flow behavior index (K) can be modeled as a linear function of dimensionless temperature whereas the flow consistency index (n) appears to be a quadratic function of dimensionless temperature. The effect of dimensionless pressure on both K and n was found to be quadratic. These empirical correlations were found to be valid for all the temperature (i.e., 40–120 °C) and pressure (1000–2500 psi) ranges that were tested and can be used to predict the individual and/or combined effects of these parameters accurately. Model validation was also performed and excellent matches were found for the correlation between the predicted values and experimental data. The developed modified power law models can be integrated into different fracturing simulators to evaluate the efficiency of CO2 foam fracturing.

Acknowledgments

The authors would like to acknowledge the Petroleum Engineering Department and Centre of Research in Enhanced Oil Recovery (COEOR) at Universiti Teknologi PETRONAS for the funding (YUTP-0153AA-E70) and the technical assistance. This work is supported by PETRONAS Research Bhd and authors greatly acknowledge the technical support and laboratory setup. We also would like to acknowledge Chandler Engineering for the technical support related to the equipment and the methods. Evonik and Akzonobel are also acknowledged for supplying the surfactant samples.

Author Contributions

Shehzad Ahmed wrote this paper, conceived and designed experiments, performed experimental and modeling study, and analyzed data; Khaled Abdalla Elraies supervised this study, contributed to experimental and modeling section, provided materials and instruments, and also edited manuscript; Muhammad Rehan Hashmet contributed to the main idea of this paper, provided technical support during experimental as well as modeling study; Mohammad Sahban Alnarabiji assisted in data analysis, and revising manuscript.

Conflicts of Interest

The authors declare no conflict of interest.

References

  1. Harvey, T.; Gray, J. The Unconventional Hydrocarbon Resources of Britain’s Onshore Basins–Shale Gas; Department of Energy & Climate Change: London, UK, 2013.
  2. Aguilera, R. Flow units: From conventional to tight-gas to shale-gas to tight-oil to shale-oil reservoirs. SPE Reserv. Eval. Eng. 2014, 17, 190–208. [Google Scholar] [CrossRef]
  3. Lee, K.S.; Kim, T.H. Integrative Understanding of Shale Gas Reservoirs; Springer: Berlin, Germany, 2016. [Google Scholar]
  4. Peles, J.; Wardlow, R.; Cox, G.; Haley, W.; Dusterhoft, R.; Walters, H.; Weaver, J. Maximizing well production with unique low molecular weight frac fluid. In Proceedings of the SPE Annual Technical Conference and Exhibition, San Antonio, TX, USA, 29 September–2 October 2002; Society of Petroleum Engineers: Richardson, TX, USA, 2002. [Google Scholar]
  5. Gu, M.; Mohanty, K. Rheology of polymer-free foam fracturing fluids. J. Petroleum Sci. Eng. 2015, 134, 87–96. [Google Scholar] [CrossRef]
  6. Ribeiro, L.; Sharma, M. Fluid selection for energized fracture treatments. In Proceedings of the SPE Hydraulic Fracturing Technology Conference, The Woodlands, TX, USA, 4–6 February 2013; Society of Petroleum Engineers: Richardson, TX, USA, 2013. [Google Scholar]
  7. Middleton, R.S.; Carey, J.W.; Currier, R.P.; Hyman, J.D.; Kang, Q.; Karra, S.; Jiménez-Martínez, J.; Porter, M.L.; Viswanathan, H.S. Shale gas and non-aqueous fracturing fluids: Opportunities and challenges for supercritical CO2. Appl. Energy 2015, 147, 500–509. [Google Scholar] [CrossRef]
  8. Barati, R.; Liang, J.T. A review of fracturing fluid systems used for hydraulic fracturing of oil and gas wells. J. Appl. Polym. Sci. 2014, 131. [Google Scholar] [CrossRef]
  9. Makhanov, K.; Habibi, A.; Dehghanpour, H.; Kuru, E. Liquid uptake of gas shales: A workflow to estimate water loss during shut-in periods after fracturing operations. J. Unconv. Oil Gas Resour. 2014, 7, 22–32. [Google Scholar] [CrossRef]
  10. Li, X.; Feng, Z.; Han, G.; Elsworth, D.; Marone, C.; Saffer, D.; Cheon, D.-S. Breakdown pressure and fracture surface morphology of hydraulic fracturing in shale with H2O, CO2 and N2. Geomech. Geophys. Geo-Energy Geo-Resour. 2016, 2, 63–76. [Google Scholar] [CrossRef]
  11. Gandossi, L. An Overview of Hydraulic Fracturing and Other Formation Stimulation Technologies for Shale Gas Production; European Commisison Joint Research Centre Technology Reports; European Commisison: Brussels, Belgium, 2013. [Google Scholar]
  12. Liu, F.; Ellett, K.; Xiao, Y.; Rupp, J.A. Assessing the feasibility of CO2 storage in the new albany shale (devonian–mississippian) with potential enhanced gas recovery using reservoir simulation. Int. J. Greenh. Gas Control 2013, 17, 111–126. [Google Scholar] [CrossRef]
  13. Busch, A.; Alles, S.; Gensterblum, Y.; Prinz, D.; Dewhurst, D.N.; Raven, M.D.; Stanjek, H.; Krooss, B.M. Carbon dioxide storage potential of shales. Int. J. Greenh. Gas Control 2008, 2, 297–308. [Google Scholar] [CrossRef]
  14. Shi, J.-Q.; Durucan, S. Modelling of mixed-gas adsorption and diffusion in coalbed reservoirs. In Proceedings of the SPE Unconventional Reservoirs Conference, Keystone, CO, USA, 10–12 February 2008; Society of Petroleum Engineers: Richardson, TX, USA, 2008. [Google Scholar]
  15. Edrisi, A.R.; Kam, S.I. A new foam rheology model for shale-gas foam fracturing applications. In Proceedings of the SPE Canadian Unconventional Resources Conference, Calgary, AB, Canada, 30 October–1 November 2012; Society of Petroleum Engineers: Richardson, TX, USA, 2012. [Google Scholar]
  16. Heller, R. Laboratory measurements of matrix permeability and slippage enhanced permeability in gas shales. In Proceedings of the SPE Hydraulic Fracturing Technology Conference, The Woodlands, TX, USA, 4–6 February 2013. [Google Scholar]
  17. Kang, S.M.; Fathi, E.; Ambrose, R.J.; Akkutlu, I.Y.; Sigal, R.F. Carbon dioxide storage capacity of organic-rich shales. SPE J. 2011, 16, 842–855. [Google Scholar] [CrossRef]
  18. Luo, X.; Wang, S.; Wang, Z.; Jing, Z.; Lv, M. Experimental research on rheological properties and proppant transport performance of grf–CO2 fracturing fluid. J. Petroleum Sci. Eng. 2014, 120, 154–162. [Google Scholar] [CrossRef]
  19. Wanniarachchi, W.; Ranjith, P.; Perera, M.; Lashin, A.; Al Arifi, N.; Li, J. Current opinions on foam-based hydro-fracturing in deep geological reservoirs. Geomech. Geophys. Geo-Energy Geo-Resour. 2015, 1, 121–134. [Google Scholar] [CrossRef]
  20. Gassara, O.; Douarche, F.; Braconnier, B.; Bourbiaux, B. Equivalence between semi-empirical and population-balance foam models. Transp. Porous Media 2017, 120, 473–493. [Google Scholar] [CrossRef]
  21. Hirasaki, G.J.; Lawson, J.B. Mechanisms of foam flow in porous media: Apparent viscosity in smooth capillaries. Soc. Petroleum Eng. J. 1985, 25, 176–190. [Google Scholar] [CrossRef]
  22. Bretherton, F. The motion of long bubbles in tubes. J. Fluid Mech. 1961, 10, 166–188. [Google Scholar] [CrossRef]
  23. Ahmed, S.; Elraies, K.A.; Tan, I.M.; Hashmet, M.R. Experimental investigation of associative polymer performance for CO2 foam enhanced oil recovery. J. Petroleum Sci. Eng. 2017, 157, 971–979. [Google Scholar] [CrossRef]
  24. Ahmed, S.; Elraies, K.A.; Forooozesh, J.; Bt Mohd Shafian, S.R.; Hashmet, M.R.; Hsia, I.C.C.; Almansour, A. Experimental investigation of immiscible supercritical carbon dioxide foam rheology for improved oil recovery. J. Earth Sci. 2017, 28, 835–841. [Google Scholar] [CrossRef]
  25. Gassara, O.; Douarche, F.; Braconnier, B.; Bourbiaux, B. Calibrating and interpreting implicit-texture models of foam flow through porous media of different permeabilities. J. Petroleum Sci. Eng. 2017, 159, 588–602. [Google Scholar] [CrossRef]
  26. Ransohoff, T.; Radke, C. Laminar flow of a wetting liquid along the corners of a predominantly gas-occupied noncircular pore. J. Colloid Interface Sci. 1988, 121, 392–401. [Google Scholar] [CrossRef]
  27. Kovscek, A.; Radke, C. Fundamentals of Foam Transport in Porous Media; ACS Publications: Washington, DC, USA, 1994. [Google Scholar]
  28. Mezdour, S.; de Préval, E.S.; Granda, P.; Cuvelier, G.; Ducept, F. Impact of interfacial characteristics on foam structure: Study on model fluids and at pilot scale. Oil Gas Sci. Technol.–Revue d’IFP Energies Nouvelles 2017, 72, 13. [Google Scholar] [CrossRef]
  29. Noetinger, B.; Hume, L.; Chatelin, R.; Poncet, P. Effective viscosity of a random mixture of fluids. Phys. Rev. Fluids 2018, 3, 014103. [Google Scholar] [CrossRef]
  30. Sun, X.; Liang, X.; Wang, S.; Lu, Y. Experimental study on the rheology of CO2 viscoelastic surfactant foam fracturing fluid. J. Petroleum Sci. Eng. 2014, 119, 104–111. [Google Scholar] [CrossRef]
  31. Edrisi, A.; Kam, S.I. A new foam model in pipes for drilling and fracturing application. SPE J. 2014, 19, 576–585. [Google Scholar] [CrossRef]
  32. Green, D.W.; Willhite, G.P. Enhanced Oil Recovery; Henry L. Doherty Memorial Fund of AIME, Society of Petroleum Engineers: Richardson, TX, USA, 1998. [Google Scholar]
  33. Pramudita, R.A.; Ryoo, W.S. Viscosity measurements of CO2-in-water foam with dodecyl polypropoxy sulfate surfactants for enhanced oil recovery application. Korea-Aust. Rheol. J. 2016, 28, 237–241. [Google Scholar] [CrossRef]
  34. Batôt, G.; Fleury, M.; Nabzar, L. Study of CO2 foam performance in a ccs context. In Proceedings of the 30th International Symposium of the Society of Core Analysts, Snowmass, CO, USA, 21–26 August 2016. [Google Scholar]
  35. Sherif, T.; Ahmed, R.; Shah, S.; Amani, M. Rheological correlations for oil-based drilling foams. J. Nat. Gas Sci. Eng. 2016, 35, 1249–1260. [Google Scholar] [CrossRef]
  36. Ostwald, W. Ueber die geschwindigkeitsfunktion der viskosität disperser systeme. I. Kolloid-Zeitschrift 1925, 36, 99–117. [Google Scholar] [CrossRef]
  37. Martins, A.; Lourenco, A.; Sa, C.; Silva, V., Jr. Foam rheology characterization as a tool for predicting pressures while drilling offshore wells in ubd conditions. In Proceedings of the SPE/IADC Drilling Conference, Amsterdam, The Netherlands, 27 February–1 March 2001; Society of Petroleum Engineers: Richardson, TX, USA, 2001. [Google Scholar]
  38. Farzaneh, S.A.; Sohrabi, M. Experimental investigation of CO2-foam stability improvement by alkaline in the presence of crude oil. Chem. Eng. Res. Des. 2015, 94, 375–389. [Google Scholar] [CrossRef]
  39. Sheng, J. Enhanced Oil Recovery Field Case Studies; Gulf Professional Publishing: Houston, TX, USA, 2013. [Google Scholar]
  40. Kapetas, L.; Bonnieu, S.V.; Danelis, S.; Rossen, W.; Farajzadeh, R.; Eftekhari, A.; Shafian, S.M.; Bahrim, R.K. Effect of temperature on foam flow in porous media. J. Ind. Eng. Chem. 2016, 36, 229–237. [Google Scholar] [CrossRef]
  41. Langevin, D. Influence of interfacial rheology on foam and emulsion properties. Adv. Colloid Interface Sci. 2000, 88, 209–222. [Google Scholar] [CrossRef]
  42. Chen, Y.; Elhag, A.S.; Worthen, A.J.; Reddy, P.P.; Ou, A.M.; Hirasaki, G.J.; Nguyen, Q.P.; Biswal, S.L.; Johnston, K.P. High temperature CO2-in-water foams stabilized with cationic quaternary ammonium surfactants. J. Chem. Eng. Data 2016, 61, 2761–2770. [Google Scholar] [CrossRef]
  43. Solbakken, J.S.; Skauge, A.; Aarra, M.G. Foam performance in low permeability laminated sandstones. Energy Fuels 2014, 28, 803–815. [Google Scholar] [CrossRef]
  44. Ahmed, S.; Elraies, K.A.; Hashmet, M.R.; Hanamertani, A.S. Viscosity models for polymer free CO2 foam fracturing fluid with the effect of surfactant concentration, salinity and shear rate. Energies 2017, 10, 1970. [Google Scholar] [CrossRef]
  45. Osei-Bonsu, K.; Shokri, N.; Grassia, P. Fundamental investigation of foam flow in a liquid-filled hele-shaw cell. J. Colloid Interface Sci. 2016, 462, 288–296. [Google Scholar] [CrossRef] [PubMed] [Green Version]
  46. Stevenson, P. Foam Engineering: Fundamentals and Applications; John Wiley & Sons: Hoboken, NJ, USA, 2012. [Google Scholar]
  47. Bonilla, L.F.; Shah, S.N. Experimental investigation on the rheology of foams. In Proceedings of the SPE/CERI Gas Technology Symposium, Calgary, AB, USA, 3–5 April 2000; Society of Petroleum Engineers: Calgary, AB, Canada, 2000. [Google Scholar]
  48. Long, Y.; Zhu, W.; Li, J.; Huang, X. Rheological properties studies on the steam-foam drive in heavy oil reservoirs. In Proceedings of the 2012 International Conference on Computer Distributed Control and Intelligent Environmental Monitoring (CDCIEM), Changsha, China, 5–6 March 2012; IEEE: Changsha, China, 2012; pp. 600–605. [Google Scholar]
  49. Hashmet, M.R.; Onur, M.; Tan, I.M. Empirical correlations for viscosity of polyacrylamide solutions with the effects of temperature and shear rate. II. J. Dispers. Sci. Technol. 2014, 35, 1685–1690. [Google Scholar] [CrossRef]
Figure 1. Schematic diagram of a pressurized foam rheometer.
Energies 11 00782 g001
Figure 2. Apparent viscosity of sCO2 foam with the effect of temperature and shear rate.
Energies 11 00782 g002
Figure 3. Effect of dimensionless temperature on the power law indices (K and n) of sCO2 foam.
Energies 11 00782 g003
Figure 4. Match of the predicted viscosity values of sCO2 foam using Equation (6) with the experimental data.
Energies 11 00782 g004
Figure 5. Validation of Equation (6).
Energies 11 00782 g005
Figure 6. Apparent viscosity of sCO2 foam with the effect of pressure and shear rate.
Energies 11 00782 g006
Figure 7. Effect of dimensionless pressure on the power law indices (K and n) of sCO2 foam.
Energies 11 00782 g007
Figure 8. Match of the predicted viscosity values of sCO2 foam using Equation (10) with the experimental data.
Energies 11 00782 g008
Figure 9. Validation of Equation (10).
Energies 11 00782 g009
Figure 10. Match of the predicted viscosity values of sCO2 foam using Equation (11) with the experimental data shown in Figure 2.
Energies 11 00782 g010
Figure 11. Match of the predicted viscosity values of sCO2 foam using Equation (11) with the experimental data shown in Figure 6.
Energies 11 00782 g011
Figure 12. Validation of Equation (11) with experimental data of apparent viscosity obtained at 60 °C.
Energies 11 00782 g012
Figure 13. Validation of Equation (11) with experimental data of apparent viscosity obtained 1750 Psi.
Energies 11 00782 g013
Table 1. Parametric estimates of the power law model for sCO2 Foams.
Temperature (°C)Pressure (psi)Parameter EstimatesR2
K (mPa·s)n (Unitless)
Set A40150038250.330.999
80150021210.4050.997
10015001478.50.4570.999
1201500684.350.5670.998
Set B801000443.530.5960.996
80150021210.4050.999
80200029590.370.999
8025003633.70.3880.999
Table 2. Parametric estimates of the sCO2 foam viscosity model (Equation (6)).
ParameterEstimateR2
a1−1630.8200.999
a23910.034
b10.075
b2−0.027
b30.328
Table 3. Parametric estimates of the sCO2 foam viscosity model (Equation (10)).
ParameterEstimateR2
c1−1089.1271.00
c23745.258
c3481.335
d10.198
d2−0.421
d30.573
Table 4. Parametric estimates of the sCO2 foam viscosity model (Equation (11)).
Parameter Estimates
ParameterEstimateR2
e1−1156.0221
e23836.989
e3298.957
e4−2338.651
e52527.240
f10.204
f2−0.426
f30.031
f40.070
f50.468

