1. Introduction
The turbine is the core component of hydropower systems and improving its efficiency, defined as the ratio of power extracted from the water to the product of the mass flow rate, gravity, and available head at the turbine. This definition is used in most, but not all, previous studies. Efficiency has a clear link to increased power output and reduced system cost. The crossflow turbine is simpler in design and cheaper to manufacture than other types such as Pelton, Turgo, and Francis. Crossflow turbines are mostly used in remote power systems in developing countries, and have a typical efficiency in the range of 70–85%. Despite the efficiency being lower than other types, the crossflow turbine exhibits a flatter efficiency curve with varying runner angular velocity,
, which can be an important advantage. Since its invention by Michell in 1903 [
1], the key design problem has been to improve its maximum efficiency,
. This review highlights the most important design features and key design principles for achieving efficiencies of around 90%. Our emphasis is on synthesizing the results of the most efficient turbine designs, in order to provide a basis for future designs.
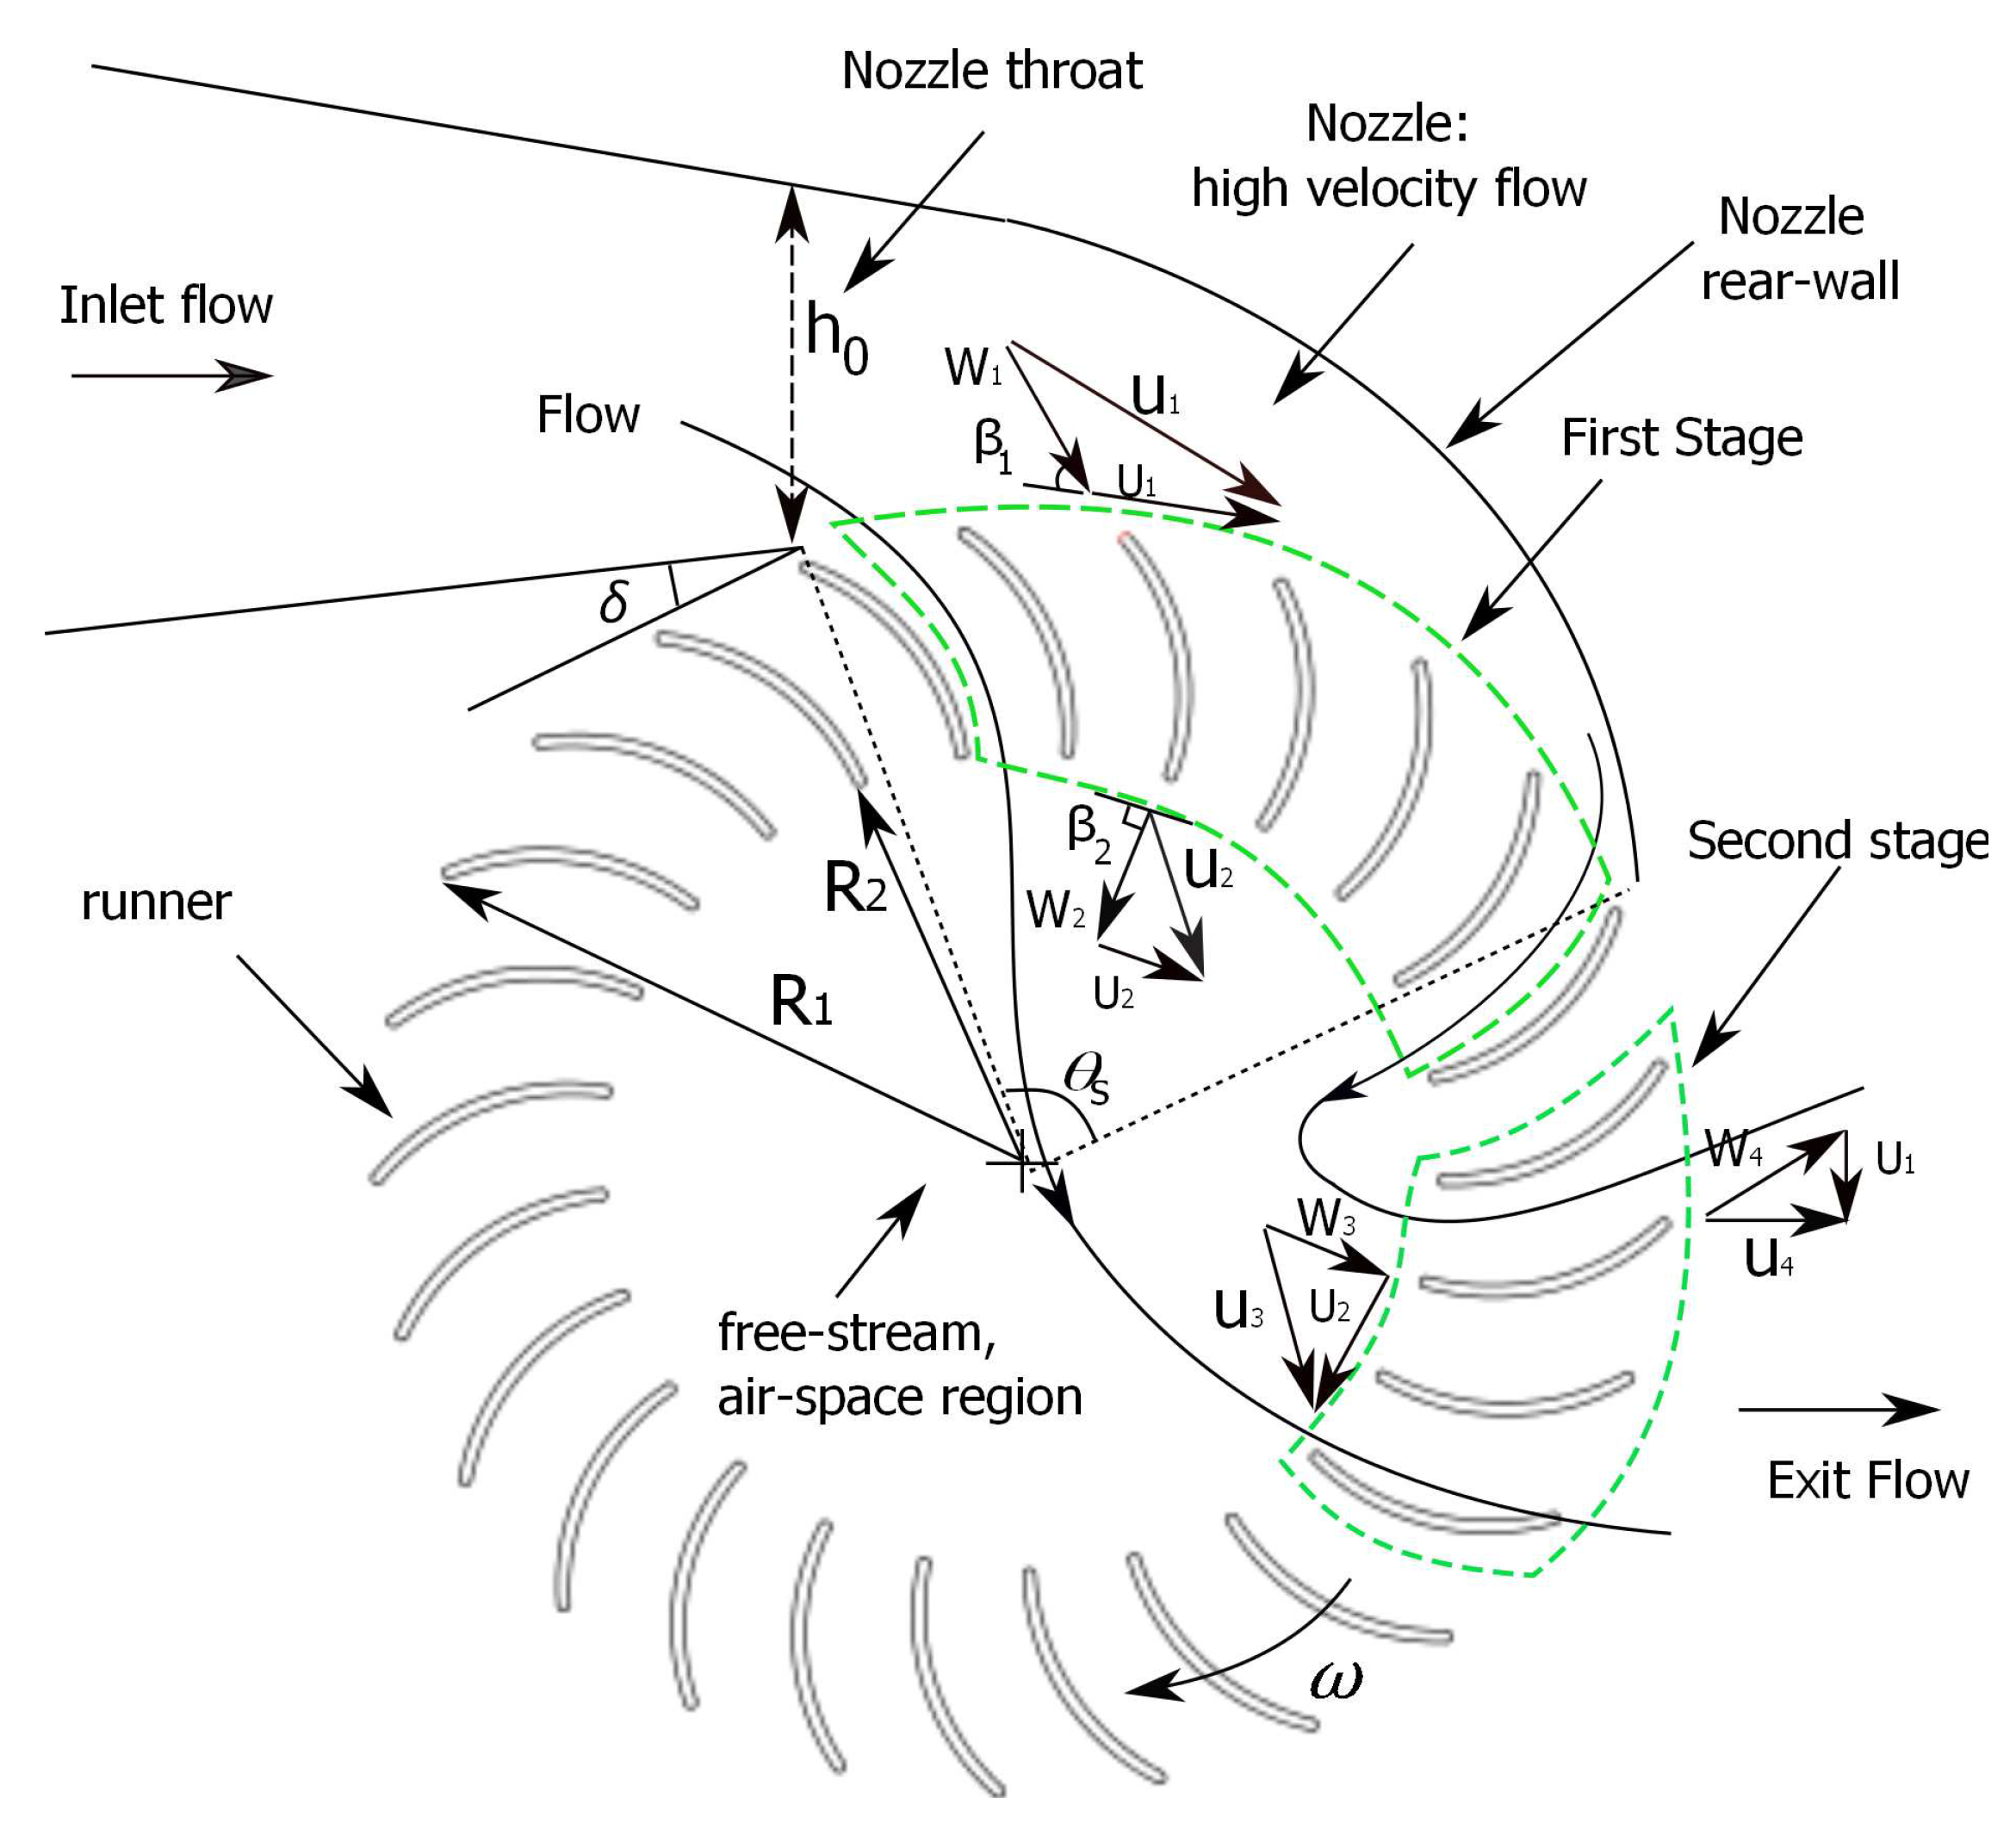
As shown in
Figure 1, the crossflow turbine comprises two main components: a stationary nozzle and a rotating runner. The nozzle accelerates the inlet flow and directs it at the runner at angle
. For maximum efficiency,
should match the outer blade angle of the runner taking into account the transfer from stationary to rotating co-ordinates. The latter angle is omitted from
Figure 1 for clarity. Nozzle design is important because the runner entry flow directly affects the performance of the runner, which, in turn, must be designed to extract the maximum amount of angular momentum (Adhikari and Wood [
2]). In this review, we do not consider a guide vane as used in most actual turbines for controlling the inlet flow. In
Figure 1, a guide vane would normally be upstream of the nozzle throat; for details, refer to Figure 7 of Paish [
3]. A guide vane significantly reduces the quality of the inlet flow by splitting it into two jets and producing non-uniform entry flow angles that can cause a serious loss in turbine efficiency. Adhikari and Wood [
2] showed that flow control is required to maintain high efficiency at part load, that is, unchanged
H at reduced
Q, so an alternative to a guide vane is required. A good choice appears to be the slider at the runner entry described by Sinagara et al. [
4]. The slider is a circular segment that reduces the entry arc length,
in
Figure 1, as the
Q decreases. Adhikari [
5] showed computationally that this flow control mechanism does not reduce
at design flow rates and can also maintain part-load efficiency close to the maximum. As maximum efficiency at full load is the topic of this review, we omit consideration of the part-flow control mechanism.
Adhikari and Wood [
2] presented a methodology for designing nozzles without a vane based on conversion
H at the nozzle inlet into kinetic energy at entry to the runner, which is the same principle that governs Pelton nozzle design. Assuming that
W, the width out of the page in
Figure 1, is the same for the nozzle and runner; this principle leads to straightforward equations for the nozzle rear-wall, given by their Equation (5) for tangential entry (angle
in in
Figure 1) and their (7) for the more general oblique entry (
) shown in the figure.
The key geometrical parameters for the runner are the inner to outer radius ratio (
), outer blade angle (
), inner blade angle (
), and number of blades (
). Of these,
must be close to
to avoid separation on the blades and loss of efficiency, leaving only
and
as parameters to be varied in seeking maximum efficiency. The circular arc blades usually have small thickness.
Figure 1 shows a unique feature of the crossflow turbine; the flow passes twice through the rotating runner. The flow enters from the nozzle, passes through the “first stage”, traverses the central air-space, and exits through the “second stage”. Often, the first stage does not convert all the available energy into power, Choi et al. [
6]. This dual use of the blades to extract power requires a change to conventional blade terminology: we use “outer” and “inner” for the blade angles in either stage. In addition, “inlet” describes the flow anywhere in the nozzle with “entry” referring specifically to the flow as it passes from the inlet to the runner. For maximum performance, at the runner angular velocity
,
is easily found to be
where subscript “
r” indicates a radial, and “
” a tangential component, and it is assumed that the runner entry velocities are uniform. This is Equation (10) of Adhikari and Wood [
2]. By matching kinetic energy at the runner entry to the product of runner torque and
, and assuming that
no angular momentum exits the second stage, Equation (14) of Adhikari and Wood [
2] gives the optimum
,
, for nozzle velocity
according to
Note that the runner parameters are on the left side of Equation (2) and the nozzle parameters on the right side. is common to the nozzle and runner. Note further that the second term on the right, , is usually much less than unity, so this criterion for optimum performance is close to that for a Pelton turbine, which is not surprising as the design principle for the nozzle of both turbine types is the same.
We divide the previous studies of crossflow turbines by whether they were mainly experimental or numerical. There are also some analytic formulations for calculating turbine efficiency (e.g., Mackmore and Merryfield [
7]), but Adhikari [
5] showed they are not accurate, and are thus omitted from this review. Most experimental studies were of the effects on turbine performance of varying the runner geometry without measuring the internal flow and its impact on efficiency. Thus, the only measurement available is the turbine efficiency as a function of
as a function of
H and
Q. Similarly, most numerical studies focused on performance prediction of individual turbines using Reynolds-average Navier–Stokes (RANS) simulations, rather than on the study of internal flow that is important for improving the maximum efficiency. Only recently, Adhikari [
5] characterized the main flow features of 8–90% efficient turbines, and applied these to improve the efficiency of a turbine measured at 67–91%. We anticipate that these results provide fundamental design principles for further improvement of
. Therefore, we concentrate on high efficiency turbines. None of these turbines with high
had a guide vane.
The structure of this paper is as follows. The next section reviews the experimental work. Then,
Section 3 does the same for the computational studies, emphasizing the flow features and possibilities for design improvements. The main design principles are collected in
Section 4, which is followed by a list of areas for future work and the main conclusions.
2. Experimental Studies
The main geometrical features of turbine design are well known, but their combined effects on performance are not. The important previous studies [
7,
8,
9,
10,
11,
12,
13,
14,
15,
16,
17,
18,
19,
20] are listed in chronological order and summarized in
Table 1. Most have reported
or less, which is significantly lower than that the typical maximum efficiency for the Pelton, Francis and Kaplan turbines of over 90%. Only three experimental studies have reported
in the range 88–90% and
none of these used a guide vane in the nozzle. Fiuzat and Akerkar [
18] found
at part-flow conditions with a flow diverter in the air-space but did not achieve maximum efficiency at the design flow. Desai [
19] developed a 0.53 kW turbine with
from extensive testing of various designs. In continuation of his work, Totapilly and Aziz [
20] achieved a remarkable
just by increasing the number of blades from 30 to 35. These turbines are the most efficient crossflow turbines reported in the literature; no larger-scale turbines of comparable efficiency have been reported. Unfortunately, no measurements have been made of the nozzle flow or that in the two stages of the runner, which should be valuable in guiding the design of more efficient turbines. Recently, Adhikari [
5] used the experimental results of Desai [
19] and Totapally and Aziz [
20] in a computational study to understand the dominant flow features. The major findings will be presented in the next section.
The influence of the nozzle inclination,
in
Figure 1, on the efficiency was studied by [
12,
14,
18,
19,
20] and others. It has been assumed that
where
is the radial velocity and
is the tangential velocity at the entry to the runner. Khosrowpanh [
14] and Nakase et al. [
12] found that
= 16
gave the maximum efficiency between 80% and 82%. Fiuzat and Akerker [
18] found that
at
= 24
, and Desai [
19] reported the
at
= 22
. Similarly, Totapally and Aziz [
20] found
at
= 22
. It is emphasized, however, that matching of
and
is more relevant than
in avoiding the flow separation on the blades. Furthermore, the nozzle design methodology of Adhikari and Wood [
2] includes the effect of
directly and determines
mainly from the
—dependence of the rear-wall shape,
). The influence of
and
has been studied by several researchers [
19,
20]. These angles affect flow separation on the blades, the runner efficiency, and the relative power output of the first and second stages. The majority of previous studies found
occurred at
= 39
, whereas
was kept at 90
. Desai [
19] found that
= 90
gave the maximum efficiency, whereas Totapally and Aziz [
20] found that
= 55
gave slightly greater maximum efficiency than
= 90
. It is noted that the nozzle design greatly influences the magnitude and uniformity of
at the runner entry, which should match
.
The impact of the nozzle rear-wall shape,
in
Figure 1, was studied by Nakase et al. [
12]. Circular and logarithmic spiral shapes gave nearly the same peak efficiency. However, they did not investigate the effect of
on the runner performance. Nozzle design was also studied by Dakers and Martin [
10] for a 7 kW turbine with
= 30
,
= 90
,
= 0.68 and
= 20 for
H = 10 m and
Q = 105 lps. By changing the rear wall shape and orientation, they achieved
for the same runner. Extensive measurements were done at varying
H,
Q, and
. Their work also includes detailed information of the turbine geometry, the operating conditions, and results in allowing meshing for a computational simulation. This turbine has been numerically investigated by Adhikari [
5] and Adhikari et al. [
21] for cavitation, and by Adhikari [
5] and Adhikari and Wood [
2] for performance losses and design improvement. The results will be reviewed in the next section.
Refs. [
12,
14,
18] and others investigated the influence of nozzle entry arc angle,
, on the efficiency. They found that
= 90
gave the maximum efficiency. Fiuzat and Akerkar [
18] and Totapally and Aziz [
20] found that vertically oriented nozzles with
= 90
had
. However, they did not compare the efficiency difference between horizontal and vertical orientations. We believe the differences would be marginal as is the case for Pelton turbines. The relevant non-dimensional parameter from Equation (2) is
. We show later that this parameter has the value 0.34 for a low efficiency turbine (69%) and 0.37 for high efficiency turbines (88–90%), so there is not much difference.
Studies on the influence of
, which do not appear directly in Equation (1) or (2), on the efficiency have determined that the value 0.68 is optimum [
7,
9,
10,
12,
14,
15,
18,
19,
20]. Smaller
means longer blades and reduces the size of the central air-space of the runner, where the water streams exiting the multiple blade passages of the first stage combine before passing through the second stage. The influence of
on the internal flow structure and the runner performance has not been studied.
The influence of
on
also cannot be guided by theory; Equations (1) and (2), and the principle of conversion of
H to entry kinetic energy, do
not depend on
. It is likely that, starting from a small value, increasing
will increase
until the point at which boundary layer blockage becomes important, after which
decreases. The influence of
on efficiency was studied by [
12,
14,
19,
20] by varying
. Khosrowpanh [
14] conducted experiments with
= 10, 15 and 20; fifteen blades gave the highest
. Nakase [
12] found that
= 26 is the optimum
for a runner with
= 157.5 mm. Desai [
19] and Totapally and Aziz [
20] found that
and 35 gave
and 90% respectively. However, Fiuzat and Akerker [
18] obtained
with 20 blades on a similar size runner to that used by Desai [
19] and Totapally and Aziz [
20]. As mentioned above, no measurements of the flow in the runner have ever been made so the effect of
on flow separation on the blades and, therefore, efficiency cannot be deduced experimentally.
Simple nozzle design theory does not allow assessment of the stage contributions to the total power by controlling the geometric parameters
and
. It is not surprising that there are no measurements of the division of the total power between the first and second stages. Fiuzat and Akerkar [
22] designed a special turbine with a flow diverter in the internal air-space to measure the relative contributions of the two stages to the total power output. A significant percentage of the power was extracted at the second stage; at least 45% for
= 90
, and at least 41% for
= 120
. They argued that turbine efficiency can be improved by increasing the crossflow in the air-space, which will increase the output from both stages. The applicability of this result is limited because they did not study the influence of
,
and
on stage performance. The computational determination of relative stage performance in the next section suggests that second stage extraction can be significant at
.
No experiment considered the internal flow characteristics and their effect on turbine efficiency. Durgin and Fay [
13] visualized the internal flow with an open-ended, cantilevered runner. They placed an external flow deflector inside the runner to control the flow direction and measure the contributions of each stage. They varied
and measured
Q and the flow “trapped” in the blade passages after the first stage and prevented from entering the second stage. It is noted that the trapped flow does not pass through the central air-space. The flow passing through the central region was called “crossflow” and the appellation “crossflow turbine” appears for the first time in the work of Durali [
9]. Durgin and Fay [
13], however, could perform the experiments only at part-load, but not at design
Q due to high flow interaction. The most significant result was the amount of trapped flow inside the blade passages. It was directed tangentially, and increased as the speed increased or as the crossflow decreased. In addition, as
was increased from 30 to 80
, the amount of trapped flow increased. They obtained
and found the second stage contributed only 17% to the total power production. However, their findings were not generalized, and are of limited help in achieving efficiencies of 88–90% or higher. Nevertheless, the split between the stages is interesting, particularly because this is the only measurement apart from Fiuzat and Akerker [
22], and it suggests that the crossflow design inherently allows “recovery” in the sense that power not extracted by the first stage may be extracted in the second. They also observed that a significant amount of trapped flow did not lead to power extraction at the second stage. In one of the early theoretical analyses, the runner flow was assumed to move through the central region of the runner as an ideal, “well-developed single jet” [
7]. Durgin and Fay [
13] did not observe this regime as the only one in their experiment. They also concluded that the trapped flow varied with
and caused significant incidence losses at the second stage.
impacted the amount of flow passing through the central air-space, and the efficiency improved as the amount of crossflow increased. They modified the turbine for the effects of trapped flow, which slightly improved the
to 66%. Their observations, however, are not likely to be useful in achieving efficiencies around
.
3. Computational Studies
Although the key geometril features and their effects on turbine efficiency have been experimentally studied, this knowledge does not readily help to design high efficiency turbines, partly because of the lack of knowledge about the details of the runner flow. As it is difficult and expensive to measure and visualize the flow fields in the runner, the alternative is computational simulations. Because the studies under review modeled the whole turbine, it seems better to review them chronologically, rather than by specific feature, as was done in the previous Section. Recent RANS simulations include [
4,
6,
23,
24,
25,
26]; however, they provide little of the flow, and do not address the design problem of improving efficiency. These studies have employed the
k-
and shear stress transport (SST)
k-
turbulence models with homogeneous, two-phase free-surface models for water and air. Most studies investigated low-efficiency turbines and were aimed at predicting the turbine performance. Moreover, the reported flow patterns were only basic, rather than a detailed identification of the loss mechanisms and their influence on the runner performance. Typically,
can be determined to within
and there is little difference between the two turbulence models referred to above, e.g., [
2]. Typical results from [
2] are shown in
Figure 2; in addition, it is clear that unsteady RANS (URANS) models do not seem to provide increased accuracy.
The key nozzle design principle: the need for conversion of head into kinetic energy at the runner entry, formulated by [
2], was not considered previously, and little information is available in prior studies on the role of the entry velocities
and
, or
on the runner performance and turbine efficiency.
Choi et al. [
6] showed that guide vane setting in the nozzle influences efficiency during part-flow operations, possibly due to improving the nozzle flow and maintaining a suitable angle of attack. The improvement, however, is relative to
. Apart from Acharya et al. [
25], discussed below, this is the only computational study to include a guide vane, but, unfortunately, no details were provided of the nozzle flow and the effect of the guide vane on it. They also showed that an air-layer in the blade passages, via suction through air vents around the runner, improved efficiency by reducing recirculation in the blade passages.
De Andrade et al. [
23] used 3D steady RANS computations with a water–air homogeneous flow model, free-surface effects, and the
k-
turbulence model. They found that about 68% of the power is produced in the first stage in a turbine with
. They determined
and
and the angle at the inlet of the second stage. A significant difference was found between
and
. However, no attempt was made to use this information for design improvement.
Sammartano et al. [
24] describe a two-step design methodology for the optimal design of crossflow turbines but defined efficiency in terms of the head difference between inlet and outlet. This gives a higher value than the definition used here. The first step is a simple analytical nozzle design equation. The second gives a set of empirical values for the runner design, which can be refined using steady and unsteady RANS computations. A simulation of a 5.2 kW turbine of optimal design, using steady and unsteady RANS computations and the SST
k-
turbulence model and two-phase homogeneous model with free-surface effects, gave a maximum efficiency of 86%. However, this efficiency must be greater than the more common one used here. As discussed in the previous section,
in the range of 88–90% has already been achieved by [
18,
19,
20] and thus [
24] does not indicate the most desirable design attributes of high efficiency turbines. More importantly, they did not provide a fundamental analysis of the flow characteristics and loss mechanisms, and their influence on the runner performance.
Acharya et al. [
25] performed steady RANS computations on a turbine with
. They used the SST
k-
turbulence model with the homogeneous multiphase model for modeling water and air with free-surface effects. They modified the nozzle rear wall of circular shape, adjusted the guide vane opening, and changed
from the reference turbine. This increased
from 63 to 76%. However, they did not document the changes in the flow field, and the effects on the runner performance. Specifically, no detailed analysis was attempted for the nozzle and guide vane performance, inlet flow conditions, and power extraction in the two stages. Therefore, the results are of limited use for design improvement. Following the same design procedure presented in reference [
24], Sammartano et al. [
26] designed and evaluated corssflow turbine performance using RANS simulations and measurements. However, their design gave
and so their work is not considered further.
In a recent computational study, Adhikari et al. [
21] showed that cavitation can occur in crossflow turbines. Using steady RANS computations with the SST
k-
turbulence model and homogeneous multiphase model for water and air with free-surface effects, they studied cavitation inception on the 7 kW turbine of [
10]. Cavitation started at the inner edges of the second stage blades at and above
. This study suggests that cavitation may be an important consideration for crossflow turbines but only if they are poorly designed to operate past the maximum efficiency point in terms of
Q. No further information about cavitation in crossflow turbines is available in the literature. Further experimental and numerical investigations are needed to test the generality of the specific conclusion reached from numerically studying one turbine with low efficiency.
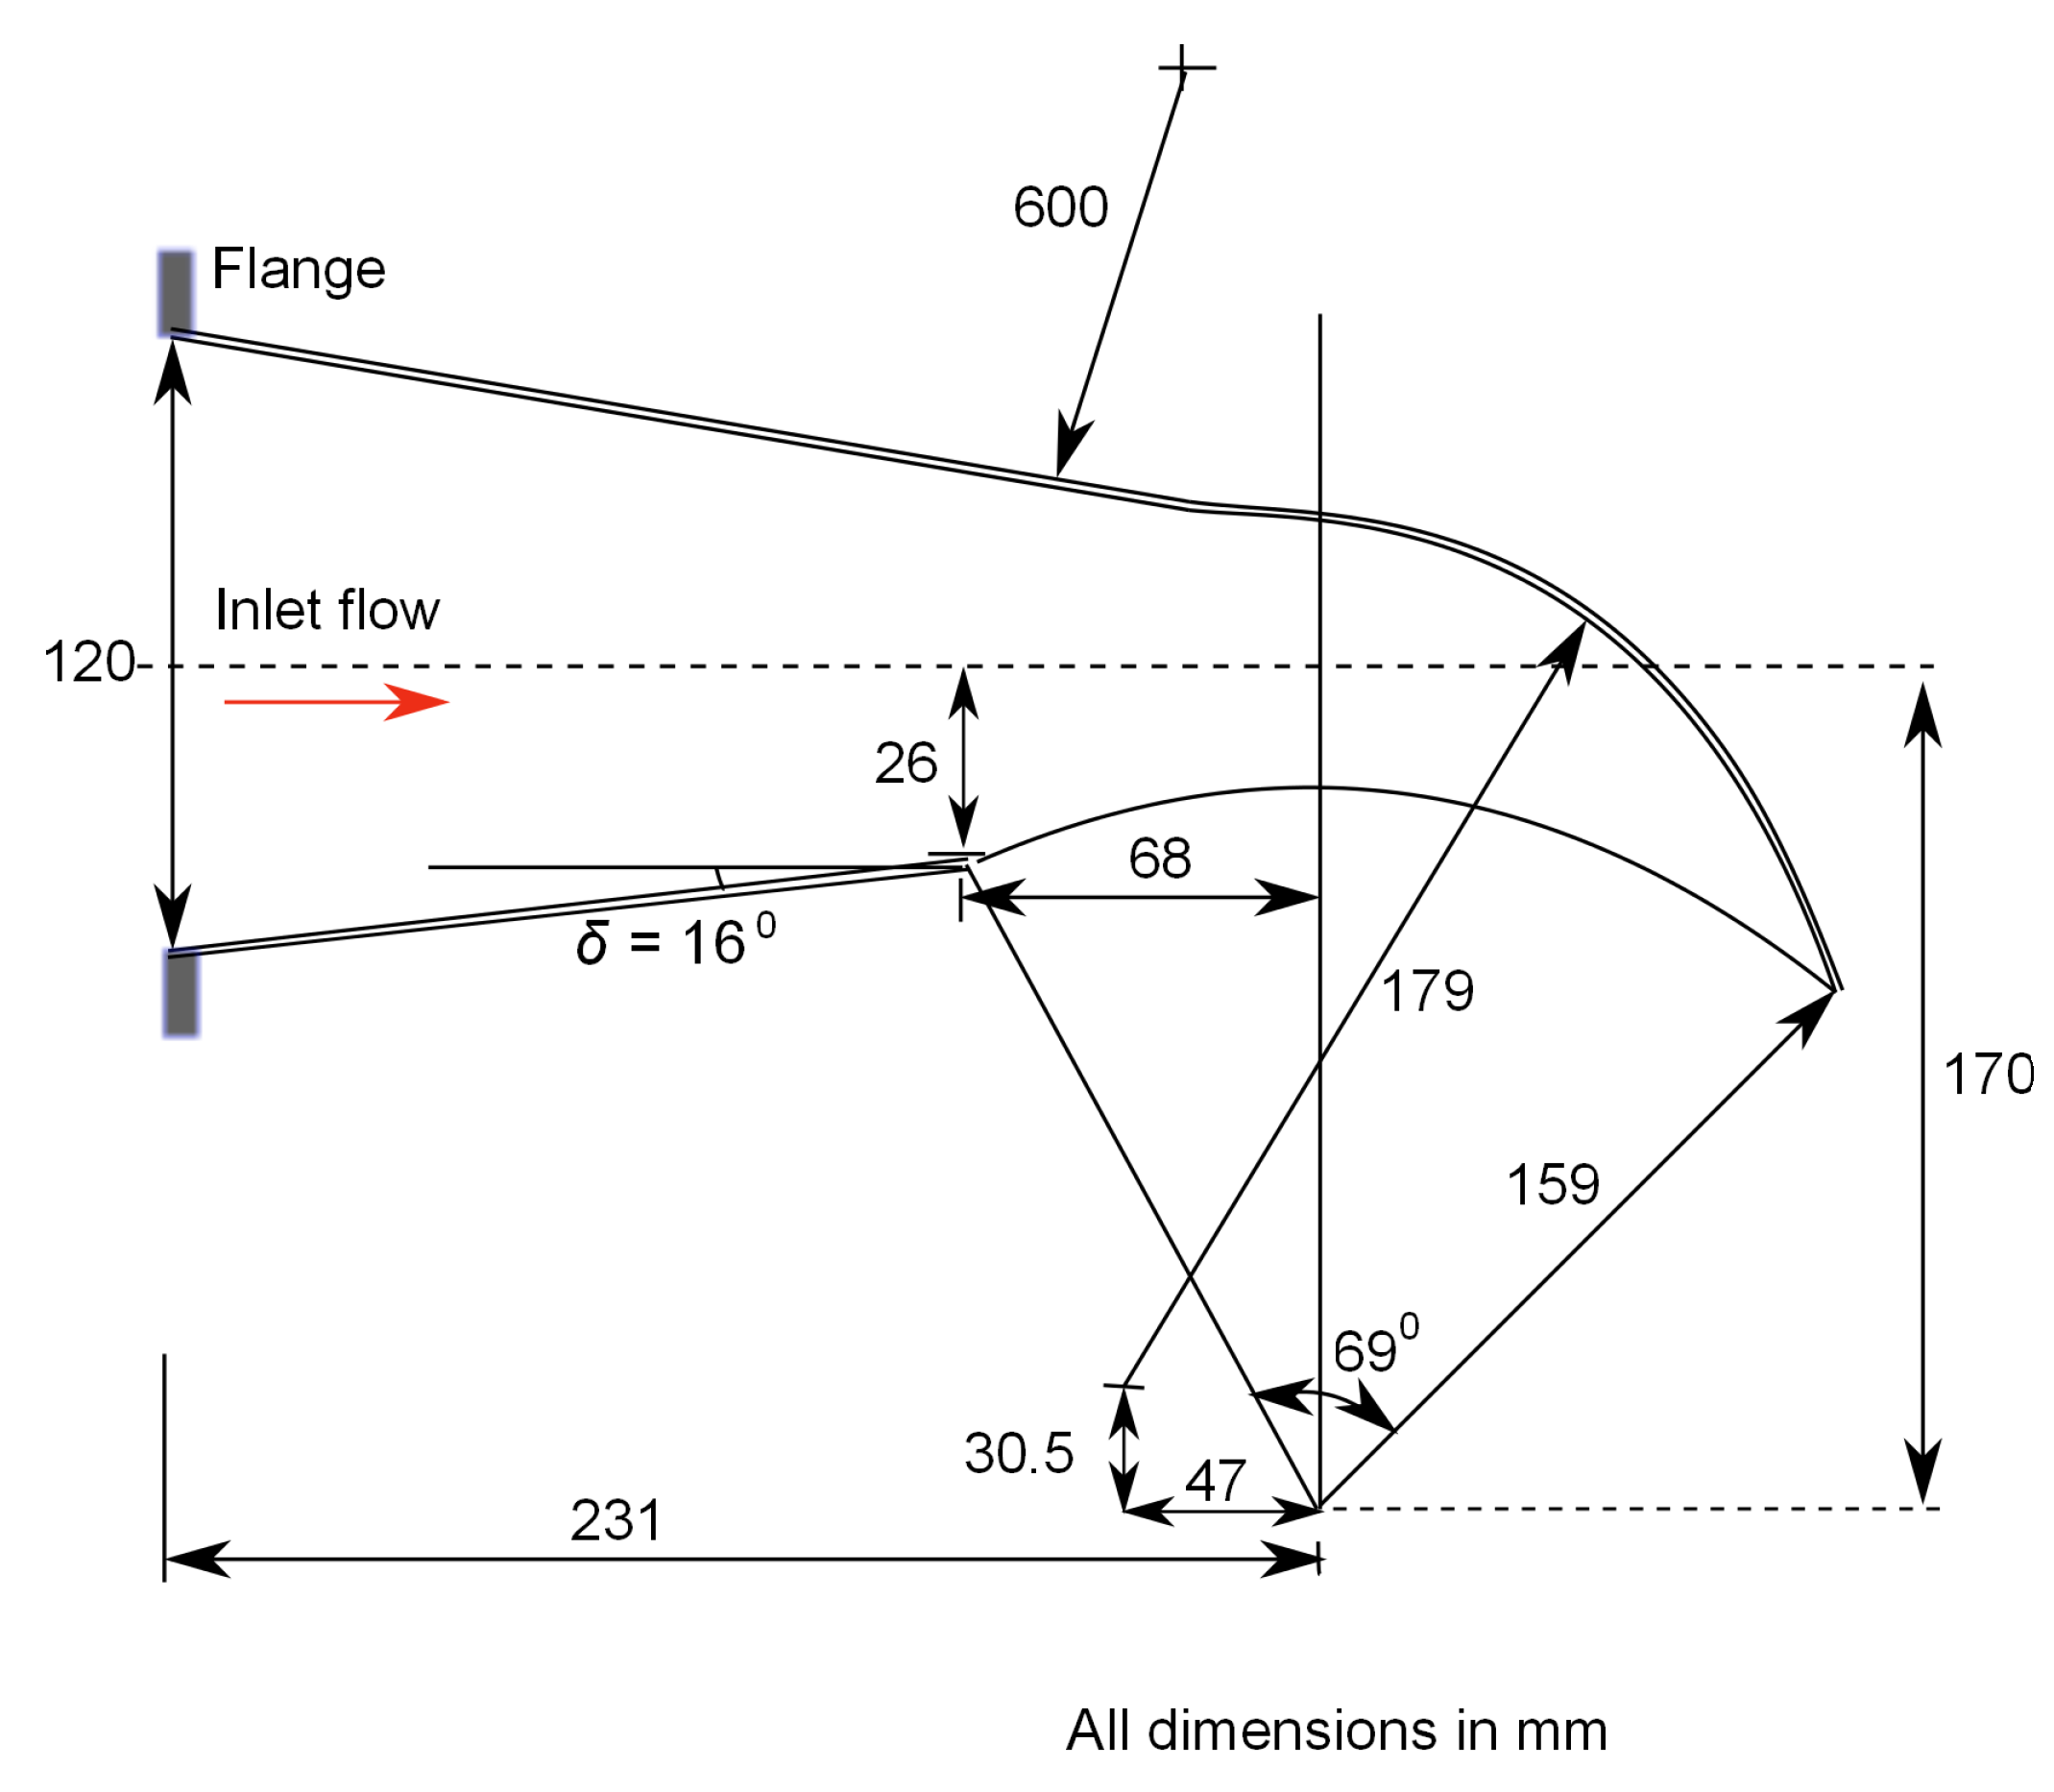
Adhikari [
5] characterized the key flow features of low and high efficiency turbines. The 7 kW turbine with
of [
10] showed massive flow separation on the blades, shown in
Figure 3, caused by a significant difference between
and
. In addition, the inlet
H was not converted into kinetic energy in the nozzle [
2]. The schematic of the turbine geometry is shown in
Figure 4 and the geometrical parameters are presented in
Table 2.
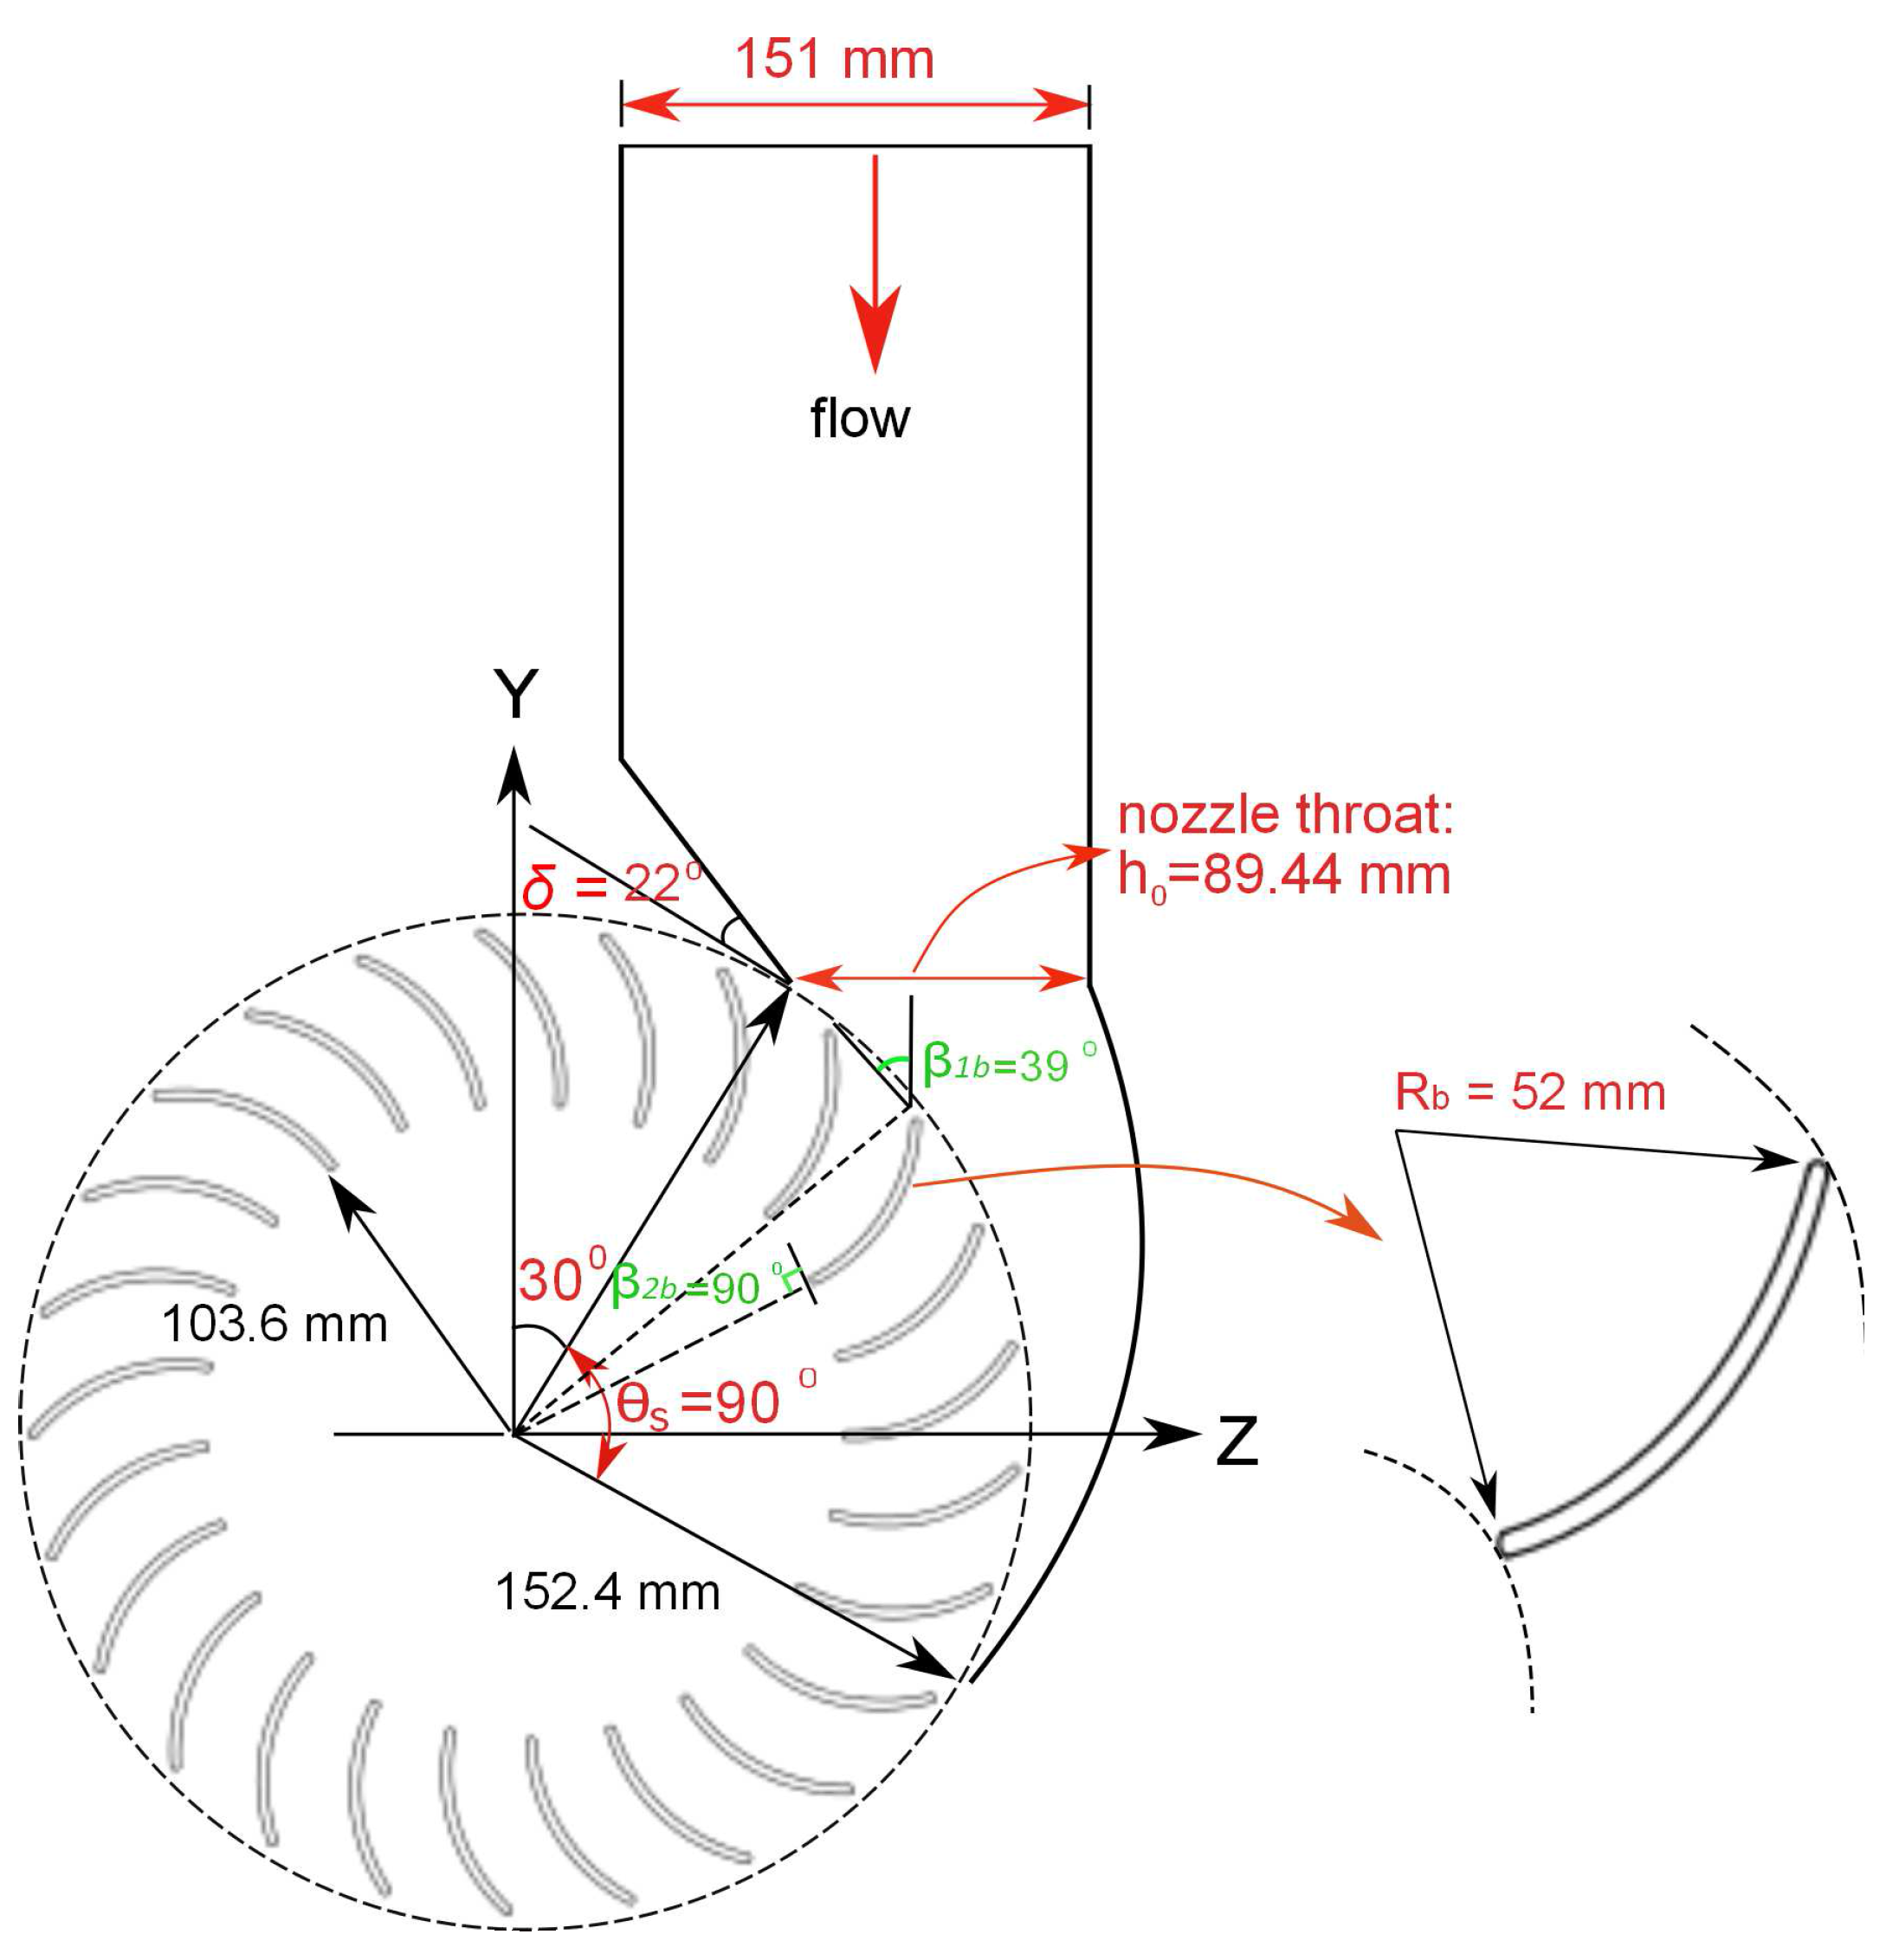
By matching of nozzle and runner designs using
, Desai [
19] achieved a high efficiency. Here, we describe only the main results relevant to numerical simulation. A schematic diagram of his high efficiency turbine is shown in
Figure 5 and the geometric parameters are listed in
Table 2. Measurements were performed at different flow rates and heads and speeds. The main geometrical parameters varied were
,
,
,
,
, and
.
In the following sections, we review the main results of computational studies of [
5] to which the reader is referred for more details.
3.1. The Flow in Crossflow Turbines
We will continue to treat the runner blades as thin circular arcs because this is essential for reducing the cost and ease of manufacture of crossflow turbines. With this assumption, the main runner parameters that are not fixed by the nozzle—see Equations (1) and (2)—are
,
, and
or
. The values of these parameters for the two turbines under consideration are given in Table 1 of [
2], which is reproduced here also as
Table 2 for convenience. Figures 4 and 5, also given in [
2], provide the remaining information on the geometry.
The performance of the 7 kW turbine is shown in
Figure 2.
Figure 3, which is Figure 11 of [
2], shows the computed flow through the 7 kW turbine at
and
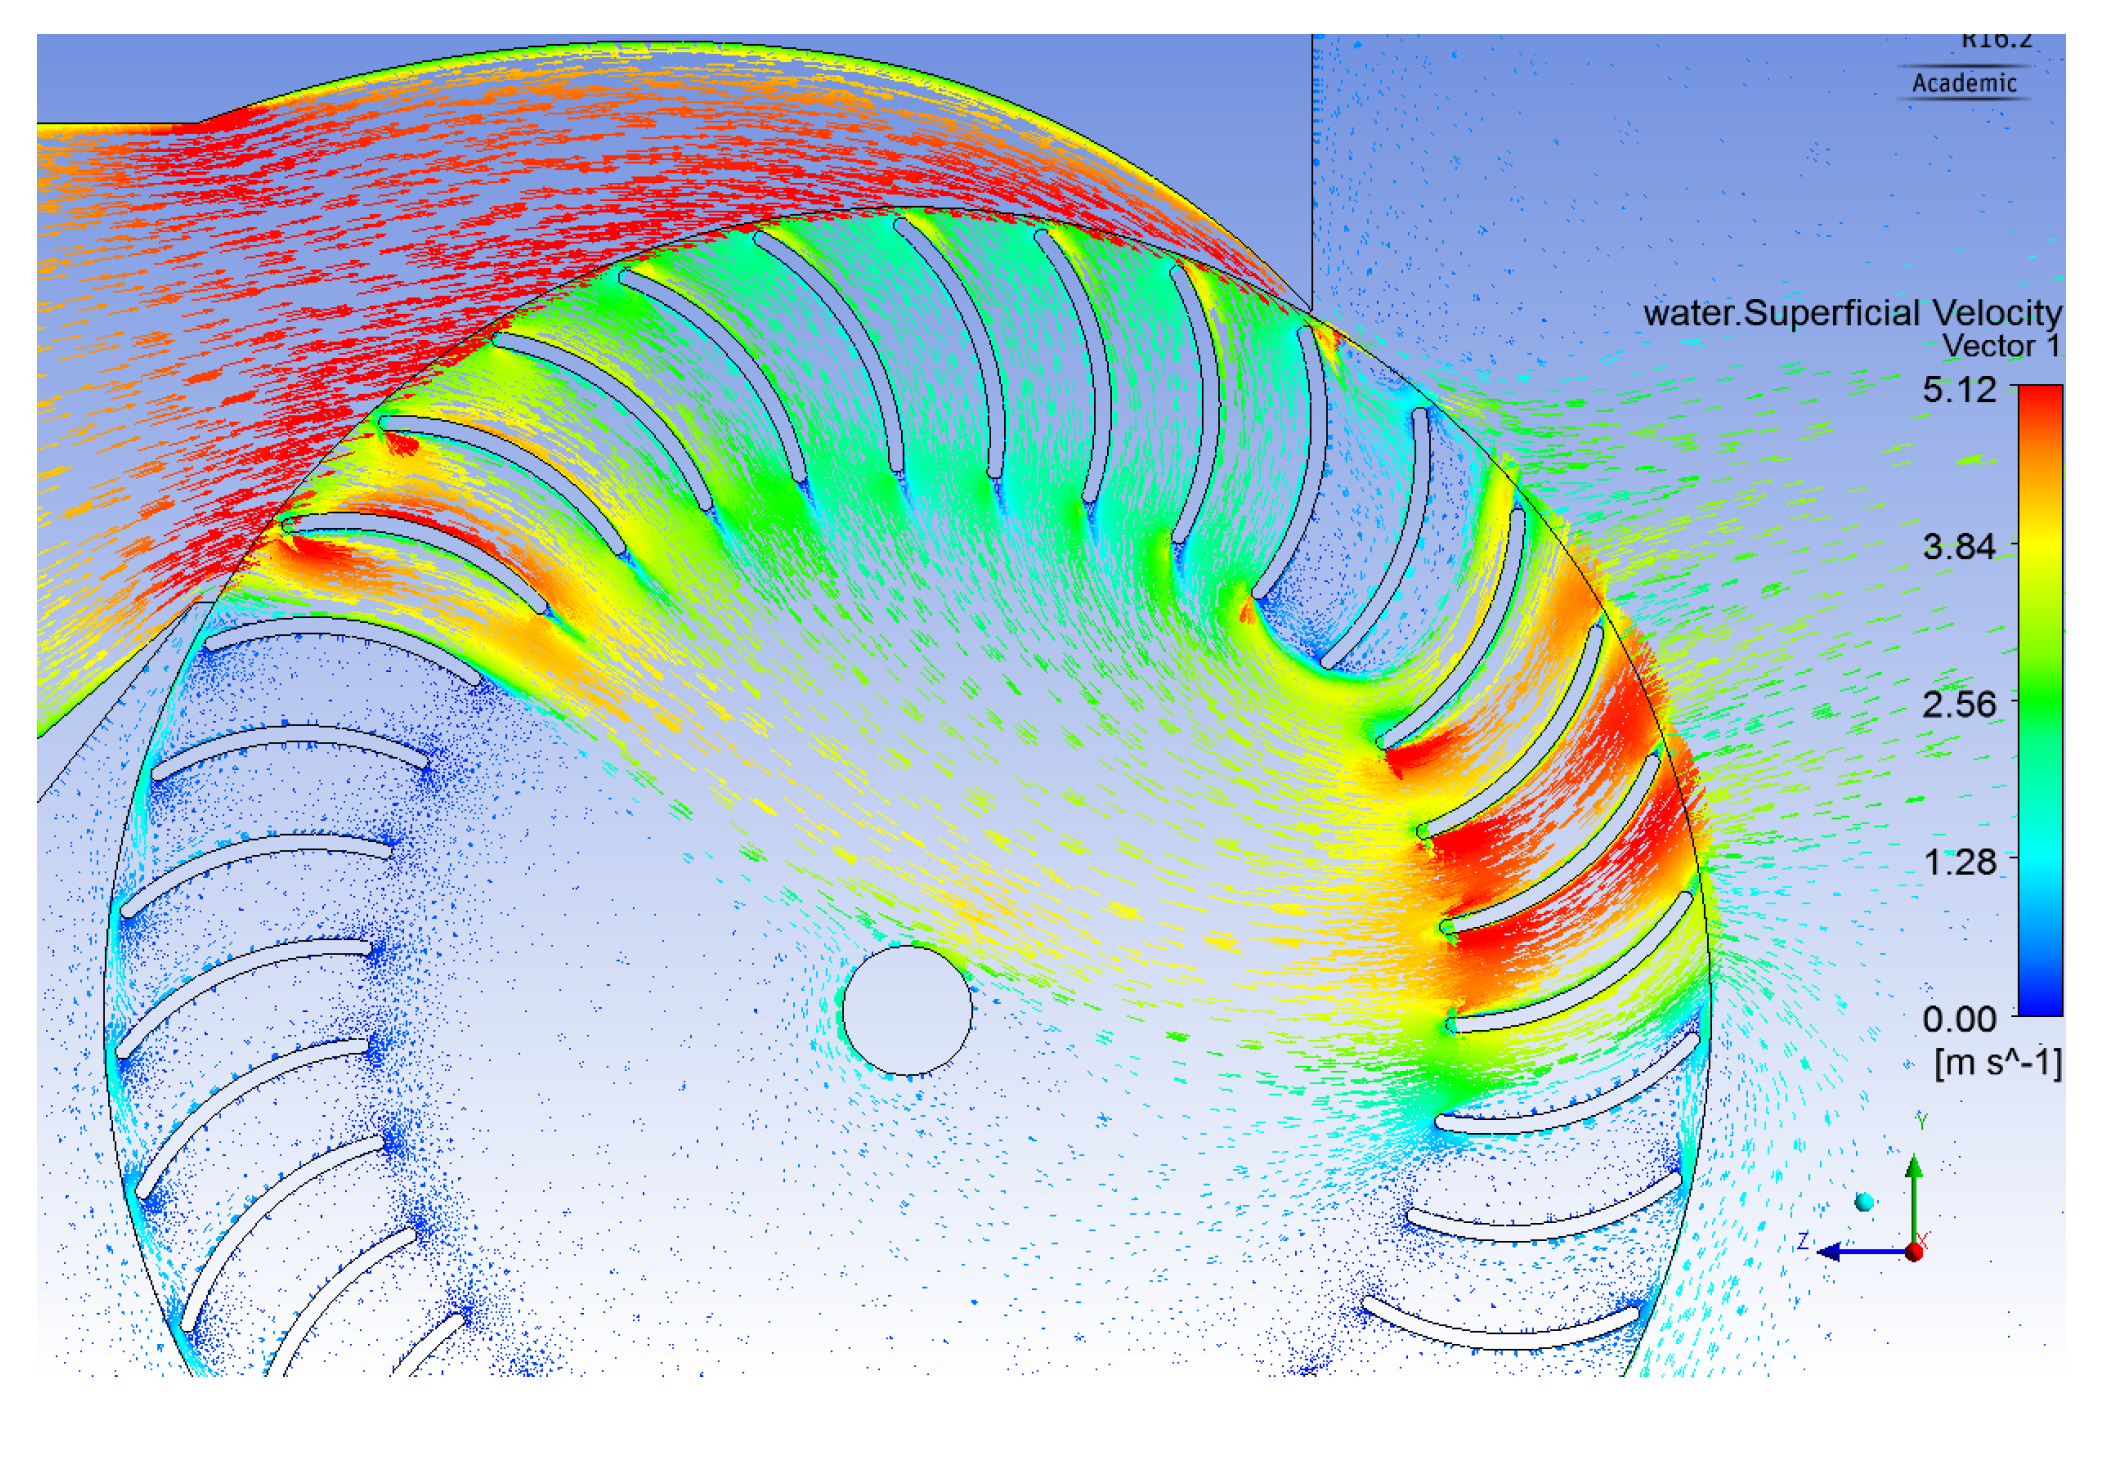
= 450 RPM. It is clear that there is significant flow separation from the blades in the first stage, but surprisingly not in the second stage.
Figure 6a (Figure 14 of [
2]) shows the corresponding flow for the 0.53 kW turbine indicating no separation in the runner. (Part (b) of
Figure 6 will be discussed below.). For both turbines, it is remarkable that the second stage is contiguous with the first. As
increased,
at the first stage increased, whereas the second stage inlet flow angle
decreased. As a result, the flow was deflected more toward the upper region of the second stage. It is noted that as the exit area of the first stage is reduced by a factor of
from the entry area, so the flow converges as it passes through the first stage. Thus, the area occupied by the water decreased as the runner speed increased. It is noteworthy (but not shown here for brevity) that, at low
, the flow passed through more of the air-space and the angular extent of the two stages increased. The results are also consistent with the experimental observations of [
13] and numerical simulations of [
23]. At
,
closely matched the inner blade angle
. The detailed analysis can be found in [
5]. It is noteworthy that the flow entering the second stage is influenced by
. As the ratio increases, there is less of a chance of flow separation in the second stage than in the first stage even if
differs from
. However, it does not necessarily improve the power extraction or the efficiency; detailed studies of the influence of
on efficiency and stage performance can be found in [
5] where the value from
Table 1,
is confirmed. That the two stages can occupy less than 180
suggests the use of two opposing nozzles, much like a double jet Pelton turbine, which could double the power density, and reduce cost per unit power and sources of vibration.
Velocity vectors and contours give only a general view of the runner performance. In particular, they do not show the distribution of the power extraction around the runner. This is plotted for the 7 kW turbine in
Figure 7 in terms of the power produced per blade, determined by using a control volume analysis for each blade’s contribution to runner torque. The azimuthal angle
is measured relative to the horizontal, which is in the
direction in
Figure 5. Thus
has a different origin to
which is zero at the start of the first stage. There is a significant variation in power production between the blades in the first stage of the 7 kW turbine. The reason is that
is significantly larger than
near the nozzle throat (see Figure 10 of [
2]).
then decreases for the remaining blades but is always greater than
. This causes the flow separation shown in
Figure 3 and the poor power production in this stage. Similarly, there is a significant azimuthal variation in the second stage power production that has peaked over a small portion of that stage. This is due to the azimuthal variation in the flow angle
at the entry of the second stage or the effect of increasing runner speed. At
= 450 RPM, the second stage performance has increased. We also note for the 0.53 kW runner in particular that, apart from the lowest
, the azimuthal extent of the first and second stages is less than
, which, as noted earlier, is interestingly less than
.
As
increases above
, the difference between
and
increases according to Equation (1). The results, documented in [
5], indicate that some blades in the first stage eventually produced negative power. This is shown in
Figure 7, particularly for
, where
is very high. It is important to note that the behaviour of the runner with negative power has not been recognized before. For
RPM,
is too high or the relative velocity
defined in
Figure 1 becomes negative and power extraction decreases and becomes negative at small angles. This is the main reason for the runner inefficiency above 450 RPM. At
RPM, power production is almost linear in
over the entire entry. At lower speeds,
RPM, the power extraction increased only slightly toward the right nozzle lip for
. At very high runner speeds, say above
RPM, the power production has sharply increased in the azimuthal range
, and is increased as
increases.
The power extraction in the runner of the 0.53 kW turbine, for which
RPM, is shown in
Figure 8 for the blades comprising the first and second stages. Both power extraction and
(Figure 19 of [
5]) are more uniform in the first stage compared to the 7 kW turbine. A small region of negative power production occurs near the end of the second stage for all
, due most likely to the variation in
. There are differences in the relative power extraction by the first and second stages. At the maximum efficiency, about 69% of the power was extracted at the first stage. This is a remarkable result: very efficient runners can have significant second stage power extraction.
3.2. Design Improvement of the 0.53 kW Turbine
Here, we investigate changing the nozzle and runner to improve the turbine efficiency. The detailed computational analysis can be found in [
5]. For the design conditions of
Q = 46 lps and
H = 1.337 m, which are left unchanged, a range of
,
and nozzle width
W are possible, but the original choices were assumed to be good and were not changed. They are listed in
Table 2. The rear wall shape
of the nozzle was redesigned according to [
2] as the original nozzle had an arbitrary circular shape. Two nozzle orientations were considered: tangential to the runner at the start of the entry arc and the original nozzle shown in
Figure 5. Ref. [
2] gives the generalized equation for
R(
) for non-zero
shown in
Figure 1 as
where
= orientation angle of the left nozzle lip and
is defined in the Figure. For brevity, the derivation of Equation (3) is omitted here; it can be found in [
5]. The original and new nozzle shapes are shown in
Figure 9.
The influence of the nozzle designs on the turbine efficiency was small but beneficial. By redesigning the nozzle without altering the runner,
increased from 88 to 89.45% in the case of original nozzle orientation (vertical). The tangential nozzle gave a very similar efficiency of 89.21%. We provide more significant figures in these
values on the assumption that comparative assessment is likely to be more accurate than absolute assessment. This shows that the orientation of the nozzle has little influence on runner performance. The subsequent redesign of the runner used the original orientation of the nozzle for which Equation (2) gives
= 183 RPM, which is slightly lower than the experimentally determined 199 RPM. The new nozzle increased the total entry velocity above that of the original nozzle, showing that more
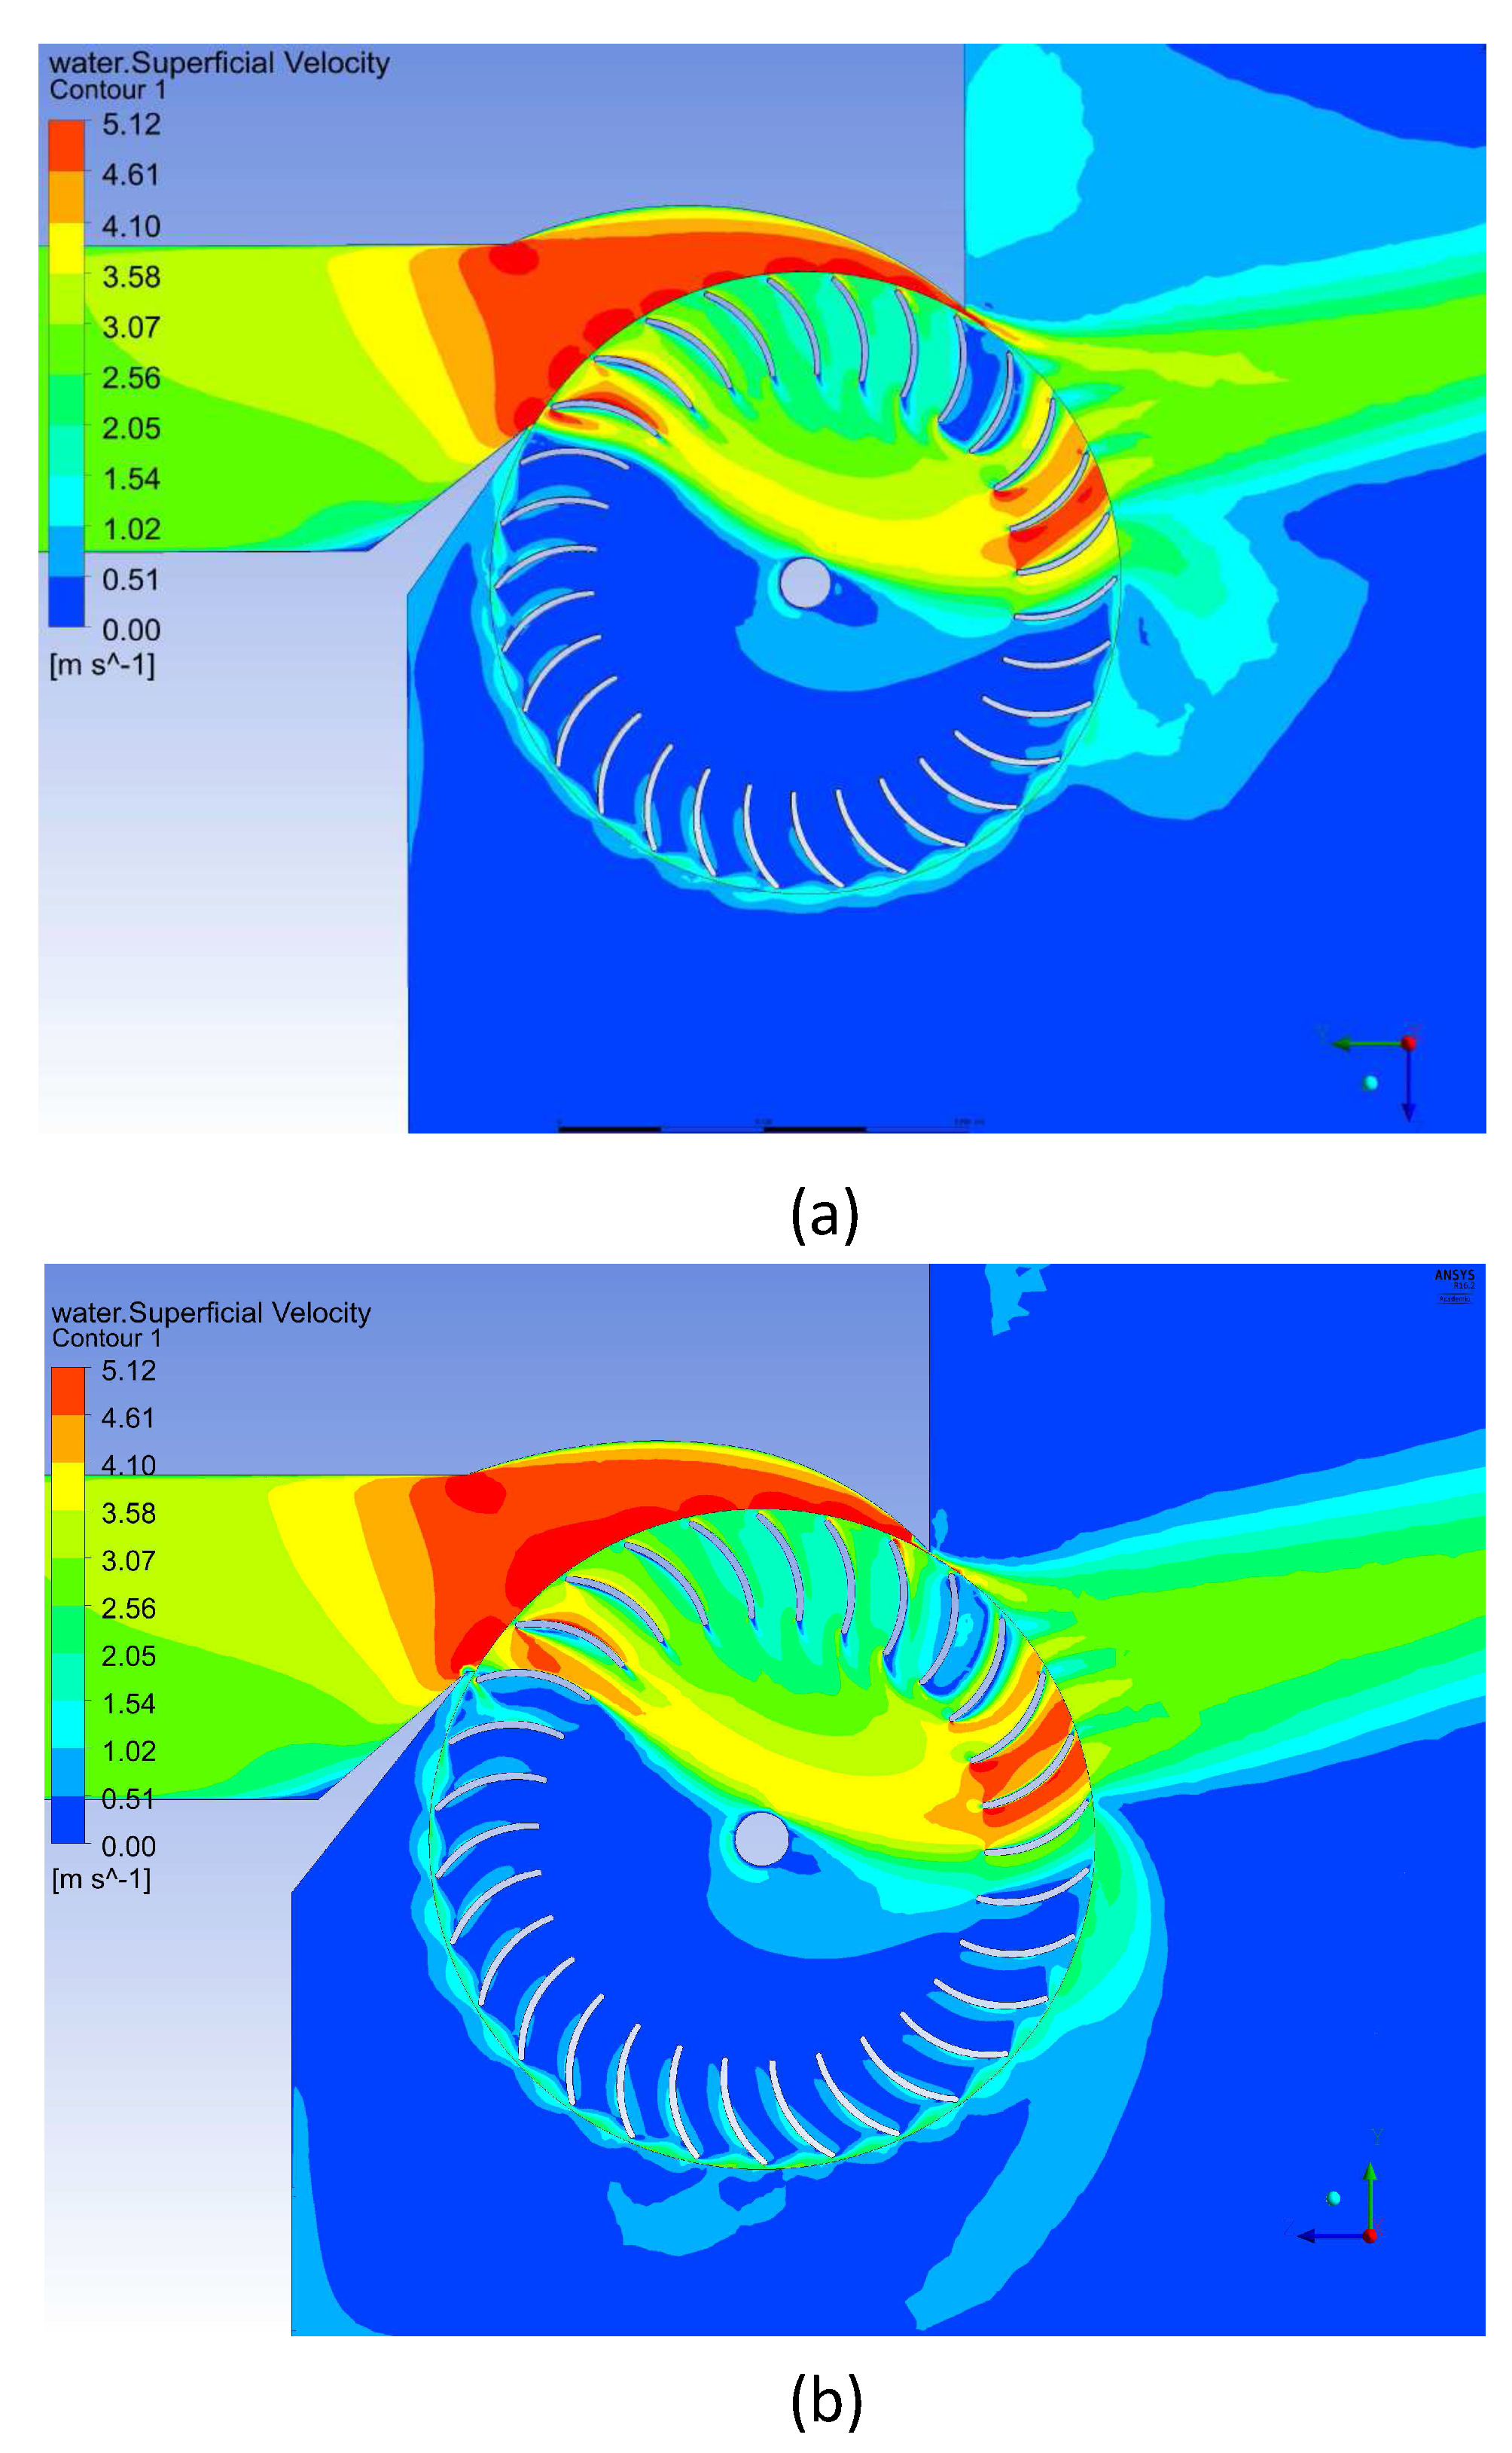
H was converted into kinetic energy and the angular momentum flux at the runner entry. The contours of mean water velocity on the original and new nozzles are shown in the two parts of
Figure 6. It is seen that there is some difference in the water velocities near the rear walls between the two cases.
Despite the small effect on
, the nozzle orientation has a major influence on
. For the tangential nozzle,
is almost uniform at the runner entry and closely matches
. As a result, the first stage performance has considerably increased. The percentage power production in the first stage was about 81% at maximum efficiency, whereas, in the original case, it was about 69% [
5]. This shows that
directly impacts the relative performance of the two stages and also that the second stage is able to “recover” power “missed” by the first stage.
Subsequent simulations varied
/
,
,
, and
. A detailed analysis of the influence of these parameters is given by [
5]. It was found that all these parameters influence turbine efficiency, of which
was the most important. Computations were conducted for
= 20, 35, and 40. By reducing
from the original
= 30, the first-stage performance decreased accompanied by flow separation on the blades, whereas the second stage performance increased. For example, at
= 20,
dropped to 85.87%. By increasing
to 35,
increased to 90%, whereas
decreased to 88.23% for
= 40, which is slightly greater than the experimentally determined
= 86% reported by [
20]. At
= 40, power extraction from both stages decreased. Thus, it was found that the first stage power extraction increased with the increase in
only up to the optimum value. The results are summarized in
Table 3. Since this study was parametric, no theoretical suggestion for calculating the optimum number of blades has been made. For a Pelton runner, e.g., Zidonis et al. [
27], the optimum number of buckets can be estimated using the ratio of water jet diameter and runner diameter. The main design consideration in doing so is to avoid the jet interference with the buckets (due to a high number buckets) as well as the loss of jet (due to a low number of buckets) [
27]. This design principle is unlikely to carry over to crossflow turbines because the optimization of
is likely to result from a balance between reduction in flow separation and increasing boundary layer blockage as
increases. It is highly likely that
can be found only by simulation and/or experiment.
In summary, we were able to make a modest improvement to the efficiency of this already highly efficient design. The main differences between the original and improved turbine, apart from the nozzle rear wall shape, are listed in
Table 2.
3.3. Design Improvement of 7 kW Turbine
The main reason for the lower performance of the 7 kW turbine of [
10]—the mismatch of nozzle and runner—was examined in the previous section. To improve the maximum efficiency, the nozzle was first redesigned using the analytical model of [
2], and simulations were performed without altering the original runner design [
2]. The orientation was kept horizontal as in the original design and the shape was calculated using Equation (3).
increased from 69 to 87% [
2]. This allowed identification of the major changes in the runner entry flow and the runner performance.
For the design Q = 105 lps and H = 10 m, a range of possible values of nozzle throat and nozzle width W are possible, but those used in the original nozzle design did not allow conversion of H into kinetic energy. Therefore, it was decided to use the same as the high efficiency 0.53 kW turbine described above for the redesign of the 7 kW one. For similar reasons, was increased from 69 to 80. Then, the principle of converting H into kinetic energy gave mm and mm, which is significantly smaller than for the original design. We anticipate that a reduced W should reduce manufacturing costs as well as make the turbine more compact.
With the new design,
by Equation (1) and
at
RPM by Equation (2). A comparison of
and the unchanged
for the runner entry from the new nozzle and the original nozzle is shown in Figure 17 of [
2]. The difference in optimal speed of 500 RPM for the new nozzle compared to 460 RPM is explained by the fact that
has not been reduced from its original value and requires a higher
to match
to
. It is noted that there is negligible flow separation in the first stage of the runner compared to the original nozzle as shown in Figure 17 of [
2]. There is, however, now some separation on the suction sides of the blades at the second stage. It is also interesting to note that the azimuthal variation of
is very similar to that of the high-efficiency 0.53 kW turbine as discussed in the previous section. This completed the investigation of changes to the nozzle design while keeping the same runner.
With the optimal nozzle design, the runner design was altered to match with the inlet flow. Through a number of simulations by varying
and
,
improved to about 91%. Maximum efficiency was achieved for
= 39
and
. The parameters of the improved design are provided in
Table 2.
from Equation (2) is unaltered by a change to the runner, but it is noteworthy that the runner redesign has not altered
from the simulations. For brevity, only the results of the improved nozzle and runner design are presented here. The vectors of the mean of water velocity in the improved design shown in
Figure 10 demonstrates fully attached flow in both stages of the runner as compared to a massive flow separation in the original runner with the original nozzle. To better understand the power extraction mechanisms in the new designs, azimuthal variation of power extraction at the first and second stages are plotted in
Figure 11. The first stage performance has significantly improved with the new nozzle for the original runner. By increasing the number of blades and the outer blade angle, the first stage performance has further increased. The second stage performance is relatively unchanged in all cases accompanied by a small power loss at the end of the second stage for the most efficient design.


