Article

Comparative Thermodynamic Analysis of Kalina and Kalina Flash Cycles for Utilizing Low-Grade Heat Sources

1
Department of Mechanical Engineering, Kumoh National Institute of Technology, Gyeongbuk 39177, Korea
2
Department of Mechanical System Engineering, Kumoh National Institute of Technology, Gyeongbuk 39177, Korea
*
Author to whom correspondence should be addressed.
Energies 2018, 11(12), 3311; https://doi.org/10.3390/en11123311
Submission received: 5 November 2018 / Revised: 23 November 2018 / Accepted: 23 November 2018 / Published: 27 November 2018
(This article belongs to the Section F: Electrical Engineering)

Abstract

:
The Kalina flash cycle (KFC) is a novel, recently proposed modification of the Kalina cycle (KC) equipped with a flash vessel. This study performs a comparative analysis of the thermodynamic performance of KC and KFC utilizing low-grade heat sources. How separator pressure, flash pressure, and ammonia mass fraction affect the system performance is systematically and parametrically investigated. Dependences of net power and cycle efficiencies on these parameters as well as the mass flow rate, heat transfer rate and power production at the cycle components are analyzed. For a given set of separator pressure and ammonia mass fraction, there exists an optimum flash pressure making exergy efficiency locally maximal. For these pressures, which are higher for higher separator pressure and lower ammonia mass fraction, KFC shows better performance than KC both in net power and cycle efficiencies. At higher ammonia mass fraction, however, the difference is smaller. While the maximum power production increases with separator pressure, the dependence is quite weak for the maximum values of both efficiencies.

1. Introduction

The Kalina cycle (KC) is a novel power cycle proposed in the early 1980s by Kalina [1] which replaces water of the steam cycle by an ammonia-water mixture and is equipped with a vapor-liquid separator. These days, it is considered to have significantly improved the design of thermal power plants and to be competitive against the organic Rankine cycle (ORC) [2,3,4,5,6]. For a review on its features and applications, readers may refer to Zhang et al. [7]. As the isobaric phase change of ammonia-water mixture occurs at varying temperature, the thermal mismatch between fluids is alleviated to some extent or more, so that the irreversibility of the KC generated at the evaporator and condenser is kept low, resulting in a higher efficiency and an improvement in the cycle performance [8,9,10,11].
Aslan [12,13] performed a case study for the electricity generation system using a KC driven by geothermal resources from an exergo-economic viewpoint. He also tried to optimize the operating conditions of the system by using the artificial neural network method. Sun et al. [14,15] carried out an energy-exergy analysis for a solar boosted KC with an auxiliary superheater to utilize low-grade heat sources. They also reported a parametric optimization result for a pilot system that the generated power, exergy and energy efficiencies reaching up to 491 kW, 35.6%, and 6.48%, respectively. Varga and Palotai [16] compared the waste heat recovery performance of ORC and KC which partially substitute an air cooler used to cool down a hydrocarbon stream. At the expense of higher pressure, KC is shown to generate more power with higher efficiency. In an off-design performance study of KC, Wang et al. [17] proposed a method to keep the cycle with good performance. Prananto et al. [18] investigated the electricity generating performance of a KC by recovering the heat of the unused brine discharged from a geothermal power plant. For an optimized condition, 48 kg/s of unused brine is shown to be capable of generating up to 1.66 MW of electricity.
In order to simultaneously produce refrigeration and power, Ghaebi et al. [19] proposed combining KC with an ejector refrigeration cycle. The cycle was shown to have a potential to produce 2.3 MW of net power and 1.1 MW of refrigeration under the optimized conditions. Zare and Palideh [20] proposed a KC integrated with thermoelectric generators to directly convert heat into electricity. They reported an enhancement of 7.3% in net power with efficiencies comparable to the conventional KCs. Ghorbani et al. [21] developed and analyzed an integrated structure in which solar flat plate collectors provide thermal energy, KC generates power, and desalination process produces freshwater. The system was shown to be capable of producing 65.2 MW of heating, 1.87 MW of power, and 83.2 kg/s of freshwater.
In KC, however, the ammonia-poor solution is underutilized in spite of its high temperature and high pressure, while the ammonia-rich vapor produces power by expanding in the turbine. The Kalina flash cycle (KFC) is a very recent modification of KC equipped with a flash vessel, which was proposed by Cao et al. [22] and investigated for two configurations. By using single and multiple objective optimizations, they obtained optimal conditions for exergy efficiency and specific investment cost for KC and KFCs. Both configurations of KFC are shown to achieve better performances than KC. However, considering the rather small differences in the optimal performances, the suggested optimal separator pressures seem high, and there still remain some aspects to be resolved. This study carries out a comparative analysis of the thermodynamic performance of KC and KFC utilizing low-grade heat sources. It is systematically investigated how flash pressure and other system parameters affect their thermodynamic performance. Not only the dependences of mass flow rates, heat transfer rates and power production at the appropriate components but also the dependences of net power and efficiencies of the systems on these parameters are analyzed.

2. System Analysis

The systems of (a) KC and (b) KFC under consideration are schematically shown in Figure 1. In both systems a heat recovery vapor generator (HRVG) is used to heat working fluid through heat transfer from a low-grade heat source. KFC is additionally equipped with a flash vessel and second turbine. The remaining components of the systems are separator, main turbine, mixer, condenser, pump, regenerator, and throttle valve. In KFC, the working fluid leaves HRVG with pressure PH and temperature TH (state 1). Its separation into vapor (state 2) and liquid (state 3) phases takes place in the separator. The saturated liquid from separator is flashed in flash vessel at pressure Pf into vapor and liquid. The saturated vapors from separator and flash vessel (state 4) expand and generate power at turbines 1 and 2, respectively. Vapors leaving turbines (states 6 and 7) mix at mixer (state 10). The saturated liquid from flash vessel (state 5) preheats the working fluid at regenerator. Throttling process (states 8 to 9) are followed by a mixing process with the vapor from the mixer (state 11). The working fluid condensed in condenser (state 12) is compressed at pump (state 13), preheated at regenerator (state 14), and enters HRVG, completing a cycle. Inlet temperature (state 17) of the coolant at condenser is Tc. KFC reduces to KC when both flash vessel and turbine 2 are removed. Accordingly line 4 to 7 disappears and pairs of points 3 and 5, and 6 and 10 in KFC merge into single points. Except these simplifications, cycle operation of KC is the same as KFC. In this study, the following simplifications are assumed in order to alleviate the burden of complicated simulation:
(1)
The process of cycle operation is steady.
(2)
The kinetic and potential energies have negligible effects.
(3)
The pump and turbines have constant isentropic efficiency.
(4)
Both vapor and liquid leaving out of separator or flash vessel (in KFC) are saturated.
(5)
Throttling occurs as an isenthalpic process.
(6)
The liquid leaving out of condenser is saturated.
(7)
The pinch point temperature differences in HRVG and regenerator are set at the prescribed values of ΔTpp1 and ΔTpp2, respectively.
From the laws of conservation of mass and energy, mass flow rates from m1 to m5 are obtained in terms of the source temperature Ts and the specific enthalpy of the working fluid hi as follows:
m 1 = m s c ps T s T sout h 1 h 14
m 2 = m 1 h 1 h 3 h 2 h 3
m 3 = m 1 m 2
m 4 = m 3 h 3 h 5 h 4 h 5
m 5 = m 3 m 4
Here ms, cps, and Tsout are the mass flow rate, isobaric specific heat, and HRVG outlet temperature of the source fluid. The last of these is obtained from the pinch point condition.
In KFC, heat transfer rates at HRVG, regenerator, and condenser, Qs, Qr, and Qc, and power productions at turbine 1 and turbine 2, pump power, and net power, Wt1, Wt2, Wp, and Wnet, respectively, can be obtained as follows:
Q s = m 1 ( h 1 h 14 )
Q r = m 5 ( h 5 h 8 )
Q c = m 11 ( h 11 h 12 )
W t 1 = m 2 ( h 2 h 6 )
W t 2 = m 4 ( h 4 h 7 )
W p = m 12 ( h 13 h 12 )
W net = W t 1 + W t 2 W p
Since KC is without second turbine, Wt2 has to be set zero in KC. The rate of exergy flow of the working fluid, Ei, is evaluated in terms of the mass flow rate and the differences of specific enthalpy and specific entropy si as:
E i = m i [ h i h 0 T 0 ( s i s 0 ) ]
with subscript 0 referring to the reference equilibrium state. Furthermore, the rate of exergy flow of the source fluid and the coolant is approximated as:
E i = m i c p [ T i T 0 T 0 ln ( T i T 0 ) ]
where cp is its specific heat at constant pressure.
Based on the net power, three kinds of efficiencies are used to quantitatively investigate the performance of the system by dividing it by the rate of heat input, or rate of exergy supply, or rate of exergy input. They are called the thermal efficiency ηth, the exergy efficiency ηex, and the inner exergy efficiency ηexi, respectively, and calculated as follows:
η th = W net Q s
η ex = W net E 15 E 16
η exi = W net E 1 E 14
The evaluation of the thermodynamic properties of ammonia-water mixture is based on the method of [23], except for the calculation of the equilibrium conditions which are determined by equating the chemical potentials of each phase for each element as [8]:
μ a L = ( G m L N a ) T , P , N w = ( G m g N a ) T , P , N w = μ a g
μ w L = ( G m L N w ) T , P , N a = ( G m g N w ) T , P , N a = μ w g
Here, Na, Nw, and N are numbers of moles of ammonia, water, and the mixture, respectively, and the Gibbs free energy of Gm for liquid or gas phase is denoted as
G m = N a [ G a + R T ln x ] + N w [ G w + R T ln ( 1 x ) ] + N G E
where R is the universal gas constant.

3. Results and Discussion

For comparison purposes, the basic simulation conditions in this study are taken similar to those of [22]. The source fluid is considered as air with Ts = 150 °C and ms = 1 kg/s, while the latter in [22] is 20 kg/s. The basic simulation conditions are as follows: separator pressure PH = 24 bar; separator temperature TH = 139.9 °C; condensation temperature TL = 40 °C; coolant temperature Tc = 25 °C; dead state temperature T0 = 25 °C; pinch point temperature differences at heat recovery vapor generator (HRVG) ∆Tpp1 = 10 °C and at regenerator ∆Tpp2 = 5 °C; isentropic efficiencies of pump ηp = 0.60 and of turbines ηt = 0.75.

3.1. Effects of Flash Pressure in KFC

In order to compare the thermodynamic performance of the Kalina flash cycle (KFC) with that of the Kalina cycle (KC), the performance of KFC is analyzed first. This approach is reasonable since the KC does not have a flash vessel and its effect should be resolved for a direct comparison. In this section, the effects of flash pressure on the mass flow rates, heat transfer rates, pump and turbine powers, and cycle efficiencies are investigated for the representative separator pressure (PH) of 24 bar and ammonia mass fractions (xb) of 40%, 45%, and 50%. Then, the dependence of the optimal flash pressure, based on the exergy efficiency, on separator pressure and ammonia mass fraction is investigated. An investigation of the effects of separator pressure and ammonia mass fraction on the power of the second turbine of KFC for optimal flash pressure concludes this section.
Figure 2 shows the effect of flash pressure on the mass flow rates at HRVG of m1, at turbines 1 and 2 of m2 and m4, and at regenerator of m5 for the separator pressure of 24 bar and ammonia mass fractions of 40%, 45% in KFC. Since the states at the inlet and outlets of the separator are completely determined by the separator pressure, separator temperature, and ammonia mass fraction, the mass flow rates at HRVG (m1), turbine 1 (m2), and flash vessel (m3) do not change with the flash pressure. Hence the curves for m1 and m2 are horizontal lines for a constant value of separator pressure. Raising flash pressure makes the mass flow rate at turbine 2 (m4) diminish because the reduced pressure difference between the separator and flash vessel reduces the degree of expansion during flash process. On the contrary mass flow at regenerator (m5) increases since the sum of the mass flow rates to turbine 2 and to regenerator remains constant. As ammonia gets richer for the same flash pressure, m1 and m4 decrease slightly but increase of m2 and decrease of m5 are appreciable. The reason is as follows: m1 is proportional to (TsTsout)/(h1h14). Since the bubble point of the mixture is lower for higher ammonia concentrations, both (TsTsout) and (h1h14) increase, leading to a slight decrease of m1. As ammonia concentration increases, dryness factor becomes higher in separator and lower in flash vessel, which result in an increase of m2 and a decrease of m5. However, m4 decreases slightly, since it has both increasing factor and decreasing factor.
Figure 3 shows the effect of flash pressure on the rates of heat transfer at HRVG of Qs, at regenerator of Qr, and at condenser of Qc for the separator pressure of 24 bar and ammonia mass fractions of 40%, 45%, 50% in KFC. Here, rate of heat transfer at HRVG is equal to the rate of heat input to the cycle from the source fluid. If the flash pressure is raised for the fixed separator pressure, then the pressure drop during the flash process diminishes and the liquid from flash vessel enters the regenerator with higher temperature. This brings about enhancement of heat transfer at the regenerator and elevation of the temperature of the mixture entering HRVG. Hence the heat transfers at regenerator and HRVG are monotonically increasing and decreasing functions of flash pressure, respectively. The heat transfer at condenser decreases with the increase of flash pressure since the temperature of the mixture entering condenser gets lower. On the other hand, if the concentration of ammonia-water mixture gets higher, then its temperature gets lower at HRVG inlet and consequently the temperature of source exhaust also drops. In addition condensation pressure rises and consequently the temperature of the mixture entering condenser rises. These factors make heat transfers at HRVG and condenser larger for the higher ammonia concentration. Ammonia richer mixture makes heat transfers at regenerator smaller, since the flow rate of mixture at regenerator is lower for higher ammonia concentration.
Figure 4 shows the effect of flash pressure on the powers produced by turbines 1 and 2 of Wt1 and Wt2, consumed power at pump of Wp, and net power production of the cycle of Wnet, for the separator pressure of 24 bar and ammonia mass fractions of 40%, 45% in KFC. Powers of turbine 1 and pump are constant with respect to flash pressure, since they are completely determined by the thermodynamic states in the separator. Power of turbine 2 exhibits an increasing-decreasing behavior respect to flash pressure and has an extremum for each ammonia mass fraction. This behavior results from a competition between the positive effect of increased enthalpy drop across turbine 2 and the negative effect of decreased flow rate through turbine 2. As net power is equal to the difference of the sum of turbine powers and pump power, and powers of turbine 1 and pump do not change with flash pressure, net power shows the same topological behavior as power of turbine 2. When ammonia mass fraction is raised from 40% to 45%, mass flow rate increases at turbine 1 but decreases at turbine 2. On the other hand, specific works of both turbines decrease. Therefore, power of turbine 1 increases because of the dominant mass effect, while power of pump decreases very slightly such that two graphs are nearly indistinguishable. Power of turbine 2 naturally decreases but net power increases. This means that the positive effect of the difference of the powers of turbine 1 and pump is larger than the negative effect of the power of turbine 2.
Figure 5 shows the effect of flash pressure on the thermal efficiency, exergy efficiency, and inner exergy efficiency, for the separator pressure of 24 bar and ammonia mass fractions of 40%, 45%, and 50% in KFC. For any of 40%, 45%, and 50%, each of three efficiencies has an extremum in the considered range of flash pressures. For the same pair of separator pressure and ammonia mass fraction, the optimizing flash pressures for the peak points of cycle efficiencies are much higher than that of the net power. This is because all terms in the denominator, i.e., supplied heat, supplied exergy, and exergy input, decrease with the increase of flash pressure. For example, when the separator pressure is 24 bar and ammonia mass fraction is 45%, net power has a maximum value of 3.60 kW at the optimizing flash pressure of 11 bar, and thermal efficiency, exergy efficiency, and inner exergy efficiency have maxima of 11.0%, 40.6%, and 45.0%, respectively, at the optimizing flash pressures of 22 bar, 20 bar, and 20 bar, respectively. If the flash pressure is high enough, all of three efficiencies are higher for lower ammonia mass fraction. However this trend is reversed at the flash pressures of about 9 bar and lower.
The next consideration is to investigate the dependence of the exergy efficiency based optimal flash pressure on the separator pressure and ammonia mass fraction. This pressure will be used as the value of flash pressure of KFC to directly compare with KC in the next section. The exergy efficiency of KFC for fixed values of separator pressure and ammonia mass fraction shows a similar behavior to Figure 5 and it always has one peak point with respect to the change of flash pressure. Figure 6 shows the dependence of this optimal flash pressure on ammonia mass fraction for various values of separator pressure from 16 bar to 48 bar with an increment of 8 bar. The exergy efficiency- based optimal flash pressure is a monotonically increasing function of ammonia mass fraction and approaches to separator pressure at high enough values of ammonia mass fraction. The gap between separator pressure and optimal flash pressure widens as separator pressure is raised. A little surprisingly, optimal flash pressure decreases with the increase of separator pressure at low ammonia concentrations.
Figure 7 shows the effects of ammonia mass fraction and separator pressure on the power of turbine 2 in KFC operating at the optimal flash pressure based on the cycle exergy efficiency. Since optimal flash pressure increases with ammonia mass fraction and the mass flow rate at turbine 2 decreases with ammonia mass fraction, power of turbine 2 is a monotonically decreasing function of ammonia mass fraction for each value of separator pressure. As expected, power of turbine 2 is strongly dependent on separator pressure and rapidly increases with the rise of separator pressure. The main reason of this behavior is that the pressure ratio across the turbine 2 increases with the rise of separator pressure.

3.2. Comparison of KFC Operating at Optimal Flash Pressure with KC

In this section, the thermodynamic performances of KFC and KC are comparatively investigated. As the flash vessel is integrated only in KFC, KFC is considered to be operated at the exergy efficiency-based optimal flash pressure for the purpose of definite comparison with KC. These optimal values were presented in the previous section.
Figure 8 shows the effects of ammonia mass fraction and separator pressure on the rate of heat transfer at regenerator in KC and KFC. In KC, the rate of heat transfer at regenerator declines almost linearly with ammonia concentration but gets higher as separator pressure is raised. This behavior results from the simultaneous reduction effect of the rate of mass flow and the heat transfer per kg of mixture at regenerator for higher ammonia concentrations and at lower separator pressures. When ammonia concentration is high enough or separator pressure is low (16 to 24 bar), the overall behavior of heat transfer at regenerator in KFC is qualitatively same as in KC. However, a hill with gentle slope is formed in each heat transfer vs. ammonia concentration curve in the relatively low concentration region for high separator pressures (32–48 bar). In addition the heat transfer for higher separator pressure can be larger than that for lower separator pressure in this region. Comparing the results for KC and KFC, the heat transfer at regenerator of KC is seen to be larger than in KFC. This is consistent with the expectation because a part of liquid from the separator is used for additional power generation at turbine 2 in KFC instead of preheating the working fluid to HRVG. The difference of heat transfer between KC and KFC diminishes as ammonia mass fraction increases while it grows as separator pressure increases.
Figure 9 shows the effects of ammonia mass fraction and separator pressure on the rate of heat transfer at HRVG in KC and KFC. KC and KFC show the qualitatively same behavior in heat transfer at HRVG with respect to the changes of ammonia concentration and separator pressure. Moreover the discrepancy in numerical value is not so big; it becomes more significant as ammonia concentration decreases and as separator pressure increases. In both cycles heat transfer at HRVG is an almost linearly increasing function of ammonia concentration. This is because the specific heat transfer increases owing to the drop of mixture temperature entering HRVG. However, the effect of separator pressure on heat transfer at HRVG is a little complicated. If the separator pressure is high enough (32–48 bar) or ammonia concentration is low enough (below about 60%), then the heat transfer at HRVG decreases with the increase of separator pressure. When the separator pressure is low (16–24 bar) and ammonia concentration is high, it begins to increase with the separator pressure. This implies that there exists a peak point in the heat transfer vs. separator pressure curve for ammonia concentrations above 63%.
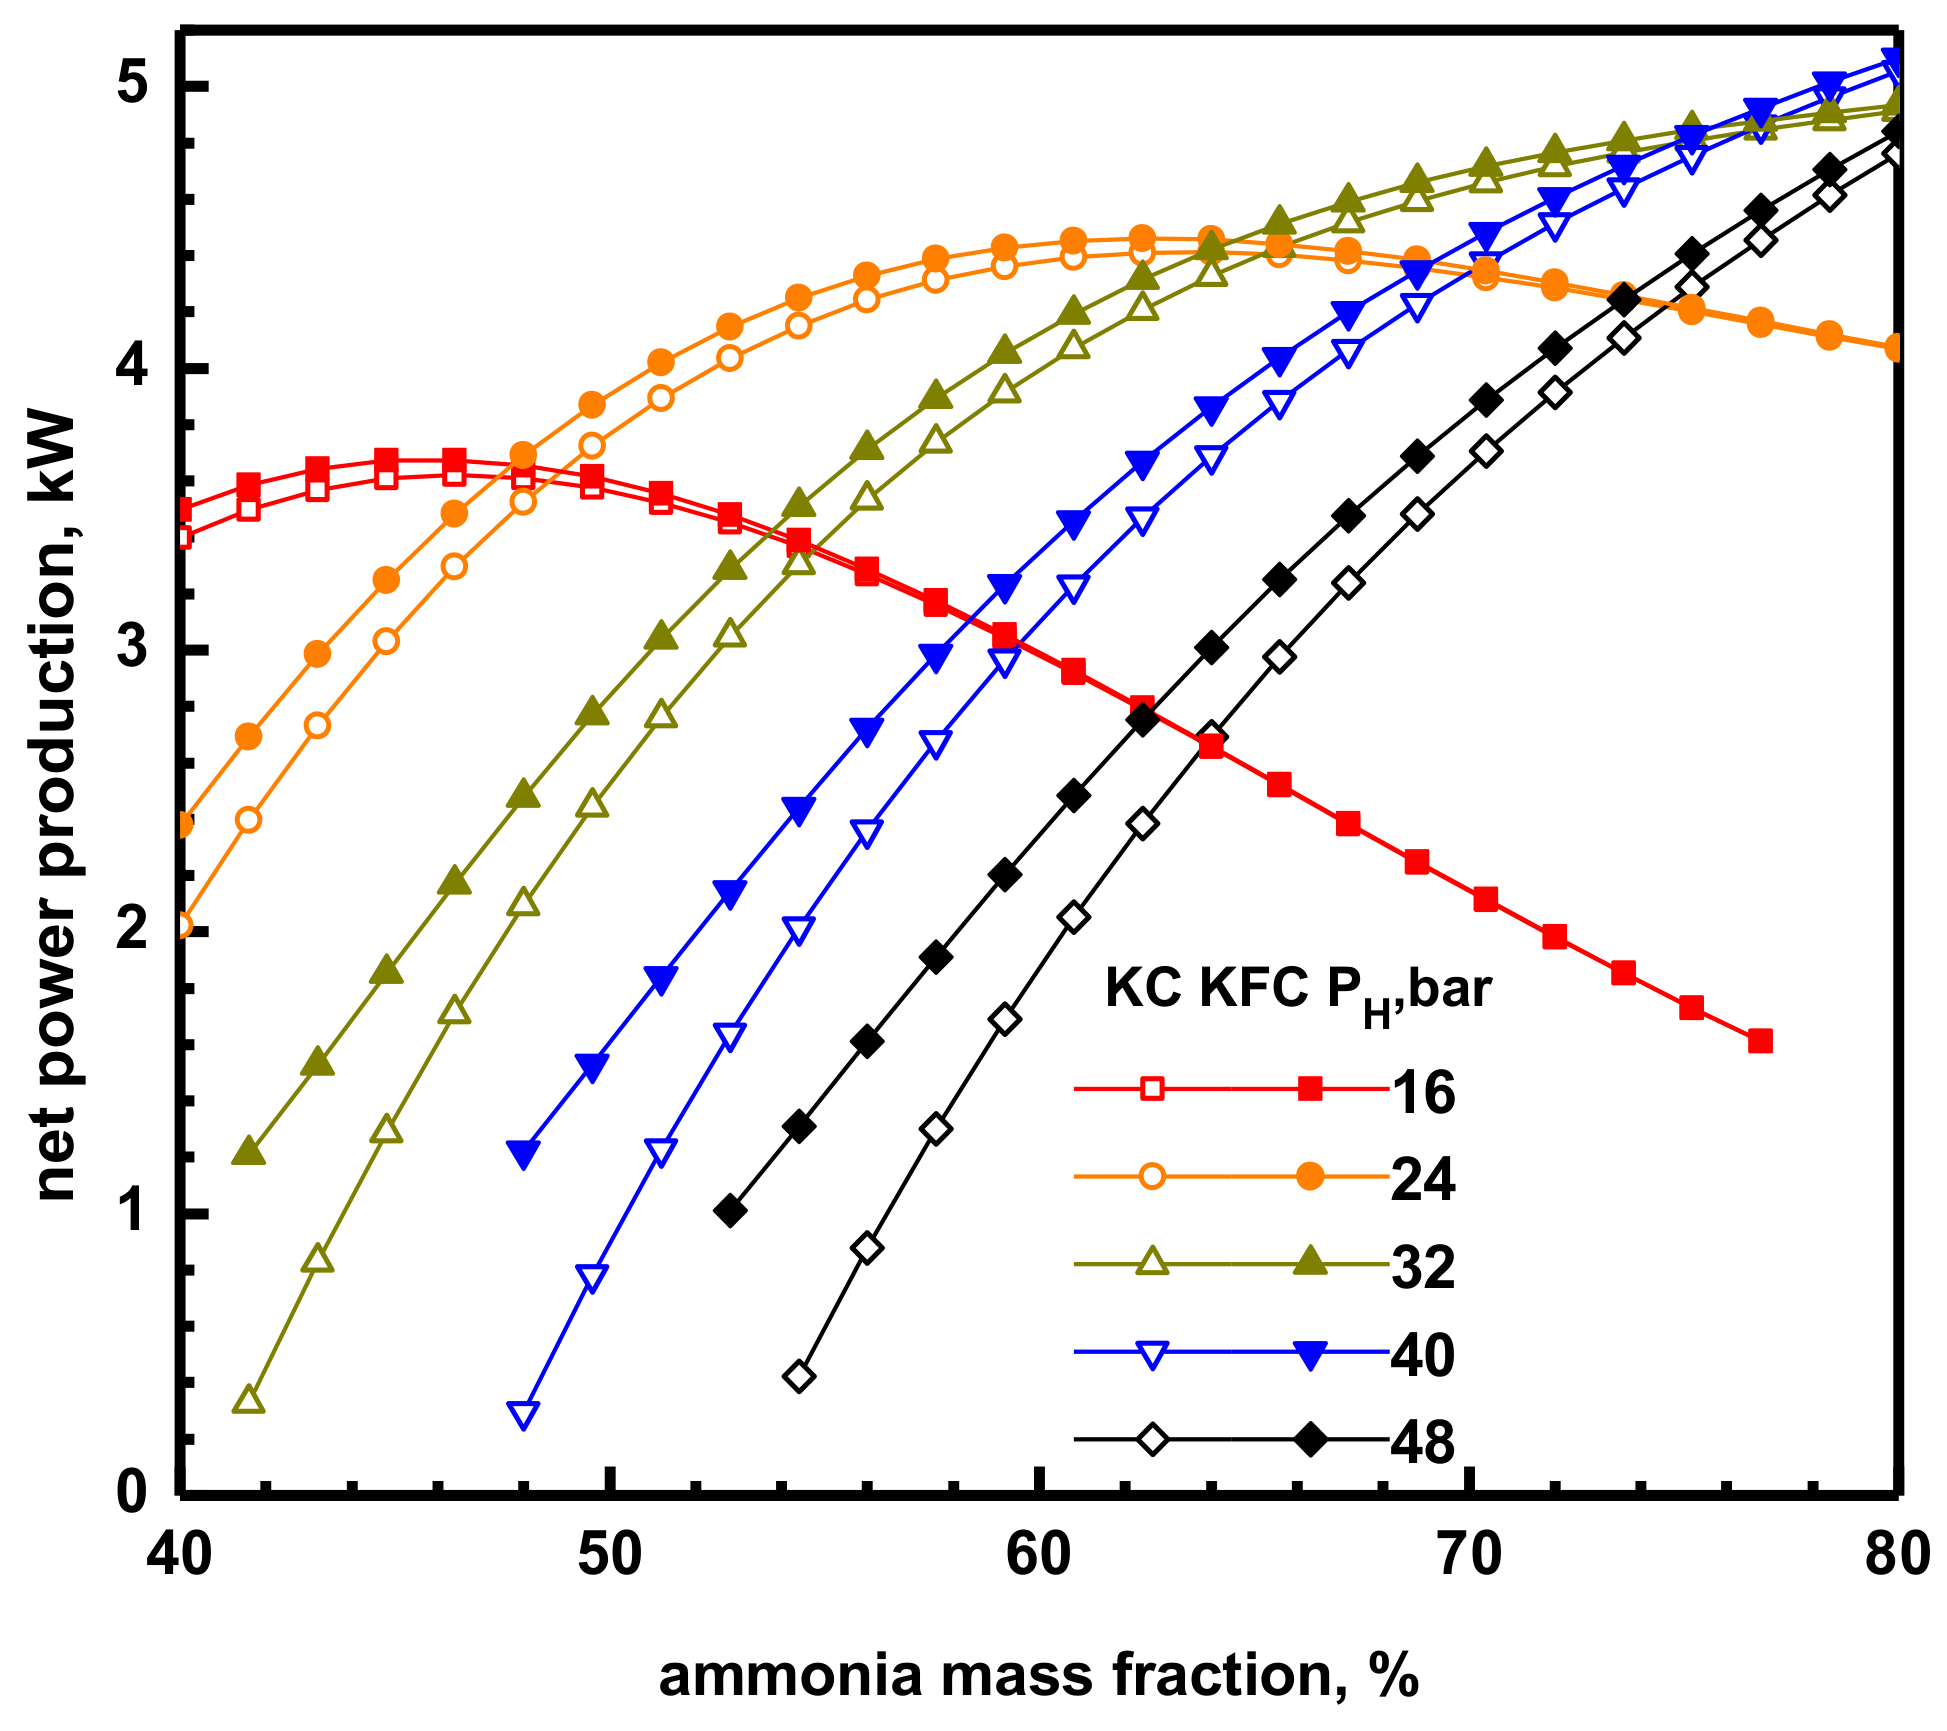
Figure 10 shows the effects of ammonia mass fraction and separator pressure on the net power produced in KC and KFC. As a whole, there is no qualitative difference in the characteristics of the change of net power with respect to the changes of ammonia concentration and separator pressure for two cycles. Only a quantitative difference exits between them. KFC produces more power than KC for any combination of ammonia concentration and separator pressure. The superiority of KFC in power production becomes clearer at higher separator pressure and at lower ammonia concentration. In the considered range of ammonia mass fraction, there exists a peak point in the net power vs. ammonia concentration curve for relatively low separator pressure from 16 to 24 bar in both KC and KFC. This point shifts to the upper-right direction as separator pressure increases. However, for high separator pressures from 32 to 48 bar and ammonia mass fractions below 80%, net power is a simply increasing function of ammonia concentration and its maximum value is attained at the right limit. Maximum net powers and the corresponding ammonia mass fractions of KFC are summarized as follows in an increasing order of separator pressures of 16, 24, 32, 40, and 48 bar: 3.62 kW at 46%, 4.41 kW at 64%, 4.91 kW at 80%, 5.05 kW at 80%, and 4.76 kW at 80%. Maximum net power of KC is to a certain degree lower than that of KFC having the same separator pressure.
Figure 11 shows the effects of ammonia mass fraction and separator pressure on the thermal efficiencies of KC and KFC. As seen in Figure 9 and Figure 10, the net power production and the rate of heat transfer at HRVG show the same qualitative behaviors for KC and KFC. The ratio of the former to the latter corresponding to the rate of heat supply to the cycle defines thermal efficiency. Therefore the same trend of thermal efficiency for KC and KFC appearing in Figure 11 results naturally. For low separator pressures (16–24 bar) thermal efficiency simply decreases with the increase of ammonia concentration because of the dominant negative effect of rapidly growing heat transfer. On the other hand for high separator pressures (32–48 bar), both positive effect and negative effect increase with the increase of ammonia concentration and make thermal efficiency show an increasing-decreasing behavior with a peak value. The value of ammonia mass fraction at the peak of thermal efficiency is lower than that of net power corresponding to the same separator pressure, and is higher at higher separator pressure. However, the value of maximum thermal efficiency declines very gradually with respect to the increasing of separator pressure. Thermal efficiency of KFC is higher to a certain degree than that of KC for any same pair of ammonia mass fraction and separator pressure; The difference shrinks at high ammonia concentration and at low separator pressures.
Figure 12 shows the effects of ammonia mass fraction and separator pressure on the exergy efficiencies of KC and KFC. Except for the high ceiling values around 40% which is more than three times of that of thermal efficiency, the dependencies of exergy efficiency on ammonia mass fraction and separator pressure are similar to thermal efficiency. Although the gap shrinks at high ammonia concentrations or at low separator pressures, KFC exhibits a better performance in exergy efficiency than KC operating at the same condition. Over the considered ammonia concentration range, the values of maximum exergy efficiency and the corresponding ammonia mass fraction in KFC attainable at separator pressures of 16, 24, 32, 40, and 48 bar are 38.6% at 40%, 41.5% at 40%, 40.2% at 50%, 39.6% at 59%, and 39.9% at 70%, respectively. As is clear from Figure 12, the maximum values of exergy efficiency sought by varying ammonia concentration are weakly dependent on separator pressure. Therefore, a straightforward optimization by merely extending the range of separator pressure to high pressure region is apt to result in an insignificant gain at the expense of additional facility and operation costs. According to the thermodynamic optimization results of [22], the KC has an optimum exergy efficiency of 38.04% at the separator pressure of 43.0 bar and ammonia mass fraction of 79.2%; while the KFC has an optimum exergy efficiency of 38.90% at the very high separator pressure of 51.5 bar and ammonia mass fraction of 79.5%.

4. Conclusions

In this paper, a comparative thermodynamic analysis was carried out on the performances of the Kalina Cycle (KC) and the Kalina Flash Cycle (KFC) for utilizing low-grade heat sources. By taking ammonia mass fraction and separator pressure for both cycles and flash pressure for KFC as key parameters, a parametric study was systematically performed on the effects of these parameters on the cycle performance. Not only the mass flow rates, heat transfers, and powers at the cycle components but also the net power and cycle efficiencies were extensively investigated. Special attention was focused on the comparison of performance of KFC operating at optimal flash power with KC. The important findings are as follows.
In KFC with specified ammonia concentration and separator pressure, the power of the second turbine and net cycle power, and cycle efficiencies can be optimized with respect to the flash pressure. The optimum flash pressure based on the cycle exergy efficiency increases as ammonia mass fraction increases and separator pressure increases, approaching to the value of the separator pressure. Regeneration heat transfer in KFC at optimal flash pressure is smaller than KC since a part of liquid is used for the second turbine, while the heat input rate, net cycle power, and cycle efficiencies of KFC are greater than KC. The difference in the thermodynamic performances of KFC and KC diminishes with the increase of ammonia mass fraction. As the maximum values of thermal and exergy efficiencies are weakly dependent on separator pressure, a straightforward optimization by raising separator pressure is not so recommendable.

Author Contributions

Conceptualization, K.H.K. and H.J.K.; methodology, K.H.K.; validation, C.H.H. and H.J.K.; formal analysis, K.H.K.; investigation, H.J.K.; data curation, C.H.H.; writing—original draft preparation, K.H.K; writing—review and editing, C.H.H. and H.J.K; funding acquisition, K.H.K.

Acknowledgments

This research was supported by Basic Science Research Program through the National Research Foundation of Korea (NRF) funded by the Ministry of Education, Science and Technology (NRF-2016R1D1A1B03935888, NRF-2018R1D1A1B07048866).

Conflicts of Interest

The authors declare no conflict of interest.

References

  1. Kalina, A.I. Combined cycle system with novel bottoming cycle. ASME J. Eng. Gas Turb. Power 1984, 106, 737–742. [Google Scholar] [CrossRef]
  2. Ibrahim, O.M. Design consideration for ammonia-water Rankine cycle. Energy 1996, 21, 835–841. [Google Scholar] [CrossRef]
  3. Lolos, P.A.; Rogdakis, E.D. A Kalina power cycle driven by renewable energy sources. Energy 2009, 34, 457–464. [Google Scholar] [CrossRef]
  4. Modi, A.; Haglind, F. Thermodynamic optimization and analysis of four Kalina cycle layouts for high temperature applications. Appl. Therm. Eng. 2015, 76, 196–205. [Google Scholar] [CrossRef] [Green Version]
  5. Eller, T.; Heberle, F.; Brüggemann, D. Second law analysis of novel working fluid pairs for waste heat recovery by the Kalina cycle. Energy 2017, 119, 188–198. [Google Scholar] [CrossRef]
  6. Bombarda, P.; Invernizzi, C.M.; Pietra, C. Heat recovery from Diesel engines: A thermodynamic comparison between Kalina and ORC cycles. Appl. Therm. Eng. 2010, 30, 212–219. [Google Scholar] [CrossRef] [Green Version]
  7. Zhang, X.; He, M.; Zhang, Y. A review of research on the Kalina cycle. Renew. Sustain. Energy Rev. 2012, 16, 5309–5318. [Google Scholar] [CrossRef]
  8. Kim, K.H.; Han, C.H.; Kim, K. Effects of ammonia concentration on the thermodynamic performances of ammonia-water based power cycles. Thermochim. Acta 2012, 530, 7–16. [Google Scholar] [CrossRef]
  9. Kim, K.H.; Han, C.H.; Kim, K. Comparative exergy analysis of ammonia-water based Rankine cycles with and without regeneration. Int. J. Exergy 2013, 344–361. [Google Scholar] [CrossRef]
  10. Kim, K.H.; Ko, H.J.; Kim, K. Assessment of pinch point characteristics in heat exchangers and condensers of ammonia–water based power cycles. Appl. Energy 2014, 113, 970–981. [Google Scholar] [CrossRef]
  11. Kim, K.H.; Kim, K.; Ko, H.J. Entropy and Exergy Analysis of a Heat Recovery Vapor Generator for Ammonia-Water Mixtures. Entropy 2014, 16, 2056–2070. [Google Scholar] [CrossRef] [Green Version]
  12. Arslan, O. Exergoeconomic evaluation of electricity generation by the medium temperature geothermal resources, using a Kalina cycle: Simav case study. Int. J. Therm. Sci. 2010, 49, 1866–1873. [Google Scholar] [CrossRef]
  13. Arslan, O. Power generation from medium temperature geothermal resources: ANN-based optimization of Kalina system-34. Energy 2011, 36, 2528–2534. [Google Scholar] [CrossRef]
  14. Sun, F.; Ikegami, Y.; Jia, B. A study on Kalina solar system with an auxiliary superheater. Renew. Energy 2012, 41, 210–219. [Google Scholar] [CrossRef]
  15. Sun, F.; Zhou, W.; Ikegami, Y.; Nakagami, K.; Su, X. Energy-exergy analysis and optimization of the solar-boosted Kalina cycle system 11 (KCS-11). Renew. Energy 2014, 66, 268–279. [Google Scholar] [CrossRef]
  16. Varga, Z.; Palotai, B. Comparison of low temperature waste heat recovery methods. Energy 2017, 137, 1286–1292. [Google Scholar] [CrossRef]
  17. Wang, J.; Wang, J.; Dai, Y.; Zhao, P. Assessment of off-design performance of a Kalina cycle driven by low-grade heat source. Energy 2017, 138, 459–472. [Google Scholar] [CrossRef]
  18. Prananto, L.A.; Zaini, I.N.; Mahendranata, B.I.; Juangsa, F.B.; Aziz, M.; Soelaiman, T.A.F. Use of the Kalina cycle as a bottoming cycle in a geothermal power plant: Case study of the Wayang Windu geothermal power plant. Appl. Therm. Eng. 2018, 132, 686–696. [Google Scholar] [CrossRef]
  19. Ghaebi, H.; Parikhani, T.; Rostamzadeh, H.; Farhang, B. Proposal and assessment of a novel geothermal combined cooling and power cycle based on Kalina and ejector refrigeration cycles. Appl. Therm. Eng. 2018, 130, 767–781. [Google Scholar] [CrossRef]
  20. Zare, V.; Palideh, V. Employing thermoelectric generator for power generation enhancement in a Kalina cycle driven by low-grade geothermal energy. Appl. Therm. Eng. 2018, 130, 418–428. [Google Scholar] [CrossRef]
  21. Ghorbania, B.; Mehrpooya, M.; Sadeghzadeh, M. Developing a tri-generation system of power, heating, and freshwater (for an industrial town) by using solar flat plate collectors, multi-stage desalination unit, and Kalina power generation cycle. Energy Convers. Manag. 2018, 165, 113–126. [Google Scholar] [CrossRef]
  22. Cao, L.; Wang, J.; Chen, L.; Dai, Y. Comprehensive analysis and optimization of Kalina-Flash cycles for low-grade heat source. Appl. Therm. Eng. 2018, 2018. 131, 540–552. [Google Scholar] [CrossRef]
  23. Xu, F.; Goswami, D.Y. Thermodynamic properties of ammonia-water mixtures for power-cycle application. Energy 1999, 24, 525–536. [Google Scholar] [CrossRef]
Figure 1. Systems under consideration: (a) Kalina cycle (KC) and (b) Kalina flash cycle (KFC).
Energies 11 03311 g001
Figure 2. Effect of flash pressure on the mass flow rates in KFC.
Energies 11 03311 g002
Figure 3. Effect of flash pressure on the rates of heat transfer in KFC.
Energies 11 03311 g003
Figure 4. Effect of flash pressure on the powers of turbines and pump, and net power production in KFC.
Energies 11 03311 g004
Figure 5. Effect of flash pressure on the cycle efficiencies in KFC.
Energies 11 03311 g005
Figure 6. Dependence of the optimal flash pressure on ammonia mass fraction and separator pressure in KFC.
Energies 11 03311 g006
Figure 7. Effects of ammonia mass fraction and separator pressure on the power of turbine 2 in KFC.
Energies 11 03311 g007
Figure 8. Effects of ammonia mass fraction and separator pressure on the heat transfer at regenerator in KC and KFC.
Energies 11 03311 g008
Figure 9. Effects of ammonia mass fraction and separator pressure on the heat transfer at HRVG in KC and KFC.
Energies 11 03311 g009
Figure 10. Effects of ammonia mass fraction and separator pressure on the net power production in KC and KFC.
Energies 11 03311 g010
Figure 11. Effects of ammonia mass fraction and separator pressure on the thermal efficiency in KC and KFC.
Energies 11 03311 g011
Figure 12. Effects of ammonia mass fraction and separator pressure on the exergy efficiency in KC and KFC.
Energies 11 03311 g012

