Abstract
This study investigates the volatility nexus between exchange rates, interest rates, and stock market returns in South Africa, an emerging economy characterised by deep financial integration and exposure to global capital flows. Using monthly data from January 2003 to February 2025, the analysis employs a multi-layered econometric framework combining asymmetric GARCH models (EGARCH and GJR-GARCH), an Asymmetric Dynamic Conditional Correlation (ADCC-GARCH) specification, and a GARCH-MIDAS–DCC approach that decomposes volatility into long-run and short-run components while modelling time-varying cross-market dependence. The findings indicate that exchange rate volatility is the dominant and most persistent driver of financial market risk, highlighting the central role of the South African rand in transmitting global shocks to domestic markets. Equity market volatility is largely shock driven and mean reverting, with sharp increases during major crisis episodes such as the Global Financial Crisis and the COVID-19 pandemic. Dynamic correlations across markets are persistent but predominantly negative between stock returns and exchange rates, while linkages involving interest rates are weaker and more episodic. Overall, the results suggest that South Africa’s financial volatility nexus operates primarily through exchange rate-driven transmission rather than short-run contagion effects.
1. Introduction
Volatility in financial markets often reflects underlying macroeconomic tensions, particularly in emerging economies where exchange rates, interest rates, and equity markets are closely interconnected and jointly influenced by global risk conditions. In South Africa, these interactions are especially pronounced. Fluctuations in the South African rand, largely driven by domestic macroeconomic fundamentals, policy uncertainty, and volatile international capital flows, interact with interest rate dynamics and investor risk perceptions to shape stock market volatility. Understanding this interconnectedness, commonly referred to as the “volatility nexus”, is therefore essential for safeguarding financial stability, managing capital market risks, and informing investment and policy decisions (Lefatsa et al., 2025; Bonga-Bonga & Mpoha, 2025).
Exchange rates play a central role in transmitting external and domestic shocks to the real economy and financial markets. According to the flow-oriented model (Dornbusch & Fischer, 1980), exchange rate movements influence firm competitiveness, export revenues, and expected earnings, particularly for export- and import-oriented firms. A depreciation of the domestic currency may enhance export competitiveness and raise corporate revenues, while appreciation can dampen export performance and earnings expectations. In the South African context, however, episodes of currency depreciation are frequently associated not only with changes in competitiveness but also with heightened uncertainty, inflationary pressures, and shifts in investor sentiment, which amplify stock market volatility rather than stabilise equity prices (Bonga-Bonga & Mpoha, 2025; Bonga-Bonga, 2013).
Beyond trade competitiveness, exchange rate movements strongly influence foreign investor behaviour. A weaker rand can temporarily increase the attractiveness of South African equities in foreign currency terms, potentially stimulating capital inflows (Maveé et al., 2016). At the same time, abrupt or unanticipated depreciations—particularly those associated with political instability, policy uncertainty, or global risk-off episodes—tend to raise perceived risk and deter foreign investment, increasing the likelihood of capital outflows and equity market instability (Pamba et al., 2025; Chinn & Meredith, 2005). This dual role of the exchange rate generates persistent volatility spillovers from the foreign exchange market to the equity market, a mechanism that is particularly relevant for a globally integrated exchange such as the Johannesburg Stock Exchange (JSE) (Dube, 2025; South African Reserve Bank, 2024). Empirical studies, including Sikhosana and Aye (2018) and Oberholzer and von Boetticher (2015), confirm the importance of exchange rate volatility in explaining stock market fluctuations in South Africa. However, much of this literature relies on symmetric GARCH specifications that are ill-suited to capturing asymmetric responses and persistent volatility regimes.
Interest rates constitute another important channel through which macroeconomic conditions affect equity markets. As a key monetary policy instrument, interest rates influence stock prices through multiple mechanisms. First, they serve as a discount factor in equity valuation models, whereby increases in interest rates raise the cost of capital and reduce the present value of future cash flows, exerting downward pressure on stock prices (Graham & Harvey, 2001; Mapfumo et al., 2023). Second, higher interest rates increase borrowing costs for firms, potentially dampening investment and future profitability, particularly for leveraged companies (Everett, 2024). Third, changes in interest rates affect portfolio allocation decisions by altering the relative attractiveness of fixed-income assets and equities, often triggering capital reallocation and increased equity market volatility (Muriu & Murinde, 2025; Fowowe, 2015). These effects are especially pronounced in emerging markets such as South Africa, where interest rate adjustments significantly influence both domestic and foreign capital flows.
The South African Reserve Bank (SARB) operates under an inflation-targeting framework, and changes in the repo rate affect not only domestic financing conditions but also exchange rate dynamics through interest rate differentials and carry-trade flows. These interdependencies highlight the importance of jointly modelling exchange rate and interest rate volatility when assessing stock market volatility. Existing South African studies—including Kumar (2013), Eita (2012), and Bonga-Bonga (2013)—document both short-run and long-run relationships between interest rates and equity markets. However, these studies generally do not explicitly account for volatility transmission and dependence dynamics using advanced multivariate frameworks, nor do they adequately address the persistence and asymmetry that characterise financial time series in emerging markets.
The literature further distinguishes between two key theoretical perspectives linking exchange rates and stock markets: the flow-oriented model (Dornbusch & Fischer, 1980) and the stock-oriented model (Branson, 1983; Frankel, 1993). While the former emphasises trade competitiveness as the main transmission mechanism, the latter suggests that rising stock prices attract capital inflows, increase demand for domestic assets, and lead to currency appreciation, implying potential reverse causality and a negative relationship between stock prices and exchange rates. These bidirectional and nonlinear linkages imply that volatility transmission is inherently time varying and asymmetric, reinforcing the need for empirical approaches capable of capturing evolving correlations rather than static or purely shock-driven relationships.
Despite a growing body of research on financial market linkages, empirical studies that jointly examine the volatility effects of exchange rates and interest rates on stock markets remain limited, particularly in the South African context. Many existing studies rely on univariate or symmetric GARCH models, often overlooking persistent volatility components and dynamic cross-market dependence (Mlambo et al., 2013; Babikir et al., 2012). More advanced multivariate approaches—such as DCC-based or asymmetric GARCH frameworks—remain relatively scarce in South African applications, despite their ability to capture time-varying correlations and asymmetric responses (Al-Rjoub & Al-Azzam, 2019; Kabundi & Mlachila, 2019).
This study addresses these gaps by examining the volatility nexus among exchange rates, interest rates, and stock market returns in South Africa using a layered econometric strategy. The primary contribution of the paper lies in the use of a GARCH-MIDAS–DCC framework, which explicitly decomposes volatility into persistent long-run and transitory short-run components and models time-varying cross-market dependence using volatility-filtered residuals. This approach allows the analysis to distinguish between structural volatility regimes and crisis-induced shock dynamics, a distinction that is particularly important in an economy characterised by prolonged exposure to global risk cycles. To ensure comparability with the existing South African literature and to validate the main findings, benchmark asymmetric GARCH models (EGARCH and GJR-GARCH) and an ADCC-GARCH specification are also estimated. These benchmark models are not treated as competing specifications but as complementary diagnostics that reinforce the robustness and economic interpretation of the GARCH-MIDAS–DCC results.
South Africa provides an important empirical setting for examining macro-financial volatility interactions. As the most developed and liquid financial market in Sub-Saharan Africa, South Africa plays a central role in regional capital markets and is highly integrated into global financial systems. The Johannesburg Stock Exchange (JSE) is among the largest exchanges in emerging markets, while the South African rand is widely regarded as one of the most actively traded emerging-market currencies. These characteristics make the South African economy particularly sensitive to global financial shocks, capital flow volatility, and shifts in international risk sentiment. Consequently, fluctuations in exchange rates, monetary policy conditions, and equity markets tend to interact strongly, making South Africa an ideal case for analysing volatility transmission across financial markets. Hence, the findings of this study have important implications for investors, policymakers, and central banks concerned with financial stability and risk management.
2. Review of Empirical Literature
The interaction between exchange rate volatility, interest rate dynamics, and stock market volatility has received increasing empirical attention, particularly in the aftermath of global financial disruptions such as the Global Financial Crisis, the COVID-19 pandemic, and the recent cycle of aggressive monetary tightening. These events have reinforced the view that financial market volatility in emerging economies is not only persistent and asymmetric but also shaped by slow-moving structural forces alongside transitory shocks (Chen et al., 1986). Consequently, recent studies increasingly employ GARCH-family models to capture volatility clustering, asymmetries, and time-varying dependence across markets.
A growing strand of the literature documents that emerging markets exhibit stronger volatility persistence and asymmetric responses than developed markets, especially during crisis episodes. Tabash et al. (2024) and Kabundi and Mlachila (2019) show that volatility in emerging equity and currency markets reacts more sharply and decays more slowly following adverse shocks, reflecting heightened sensitivity to global risk sentiment and capital flow reversals. Zeng et al. (2025) further demonstrate that volatility evolves through distinct phases—initial shock, amplification, and recovery—arguing that conventional symmetric GARCH models tend to obscure these dynamics. Relatedly, Yousfi et al. (2024) and Khan (2025) emphasise that asymmetric frameworks such as EGARCH and ADCC-GARCH are better suited for capturing nonlinear volatility transmission during periods of heightened uncertainty.
Within the South African context, empirical evidence confirms the importance of volatility linkages across financial markets, albeit with notable methodological limitations. Cheteni (2016) and Maingo et al. (2025) apply univariate GARCH variants to model stock market volatility on the Johannesburg Stock Exchange (JSE), documenting substantial persistence and clustering. Debalke (2023) examines volatility spillovers between South African and Ethiopian sovereign bond markets, while Nyopa and Khumalo (2022) identify bidirectional volatility spillovers between equity and foreign exchange markets within the BRICS bloc. Although informative, these studies typically analyse markets in isolation or pairwise and do not jointly model exchange rates, interest rates, and equity volatility within a unified framework capable of capturing time-varying dependence and structural persistence.
More recent work highlights the role of global shocks and policy uncertainty in shaping South Africa’s volatility dynamics. Hussain et al. (2024) show that volatility spillovers across BRICS exchange rates and stock markets are strongly influenced by global news shocks. Amewu et al. (2024) document time-varying interdependencies between South Africa and global financial markets, while Ramakau et al. (2025) find that economic policy uncertainty, particularly during the COVID-19 period, significantly intensified volatility co-movements between South Africa and its major trading partners. These findings underscore the inadequacy of static correlation measures and the need for econometric frameworks that allow dependence structures to evolve over time.
An emerging but still limited strand of the literature recognises that volatility is driven by both short-run shocks and long-run structural components. Alzate-Ortega et al. (2024) identify commodity-driven volatility spillovers in emerging markets, while Marozva (2020) links South Africa’s monetary policy stance to equity market volatility, emphasising the role of monetary transmission mechanisms. Crucially, Eniayewu et al. (2024) employ a GARCH-MIDAS framework to demonstrate that low-frequency monetary variables forecast exchange rate volatility in South Africa and Nigeria, highlighting the importance of separating persistent volatility from transitory fluctuations. This evidence suggests that models that collapse volatility into a single process may misattribute persistent macro-financial uncertainty to short-run shocks.
Recent empirical studies increasingly emphasise the role of macro-financial volatility in shaping financial development and market stability outcomes in emerging economies through risk premia, asset price uncertainty, and disruptions to financial intermediation. In particular, research within international macro-finance and development economics highlights how exchange rate instability, volatile capital flows, and monetary policy uncertainty can weaken domestic financial stability and influence investment behaviour in financially open emerging markets (Rey, 2015; Pagliari & Hannan, 2017). Empirical evidence shows that heightened uncertainty surrounding monetary policy decisions can significantly affect financial markets by altering risk perceptions, tightening financial conditions, and increasing asset price volatility (Husted et al., 2020). Moreover, studies focusing on emerging markets demonstrate that monetary policy uncertainty and global risk shocks can amplify exchange rate volatility and capital flow reversals, thereby intensifying macro-financial instability in open economies (Wang et al., 2023; Lastauskas & Nguyen, 2024). More broadly, the literature on the global financial cycle suggests that co-movements in asset prices, capital flows, and financial conditions transmit external shocks into domestic markets, strengthening volatility spillovers across currency, interest rate, and equity markets (Miranda-Agrippino & Rey, 2020). These findings underscore the importance of modelling volatility transmission in developing economies where financial markets remain highly sensitive to both domestic macroeconomic conditions and external shocks.
Comparative evidence from other African economies reinforces these insights. Komba et al. (2024) show that interest rate and exchange rate volatility significantly affect financial sector stock returns in Tanzania, with dynamics broadly comparable to South Africa. These studies support the relevance of multivariate volatility modelling in structurally similar economies while also justifying a dedicated focus on South Africa given its deeper financial markets, greater capital account openness, and heightened exposure to global risk cycles.
Despite these advances, important gaps remain. First, most existing studies analyse volatility transmission in a piecemeal manner, focusing on individual markets or bilateral relationships rather than jointly modelling exchange rates, interest rates, and equity markets. Second, even when multivariate GARCH frameworks are employed, few studies explicitly disentangle long-run and short-run volatility components, raising the risk of conflating persistent structural volatility with temporary shock-driven dependence. Third, applications of GARCH-MIDAS-based multivariate frameworks remain virtually absent in the South African literature, despite their suitability for economies characterised by prolonged uncertainty, policy cycles, and global financial integration.
By addressing these gaps, this study contributes to the literature in several ways. From a theoretical perspective, the paper integrates volatility decomposition with time-varying dependence modelling by combining the GARCH-MIDAS framework with a Dynamic Conditional Correlation (DCC) structure. This approach allows for the separation of persistent long-run volatility components from short-run fluctuations before examining cross-market dependence. From a methodological perspective, the study introduces a two-stage volatility modelling strategy in which GARCH-MIDAS marginals capture structural volatility dynamics, while the DCC framework models evolving correlations across financial markets. Also, benchmark asymmetric models—EGARCH, GJR-GARCH, and ADCC-GARCH—are estimated as complementary diagnostics to ensure comparability with the existing literature and to validate the incremental insights provided by the MIDAS-based approach.
From a practical perspective, the findings provide insights relevant for monetary policy, financial stability monitoring, and portfolio risk management in emerging markets. In particular, understanding how exchange rate volatility interacts with equity and interest rate dynamics can help policymakers anticipate periods of heightened financial instability. Finaly, the study offers a more structurally grounded and policy-relevant understanding of South Africa’s volatility nexus.
3. Materials and Methods
This section outlines the theoretical foundations and empirical strategy underpinning the study. It begins by discussing the key economic theories that explain volatility transmission across exchange rates, interest rates, and equity markets, from which testable hypotheses are derived. These theoretical insights guide the selection of econometric models capable of capturing asymmetric and dynamic volatility behaviour.
3.1. Theoretical Framework
This study is grounded in established macro-financial theories that explain volatility transmission and cross-market dependence among exchange rates, interest rates, and equity markets. These theoretical perspectives are particularly relevant for South Africa, a financially open emerging economy characterised by high capital mobility, persistent exposure to global risk cycles, and pronounced sensitivity to external shocks. Crucially, these theories imply that financial market volatility operates through both persistent structural channels and transitory shock-driven mechanisms, motivating an econometric framework capable of separating long-run volatility from short-run dynamics and modelling time-varying dependence. Uncovered Interest Parity (UIP) and the International Fisher Effect (IFE) provide a foundation for understanding the interaction between interest rates and exchange rates. While these parity conditions suggest that interest rate differentials should be offset by expected exchange rate movements, empirical evidence for South Africa points to persistent deviations driven by global risk premia, capital flow volatility, and domestic policy uncertainty. Such deviations imply that exchange rate and interest rate volatility often evolves slowly and exhibits high persistence, rather than dissipating quickly after shocks. This theoretical insight aligns with the presence of a dominant long-run volatility component, particularly in the foreign exchange market, as documented in the empirical results.
The Portfolio Balance Approach (PBA) further explains how volatility and dependence are transmitted across markets through investor portfolio rebalancing. In South Africa, equity and currency markets are heavily influenced by foreign portfolio investors, making them sensitive to shifts in global risk appetite, funding conditions, and exchange rate expectations. Portfolio reallocation in response to these factors tends to occur gradually, generating persistent cross-market interdependence rather than short-lived contagion effects. This mechanism provides a theoretical basis for expecting highly persistent dynamic correlations, especially between exchange rates and equity returns, as observed in the empirical findings. The conditional Efficient Market Hypothesis (EMH) emphasises that asset prices and volatility respond continuously to new information, but that responses may be asymmetric and state dependent. In emerging markets such as South Africa, informational frictions, policy uncertainty, and crisis episodes often lead to asymmetric volatility responses, whereby negative shocks—such as episodes of global risk aversion, sharp currency depreciation, or capital outflows—generate disproportionately large increases in market volatility. These features imply that volatility dynamics are shock driven in the short run while remaining anchored by more stable long-run risk conditions.
The theoretical perspectives imply that South Africa’s financial market volatility is best characterised by a two-layer structure. First, a persistent long-run component reflects slow-moving structural forces such as global financial conditions, capital flow regimes, and macro-financial vulnerabilities. Second, a transitory short-run component captures crisis-induced volatility spikes and market reactions to news and shocks, which are typically mean reverting. In addition, theory suggests that cross-market dependence should be time varying and persistent, shaped by common risk pricing rather than dominated by abrupt, short-lived correlation shocks.
These theoretical implications directly motivate the use of a GARCH-MIDAS framework to decompose volatility into long-run and short-run components, combined with a Dynamic Conditional Correlation (DCC) model to capture evolving cross-market dependence. Within this structure, benchmark asymmetric GARCH models—specifically EGARCH and GJR-GARCH—and an ADCC-GARCH specification are employed to capture leverage effects and asymmetric dependence highlighted by the conditional EMH. However, these benchmark models serve primarily as validation tools and points of comparison with the existing South African literature rather than as the central empirical framework, as they do not explicitly distinguish between persistent structural volatility and transitory shock-driven dynamics.
3.2. Empirical Hypotheses
Based on the theoretical framework and its implications for volatility decomposition and dependence dynamics, the study tests the following hypotheses:
H1:
Exchange rate volatility is expected to influence stock market volatility in South Africa through macro-financial transmission channels related to external competitiveness, capital flows, and investor portfolio rebalancing.
H2:
Equity market volatility in South Africa is primarily shock driven and mean reverting, with crisis episodes amplifying short-run volatility without inducing permanent long-run volatility regime shifts.
H3:
Conditional correlations among exchange rates, interest rates, and stock returns are time varying and highly persistent, reflecting structural interdependence driven by common risk factors rather than short-lived contagion effects.
3.3. Empirical Methodology
To examine these hypotheses, the study employs a combination of EGARCH, GJR-GARCH, and Asymmetric Dynamic Conditional Correlation (ADCC-GARCH) models.
The univariate GARCH-type models are estimated separately for each financial series to capture the volatility dynamics of stock returns, exchange rate changes, and interest rate movements. At this stage, no variable is treated as an explanatory variable for another; rather, the models focus on the conditional variance behaviour of each series individually. Cross-market interactions are subsequently analysed through the Dynamic Conditional Correlation (DCC) framework, which captures time-varying dependence among standardised shocks across markets.
The EGARCH model, introduced by Nelson (1991), is particularly advantageous because it allows for asymmetric volatility responses and does not impose non-negativity constraints on variance parameters. This enables the model to capture leverage effects and persistent volatility dynamics commonly observed in financial markets.
The mean equations for stock returns and exchange rate or interest rate changes are specified as follows:
where represents stock market returns, denotes exchange rate or interest rate changes, and and are error terms. A lag length of one is selected based on the Akaike Information Criterion (AIC) and Schwarz Information Criterion (SIC).
The corresponding EGARCH conditional variance equations are given by:
In these equations, captures the magnitude effect of shocks, measures asymmetry or leverage effects, and reflects volatility persistence. Significant values of indicate asymmetric volatility responses, while close to unity implies high persistence.
As a robustness check, the study also employs the GJR-GARCH model, which explicitly distinguishes between the effects of positive and negative shocks. The conditional variance specification is given by:
where is an indicator function that takes the value of one when and zero otherwise. A positive and significant coefficient indicates that negative shocks have a larger impact on volatility than positive shocks, consistent with the leverage effect.
To examine time-varying correlations and volatility spillovers across markets, the study employs the ADCC-GARCH model developed by Cappiello et al. (2006), which extends the Dynamic Conditional Correlation (DCC) framework of Engle (2002) by allowing for asymmetric correlation dynamics. The conditional covariance matrix is decomposed into time-varying standard deviations and correlations, enabling the analysis of evolving co-movements among exchange rates, interest rates, and stock returns.
It is important to note that the DCC framework models dynamic conditional correlations among standardised shocks rather than estimating structural causal relationships between the variables. As such, the approach primarily captures the evolving dependence structure across financial markets while mitigating contemporaneous feedback through the use of standardised residuals. Nevertheless, potential endogeneity arising from broader macroeconomic interactions cannot be fully ruled out. The results should therefore be interpreted as describing dynamic co-movement and volatility transmission patterns rather than causal effects, a limitation that is common to most multivariate GARCH-based volatility models.
Estimation proceeds in two steps. First, univariate GARCH-type models are estimated to obtain standardised residuals. Second, these standardised residuals are used to estimate the dynamic correlation structure. This approach allows the study to capture both volatility clustering and asymmetric correlation responses to market shocks.
3.3.1. GARCH-MIDAS–DCC Approach
Standard GARCH-type models impose a single-component structure on conditional variance, thereby conflating short-run volatility shocks with slow-moving structural volatility. In emerging economies such as South Africa, where financial markets are exposed to prolonged global risk cycles, capital flow volatility, and persistent macroeconomic uncertainty, this restriction can bias both volatility estimates and cross-market dependence measures. To address this limitation, this study adopts a two-stage GARCH-MIDAS–DCC framework as its primary empirical approach.
Let denote the return (or first difference) of financial series at time . The return process is specified as:
where is the conditional variance.
In the GARCH-MIDAS framework, the conditional variance is multiplicatively decomposed into a long-run and a short-run component:
where: is the long-run (low-frequency) volatility component, and is the the short-run (high-frequency) volatility component.
- Short-run volatility component
The short-run component follows a standard GARCH (1,1) process:
with ensuring positivity and mean reversion of short-run volatility.
- Long-run volatility component
The long-run component evolves smoothly according to a MIDAS polynomial:
where:
- is a constant;
- captures the impact of past realised volatility on long-run volatility;
- is a normalised MIDAS weighting function assigning declining weights to lagged observations;
- denotes the aggregation horizon.
Following the empirical implementation, this study employs a pure GARCH-MIDAS specification without exogenous macroeconomic variables, allowing the long-run volatility component to be endogenously driven by past volatility dynamics. Two alternative horizons, = 12 and = 24, are considered to assess robustness to the choice of long-run aggregation window.
3.3.2. MIDAS Weighting Structure
The long-run volatility component in the GARCH-MIDAS specification evolves as a weighted function of past realised volatility using the standard MIDAS polynomial weighting scheme. Specifically, the weights follow a Beta functional form:
where denotes the lag index, and represents the MIDAX lag horizon. The parameters and
govern the shape of the weighting function and ensure that the weights are positive and sum to unity. This specification allows past volatility observations to contribute differently to the long-run volatility component depending on their temporal distance from the present period.
The GARCH-MIDAS parameters are estimated using maximum likelihood estimation. To account for the heavy-tailed nature of financial returns, the standardised residuals are assumed to follow a Student-t distribution. Parameter constraints are imposed to ensure positivity of the variance process and stationarity of the conditional volatility dynamics. The MIDAS lag length determines the horizon over which past volatility contributes to the long-run component. In the baseline specification, , corresponding to one year of monthly observations, while an alternative specification using = 24 is estimated as part of the robustness analysis.
In contrast to the conventional mixed-frequency application of GARCH–MIDAS models, which combine high-frequency financial returns with low-frequency macroeconomic predictors, the present study adopts a pure volatility-driven GARCH–MIDAS specification. This approach allows the long-run volatility component to evolve endogenously based on past realised volatility rather than exogenous macroeconomic variables. Such a specification is particularly useful when the objective is to isolate persistent volatility dynamics embedded within financial market data itself (Engle et al., 2013; Conrad & Loch, 2015). Although the dataset used in this study is monthly, the decomposition remains economically meaningful because the MIDAS polynomial captures the slow-moving component of volatility that reflects underlying macro-financial risk conditions, while the short-run GARCH component captures high-frequency market shocks and volatility clustering. To assess robustness, the long-run volatility component is estimated using two alternative lag horizons (K = 12 and K = 24 months), corresponding approximately to one- and two-year volatility aggregation windows. The MIDAS weighting function follows a normalised Beta polynomial specification, ensuring that lag weights decline smoothly over time and sum to unity. Estimation is conducted via maximum likelihood under the assumption of conditionally normally distributed errors, and robust standard errors are reported for inference.
- Dynamic Conditional Correlation (DCC) model
After estimating the GARCH-MIDAS model for each series, standardised residuals are obtained as:
Let represent the vector of standardised residuals. The conditional covariance matrix of returns is defined as:
- ;
- = diag;
- = the time-varying correlation matrix.
The dynamics of the correlation matrix are governed by:
where is the unconditional covariance matrix of . The conditional correlation matrix is obtained by normalising :
The parameters and measure, respectively, the short-run impact of shocks on conditional correlations and the persistence of correlation dynamics. The stability condition ensures mean reversion of correlations.
The GARCH–MIDAS–DCC framework offers a flexible approach for modelling financial market volatility by separating persistent long-run volatility dynamics from short-run fluctuations. In this framework, the long-run component captures slowly evolving volatility associated with broader macro-financial conditions, while the short-run GARCH component reflects transitory market shocks and volatility clustering. This decomposition helps ensure that persistent volatility trends, particularly those observed in emerging-market exchange rate and interest rate series, are not mechanically interpreted as persistent cross-market correlations in the DCC stage. By filtering the marginal volatility dynamics prior to estimating dynamic correlations, the framework provides a clearer representation of evolving dependence structures across financial markets. Accordingly, the GARCH–MIDAS–DCC model serves as the primary empirical framework of the study. For robustness and comparability with the existing South African literature, additional asymmetric volatility specifications—EGARCH, GJR-GARCH, and ADCC-GARCH—are also estimated as benchmark models.
Prior to estimation, the variables are transformed to ensure appropriate statistical properties. The stock market index (ALSPI) is expressed in logarithmic form:
which allows proportional changes in the index to be captured while stabilising the variance of the series. The exchange rate variable is transformed into log changes:
while the interest rate is expressed in first differences:
The descriptive figures in Section 4.1 present the log levels of the original series to illustrate their long-run behaviour and structural evolution over the sample period. However, all econometric estimations, including the EGARCH, GJR-GARCH, ADCC, and GARCH-MIDAS models, are conducted using the stationary transformed series defined above.
4. Results
4.1. Preliminary Investigation
Monthly data on interest rates and exchange rates covering the period from January 2003 to February 2025 were obtained from the South African Reserve Bank (SARB), while closing values for the All Share Price Index (ALSPI) were sourced from the Johannesburg Stock Exchange (JSE). This sample period captures a wide range of economic cycles, structural reforms, and external shocks that have shaped South Africa’s financial markets. These include the global financial crisis of 2008, commodity price booms and busts, domestic monetary policy shifts, the COVID-19 pandemic, and the post-pandemic recovery phase. Using monthly data reduces high-frequency noise associated with daily or weekly observations while preserving the medium-to-long-term dynamics relevant for macro-financial volatility analysis. Figure 1 and Figure 2 illustrate the behaviour of the log-level series and their corresponding return transformations, respectively.
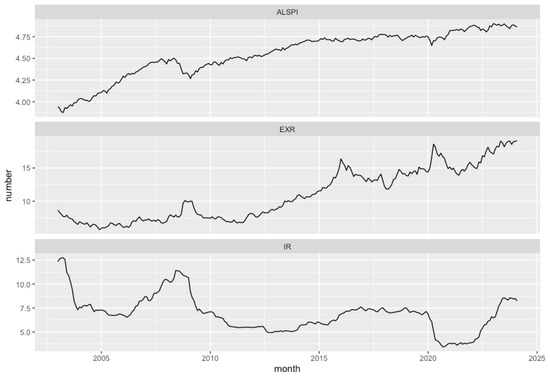
Figure 1.
Movement of the variables at level.
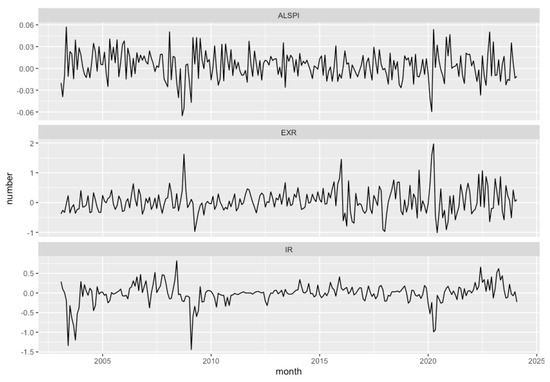
Figure 2.
Movement of the variables after first differencing.
Interest rates exhibit a highly erratic trajectory, with pronounced increases prior to the 2008 global financial crisis and sharp declines during the COVID-19 period, reflecting accommodative monetary policy aimed at mitigating economic contraction.
The exchange rate series displays a clear upward trend over the sample period, indicating a long-run depreciation of the South African rand against the US dollar. The ALSPI follows an overall upward trajectory, punctuated by sharp declines during periods of global and domestic stress, notably in 2007–2008 and again during the COVID-19 shock. These features are typical of financial time series and motivate the use of conditional heteroskedasticity models capable of capturing time-varying volatility dynamics.
Figure 3 presents the static correlation coefficients among the variables based on the log-level series. The correlation between stock prices and the exchange rate is positive and strong (0.81), indicating that both variables exhibit similar long-run movements over the sample period. In particular, the ALSPI shows a persistent upward trend reflecting long-term growth in South Africa’s equity market, while the exchange rate displays a gradual depreciation of the rand against the US dollar. As a result, correlations computed in levels partly capture shared trending behaviour rather than purely short-run financial interactions.
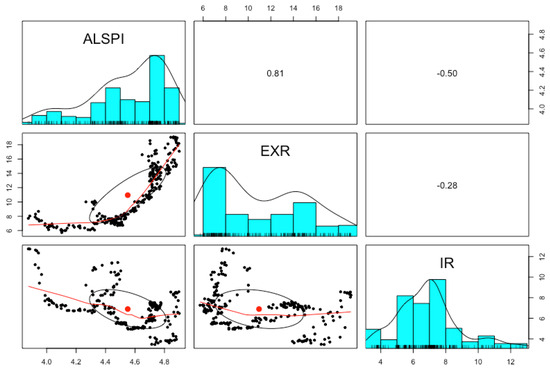
Figure 3.
Static correlation coefficient chart among the variables.
It is important to note that these static correlations differ conceptually from the dynamic conditional correlations estimated later using the ADCC framework. The ADCC model is based on standardised innovations from the conditional mean equations and therefore captures time-varying correlations in the short-run financial shocks affecting the markets. Consequently, while the level-based correlations appear positive due to common trends, the dynamic correlations reported in the ADCC results reflect the contemporaneous interaction of unexpected movements in exchange rates and stock returns.
Figure 4 presents histograms and density plots illustrating the distributional properties of stock prices, exchange rates, and interest rates prior to estimating the multivariate GARCH models. These plots provide important preliminary insights into the underlying data characteristics and help justify the chosen econometric approach.
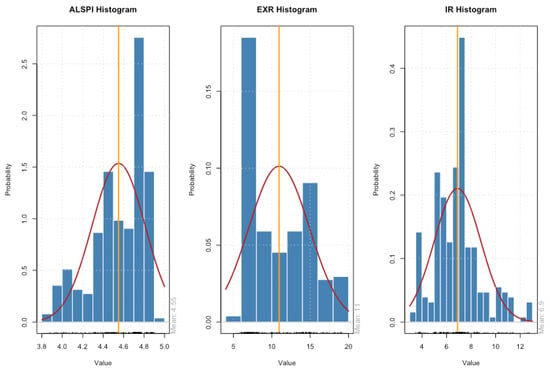
Figure 4.
Histogram plot of the series.
The histogram for the stock market index (ALSPI) reveals a mildly right-skewed distribution that is relatively close to normal. Most observations cluster between 4.3 and 4.8, with a small number of lower outliers around 4.0. The mean is slightly lower than the mode, confirming modest right skewness. The density curve aligns reasonably well with the histogram, suggesting a smooth distribution without major irregularities. This implies that while extreme stock market movements are not frequent, they do occur, highlighting the importance of volatility modelling to capture return clustering and occasional shocks.
In contrast, the exchange rate distribution exhibits pronounced right skewness and fat tails. Observations are concentrated between 7 and 12, with a long right tail extending toward higher values, reflecting episodes of substantial rand depreciation. The mean is noticeably influenced by extreme values, and the density curve departs significantly from a Gaussian shape, particularly in the upper tail. This non-normality indicates that South Africa has experienced repeated exchange rate shocks, often driven by domestic policy uncertainty, global capital flow volatility, and external macroeconomic disturbances such as commodity price fluctuations and the COVID-19 pandemic. The high degree of asymmetry and dispersion in the exchange rate series suggests that exchange rate volatility is a key channel through which shocks may be transmitted to the stock market.
The interest rate distribution is comparatively more symmetric and bell shaped, although it still displays slight right skewness. Most observations lie between 6% and 9%, with a limited number of higher outliers above 10%. The mean is close to the median, indicating a distribution closer to normal than that of the exchange rate. The density curve fits the histogram relatively well, reflecting the South African Reserve Bank’s generally gradual and conservative approach to monetary policy adjustments. Nevertheless, despite the lower degree of dispersion, interest rate changes can have nonlinear effects on asset valuations through discount rates, borrowing costs, and risk premia, thereby warranting their inclusion in volatility modelling.
Overall, the evidence from Figure 4 indicates that all three variables deviate from normality, with exchange rate volatility displaying the strongest asymmetry and fat-tailed behaviour. These distributional characteristics support the use of GARCH models capable of capturing volatility clustering, leptokurtosis, and nonlinear dynamics. In particular, the pronounced asymmetry and dispersion in the exchange rate series suggest that it is likely a major source of volatility spillovers to the South African stock market.
Table 1 reports the results of Augmented Dickey–Fuller (ADF) and Phillips–Perron (PP) unit root tests. The reported entries correspond to MacKinnon p-values under specifications with and without an intercept. The results indicate that the level series for the stock market index (ALSPI) and the exchange rate (EXR) are non-stationary, as the null hypothesis of a unit root cannot be rejected at conventional significance levels. The interest rate (IR) series shows mixed evidence in levels but becomes clearly stationary after transformation. Importantly, all variables become strongly stationary after first differencing, as indicated by p-values close to zero for D(ALSPI), D(EXR), and D(IR). These findings confirm that the financial variables follow the typical behaviour of asset price series, where levels exhibit stochastic trends while returns or changes are stationary. Accordingly, the subsequent volatility models are estimated using stationary transformations of the variables, specifically, log returns for the ALSPI and exchange rate and first differences for the interest rate.

Table 1.
Unit root test results.
In addition, the histogram plots of monthly returns presented in Figure 4 show clear departures from normality. These distributional features justify the use of non-normal error distributions, such as the skewed Student-t (sstd) and multivariate Student-t (mvt), in the empirical analysis.
4.2. Benchmark Asymmetric Volatility Results (EGARCH, GJR-GARCH, and ADCC-GARCH)
The EGARCH and GJR-GARCH models are estimated using the logarithmic transformation of the All Share Price Index (ALSPI). Modelling the log-transformed index allows proportional movements in the stock market to be captured while stabilising the variance of the series. The conditional mean equation therefore describes the dynamics of the log index, while the conditional variance equation captures the evolution of volatility in the associated innovations. Consequently, the persistence and asymmetry results reported in the EGARCH and GJR-GARCH specifications should be interpreted as characteristics of the conditional volatility process, rather than the level of the stock market index itself.
Table 2 reports the estimated results of the EGARCH model for stock returns. The autoregressive parameter in the mean equation (AR(1) = 0.9845) is positive and statistically significant, indicating that past stock returns contain information relevant for predicting current returns. This reflects short-run serial dependence in the return process, a feature commonly observed in financial time series due to gradual information diffusion and market adjustment. However, it is important to note that this parameter captures persistence in the conditional mean, rather than persistence in volatility.
Table 2.
EGARCH (stock returns).
Volatility persistence is instead determined by the parameters of the conditional variance equation. In the EGARCH specification, the coefficient on the lagged conditional variance term (β1 = 0.5361) is positive and statistically significant, indicating that shocks to volatility dissipate gradually over time. This pattern is consistent with the well-documented phenomenon of volatility clustering in financial markets, whereby periods of high volatility tend to be followed by further periods of elevated volatility (Engle, 1982). Such persistence in conditional variance reflects the sensitivity of the Johannesburg Stock Exchange (JSE) to macroeconomic uncertainty, exchange rate fluctuations, and global capital flow dynamics, which can cause volatility shocks to persist beyond the initial disturbance.
The coefficient on exchange rate volatility is positive and highly statistically significant, indicating that increased exchange rate fluctuations significantly amplify stock market volatility. This finding underscores the central role of exchange rate dynamics as a transmission channel of macroeconomic risk to equity markets in South Africa. Heightened exchange rate uncertainty increases the unpredictability of stock returns, which may discourage foreign portfolio investment and exacerbate financial market instability. In contrast, interest rate volatility exhibits a negative but statistically insignificant effect on stock return volatility, suggesting that its influence is weaker and more episodic, becoming relevant primarily during periods of extreme monetary tightening or financial stress.
Regarding asymmetry, the EGARCH estimation reports a negative and statistically significant magnitude parameter (α1 = −0.3176). While this may appear counterintuitive relative to symmetric GARCH models, such a result is theoretically admissible within Nelson’s (1991) EGARCH framework. In this specification, α1 captures the magnitude effect of shocks on volatility and may assume negative values depending on how volatility responds to past innovations. The interpretation of α1 must therefore be considered jointly with the leverage parameter. The positive and statistically significant leverage term (γ) confirms the presence of asymmetric volatility effects, whereby negative shocks (“bad news”) generate larger increases in volatility than positive shocks of equal magnitude.
This asymmetric response is consistent with the leverage hypothesis and aligns with empirical evidence from South African financial markets. Studies by Cheteni (2016) and Nyopa and Khumalo (2022) similarly find that downside shocks exert disproportionately stronger volatility effects on JSE-listed equities. Such asymmetries are particularly pronounced during periods of macroeconomic uncertainty, exchange rate misalignment, or monetary policy tightening, features that characterised several episodes within the 2003–2024 sample period. Moreover, the negative α1 may reflect short-term market overreactions to large shocks followed by partial volatility mean reversion, especially in thinly traded market segments or post-crisis recovery phases.
Overall, the EGARCH results indicate that stock market volatility in South Africa is highly persistent and predominantly driven by exchange rate volatility, with interest rate volatility playing a secondary role. The presence of significant asymmetric effects further highlights the importance of employing nonlinear volatility models when analysing emerging-market financial dynamics. These findings confirm the suitability of the EGARCH framework for capturing the persistence, asymmetry, and shock transmission mechanisms that characterise South Africa’s equity market.
Figure 5 presents the forecast diagnostics from the EGARCH (Exponential GARCH) model, illustrating how exchange rate and interest rate volatility influence stock market volatility in South Africa. The results indicate that the model successfully captures the general direction and short-term dynamics of stock price movements, as well as the presence of volatility clustering in the ALSPI.
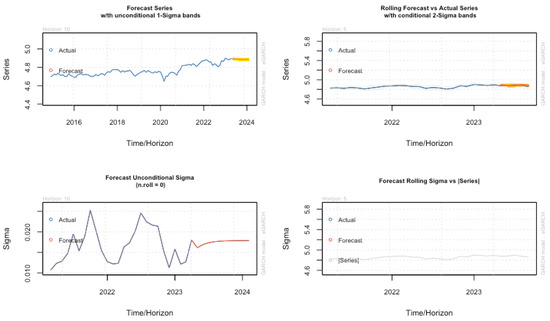
Figure 5.
Forecast diagnostics from the EGARCH.
The forecast bands narrow noticeably during the 2023–2025 period, indicating relatively low forecast uncertainty and suggesting stable expected stock market volatility. This stability implies the absence of major contemporaneous shocks during the latter part of the sample. While conditional volatility remains relatively stable throughout the period, spikes in unconditional volatility are observed earlier in the sample, likely reflecting macroeconomic and geopolitical disturbances such as global inflationary pressures and South Africa’s domestic energy crisis.
Overall, the EGARCH model performs well in capturing asymmetric volatility responses and leverage effects, consistent with the model’s ability to distinguish between the impacts of positive and negative shocks. Volatility is observed to decline toward 2024, aligning with earlier evidence from the histogram and correlation analyses. This downward trend suggests that improved policy coordination and reduced global uncertainty may be contributing to a more stable equity market environment.
These findings reinforce the study’s broader empirical results, which show that exchange rate and interest rate volatility exerted more pronounced effects on stock market volatility during periods of heightened uncertainty, but these effects appear to be moderating over time.
Figure 6 presents the diagnostic and forecast evaluation results of the fitted EGARCH model. Overall, the diagnostics indicate a strong model fit. Most return observations lie within the Value-at-Risk (VaR) bounds and the conditional standard deviation bands, suggesting that the model effectively captures volatility clustering and the conditional distribution of returns.
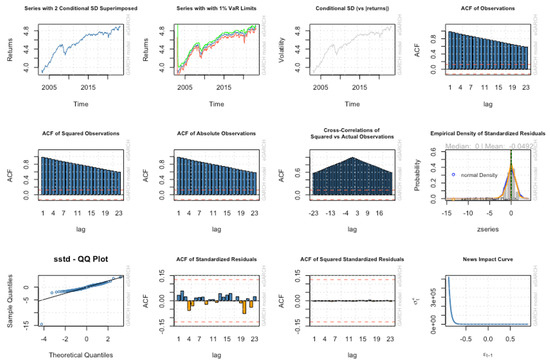
Figure 6.
Forecast diagnostic and forecast evaluation results of the fitted EGARCH.
The standardised residuals exhibit no evidence of autocorrelation, confirming that the mean and variance equations are appropriately specified. In addition, the absence of remaining ARCH effects indicates that the EGARCH model successfully absorbs time-varying volatility, rendering further volatility dynamics unnecessary. These results collectively confirm the adequacy of the GARCH-type specification.
Finally, the diagnostics reinforce the presence of asymmetric or leverage effects, with negative shocks exerting a stronger impact on volatility than positive shocks of equal magnitude. This finding is consistent with the leverage hypothesis and further validates the use of the EGARCH framework for modelling stock market volatility in South Africa.
Findings from an additional asymmetric volatility model—the GJR-GARCH—are reported in Table 3 as a robustness check. The autoregressive parameter in the mean equation indicates the presence of short-run serial dependence in stock returns, suggesting that past return realisations contain some predictive information about current returns. However, persistence in volatility is determined by the parameters of the conditional variance equation. In the GJR-GARCH specification, these variance parameters confirm the presence of volatility clustering, indicating that periods of high volatility tend to be followed by further periods of elevated volatility in the South African equity market.
Table 3.
GJR GARCH model (stock returns).
Such persistence is characteristic of emerging markets like South Africa, where macroeconomic shocks—including exchange rate volatility, interest rate adjustments, and episodes of global risk aversion—tend to have prolonged effects on investor behaviour and asset pricing. Although the Johannesburg Stock Exchange (JSE) is globally integrated, it remains susceptible to delayed information diffusion and volatility clustering due to domestic structural constraints and exposure to external shocks. Similar levels of volatility persistence have been documented in prior South African studies employing GARCH-type models (e.g., Auret & Cline, 2011; Mensi et al., 2022), which attribute these dynamics to structural inefficiencies, concentrated investor participation, and the dominance of international capital flows.
The volatility parameters reported in Table 3 further illuminate the nature of volatility transmission in South Africa’s equity market. The coefficient on lagged conditional variance (β1 = 0.0275), while statistically significant, is relatively small, indicating that past volatility plays a limited direct role in shaping current volatility. Instead, volatility dynamics appear to be driven primarily by recent shocks, particularly adverse ones, as captured by the asymmetric structure of the GJR-GARCH model. The estimated α1 coefficient is negative (–0.0045), which departs from the expectations of symmetric GARCH models but does not indicate model misspecification. Rather, it suggests that symmetric innovations alone are insufficient to explain volatility behaviour in the South African market.
This result is consistent with an environment in which negative shocks—such as energy supply disruptions, political instability, or sovereign credit downgrades—generate disproportionately large volatility responses relative to positive developments. As argued by Zeng et al. (2025), in such settings, downside risk dominates volatility dynamics, making asymmetric specifications particularly suitable. The negative α1 coefficient, combined with the model’s asymmetric term, ensures a positive conditional variance and confirms that volatility clustering is driven largely by “bad news,” in line with the leverage effect hypothesis. Overall, the GJR-GARCH results corroborate the EGARCH findings and validate the use of asymmetric volatility models in capturing the persistence and nonlinear response of South Africa’s equity market to macro-financial shocks.
Figure 7 and Figure 8 present the estimated results from the Asymmetric Dynamic Conditional Correlation (ADCC) model. Unlike the static correlations presented earlier, the ADCC correlations measure the co-movement of standardised residuals and therefore reflect the relationship between unexpected shocks in the markets rather than long-run trends in the level series.
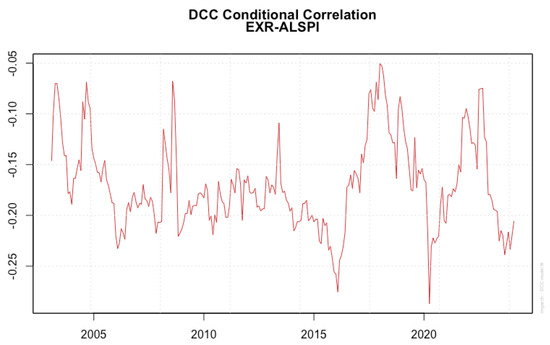
Figure 7.
Asymmetric conditional correlation between exchange rate volatility and stock returns volatility.
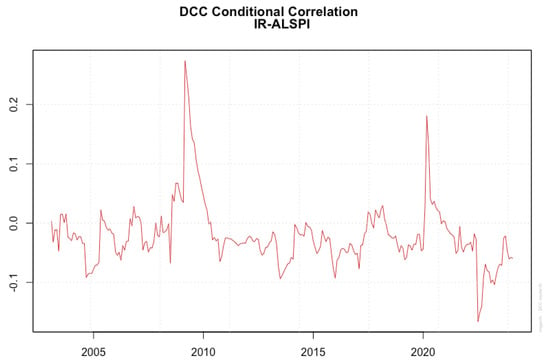
Figure 8.
Asymmetric conditional correlation between interest rate volatility and stock returns volatility.
The findings reveal a consistently negative and statistically meaningful relationship between exchange rate volatility and stock market volatility in South Africa. Across the full sample period, the dynamic conditional correlation remains negative, generally ranging between −0.25 and −0.05. This pattern indicates a systematic inverse relationship between the exchange rate and the stock market index: periods of rand depreciation are associated with increased equity market volatility and declining stock prices, while rand appreciation tends to coincide with more stable and rising equity prices.
Importantly, the conditional correlation varies substantially over time, confirming that the exchange rate–stock market relationship is not constant but dependent on prevailing macro-financial conditions. Episodes of stronger negative correlation (values closer to −0.25) suggest heightened co-movement and intensified spillover effects, whereas periods of weaker correlation (values closer to −0.05) indicate temporary decoupling, often associated with favourable global liquidity conditions or commodity price booms. Between 2015 and 2023, the correlation becomes notably more volatile and exhibits greater amplitude, reflecting increased global financial integration and heightened domestic uncertainty. This period coincides with major disruptive events such as the 2015 political crisis (“Nenegate”), the COVID-19 pandemic, and post-2020 energy and fiscal challenges, all of which likely amplified investor sensitivity to exchange rate movements.
The strong, negative, and time-varying correlation between exchange rate volatility and stock market volatility provides robust support for the study’s core hypothesis that exchange rate volatility is a primary driver of equity market instability in South Africa. These findings further justify the use of multivariate and time-varying volatility models, such as the ADCC-GARCH framework, to adequately capture the evolving nature of cross-market linkages.
Figure 8 illustrates the dynamic conditional correlation between interest rate volatility and stock market volatility. In contrast to the exchange rate results, this relationship is weaker, nonlinear, and highly episodic. Interest rate volatility appears to influence stock market volatility primarily during periods of extreme macroeconomic stress or aggressive monetary policy shifts, rather than exerting a persistent effect. This reinforces the notion that interest rate impacts on equity volatility are conditional on broader macro-financial environments, further supporting the suitability of time-varying correlation models for analysing these complex interactions.
4.3. GARCH-MIDAS (Marginals) + DCC
The GARCH-MIDAS specification allows for a decomposition of conditional volatility into short-run transitory and long-run persistent components, even in the absence of exogenous macroeconomic variables. GARCH-MIDAS decomposes volatility into two distinct components: namely long-run (low-frequency) volatility, which the captures structural as well as macro-financial forces, and short-run (high-frequency) volatility, which captures the reactions to shocks and innovations and is mean reverting. Within the monthly data framework, the long-run MIDAS component captures slow-moving structural volatility conditions, while the short-run GARCH component reflects transitory market responses to shocks. The standardised residuals obtained from the GARCH–MIDAS marginal models are subsequently used to estimate the dynamic correlation structure across stock, exchange rate, and interest rate markets.
Table 4 reports the main estimates from the two-stage GARCH-MIDAS–DCC framework for South Africa’s equity (ALSPI), exchange rate (rand), and interest rate change series. The table is organised into three panels: (A) DCC dependence dynamics, (B) univariate volatility persistence in the standardised residuals used in the DCC step, and (C) overall model fit. Collectively, these results indicate that cross-market correlations are highly persistent and structurally driven, while market-specific volatility is most persistent in FX and interest rates, consistent with South Africa’s exposure to global risk cycles and portfolio flow sensitivity.
Table 4.
GARCH-MIDAS–DCC main results.
Panel A shows that the estimated DCC parameters are = 0.0127 (p = 0.262) and = 0.8053 (p < 0.001), with = 0.8180 < 1. Two implications follow directly. First, the short-run correlation shock effect captured by is economically small and statistically insignificant, suggesting that innovations in one market do not trigger abrupt, short-lived jumps in conditional correlations in a systematic way at the monthly frequency. Instead, correlation responses appear to be absorbed gradually rather than through sharp “contagion-style” bursts.
Second, the correlation persistence parameter is large and highly significant, indicating that once correlations change, they tend to remain elevated (or depressed) for a sustained period. This persistence is consistent with South Africa’s financial market co-movement being shaped by slow-moving common drivers—notably global risk appetite, external funding conditions, and investor sentiment—rather than only by idiosyncratic domestic shocks. Recent South Africa-focused evidence supports this position. For instance, Mloyi and Vengesai (2024), using DCC-type approaches, argue that correlations across domestic assets and markets respond meaningfully to global risk aversion and broader macro-financial conditions, implying that dependence dynamics are time varying but highly persistent. Importantly, the stability condition being satisfied confirms that the conditional correlation process is mean reverting and does not exhibit explosive behaviour, an essential diagnostic for interpreting the dynamic correlation plots as structural dependence rather than estimation artefacts. The implication for South Africa is that the co-movement between the ALSPI, the rand, and interest rate changes is better understood as persistent integration through common risk pricing (especially via portfolio flows and global shocks) than as purely transitory correlation spikes. This aligns with SARB-related evidence showing that portfolio flows are systematically related to movements in key asset prices such as exchange rates and yields, reinforcing the idea that financial linkages in South Africa operate through sustained cross-market channels rather than one-off reactions (Mamburu & Sotwili, 2024).
Panel B reports the univariate GARCH dynamics estimated on the standardised residuals that enter the DCC stage. While these residuals have already been filtered through the GARCH-MIDAS marginals, the estimates still show very high volatility persistence, particularly for FX and interest rate changes. For stock (ALSPI), α = 0.0217 and β = 0.9597 (high persistence); for exchange rate, α = 0 and β = 0.9990, (very high persistence); and for interest rate change: α ≈ 0 and β = 0.9979 (very high persistence). These parameters imply that volatility in foreign exchange market and rates is dominated by persistent dynamics, where shocks decay slowly over time. In the South African context, this is economically plausible for two reasons.
First, the rand is a well-known shock absorber for external risk-off episodes, commodity price shifts, and global liquidity conditions. The persistence close to unity is consistent with the idea that FX volatility episodes (e.g., during global stress) often have lingering effects, with uncertainty dissipating gradually rather than instantaneously. This is consistent with Eniayewu et al. (2024) showing substantial and persistent FX volatility dynamics and with recent GARCH-MIDAS evidence that long-run persistence is an important feature of exchange rate volatility for South Africa and similar emerging markets.
Second, the high persistence for interest rate changes reflects the fact that monetary policy and the rates environment adjust through cycles, i.e., tightening and easing phases, rather than through purely random month-to-month fluctuations. Even when policy shocks occur, their impact on market uncertainty can persist due to inflation dynamics, expectations, and risk premia. In practice, rate volatility tends to be less “spiky” than FX volatility but can remain elevated through tightening cycles and periods of macro uncertainty, consistent with South Africa’s post-pandemic normalisation and inflation-fighting phase.
For equities, persistence is also high (β = 0.9597), which is typical in financial return series and consistent with volatility clustering around major stress episodes. Importantly, the fact that persistence remains high even after MIDAS filtering reinforces the empirical message that South Africa’s volatility environment—especially for FX and rates—contains strong inertial components and that modelling frameworks that ignore persistence risk conflating volatility dynamics with dependence dynamics.
Panel C reports the log-likelihood (−1086.20) and information criteria (AIC = 8.697; BIC = 8.893). While these are not interpreted in isolation, they serve two roles. First, they indicate that the model converged to a stable optimum and provide a coherent statistical description of the data. Second, they provide a quantitative basis for comparing alternative specifications in robustness checks (e.g., changing the MIDAS window or benchmarking against a conventional EGARCH–DCC). This is consistent with Moodley et al. (2025).
Table 4 supports a clear empirical conclusion that South Africa’s cross-market correlations are persistent and structurally driven, while volatility—particularly for FX and rates—exhibits extremely high persistence consistent with the country’s exposure to global financial conditions and portfolio flow dynamics. This aligns with recent empirical work documenting that South African asset co-movement responds to broad risk conditions and sentiment and with evidence that portfolio flows are tightly linked to exchange rates and yields (Moodley et al., 2025). The combination of a stable as well as mean-reverting DCC process and strong univariate persistence suggests that the volatility nexus in South Africa is better characterised as persistent interdependence through shared risk pricing—rather than short-lived contagion—especially at the monthly frequency.
- Volatility decomposition and market-specific risk dynamics
Figure 9, Figure 10 and Figure 11 present the GARCH-MIDAS marginal volatility decompositions for equity returns (ALSPI), exchange rate returns (rand), and changes in the interest rate, respectively. Across all three markets, the long-run volatility component remains stable over time, while short-run volatility captures pronounced crisis-driven fluctuations. This pattern indicates that volatility dynamics in South Africa are predominantly shock driven rather than regime driven, particularly at the monthly frequency.
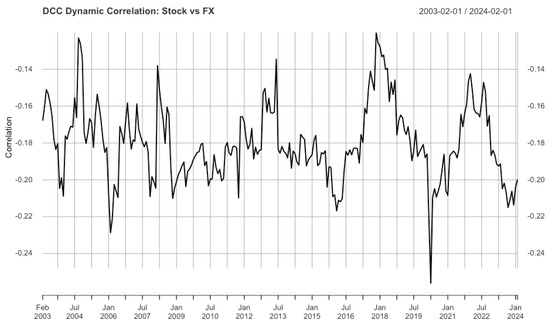
Figure 9.
Stock market (ALSPI)—GARCH-MIDAS marginal.
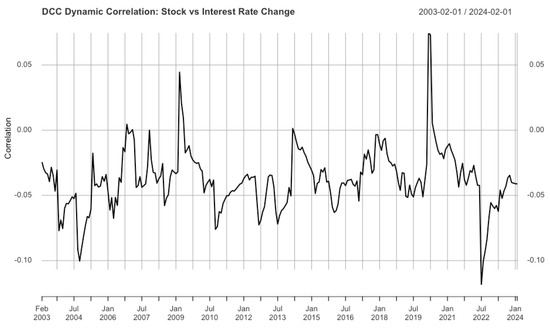
Figure 10.
Exchange rate (rand)—GARCH-MIDAS marginal.
Figure 11.
Interest rate changes—GARCH-MIDAS marginal.
Figure 9 shows that equity market volatility is characterised by sharp but temporary spikes during periods of global financial stress—most notably the Global Financial Crisis (2008–2009) and the COVID-19 shock (2020)—followed by rapid mean reversion. This suggests that South Africa’s equity market is highly sensitive to global risk sentiment and portfolio reallocations but that these shocks do not induce permanent changes in the underlying volatility regime.
Figure 10 reveals a markedly different pattern for the exchange rate. While long-run volatility remains stable, short-run volatility exhibits much larger and more persistent spikes than in the equity market, confirming the role of the rand as the primary absorber of external shocks. This finding is consistent with extensive empirical evidence documenting the vulnerability of the South African rand to global risk-off episodes, commodity price fluctuations, and shifts in international liquidity conditions.
In contrast, Figure 11 indicates that interest rate volatility is comparatively subdued and episodic. Volatility spikes are observed around major global stress events, but overall fluctuations remain contained, reflecting the stabilising influence of South Africa’s inflation-targeting monetary policy framework and the gradual adjustment of policy rates. Figure 9, Figure 10 and Figure 11 reveal a clear hierarchy of volatility dynamics, with the exchange rate exhibiting the highest shock sensitivity, followed by equities, while interest rates remain relatively insulated.
Figure 12, Figure 13 and Figure 14 present the estimated GARCH-MIDAS marginal volatility decompositions for South Africa’s equity market (ALSPI), exchange rate (rand), and interest rate changes, respectively. These figures complement the dependence results reported in Table 4 by illustrating how long-run and short-run volatility dynamics differ across markets, thereby providing economic intuition for the persistence and structure of the dynamic correlations identified by the DCC model.
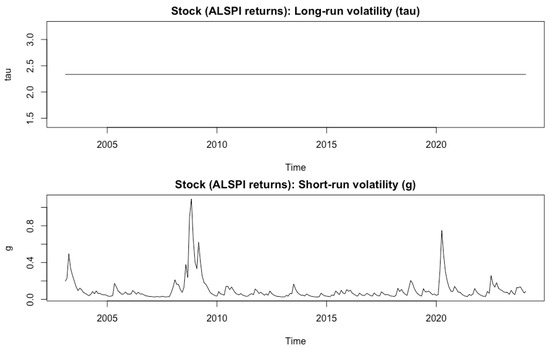
Figure 12.
Stock market (ALSPI) volatility dynamics.
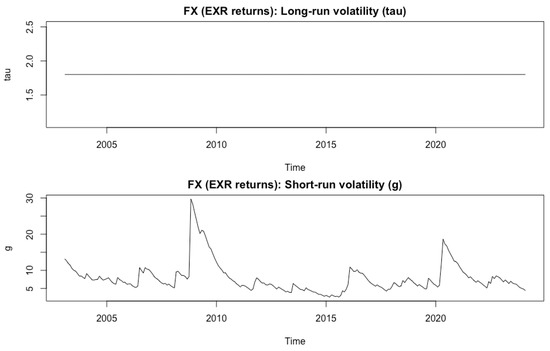
Figure 13.
Exchange rate (rand) volatility dynamics.
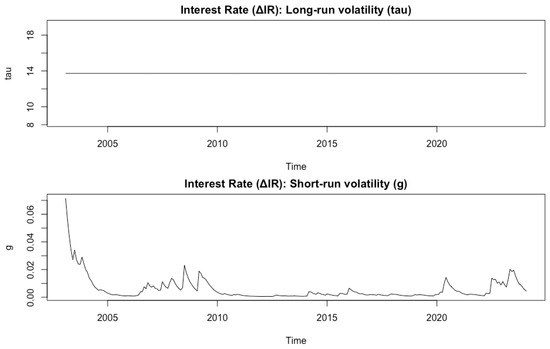
Figure 14.
Interest rate change volatility dynamics.
Figure 12 shows that the long-run volatility component of ALSPI returns remains largely stable over the sample period, while the short-run volatility component exhibits pronounced spikes during periods of heightened financial stress. Notably, sharp increases in short-run volatility are observed during the Global Financial Crisis (2008–2009) and the COVID-19 shock (2020), followed by relatively rapid mean reversion.
This pattern suggests that equity market volatility in South Africa is primarily shock driven rather than regime driven. The stability of the long-run component indicates that the structural risk profile of the stock market—shaped by institutional factors, market depth, and long-term growth expectations—has not undergone persistent shifts over the period under study. Instead, volatility clustering arises from transitory global and domestic shocks that temporarily disrupt investor sentiment and portfolio allocations.
This evidence aligns closely with the univariate persistence results reported in Table 4 (Panel B), where equity volatility displays high persistence but lower than that observed for the exchange rate. It also provides a structural explanation for the persistent yet smooth stock–FX correlations documented in the DCC results: equity volatility spikes amplify co-movement during crises, but the absence of long-run volatility regime shifts limits the permanence of such effects.
Figure 13 reveals a markedly different volatility structure for the exchange rate. While the long-run volatility component remains stable, the short-run component displays substantially larger and more persistent spikes than those observed in the equity market. The most pronounced surge occurs during the Global Financial Crisis, with additional spikes around periods of emerging-market stress and the COVID-19 episode.
These dynamics underscore the central role of the rand as the primary absorber and transmitter of external shocks in the South African economy. Given South Africa’s openness to global capital flows and its dependence on foreign portfolio investment, the exchange rate responds sharply to changes in global risk appetite, commodity prices, and international liquidity conditions. The persistence of FX volatility shocks reflects the gradual adjustment of risk premia and investor confidence following major stress events.
The volatility profile in Figure 13 provides direct support for the results in Table 4 where the exchange rate exhibits very high volatility persistence and plays a dominant role in shaping cross-market dependence. In particular, the strong and persistent stock–FX correlations identified by the DCC model are economically consistent with an environment in which FX volatility dominates the transmission of global shocks to domestic financial markets.
Figure 14 presents the volatility decomposition for interest rate changes and highlights a contrasting pattern relative to equities and FX. Although the long-run volatility component remains stable, the short-run volatility component is generally subdued, with only episodic increases around major stress periods and at the beginning of the sample.
This behaviour reflects the institutional and policy-driven nature of interest rate dynamics in South Africa. Under the inflation-targeting framework, the South African Reserve Bank adjusts policy rates gradually and predictably, limiting excessive volatility in interest rate changes even during periods of heightened uncertainty. While global shocks such as the Global Financial Crisis and COVID-19 necessitated sharp policy responses, these episodes did not lead to sustained volatility regimes in interest rates.
The relatively muted volatility dynamics in Figure 14 help explain why interest rate-based correlations in the DCC framework are weaker and less stable than stock–FX correlations. As shown in Table 4, interest rate volatility is highly persistent but low in magnitude, suggesting that rate movements influence other markets primarily through indirect channels—most notably via the exchange rate—rather than through direct and immediate co-movement with equities.
Figure 12, Figure 13 and Figure 14 reveal a clear hierarchy of volatility dynamics in South Africa’s financial markets. Exchange rate volatility is the most pronounced and persistent, equity volatility is highly responsive but more transitory, and interest rate volatility remains comparatively contained and policy driven. This hierarchy provides a coherent structural foundation for the DCC results reported in Table 4 where cross-market correlations are found to be persistent and structurally driven rather than dominated by short-run correlation shocks. In particular, the dominance of FX volatility helps explain why dynamic correlations involving the exchange rate are stronger and more persistent while correlations involving interest rates are weaker and more episodic. The volatility decompositions thus reinforce the central conclusion of the paper: South Africa’s volatility nexus is characterised by shock-driven short-run dynamics operating within stable long-run volatility regimes, with the exchange rate serving as the primary transmission channel linking global financial conditions to domestic markets.
4.4. Robustness Checks and Alternative Specifications
Table 5 reports a comprehensive set of robustness checks designed to assess whether the main dependence results documented in Table 4 are sensitive to alternative model specifications, volatility aggregation horizons, or crisis subsamples. The robustness analysis is organised into two panels. Panel A compares dependence dynamics across alternative volatility–correlation frameworks, while Panel B examines subsample stability before and after the COVID-19 shock. Overall, the results strongly confirm that the key findings of the paper—namely, highly persistent and structurally driven cross-market correlations in South Africa—are robust to these alternative settings
Table 5.
Robustness checks: alternative specifications.
4.4.1. Panel A: Robustness to Alternative Volatility–Correlation Specifications
Panel A compares the baseline GARCH-MIDAS–DCC model with a 12-month MIDAS window (K = 12) against two alternative specifications: (i) a longer-horizon MIDAS–DCC model with K = 24 and (ii) a conventional EGARCH–DCC model.
- MIDAS–DCC (K = 12 vs. K = 24)
The results show that extending the MIDAS window from 12 to 24 months leaves the estimated dependence structure largely unchanged. Both αDCC and βDCC remain close in magnitude and statistical significance to the baseline estimates reported in Table 4, with overall correlation persistence remaining high. Importantly, the qualitative pattern of dynamic correlations is preserved, indicating that the core findings are not driven by the choice of a particular long-run volatility horizon.
From an economic perspective, this result suggests that the long-run volatility component in South Africa’s financial markets evolves slowly and is not overly sensitive to whether it is defined over one-year or two-year horizons. This is consistent with the empirical evidence presented in Figure 9, Figure 10 and Figure 11, where long-run volatility components are shown to be stable across markets. It also reinforces the interpretation that the dominant drivers of time-varying dependence are structural and persistent rather than artefacts of a specific MIDAS lag selection.
- Comparison with EGARCH–DCC
In contrast, the EGARCH–DCC specification produces a markedly different dependence profile. While EGARCH–DCC captures time variation in correlations, it yields higher short-run correlation shocks (αDCC), lower persistence (βDCC), and a noisier correlation path overall. This indicates that without explicitly separating long-run and short-run volatility components, the model tends to attribute fluctuations in volatility directly to changes in dependence.
This comparison highlights an important methodological implication. In the South African context—where volatility, particularly in FX and interest rate markets, is highly persistent—the EGARCH–DCC framework risks overstating short-run contagion effects and understating the role of slow-moving structural dependence. By contrast, the GARCH-MIDAS–DCC approach used in this study filters out long-run volatility first, resulting in smoother and more economically interpretable correlation dynamics. This finding aligns with recent empirical work arguing that single-component GARCH-based multivariate models may conflate volatility persistence with correlation persistence, especially in emerging-market settings characterised by prolonged uncertainty and gradual adjustment.
4.4.2. Panel B: Subsample Robustness: Pre- and Post-COVID-19 Dynamics
Panel B of Table 5 examines whether the estimated dependence structure is stable across major crisis regimes by splitting the sample into pre-COVID (2003–2019) and post-COVID (2020–2025) subsamples.
- Pre-COVID period (2003–2019)
During the pre-COVID period, the DCC parameters mirror the baseline results in Table 4: the short-run correlation shock parameter remains small, while the persistence parameter remains high, satisfying the stability condition. This indicates that the dependence structure across South Africa’s equity, FX, and interest rate markets during normal and moderately stressed times is structural and persistent, shaped by long-standing features such as global integration, portfolio flows, and risk pricing mechanisms. This finding is consistent with the volatility decompositions in Figure 9, Figure 10 and Figure 11, which show that most fluctuations during this period are captured by short-run volatility spikes rather than shifts in long-run regimes.
- Post-COVID period (2020–2025)
In the post-COVID subsample, increases slightly, while remains high and statistically significant. This pattern suggests temporary amplification of correlation shocks during crisis conditions but without a breakdown of the overall stability of the dependence process. In other words, the COVID-19 shock intensified co-movements across markets but did not fundamentally alter the underlying correlation structure.
This result is particularly relevant for South Africa, where the COVID-19 period coincided with sharp capital outflows, exchange rate depreciation, aggressive monetary policy easing followed by tightening, and heightened global uncertainty. The robustness results indicate that these extreme conditions magnified existing linkages rather than creating entirely new dependence regimes. This supports the interpretation that South Africa’s financial market co-movements are best characterised as crisis sensitive but structurally persistent.
Summarily, the robustness checks in Table 5 strongly reinforce the main conclusions drawn from Table 4 with three notable key insights emerge. First, the persistence of DCC correlations is robust to alternative MIDAS horizons, confirming that the results are not driven by arbitrary choices in modelling long-run volatility. Second, comparisons with EGARCH–DCC demonstrate that failing to disentangle long-run and short-run volatility leads to noisier and less persistent dependence estimates, underscoring the empirical value of the GARCH-MIDAS–DCC framework in the South African context. Third, subsample analysis shows that while crises such as COVID-19 temporarily amplify correlation dynamics, the fundamental structure of cross-market dependence remains stable. Overall, Table 5 provides strong evidence that the volatility nexus identified in this study, characterised by persistent dependence, FX-dominated transmission, and conditional crisis amplification, is a robust feature of South Africa’s financial markets rather than a model-specific or period-specific artefact.
For completeness, Appendix A, Figure A1 reports the implied total conditional volatility, which closely mirrors the short-run volatility dynamics shown in Figure 12, Figure 13 and Figure 14.
4.5. Discussion of Findings
The empirical findings of this study are broadly consistent with previous research on financial market volatility in emerging economies. A large body of empirical literature shows that volatility spillovers across financial markets are particularly pronounced in emerging economies, where macroeconomic fundamentals, capital flows, and exchange rate fluctuations interact strongly with domestic asset markets (Beirne et al., 2009; Gupta & Chaudhary, 2026). Evidence from South Africa specifically documents significant linkages between exchange rate movements and stock market volatility, particularly during periods of financial turbulence and global market stress. For instance, Jaramba and Fadiran (2009) find evidence of volatility transmission between South Africa’s foreign exchange and equity markets, indicating that shocks in one market can propagate to others through financial linkages. Similarly, Sikhosana and Aye (2018) report asymmetric volatility spillovers between the real exchange rate and stock returns in South Africa, highlighting the sensitivity of equity markets to currency fluctuations.
More broadly, studies on emerging markets show that exchange rate volatility often serves as a key transmission channel through which macroeconomic shocks affect financial markets. Hajilee (2014), for example, demonstrates that exchange rate uncertainty has significant effects on stock market development across emerging economies, suggesting that currency instability can influence financial market performance and investment behaviour. Similarly, research on BRICS economies finds strong interdependencies between foreign exchange and equity markets, with volatility spillovers becoming more pronounced during crisis episodes (Nyopa & Khumalo, 2022). These findings reinforce the view that exchange rate dynamics play a central role in shaping financial market volatility in emerging economies exposed to global financial cycles.
The findings of this study are also broadly consistent with recent empirical research that employs the GARCH-MIDAS framework to analyse volatility dynamics in financial markets. Studies applying the GARCH-MIDAS approach often report that long-run volatility components capture persistent macro-financial uncertainty, while short-run volatility reflects temporary market shocks. For instance, Engle et al. (2013) show that macroeconomic conditions and long-horizon volatility components play a significant role in explaining stock market volatility dynamics. Similarly, Conrad and Loch (2015) find that macroeconomic risk factors significantly influence long-term volatility behaviour in financial markets when volatility is decomposed using GARCH-MIDAS specifications. Evidence from emerging markets also supports this pattern. Demirer et al. (2023) document that financial vulnerability indicators explain persistent volatility movements in emerging-market equities when a GARCH-MIDAS framework is employed, while Eniayewu et al. (2024) report that long-run volatility components driven by monetary conditions significantly affect exchange rate volatility in African economies. In line with these studies, the results of the present analysis indicate that persistent macro-financial uncertainty—rather than purely short-term shocks—plays an important role in shaping volatility dynamics in South Africa’s financial markets. This similarity in findings reinforces the broader empirical evidence that financial market volatility in emerging economies often reflects both structural macroeconomic conditions and short-term financial disturbances.
5. Conclusions and Policy Implication
This study set out to examine the volatility nexus linking exchange rates, interest rates, and stock market returns in South Africa using a layered econometric framework that combines benchmark asymmetric GARCH models with a GARCH-MIDAS–DCC specification. By explicitly decomposing volatility into long-run and short-run components and allowing for time-varying dependence, the analysis provides a more nuanced characterisation of macro-financial linkages in an emerging market that is deeply integrated into global capital markets yet structurally exposed to external shocks.
Three core conclusions emerge from the empirical results. First, exchange rate volatility plays a dominant and persistent role in shaping financial market dynamics in South Africa. Across all modelling approaches, volatility in the rand exhibits extremely high persistence and acts as the primary transmission channel through which global risk sentiment, portfolio flow reversals, and external shocks affect domestic equity markets. The strong and predominantly negative dynamic correlations between stock returns and exchange rate movements indicate that episodes of rand depreciation are systematically associated with heightened equity market volatility and declining investor confidence. This finding is consistent with South Africa’s reliance on foreign portfolio investment and the role of the exchange rate as a key absorber of external shocks.
Second, equity market volatility is largely shock driven and transitory rather than regime driven. The GARCH-MIDAS volatility decompositions show that while short-run volatility spikes sharply during periods of heightened stress, most notably during the Global Financial Crisis and the COVID-19 pandemic, the long-run volatility component remains stable throughout the sample period. This suggests that major crises amplify uncertainty and risk premia in the short run but do not fundamentally alter the underlying structural risk profile of South Africa’s equity market. The rapid mean reversion of equity volatility following stress episodes reflects both the depth of the Johannesburg Stock Exchange and its sensitivity to global portfolio rebalancing rather than persistent domestic regime shifts.
Third, interest rate volatility exerts a more limited and episodic influence on equity market dynamics. Although volatility in interest rate changes is highly persistent, its magnitude is comparatively subdued and largely policy driven under South Africa’s inflation-targeting framework. As a result, dynamic correlations involving interest rates are weaker, less stable, and become economically meaningful mainly during periods of aggressive monetary tightening or acute macroeconomic stress. This contrasts with the exchange rate–equity relationship, which remains structurally important across different market conditions and crisis regimes.
Importantly, the Dynamic Conditional Correlation results indicate that cross-market dependence in South Africa is persistent and structurally driven rather than dominated by short-lived contagion effects. The estimated DCC parameters suggest that changes in dependence evolve gradually and remain elevated once established, reflecting the influence of slow-moving common factors such as global risk appetite, capital flow dynamics, and investor sentiment. Robustness checks across alternative MIDAS aggregation horizons, conventional EGARCH-DCC specifications, and pre- and post-COVID subsamples confirm that these findings are not sensitive to modelling choices or specific crisis periods. Benchmark EGARCH, GJR-GARCH, and ADCC-GARCH results further corroborate the MIDAS-based evidence, demonstrating that the dominance of exchange rate-driven volatility transmission is robust across both single- and multi-component volatility frameworks.
Policy Implications
From a policy perspective, the results underscore the central importance of exchange rate dynamics for financial stability in South Africa. Given the dominant role of the rand in transmitting external shocks to domestic asset markets, macroeconomic policies that enhance exchange rate credibility and reduce uncertainty can play a crucial role in mitigating volatility spillovers to the equity market. Clear and consistent communication by the South African Reserve Bank, particularly during periods of monetary tightening or global risk repricing can help anchor investor expectations and dampen excessive short-run volatility responses.
The findings also suggest that monetary policy affects equity market volatility primarily through indirect channels, notably via its impact on the exchange rate and broader risk sentiment, rather than through direct interest rate volatility alone. This highlights the importance of a coordinated macro-financial policy framework in which monetary, fiscal, and macroprudential policies are aligned to manage capital flow volatility and external vulnerability. Strengthening domestic financial buffers, deepening local currency financial markets, and encouraging broader investor diversification may further reduce the amplification of global shocks through the exchange rate channel.
The interaction between exchange rate volatility, interest rate adjustments, and equity market dynamics observed in this study can also be interpreted within the framework of the Mundell–Fleming trilemma, often referred to as the Impossible Trinity. The trilemma posits that an open economy cannot simultaneously maintain exchange rate stability, full capital mobility, and independent monetary policy. In the South African context, where capital markets are relatively open and the exchange rate is largely market determined, the South African Reserve Bank must rely primarily on interest rate policy to maintain macroeconomic stability. The volatility nexus identified in this study therefore reflects the inherent trade-offs embedded in the trilemma: policy adjustments aimed at stabilising inflation and capital flows may transmit volatility across financial markets, particularly through the exchange rate channel. Recognising these structural constraints is essential for designing policy frameworks that balance monetary credibility, financial stability, and external competitiveness.
Overall, the evidence indicates that South Africa’s volatility nexus is characterised by persistent cross-market interdependence operating primarily through the exchange rate, rather than by transitory correlation shocks or interest rate-driven contagion. Recognising and managing this structure is essential for enhancing financial market resilience in an open emerging economy exposed to volatile global capital flows. Future research could extend this framework by incorporating commodity price dynamics, regime-switching behaviour, or cross-country comparisons within Sub-Saharan Africa to further illuminate the mechanisms of volatility transmission in structurally similar economies.
Author Contributions
Conceptualisation, K.A.S. and Z.D.-K.; methodology, K.A.S.; software, K.A.S.; validation, K.A.S. and Z.D.-K.; formal analysis, K.A.S.; investigation, K.A.S.; resources, K.A.S. and Z.D.-K.; data curation, K.A.S.; writing—original draft preparation, K.A.S.; writing—review and editing, K.A.S. and Z.D.-K.; visualisation, K.A.S. and Z.D.-K.; supervision, Z.D.-K.; project administration, K.A.S.; funding acquisition, Z.D.-K. All authors have read and agreed to the published version of the manuscript.
Funding
This research received no external funding.
Institutional Review Board Statement
Not applicable.
Informed Consent Statement
Not applicable.
Data Availability Statement
Monthly data on interest rates and exchange rates covering the period from January 2003 to February 2025 were obtained from the South African Reserve Bank (SARB).
Acknowledgments
We acknowledge the anonymous reviewers for their constructive contributions to the manuscript.
Conflicts of Interest
The authors declare no conflicts of interest.
Appendix A
The full parameter estimates of the GARCH–MIDAS marginal models, including the MIDAS weighting parameters and associated standard errors, are reported in Appendix A, Table A1, to facilitate transparency and replication of the estimation procedure.
Table A1.
GARCH-MIDAS marginal estimation results.
Table A1.
GARCH-MIDAS marginal estimation results.
| Panel A: Stock Market Returns (ALSPI) | |||||
| Parameter | Estimate | Robust Std. Error | Robust p-Value | OPG Std. Error | OPG p-Value |
| μ | 0.0604 | 0.0301 | 0.0446 | 0.0321 | 0.0603 |
| α | 0.0569 | 0.1879 | 0.7619 | 0.0405 | 0.1601 |
| β | 0.7163 | 0.2876 | 0.0127 | 0.0555 | 0.0000 |
| γ | 0.4488 | 0.1978 | 0.0233 | 0.0831 | 0.0000 |
| m | 1.6925 | 5.1263 | 0.7413 | 0.4915 | 0.0006 |
| θ | −2.6694 | 1.5299 | 0.0810 | 1.0413 | 0.0104 |
| w2 | 7.4431 | 7.8361 | 0.3422 | 9.0146 | 0.4090 |
| Panel B: Exchange Rate Returns (EXR) | |||||
| Parameter | Estimate | Robust Std. Error | Robust p-Value | OPG Std. Error | OPG p-Value |
| μ | 0.5143 | 0.2972 | 0.0835 | 0.9279 | 0.5794 |
| α | 0.1981 | 0.0725 | 0.0063 | 0.0991 | 0.0455 |
| β | 0.8919 | 0.0320 | 0.0000 | 0.0423 | 0.0000 |
| γ | −0.1801 | 0.0992 | 0.0695 | 0.1129 | 0.1106 |
| m | 0.6340 | 0.9273 | 0.4942 | 0.6225 | 0.3085 |
| θ | −0.0446 | 0.0149 | 0.0029 | 0.0155 | 0.0040 |
| w2 | 1.0000 | 1.8805 | 0.5949 | 0.8762 | 0.2537 |
| Panel C: Interest Rate Changes (ΔIR) | |||||
| Parameter | Estimate | Robust Std. Error | Robust p-Value | OPG Std. Error | OPG p-Value |
| μ | −0.0025 | 0.0125 | 0.8389 | 0.0510 | 0.9603 |
| α | 0.3319 | 0.0966 | 0.0006 | 0.1347 | 0.0137 |
| β | 0.7794 | 0.0832 | 0.0000 | 0.0920 | 0.0000 |
| γ | −0.2293 | 0.0686 | 0.0008 | 0.1365 | 0.0928 |
| m | −0.6693 | 0.8694 | 0.4414 | 1.5319 | 0.6622 |
| θ | −5.5730 | 3.6957 | 0.1316 | 4.7513 | 0.2408 |
| w2 | 3.4340 | 2.2474 | 0.1265 | 5.9028 | 0.5600 |
Notes: μ represents the conditional mean of the return series. α and β denote the short-run GARCH(1,1) parameters governing the high-frequency volatility component gtg_tgt. γ captures asymmetric (leverage) effects in volatility. The parameters m, θ, and w2 characterise the MIDAS long-run volatility component τt. Specifically, θ measures the sensitivity of long-run volatility to the low-frequency volatility proxy, while w2 determines the shape of the MIDAS Beta weighting function applied to lagged volatility observations.


Figure A1.
Total conditional volatility plots.
Figure A1.
Total conditional volatility plots.


References
- Al-Rjoub, S. A., & Al-Azzam, H. Q. (2019). Time varying volatility and asymmetric news effect during financial crises evidence from DJIA, S&P 500, NASDAQ and FTSE 100 indices. International Journal of Banking, Accounting and Finance, 10(2), 117–143. [Google Scholar]
- Alzate-Ortega, A., Garzón, N., & Molina-Muñoz, J. (2024). Volatility spillovers in emerging markets: Oil shocks, energy, stocks, and gold. Energies, 17(2), 378. [Google Scholar] [CrossRef]
- Amewu, G., Akosah, N. K., & Armah, M. (2024). African sovereign risk premia and international market assets: A relook under the COVID-19 outbreak. Heliyon, 10(21), e40194. [Google Scholar] [CrossRef] [PubMed]
- Auret, C., & Cline, R. (2011). Do the value, size and January effects exist on the JSE? Investment Analysts Journal, 2011(74), 29–37. [Google Scholar] [CrossRef]
- Babikir, A., Gupta, R., Mwabutwa, C., & Owusu-Sekyere, E. (2012). Structural breaks and GARCH models of stock return volatility: The case of South Africa. Economic Modelling, 29(6), 2435–2443. [Google Scholar] [CrossRef]
- Beirne, J., Caporale, G. M., Schulze-Ghattas, M., & Spagnolo, N. (2009). Volatility spillovers from mature to emerging stock markets. ECB Working Paper. European Central Bank. [Google Scholar]
- Bonga-Bonga, L. (2013). Transmission of volatility shocks between the equity and foreign exchange markets in South Africa. Journal of Applied Business Research, 29(5), 1529–1542. [Google Scholar]
- Bonga-Bonga, L., & Mpoha, S. (2025). Assessing the extent of exchange rate risk pricing in equity markets: Emerging versus developed economies. African Journal of Economic and Management Studies, 16(1), 148–159. [Google Scholar]
- Branson, W. H. (1983). A model of exchange-rate determination with policy reaction: Evidence from monthly data. Journal of International Economics. Available online: https://www.nber.org/system/files/working_papers/w1135/w1135.pdf (accessed on 2 November 2025).
- Cappiello, L., Engle, R. F., & Sheppard, K. (2006). Asymmetric dynamics in the correlations of global equity and bond returns. Journal of Financial Econometrics, 4(4), 537–572. [Google Scholar] [CrossRef]
- Chen, N.-F., Roll, R., & Ross, S. A. (1986). Economic forces and the stock market. Journal of Business, 59(3), 383–403. [Google Scholar] [CrossRef]
- Cheteni, P. (2016). Stock market volatility using GARCH models: Evidence from South Africa and China stock markets. MPRA Paper No. 77355. Available online: https://mpra.ub.uni-muenchen.de/77355/ (accessed on 2 November 2025).
- Chinn, M. D., & Meredith, G. (2005). Testing uncovered interest parity at short and long horizons during the post-Bretton Woods era. IMF Staff Papers, 52(3), 429–444. [Google Scholar] [CrossRef]
- Conrad, C., & Loch, K. (2015). Anticipating long-term stock market volatility. Journal of Applied Econometrics, 30(7), 1090–1114. [Google Scholar] [CrossRef]
- Debalke, N. M. (2023). Examining volatility and spillover effects between markets for sovereign bonds of African countries and the world’s long-term interest rate. MPRA Paper No. 117491. Available online: https://mpra.ub.uni-muenchen.de/117491/ (accessed on 2 November 2025).
- Demirer, R., Gupta, R., Li, H., & You, Y. (2023). Financial vulnerability and volatility in emerging stock markets: Evidence from GARCH-MIDAS models. Working Papers 202112. University of Pretoria. [Google Scholar]
- Dornbusch, R., & Fischer, S. (1980). Exchange rates and the current account. American Economic Review, 70(5), 960–971. [Google Scholar]
- Dube, S. (2025). COVID-19 impact on Johannesburg stock exchange for the duration of the pandemic period. Available online: https://open.uct.ac.za/bitstreams/4a01c4f3-ee05-40ee-847c-8c614852dae5/download (accessed on 2 November 2025).
- Eita, J. H. (2012). Modelling macroeconomic determinants of stock market prices: Evidence from Namibia. Journal of Applied Business Research (JABR), 28(5), 871–884. [Google Scholar] [CrossRef]
- Engle, R. F. (1982). Autoregressive conditional heteroskedasticity with estimates of the variance of United Kingdom inflation. Econometrica, 50(4), 987–1007. [Google Scholar] [CrossRef]
- Engle, R. F. (2002). Dynamic conditional correlation: A simple class of multivariate GARCH models. Journal of Business & Economic Statistics, 20(3), 339–350. [Google Scholar]
- Engle, R. F., Ghysels, E., & Sohn, B. (2013). Stock market volatility and macroeconomic fundamentals. Review of Economics and Statistics, 95(3), 776–797. [Google Scholar] [CrossRef]
- Eniayewu, P. E., Samuel, G. T., Joshua, J. D., Samuel, B. T., Dogo, B. S., Yusuf, U., Ihekuna, R. O., & Mevweroso, C. R. (2024). Forecasting exchange rate volatility with monetary fundamentals: A GARCH-MIDAS approach. Scientific African, 23, e02101. [Google Scholar] [CrossRef]
- Everett, C. R. (2024). Private capital markets insights 2024: The return of warrants to mezzanine debt. Financial Markets, Institutions and Risks, 8(2), 10-61093. [Google Scholar] [CrossRef]
- Fowowe, B. (2015). The relationship between stock prices and exchange rates in South Africa and Nigeria: Structural breaks analysis. International Review of Applied Economics, 29(1), 1–14. [Google Scholar] [CrossRef]
- Frankel, J. A. (1993). On exchange rates. MIT Press. [Google Scholar]
- Graham, J. R., & Harvey, C. R. (2001). The theory and practice of corporate finance: Evidence from the field. Journal of Financial Economics, 60(2–3), 187–243. [Google Scholar] [CrossRef]
- Gupta, H., & Chaudhary, R. (2026). Assessing the risk-adjusted performance and volatility of sustainability-focused indices of the emerging Indian market. Global Business Review, 09721509261418879. [Google Scholar] [CrossRef]
- Hajilee, M. (2014). Exchange rate volatility and stock market development in emerging economies. Review of Keynesian Economics, 37(1), 163–180. [Google Scholar]
- Hussain, M., Bashir, U., & Rehman, R. U. (2024). Exchange rate and stock price volatility connectedness during pandemic-induced crises: Evidence from BRICS countries. Asia-Pacific Financial Markets, 31(1), 183–203. [Google Scholar] [CrossRef]
- Husted, L., Rogers, J., & Sun, B. (2020). Monetary policy uncertainty. Journal of Monetary Economics, 115, 20–36. [Google Scholar] [CrossRef]
- Jaramba, T., & Fadiran, G. (2009). Analysis of volatility transmission across South African financial markets. MPRA Working Paper. Munich Personal RePEc Archive. [Google Scholar]
- Kabundi, A., & Mlachila, M. (2019). The role of monetary policy credibility in explaining the decline in exchange rate pass-through in South Africa. Economic Modelling, 79, 173–185. [Google Scholar] [CrossRef]
- Khan, I. (2025). An analysis of stock markets integration and dynamics of volatility spillover in emerging nations. Journal of Economic and Administrative Sciences, 41(3), 861–878. [Google Scholar]
- Komba, C., Sobe, P. A., & Mwakujonga, J. (2024). Effects of interest and exchange rate volatility on stock returns: Evidence from the financial sector of Tanzania. NG Journal of Social Development, 13(1). [Google Scholar] [CrossRef]
- Kumar, M. (2013). Returns and volatility spillover between stock prices and exchange rates: Empirical evidence from IBSA countries. International Journal of Emerging Markets, 8(2), 108–128. [Google Scholar] [CrossRef]
- Lastauskas, P., & Nguyen, A. D. M. (2024). Spillover effects of US monetary policy on emerging markets amidst uncertainty. Journal of International Financial Markets, Institutions and Money, 92, 101956. [Google Scholar] [CrossRef]
- Lefatsa, P. M., Msomi, S., Muguto, H. T., Muguto, L., & Muzindutsi, P. F. (2025). An empirical analysis of the impact of global risk sentiment, gold prices, and interest rate differentials on exchange rate dynamics in South Africa. International Journal of Financial Studies, 13(3), 120. [Google Scholar] [CrossRef]
- Maingo, I., Ravele, T., & Sigauke, C. (2025). Volatility modelling of the Johannesburg stock exchange all share index using the family GARCH model. Forecasting, 7(2), 16. [Google Scholar] [CrossRef]
- Mamburu, M., & Sotwili, S. (2024). Topical briefing. Available online: https://www.resbank.co.za/content/dam/sarb/what-we-do/financial-stability/TB-03%20%20The%20impact%20of%20non-resident%20participants%20in%20SAGB%20market.pdf (accessed on 25 November 2025).
- Mapfumo, S. S. N., Adelowotan, M., & Mcgill, M. (2023). The impact of interest rates on the South African equity market. Eurasian Journal of Economics and Finance, 11(3/4), 99–120. [Google Scholar] [CrossRef]
- Marozva, G. (2020). The effects of monetary policy on stock market returns and volatility: Evidence from South Africa. Academy of Accounting and Financial Studies Journal, 24(3), 1–11. [Google Scholar]
- Maveé, N., Perrelli, M. R., & Schimmelpfennig, M. A. (2016). Surprise, surprise: What drives the rand/US dollar exchange rate volatility? International Monetary Fund. Available online: https://papers.ssrn.com/sol3/Delivery.cfm?abstractid=2882641 (accessed on 2 December 2025).
- Mensi, W., Naeem, M. A., Vo, X. V., & Kang, S. H. (2022). Dynamic and frequency spillovers between green bonds, oil and G7 stock markets: Implications for risk management. Economic Analysis and Policy, 73, 331–344. [Google Scholar] [CrossRef]
- Miranda-Agrippino, S., & Rey, H. (2020). The global financial cycle after Lehman. American Economic Review Papers & Proceedings, 110, 523–528. [Google Scholar]
- Mlambo, C., Maredza, A., & Sibanda, K. (2013). Effects of exchange rate volatility on the stock market: A case study of South Africa. Mediterranean Journal of Social Sciences, 4(14), 561–570. [Google Scholar] [CrossRef]
- Mloyi, K., & Vengesai, E. (2024). The impact of global risk aversion and domestic macroeconomic factors on the dynamic conditional correlations of South African financial markets. Cogent Economics & Finance, 12(1), 2431543. [Google Scholar] [CrossRef]
- Moodley, F., Ferreira-Schenk, S., & Matlhaku, K. (2025). Determinants of South African asset market co-movement: Evidence from investor sentiment and changing market conditions. Risks, 13(1), 14. [Google Scholar] [CrossRef]
- Muriu, P. W., & Murinde, V. (2025). Recent developments in capital markets. The Elgar Companion to Financial Economics, 323–341. [Google Scholar]
- Nelson, D. B. (1991). Conditional heteroskedasticity in asset returns: A new approach. Econometrica, 59(2), 347–370. [Google Scholar] [CrossRef]
- Nyopa, T., & Khumalo, S. A. (2022). Volatility spillovers in equity and foreign exchange markets: Evidence from emerging economies. Journal of Economic and Financial Sciences, 15(1), a713. [Google Scholar] [CrossRef]
- Oberholzer, N., & von Boetticher, S. T. (2015). Volatility spill-over between the JSE/FTSE indices and the South African rand. Procedia Economics and Finance, 24, 501–510. [Google Scholar] [CrossRef][Green Version]
- Pagliari, S., & Hannan, S. (2017). The volatility of capital flows in emerging markets. IMF Working Paper. International Monetary Fund. [Google Scholar]
- Pamba, D., Mukorera, S., & Moores-Pitt, P. (2025). The asymmetric effects of cross-border equity flow volatility on equity market returns in SANEK countries. Quantitative Finance and Economics, 9(1), 40. [Google Scholar] [CrossRef]
- Ramakau, T., Mokatsanyane, D., Matlhaku, K., & Ferreira-Schenk, S. (2025). Analyzing the South African equity market volatility and economic policy uncertainty during COVID-19. Economies, 13(10), 276. [Google Scholar] [CrossRef]
- Rey, H. (2015). Dilemma not trilemma: The global financial cycle and monetary policy independence. NBER Working Paper 21162. National Bureau of Economic Research. [Google Scholar]
- Sikhosana, A., & Aye, G. C. (2018). Asymmetric volatility transmission between the real exchange rate and stock returns in South Africa. Economic Analysis and Policy, 60, 1–8. [Google Scholar] [CrossRef]
- South African Reserve Bank. (2024). The evolution of portfolio flows in South Africa. Available online: https://www.resbank.co.za (accessed on 2 November 2025).
- Tabash, M. I., AsadUllah, M., Siddiq, Q., Mansour, M., Daniel, L. N., & Al-Absy, M. S. M. (2024). Symmetries or asymmetries: How MSCI index advanced European markets’ exchange rates respond to macro-economic fundamentals. Economies, 12(12), 326. [Google Scholar] [CrossRef]
- Wang, F., Pan, C., & Wang, W. (2023). U.S. monetary policy uncertainty and exchange rate volatility in emerging markets. Finance Research Letters, 58, 104582. [Google Scholar] [CrossRef]
- Yousfi, M., Farhani, R., & Bouzgarrou, H. (2024). From the pandemic to the Russia–Ukraine crisis: Dynamic behavior of connectedness between financial markets and implications for portfolio management. Economic Analysis and Policy, 81, 1178–1197. [Google Scholar] [CrossRef]
- Zeng, H., Liu, H., Wang, C., & Ma, S. (2025). The impact of external uncertainty factors on the time-frequency and quantile effects of China’s clean energy stock market Index. Energy Sources, Part B: Economics, Planning, and Policy, 20(1), 2591800. [Google Scholar] [CrossRef]


Disclaimer/Publisher’s Note: The statements, opinions and data contained in all publications are solely those of the individual author(s) and contributor(s) and not of MDPI and/or the editor(s). MDPI and/or the editor(s) disclaim responsibility for any injury to people or property resulting from any ideas, methods, instructions or products referred to in the content. |
© 2026 by the authors. Licensee MDPI, Basel, Switzerland. This article is an open access article distributed under the terms and conditions of the Creative Commons Attribution (CC BY) license.